

Crypto World
Here’s why bitcoin (BTC) price climbed through $71,000: Crypto Daybook Americas
By Omkar Godbole (All times ET unless indicated otherwise)
Bitcoin rose to just short of $72,000, hitting a one-month high and lifting the broader crypto market even as the war in the Middle East wreaks havoc on traditional markets.
The outperformance stems from several factors, including relative positioning, rising odds of the passage of the U.S.’s long‑debated Clarity Act aimed at legalizing stablecoins and hopes that conflict with Iran will end soon.
Bitcoin, down nearly 50% from its record high in October, was oversold before hostilities began Saturday. So as traditional assets tumbled, BTC held up well. That has likely revived investor interest in the largest cryptocurrency, drawing institutions back to the spot ETFs.
As noted on Monday, bitcoin stands to gain because the war will only worsen government finances worldwide, leading to more “fiat debasement.“
Meanwhile, the New York Times put out an interesting report that likely aided the price bounce, according to Bloomberg. The report said that the day after the attacks began, operatives from Iran’s Ministry of Intelligence contacted the CIA to discuss terms for ending the war. While the U.S. ignored the overture, the outreach suggests backchannels are still active and could be used again, potentially leading to a ceasefire.
Lastly, there’s the possibility the Clarity Act could be passed soon.
“There was speculation circulating in the U.S. that the Clarity Act was close to being signed into law. This helped lift many altcoins relative to major assets, as they are expected to be among the biggest long-term beneficiaries of the legislation,” Paul Howard, director at trading firm Wincent, said in an email.
However, he added that there is currently no strong evidence that a large pool of sidelined money is waiting to flood into digital assets, and any rotation is still relatively small or gradual.
Looking ahead, traders expect volatility to persist, particularly if the Strait of Hormuz, a key oil-supply chokepoint, remains closed and oil prices continue to surge.
“We expect continued volatility, but if the disruption persists, pressure to reopen Hormuz is likely to build. Bitcoin has held up better than broader risk, and bears watching as an early signal of stabilizing sentiment,” QCP Capital’s market insight team said. Stay alert!
Read more: For analysis of today’s activity in altcoins and derivatives, see Crypto Markets Today
What to Watch
For a more comprehensive list of events this week, see CoinDesk’s “Crypto Week Ahead“.
- Crypto
- Macro
- March 4, 8:15 a.m.: U.S. ADP employment change for February (Prev. 22K)
- March 4, 10:00 a.m.: U.S. ISM services PMI for February (Prev. 53.8)
- March 4, 2:00 p.m.: U.S. Fed Beige Book
- Earnings (Estimates based on FactSet data)
Token Events
For a more comprehensive list of events this week, see CoinDesk’s “Crypto Week Ahead“.
- Governance votes & calls
- Uniswap DAO is voting across two linked proposals to expand v2 and v3 protocol fees to eight layer-2 networks and enable a new tier-based fee system across all v3 pools. Voting ends March 4 & 5.
- ENS DAO is voting to replace three DNSSEC oracle algorithms to patch a critical RSA signature forgery vulnerability and significantly reduce gas costs. Voting ends March 4.
- Unlocks
- Token Launches
- March 4: Block Street (BSB) to list on Binance Alpha, Bybit, others.
Conferences
For a more comprehensive list of events this week, see CoinDesk’s “Crypto Week Ahead“.
Market Movements
- BTC is up 4.49% from 4 p.m. ET Wednesday at $71,283.58 (24hrs: +6.65%)
- ETH is up 5.19% at $2,068.65 (24hrs: +5.64%)
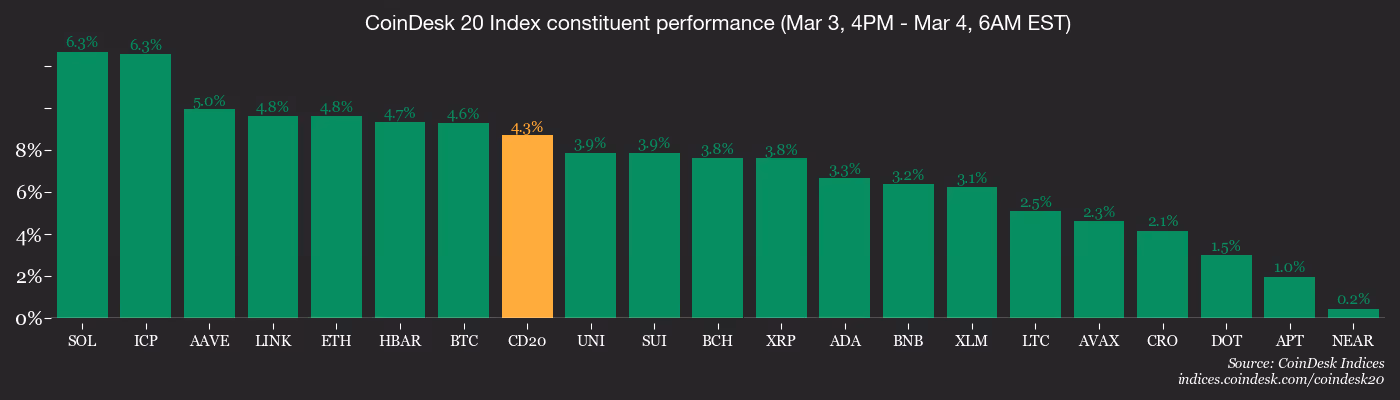
- CoinDesk 20 is up 4.31% at 3,086.55 (24hrs: +5.45%)
- Ether CESR Composite Staking Rate is down 1 bps at 2.85%
- BTC funding rate is at 0.0051% (5.6119% annualized) on Binance

- DXY is down 0.25% at 98.81
- Gold futures are up 1.70% at $5,194.10
- Silver futures are up 4.00% at $86.24
- Nikkei 225 closed down 3.61% at 54,245.54
- Hang Seng closed down 2.01% at 25,249.48
- FTSE 100 is up 0.18% at 10,502.97
- Euro Stoxx 50 is up 0.70% at 5,812.08
- DJIA closed on Tuesday down 0.83% at 48,501.27
- S&P 500 closed down 0.94% at 6,816.63
- Nasdaq Composite closed down 1.02% at 22,516.69
- S&P/TSX Composite closed down 2.19% at 33,784.90
- S&P 40 Latin America closed down 4.95% at 3,539.33
- U.S. 10-Year Treasury rate is up 1 bps at 4.06%
- E-mini S&P 500 futures are unchanged at 6,825.00
- E-mini Nasdaq-100 futures are unchanged at 24,762.00
- E-mini Dow Jones Industrial Average futures are down 0.12% at 48,501.00
Bitcoin Stats
- BTC Dominance: 59.61% (+0.81%)
- Ether-bitcoin ratio: 0.02909 (0.26%)
- Hashrate (seven-day moving average): 1,025 EH/s
- Hashprice (spot): $31.26
- Total fees: 2.71 BTC / $183,733
- CME Futures Open Interest: 101,620 BTC
- BTC priced in gold: 13.7 oz.
- BTC vs gold market cap: 4.77%
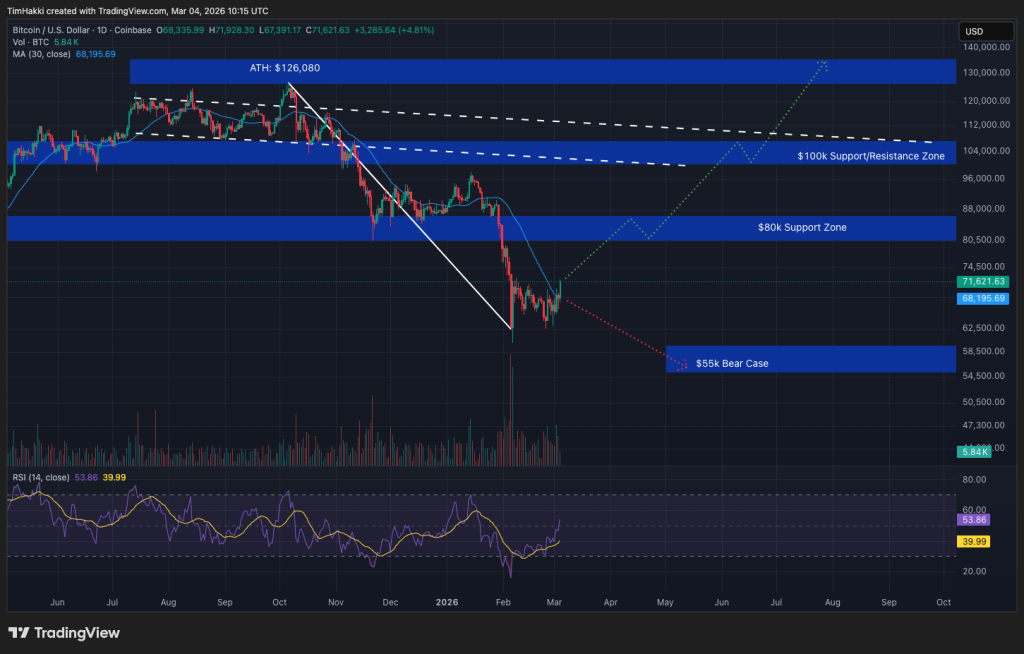
Technical Analysis

- The chart shows bitcoin’s weekly price swings in candlestick format from early 2024.
- The bounce above $71,000 has renewed focus on the $74,000 level, which acted as resistance, an area where buyers tapped out in March 2024 and later as support, where selling stalled last April.
- This level, therefore, represents an area of significant historical economic activity and could now serve as a key inflection zone: A break and hold above $74,000 may open the door to a push toward higher levels, while repeated failure there could reignite selling pressure.
Crypto Equities
- Coinbase Global (COIN): closed on Tuesday at $182.36 (–1.55%), +6.66% at $194.51 in pre-market
- Galaxy Digital (GLXY): closed at $20.68 (–4.83%), +4.01% at $21.51
- MARA Holdings (MARA): closed at $8.66 (–8.36%), +6.47% at $9.22
- Riot Platforms (RIOT): closed at $15.29 (–6.94%), +3.53% at $15.83
- Core Scientific (CORZ): closed at $15.30 (–7.22%), +2.55% at $15.69
- CleanSpark (CLSK): closed at $9.89 (–6.26%), +4.25% at $10.31
- Exodus Movement (EXOD): closed at $10.83 (+3.44%), +0.65% at $10.90
- CoinShares Bitcoin Mining ETF (WGMI): closed at $37.88 (–6.31%), +4.67% at $39.65
- Circle Internet Group (CRCL): closed at $99.63 (+3.63%), +6.15% at $105.76
- Bullish (BLSH): closed at $33.12 (–2.04%), +2.93% at $34.09
Crypto Treasury Companies
- Strategy (MSTR): closed at $132.68 (–3.61%), +7.70% at $142.89
- Upexi (UPXI): closed at $0.79 (–10.80%), +14.65% at $0.90
- Lite Strategy (LITS): closed at $1.15 (+2.68%)
- Sharplink (SBET): closed at $7.26 (–1.76%), +4.68% at $7.60
ETF Flows
Spot BTC ETFs
- Daily net flows: $225.2 million
- Cumulative net flows: $55.47 billion
- Total BTC holdings ~1.28 million
Spot ETH ETFs
- Daily net flows: -$10.8 million
- Cumulative net flows: $11.66 billion
- Total ETH holdings ~5.71 million
Source: Farside Investors
While You Were Sleeping

Why is crypto up today? Crypto progenitor Bitcoin (BTC) just staged a massive V-shaped recovery, reclaiming $71,000 hours after global headlines screamed war.
The weekend dip to $63,000, triggered by intensifying conflict involving Israel, the U.S., and Iran, looked like the start of a risk-off collapse.
It wasn’t. Instead, the market absorbed the shock, flushed the leverage, and kept buying. While traditional markets panicked over blocked supply lines in the Strait of Hormuz, crypto participants saw a discount. That matters. It signals a shift in market resilience that bears did not account for.
Discover: Crypto’s best pre-launch token sales.
Bitcoin Price Action: Institutional Resilience Meets Geopolitical Risk
The drop was sharp, but the recovery was cleaner. When news of the escalation broke, leverage got flushed immediately.
On-chain analysis indicates supply exhaustion from sellers at the $63,000 mark. Exchange flows remained neutral to negative, suggesting coins were moving to cold storage rather than flooding order books. Regional data supports this. Iranian exchange outflows suggest local capital flight seeking safety in digital assets, while global desks treated the geopolitical risk as a liquidity event to fill bids.
Tagus Capital noted in a recent newsletter that Bitcoin is exhibiting “defensive characteristics” despite its high-beta reputation. Where gold retreated after a brief spike, Bitcoin stabilized and reversed. The smart money absorbed the selling pressure. No capitulation.
Bitcoin Price Prediction: $71,000 Reclaimed, Is $75,000 Next?
The chart is painting a clear invalidation of the bear case. Reclaiming $71,000 changes the market structure entirely. The $65,700 level has now flipped from previous resistance to a fortress of support. The V-shape recovery confirms demand at lower levels was stronger than the panic.

If Bitcoin holds above $70,500, the path to $74,000 opens up quickly. Clear that cleanly, and $75,000 is the next logical target. However, if the price loses $69,000, we likely re-test the weekend lows.
The current setup aligns with the VanEck macro bottom thesis, suggesting the $60,000-$63,000 zone was the final shakeout before the next leg up. Momentum indicators on the 4-hour chart have reset, giving bulls room to run.
Discover: The hottest new crypto around.
Market Resilience: Why Crypto Outperformed Gold and Oil
Traditional safe havens reacted predictably to the conflict. Oil jumped 7% on supply fears. Gold added 2%. Yet, Bitcoin’s 12% bounce from the $63,000 lows outpaced them both. This decouples Bitcoin from the “risk-on only” narrative.
While altcoins like Cardano and Dogecoin are lagging behind Bitcoin, the broader crypto price prediction landscape is turning bullish.
Billionaire Ray Dalio recently dismissed Bitcoin’s safe-haven status, yet the market ignored him. Bitcoin gained despite the war escalating. Institutional desks used the weekend gap, when traditional equity markets were closed, to bid on the asset that never sleeps.
The post Why is Crypto Up? Bitcoin Reclaims $71,000 as Market Shrugs Off Middle East Escalation appeared first on Cryptonews.


When airstrikes hit Iran on Feb. 28, crypto outflows from Nobitex spiked 873%, suggesting a “digital bank run” was ongoing. The reality may be more complex.
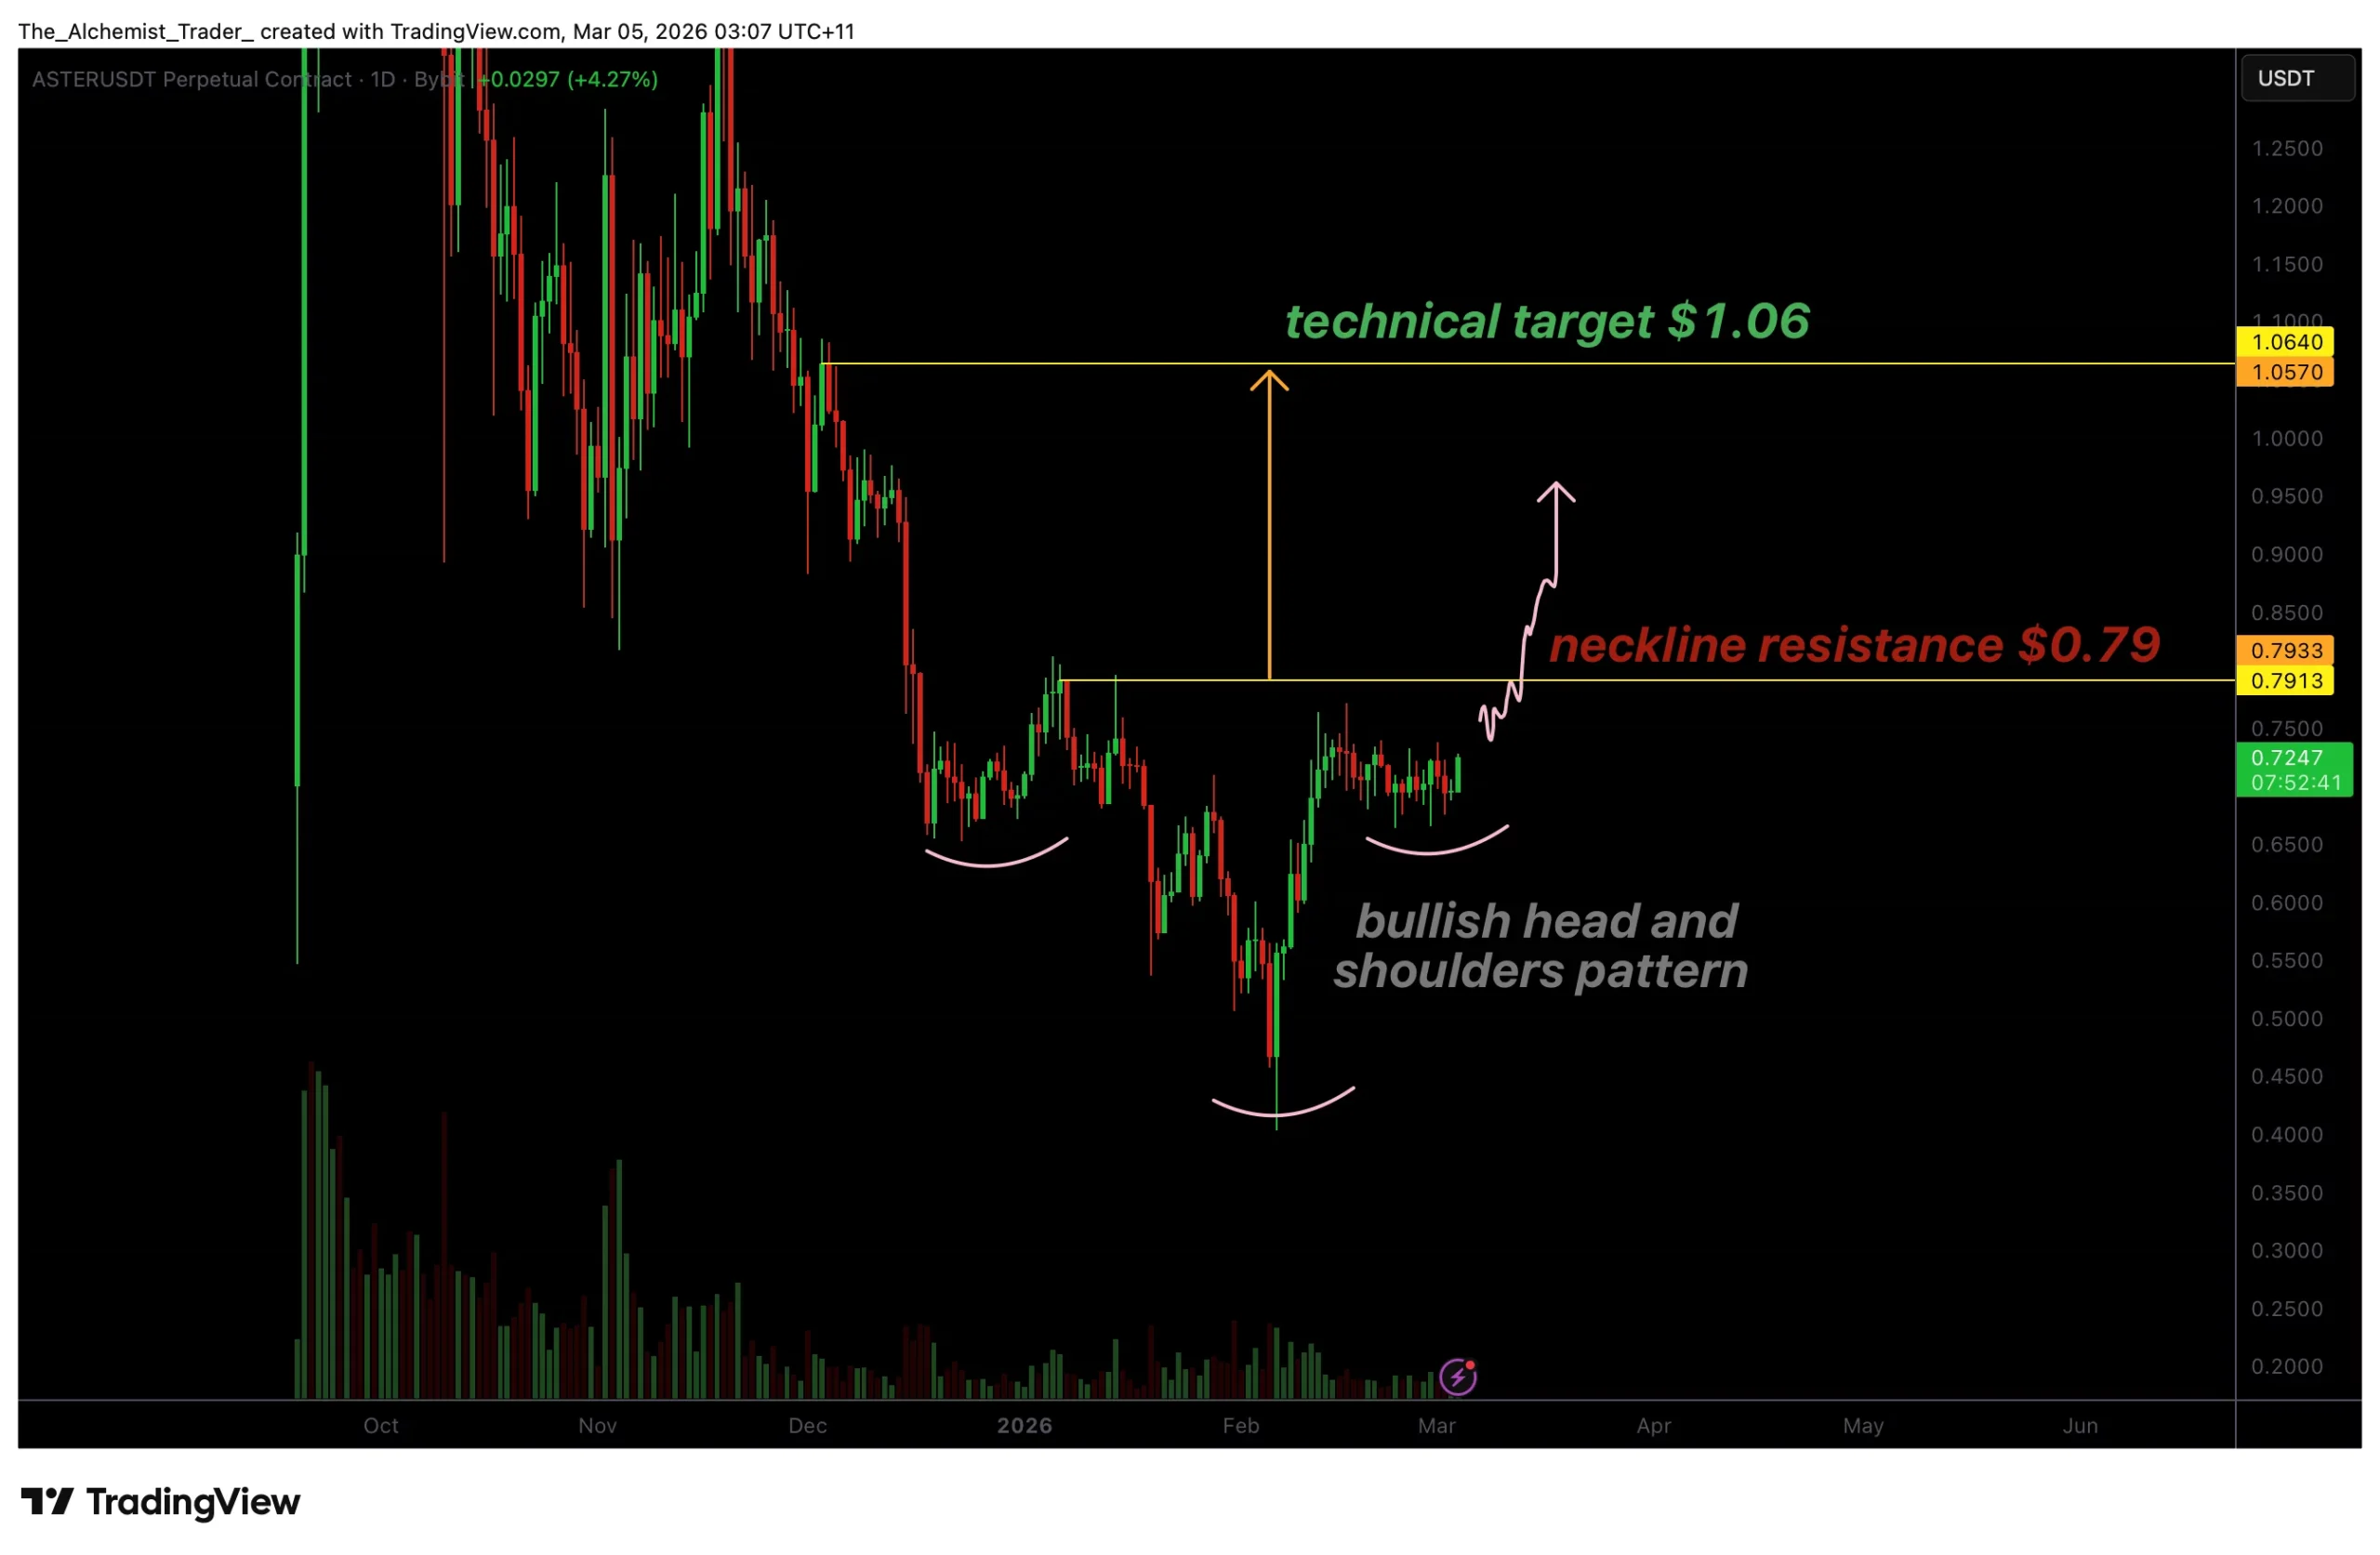
Aster price is forming a potential inverse head and shoulders pattern, signaling a possible trend reversal. A confirmed breakout above $0.79 could trigger a bullish rally toward the $1.06 resistance target.
Summary
- Inverse head and shoulders pattern forming
- $0.79 neckline key breakout level
- Breakout target projected near $1.06
Aster’s (ASTER) recent price action is beginning to show early signs of a structural reversal as a classic technical pattern emerges on the chart. After a prolonged corrective phase, the formation of an inverse head and shoulders pattern suggests that bullish momentum may be building beneath key resistance.
Aster price key technical points
- Bullish Reversal Pattern: Inverse head and shoulders formation developing
- Neckline Resistance: $0.79 acts as the key breakout level
- Technical Target: Breakout projects a move toward $1.06 resistance

Aster’s current price structure closely resembles a classic inverse head and shoulders pattern, one of the most widely recognized bullish reversal formations in technical analysis. The chart shows a clear left shoulder, followed by a deeper head, and a developing right shoulder, indicating that selling pressure may gradually be weakening.
The defining feature of this formation is the neckline resistance, which in this case sits near the $0.79 level. Historically, this region has acted as a strong barrier for price action. Previous attempts to break above this zone resulted in bearish reactions, highlighting the presence of significant supply at this level.
However, repeated tests of resistance often weaken selling pressure over time. Each time the market approaches the neckline, sellers must absorb additional buying demand. Eventually, this process can lead to a decisive breakout if buying pressure becomes strong enough to overwhelm supply.
For the inverse head and shoulders pattern to activate, Aster must break and close above the $0.79 neckline. Confirmation of the breakout would indicate that buyers have regained control of market structure, potentially triggering a new bullish expansion phase.
Once confirmed, the technical target for the pattern sits near $1.06. This projection is calculated by measuring the distance from the head to the neckline and extending that range above the breakout point. Interestingly, this level also aligns with the next high timeframe resistance zone, adding further technical significance to the target.
Volume will play a crucial role in determining whether the breakout can succeed. Bullish continuation patterns typically require a noticeable increase in trading volume to confirm that market participation is expanding. Without strong volume support, breakouts can often fail and revert back into consolidation.
At the moment, the pattern remains unconfirmed, as price is still trading slightly below the neckline resistance. Until the $0.79 level is reclaimed on a closing basis, the inverse head and shoulders formation remains a developing setup rather than an activated signal.
From a market structure perspective, this consolidation beneath resistance may actually strengthen the potential breakout scenario. Prolonged compression below key levels often builds liquidity, which can lead to sharp expansion once the market resolves directionally.
If the breakout occurs with strong momentum, the path toward $1.06 could open quickly as short sellers are forced to cover positions and buyers chase the move higher.
What to expect in the coming price action
Aster is approaching a critical technical inflection point at $0.79. A confirmed breakout above this neckline with strong volume would activate the inverse head and shoulders pattern and project a rally toward the $1.06 resistance zone.
However, failure to break this level could keep price consolidating below resistance until sufficient momentum builds for a decisive move.
A new Bitcoin death cross would ensure continuation of the bear market unless a “major bullish catalyst” appears, per new BTC price analysis.
Bitcoin (BTC) needs a “major bullish catalyst” to avoid canceling out its March rally, says the latest analysis.
Key points:
-
New findings warn that short-term BTC price strength does not remove the risk of the bear market continuing.
-
Bitcoin faces plenty of overhead resistance in the mid-$70,000 zone.
-
A “death cross” formed of two weekly trend lines is still on course to confirm this week.
BTC price caught between multiple trend lines
In an X update on Wednesday, Keith Alan, cofounder of trading resource Material Indicators, warned that BTC price weakness was still present beyond low time frames.

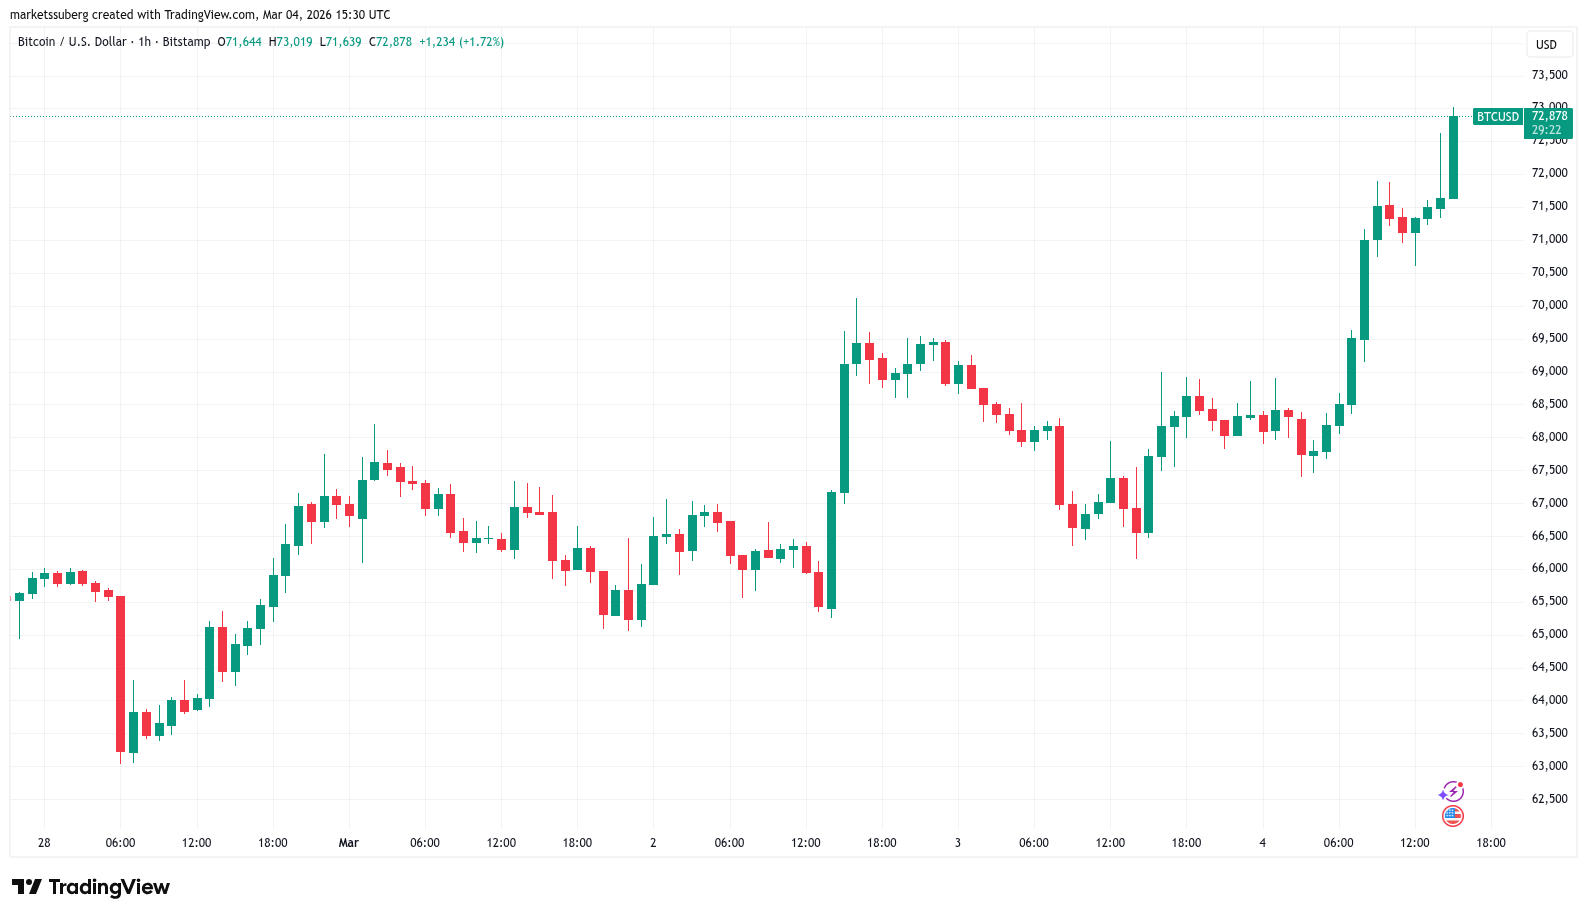
Bitcoin hit monthly highs of $73,019 at the day’s Wall Street open, continuing a rebound that accompanied renewed conflict in the Middle East.
While this quickly led to predictions of a bull market comeback and even new all-time highs, Alan was frank about the BTC price outlook.
“This is an important candle to watch on the $BTC chart,” he summarized.
“On the surface, we’re seeing a short squeeze. From a technical perspective, this D candle is attempting to validate R/S Flips at the 21-Day SMA, the 2021 Top at $69k, and a Timescape Level at $71.3k.”

Alan referred to various key levels near the spot price, including the 21-day simple moving average (SMA) at around $67,550, per data from TradingView.
Also on the radar were the 50-day SMA at $76,350, along with the 21-week and 100-day SMA trend lines at $88,000 and $87,300, respectively.
“If bulls can push price up from here I expect some friction around psychological resistance ~$75k, technical resistance at the $50-Day MA, and the next Timescape Level at $78.3k,” he continued.
“A support test, sooner than later, would be healthy, but I’m not sure that the market is going to make it that easy on us. However this develops, IMO, the longer it takes to grind up, the more durable the rally will likely be.”
Bitcoin death cross still due this weekly candle
As Cointelegraph reported, long-term price expectations for the current bear market favor a bottom at or below the $50,000 mark.
Related: ‘This is not World War III:’ Five things to know in Bitcoin this week
A return to BTC price downside, Alan warned, could come as soon as next week, thanks to a so-called “death cross” involving the 21-week and 100-week SMAs.

A death cross occurs when the former trend line crosses below the latter, implying weaker recent price action compared to the longer-term trend.
“The caveat to that is the simple fact that next week we will print a death cross between the 21 and 100 Week MAs, and that will likely be a precursor to the next leg down unless we get a major bullish catalyst,” he concluded.
This article does not contain investment advice or recommendations. Every investment and trading move involves risk, and readers should conduct their own research when making a decision. While we strive to provide accurate and timely information, Cointelegraph does not guarantee the accuracy, completeness, or reliability of any information in this article. This article may contain forward-looking statements that are subject to risks and uncertainties. Cointelegraph will not be liable for any loss or damage arising from your reliance on this information.


Morgan Stanley (MS) has filed with the Securities and Exchange Commission (SEC) a prospectus outlining the structure of the proposed Morgan Stanley Bitcoin Trust, revealing that the fund plans to use Coinbase Custody (COIN) and the Bank of New York Mellon (BNY) to safeguard its bitcoin holdings, according to a form S‑1 submitted.
The two institutions will serve as the trust’s bitcoin custodians, responsible for storing the digital assets and facilitating transfers related to share creations and redemptions.
The filing outlines a custody structure designed to mirror traditional institutional standards. Bitcoin will largely be held in offline cold storage vaults, where private keys remain disconnected from the internet to reduce hacking risks. A portion of the assets may temporarily move to trading wallets during ETF creation or redemption activity. The trust notes that custody insurance exists but is shared across customers and may not cover all potential losses.
BNY will also play several additional roles within the ETF structure. The bank will serve as the fund administrator, transfer agent, and cash custodian, handling accounting, shareholder records, and cash flows tied to ETF transactions.
The ETF itself will be structured as a passive vehicle designed to track the price of bitcoin by holding the cryptocurrency directly rather than using derivatives or leverage.
The filing also states that the trust will calculate its net asset value using the CoinDesk Bitcoin Benchmark 4PM New York Settlement Rate, which aggregates trade data from major spot exchanges to determine the daily reference price for bitcoin.
Crypto World
Morgan Stanley (MS) Stock: Landmark Bitcoin Trust Partners with Coinbase and BNY Mellon

TLDR
- Morgan Stanley submits revised spot Bitcoin ETF filing
- Coinbase Custody selected to safeguard Bitcoin assets
- BNY Mellon assigned administrative and cash custody duties
- Trust valuation tied to CoinDesk 4PM NY Bitcoin benchmark
- MS stock gains ground amid crypto expansion efforts
Morgan Stanley (MS) has pushed forward with its digital currency ambitions by submitting an updated registration document for its Bitcoin Trust. The financial institution has designated Coinbase Custody Trust Company and BNY Mellon for critical custody and operational functions. MS stock registered at $168.78, climbing 1.71% during robust trading activity.
Bitcoin Trust Architecture and Asset Security
The investment giant has designed its proposed trust as a passive spot Bitcoin exchange-traded product. This fund will maintain direct Bitcoin ownership without employing derivatives or borrowed capital. Accordingly, shares will mirror the market value of the underlying Bitcoin reserves.
Coinbase Custody Trust Company has been selected to protect the digital currency holdings through institutional-grade custody solutions. The majority of Bitcoin will remain in offline cold-storage facilities to minimize cybersecurity threats. Small amounts may be moved to hot wallets exclusively during share creation and redemption processes.
BNY Mellon has been appointed to manage administration, transfer agency services, and cash custody operations for the trust. Its responsibilities encompass financial reporting, shareholder record maintenance, and liquidity management activities. Consequently, this operational framework matches conventional ETF industry protocols.
Valuation System and Risk Management
The trust’s net asset value will be determined through the CoinDesk Bitcoin Benchmark 4 PM New York Settlement Rate. This benchmark aggregates trading information from leading spot cryptocurrency platforms. The ETF will employ a publicly available daily pricing standard.
Regulatory disclosures indicate that custody insurance coverage exists but extends across numerous clients. Nevertheless, such insurance may not fully compensate for every conceivable loss scenario. This language mirrors standard disclosure practices among existing spot Bitcoin ETF providers.
Authorized market participants will deliver cash in exchange for Bitcoin when creating new shares. They may also convert shares back into underlying Bitcoin during the redemption mechanism. This structure enables the fund to preserve liquidity within established regulatory guidelines.
Broader Digital Currency Ambitions
Morgan Stanley originally submitted its Bitcoin Trust application in January. The institution simultaneously filed documentation for a separate Solana exchange-traded fund. These parallel initiatives demonstrate the bank’s comprehensive digital asset strategy.
The financial services company has additionally pursued a national trust bank charter. Regulatory authorization would enable Morgan Stanley to directly custody cryptocurrencies on behalf of institutional clientele. This capability would position the firm alongside specialized crypto custody providers.
Senior management has outlined intentions to broaden cryptocurrency accessibility throughout its brokerage operations, notably E*Trade. The retail-focused E*Trade platform functions under Morgan Stanley’s corporate umbrella. With roughly $8 trillion in assets under management, the institution seeks to consolidate custody solutions, trading capabilities, and supervisory functions within a unified infrastructure.

Crypto World
Market infrastructure firms warn tokenized securities face higher costs, split liquidity without interoperability


The world’s largest market infrastructure operators are warning that tokenized securities will struggle to scale unless the industry agrees on how blockchains and traditional finance systems connect.
In a joint white paper, the Depository Trust and Clearing Corporation (DTCC), Euroclear and Clearstream, working with Boston Consulting Group, argued that “interoperability is a prerequisite for digital asset security (DAS) adoption at scale.” Without it, they wrote, assets risk being trapped on isolated networks, leaving “operational costs high” and liquidity fragmented as trading volumes grow.
The group stopped short of endorsing any single technology. Instead, it framed the problem as structural. Dozens of public and permissioned blockchains now host pilots and live products. Each uses its own standards, smart contract logic and settlement design. That diversity, the paper says, makes integration harder and increases operational and regulatory risk.
The authors rejected the idea that one dominant ledger will emerge. The operating model, they said, is shifting toward a “network-of-networks, with standards, gateways, and regulated service providers” linking digital and traditional systems. In that environment, assets must move across platforms while preserving what the paper calls “the asset’s integrity, ownership rights and lifecycle, with full legal and regulatory compliance.”
They summarized the goal in a short phrase: “same asset, same rights, same outcome.”
The warning comes as tokenization gains ground in repo markets and pilot programs across the U.S. and Europe. While onchain securities remain small compared with global equity and FX markets, the paper notes that large-scale infrastructure is already in motion, including more than $300 billion in daily repo activity across major platforms.
Still, many workflows depend on legacy rails. Tokenized bonds may trade on-chain, but cash often settles through real-time gross settlement systems or bank payment networks. Custodians and central securities depositories still maintain books of record. The paper assumes this coexistence will last for years.
The framework also extends beyond technical bridges. Interoperability, the authors argued, must cover assets and liabilities, ownership recognition, lifecycle events, ledger finality and legal enforceability. Without alignment across those layers, cross-chain or cross-border transactions may require extra reconciliation steps that erode promised efficiency gains.
The group called on regulators and market participants to develop working groups focused on governance, standards and resilience. “Collective action today will shape resilient markets tomorrow,” the paper states.
That push comes as major Wall Street firms argue tokenization could reshape financial markets by enabling 24/7 trading, faster settlement and more efficient use of collateral. Executives at large banks and asset managers have said blockchain-based rails may eventually reduce back-office costs and free up capital tied up in multi-day settlement cycles. Some have described tokenized assets as a path toward more integrated global markets, where cash and securities move in near real time.
The paper does not dispute that vision. Instead, it suggests that achieving it depends less on launching new chains and more on aligning the rules that govern them.


Binance founder Changpeng Zhao has endorsed Predict.fun’s strategic acquisition of Probable.
Summary
- Predict.fun has announced a strategic acquisition of on-chain prediction platform Probable.
- Probable was incubated by PancakeSwap and YZi Labs before the deal.
- The combined platform aims to improve prediction market architecture, execution efficiency, and capital utilization.
Binance founder Zhao Changpeng has publicly welcomed a tie-up in the BNB (BNB) Chain prediction market segment, after Predict.fun said it would acquire on-chain platform Probable in a strategic deal. In a social media post commenting on the announcement, Zhao congratulated both teams and said he was pleased to see “two strong projects joining forces,” framing the move as a positive consolidation of liquidity and talent. Probable, which had been incubated by PancakeSwap and YZi Labs, will now be integrated into the Predict.fun stack, bringing its experience in market design and on-chain execution under a single brand. For users, the merger is expected to reduce fragmentation across similar products on BNB Chain, while giving Predict.fun access to a broader base of traders and liquidity providers.
Congrats! Good to see two strong project combing forces. https://t.co/lHDwTZ8oiu
— CZ 🔶 BNB (@cz_binance) March 4, 2026
According to the projects, the acquisition will be used to accelerate upgrades to Predict.fun’s market architecture, including how odds are quoted, orders are matched, and capital is reused across multiple markets. Prediction protocols typically rely on careful incentive design and risk controls to ensure that liquidity is deep enough for larger trades, without exposing liquidity providers to outsized drawdowns when events move quickly. By combining Probable’s technology with its own roadmap, Predict.fun aims to roll out more efficient routing of orders, better collateral management, and potentially new types of markets around crypto, macro, and sports. The move comes as on-chain prediction platforms see renewed attention from traders looking for transparent alternatives to centralized sites and from DeFi users seeking new yield sources.
Consolidation in on-chain prediction markets
Zhao’s endorsement highlights a broader consolidation trend among on-chain prediction projects as they compete for users in a crowded DeFi landscape. Smaller, standalone platforms often struggle with thin liquidity and high user-acquisition costs, making mergers and strategic acquisitions an attractive way to scale more quickly. By pooling technology and order flow, projects like Predict.fun and Probable can offer tighter spreads and higher maximum trade sizes, which are critical for attracting professional bettors and market makers. In turn, healthier liquidity can make markets more informative, giving participants better-implied probabilities around elections, macro events, and crypto-specific outcomes.
The deal also lands at a time when regulators are paying closer attention to prediction markets, including in the U.S., where agencies such as the CFTC are reviewing new rules and proposals. Projects operating on large networks must factor in how evolving frameworks like MiCA and existing securities and derivatives rules might apply to certain markets or payout structures. For Predict.fun, building a more robust, capital-efficient architecture could help it adapt to changing policy conditions while remaining competitive with centralized and off-chain venues. With high-profile figures like Zhao signaling support, the combined platform is positioning itself as a leading prediction hub on BNB Chain, betting that better execution and deeper liquidity will draw in the next wave of on-chain forecasters and liquidity providers.

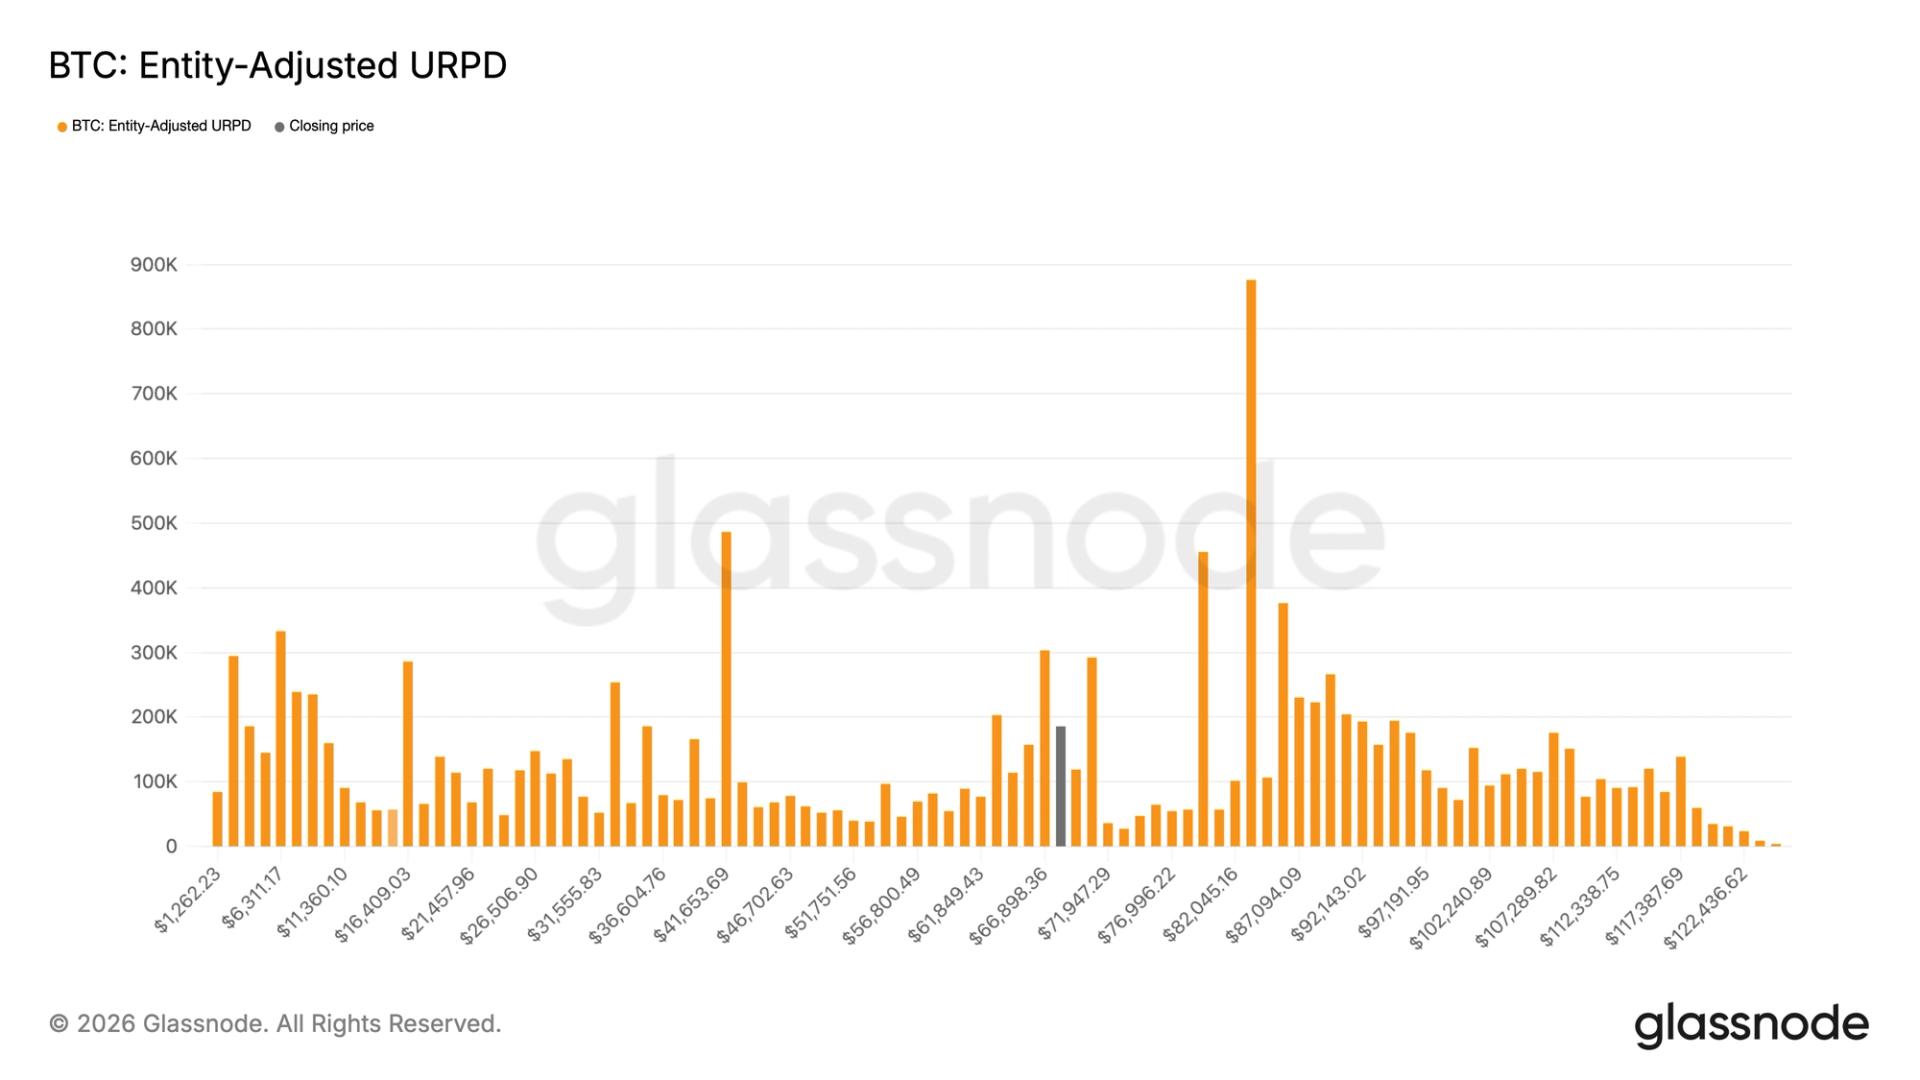
Bitcoin’s “air pocket” is once again coming into focus as the largest cryptocurrency by market capitalization rose on Wednesday to just below $72,000.
The air pocket refers to a thin area of supply between $72,000 and $80,000, where relatively few coins last changed hands, according to data from Glassnode.
Roughly just 1% of the circulating bitcoin supply sits within this range. Because so few holders established positions there, the market may encounter limited resistance if prices begin moving through the zone. In practical terms, that means if bitcoin pushes decisively above $72,000, the move toward $80,000 could occur relatively quickly.
Historically, bitcoin has spent very little time trading in $72,000 to $80,000 region. One instance came in November 2024, when prices surged rapidly after Donald Trump’s U.S. presidential election victory, quickly moving through the range without forming much trading volume.
A second example occurred earlier this year, when bitcoin fell from around $80,000 to $70,000 at the end of January, before sliding further to roughly $60,000 by Feb. 6, a decline that unfolded over just a few days.
The supply dynamics are visible through Glassnode’s Realized Price Distribution (URPD) metric. URPD shows the price levels at which the current set of unspent transaction outputs were last moved, effectively mapping where existing bitcoin holders acquired their coins.
CoinDesk Research notes that during bitcoin’s recent consolidation between $60,000 and $70,000, more than 400,000 BTC were accumulated, showing strong support below current levels.

Over the weekend, crypto markets acted as the first barometer of investor sentiment as geopolitical tensions around Iran intensified after U.S. and Israeli strikes. In the early hours of Saturday, a video posted by U.S. President Donald Trump announced new attacks against Iran, prompting an immediate reaction in digital assets. Bitcoin, the market’s bellwether, briefly traded near $63,000 before eking out a partial recovery as weekend liquidity moved through crypto-native venues. With traditional markets closed, traders leaned on perpetual futures and tokenized assets to express views on risk, inflation expectations, and macro uncertainty—demonstrating how 24/7 crypto trading is increasingly a real-time shock absorber for broader markets.
Key takeaways
- Bitcoin briefly traded around the $63,000 level in the immediate aftermath of the announcements, before rebounding as sentiment evolved.
- Crypto markets served as a real-time gauge for macro shocks when traditional markets were closed, highlighting the primacy of continuous price discovery.
- Perpetual futures on both centralized and decentralized venues sustained liquidity, with tokenized assets and RWAs gaining traction as the weekend progressed.
- Hyperliquid maintained elevated trading volume over the weekend, suggesting sustained demand for cross-asset liquidity during geopolitical turmoil.
- Institutional interest in tokenized assets and crypto rails intensified, with XAUT and related prediction markets drawing notable activity amid the episode.
Tickers mentioned: $BTC, $IBIT, $XAUT
Sentiment: Neutral
Price impact: Negative. Bitcoin briefly dropped to around $63,000 in response to the announcements and similar shocks in other assets, before stabilizing.
Market context: The weekend escalation reinforced crypto’s role as a near real-time risk indicator, with 24/7 liquidity enabling price discovery even when traditional markets pause. The episode also foreshadowed how institutional interest in tokenized assets and RWAs could accelerate the integration of crypto rails into mainstream finance.
Why it matters
The episode underscores a maturation trend in which digital assets function as live barometers of macro risk, not merely as speculative instruments. As geopolitical headlines circulated, Bitcoin and related crypto markets absorbed the information flow in real time, illustrating how traders leverage around-the-clock liquidity to calibrate risk exposure during shocks that unfold outside conventional trading hours.
Institutional interest in tokenization and RWAs is increasingly visible in market structure developments. Proposals and pilot programs around tokenized assets and cross-border liquidity access point to a future where crypto rails support a broader set of financial instruments, even as traditional venues test longer trading hours. In this context, players are evaluating whether extended hours and on-chain settlement can coexist with regulatory norms while maintaining risk controls that protect investors.
Additionally, the weekend episode highlights the growing relevance of alternatives to spot markets. Tokenized gold, such as XAUT, and cross-asset liquidity vehicles gained visibility as traders sought diversified exposure beyond conventional equities during a period of heightened uncertainty. The convergence of crypto, tokenization, and traditional asset proxies suggests a longer arc toward more integrated, cross-market risk management frameworks.
What to watch next
- Regulatory and market-infrastructure developments around 24/7 trading and tokenized assets, including updates on 23-hour trading proposals from Nasdaq.
- Further geopolitical developments and how BTC and other major assets respond in real time on perpetual futures and tokenized instruments.
- Tracking volume trends on platforms like Hyperliquid to see if weekend activity sustains beyond periods of stress.
- Monitoring tokenized assets such as XAUT and related RWAs for continued institutional uptake and pricing dynamics.
Sources & verification
- Public statements and video posts related to the weekend strikes, including the Truth Social post by Donald Trump announcing attacks on Iran.
- Bitcoin price movements around the $63,000 level as reported in crypto coverage documenting the weekend reaction.
- Bloomberg reporting on 24/7 crypto trading activity and Hyperliquid volume during the period.
- Cointelegraph reporting on tokenized assets like XAUT and on-chain/Ancedent market activity (e.g., Polymarket volumes) during the episode.
- Nasdaq’s and NYSE’s explorations of extended or 24/7 trading concepts, including the Nasdaq rulebook solicitation for near-24-hour trading and related market-structure discussions.
Bitcoin absorbs geopolitical shocks in real time
Bitcoin (CRYPTO: BTC) began the weekend on a sensitive footing after a video posted by President Donald Trump signaled U.S. and Israeli strikes against Iran. In the first hours after the announcement, the asset traded near the $63,000 area as participants recalibrated risk exposure and liquidity considerations in a market that never sleeps. The move underscored how geopolitical shocks are increasingly priced in real time on crypto platforms, where 24/7 trading creates a continuous feedback loop between news events and price action.
Analysts described the initial move as swift but contained, noting that Bitcoin did not break its broader market structure. “The initial weekend move to the downside was sharp but contained, and Bitcoin’s architecture held,” said Jonatan Randin, senior market analyst at PrimeXBT. “When it became clear that escalation risk appeared limited, price retraced and found footing.” The sentiment framing suggests a non-systemic risk event rather than a collapse in risk appetite.
Throughout the Saturday-to-Sunday window, traders shifted toward venues designed for constant liquidity, including perpetual futures that operate around the clock. With spot sessions quiet on traditional exchanges, crypto markets offered a live lens into risk appetite and inflation expectations as investors allocated capital across cross-asset plays and hedges.
Observers highlighted how uninterrupted trading both tests and strengthens price discovery. “Liquidity can thin during off-hours, potentially amplifying short-term moves, but the nonstop market accelerates price discovery and price adjustment,” noted Iliya Kalchev, an analyst at Nexo Dispatch. That view aligns with the growing use of digital rails to price geopolitical risk in real time—especially as institutions explore tokenized instruments and RWAs that can trade outside standard hours.
Beyond the classic spot market, tokenized assets and cross-asset liquidity drew attention. Bitwise’s executives flagged rising demand in tokenized gold, including XAUT (CRYPTO: XAUT), as traders moved to diversify via tokenized reserves. Prediction markets also reported elevated volumes on platforms such as Polymarket during the episode, illustrating how markets blend crypto and traditional risk proxies when macro uncertainty spikes. These signals map onto a broader trend: more capital is testing crypto rails as a flexible, around-the-clock access point to risk exposure.
The shift toward tokenized assets dovetails with big-picture industry projections. McKinsey and Standard Chartered have argued tokenized assets could reach into the trillions of dollars by 2030, while Boston Consulting Group offers a similar long-run expansion forecast. Within that landscape, traditional venues are testing longer trading horizons, with Nasdaq pursuing a near 23-hour framework and the New York Stock Exchange exploring blockchain-enabled platforms as a bridge to on-chain finance. In this context, the iShares Bitcoin Trust (EXCHANGE: IBIT) has already positioned itself as a conventional-accessibility vehicle for investors seeking crypto exposure within familiar structures.
From a macro perspective, the episode reinforces Bitcoin’s emergence as a macro-asset sensitive to liquidity shifts and geopolitical risk. “Bitcoin has evolved into a macro asset, reacting not only to tech dynamics but to shifts in liquidity and policy expectations,” Kalchev said. The observation echoes a longer trend: crypto markets provide a continuous, cross-border price signal in an era of fragmented liquidity across traditional exchanges.
In parallel, data ripples from the broader crypto ecosystem underscored a persistent appetite for cross-asset liquidity. Hyperliquid, a perpetual-futures DEX, extended above-weekend volumes for commodities and traditional assets such as oil, at least for the period in focus. Bitwise’s Matt Hougan also noted a surge in tokenized-gold activity, while research and platforms tracking markets like Polymarket documented record engagement. Taken together, the weekend episode points to a convergence: tokenized assets and crypto rails are becoming more central to risk management across investors who traditionally rely on stocks, bonds, and commodities.
As more traditional players contemplate 24/7 or near-24/7 trading systems, the crypto world has already been operating with that tempo for years. The weekend episode shows that markets can digest news quickly when the information stream never pauses, potentially accelerating the integration of crypto into mainstream financial infrastructure while sharpening the debate over regulation, liquidity, and systemic risk across the global financial system.
Looking ahead, the weekend’s dynamics emphasize the importance of robust market data, trusted custody, and reliable on-chain settlement for institutional participants. If the trend toward wider adoption of tokenized assets continues, there will be increased demand for transparent price feeds, better risk management tools, and standardized benchmarks that help investors navigate the evolving landscape.
For traders, the episode reinforces a practical takeaway: in a world where news can ripple across asset classes in minutes, the speed of reaction matters as much as the direction of movement. The implication is that risk management in crypto now includes cross-asset hedges, liquidity-aware positioning, and a readiness to respond to geopolitical headlines as they break—anywhere, anytime.

Harry Maguire to appeal conviction in Greece after ‘rejecting last-minute settlement offer’

Mama June’s Medical Issues Has Her Worried for Her Life

Simon’s Sketch: Pre-deployed and Perfectly Prepared to Do Precisely Nothing

Smart energy pays enters the US market, targeting scalable financial infrastructure

Why Israel is blocking foreign journalists from entering

Bitcoin: We’re Entering The Most Dangerous Phase

Yeat – Money So Big (Instrumental/TikTok Remix)

‘Financial Calamity’: Judge Says Records Are Relevant To Kouri Richins’ Alleged Murder Motive

XRP MARKETCAP DOESN’T MEAN S**T – BANKS WON’T WARN YOU OF THIS – TRANSATLANTIC RAILS ARE READY TO GO
-

 Politics6 days ago
ITV enters Gaza with IDF amid ongoing genocide
-

 Politics1 day ago
Alan Cumming Brands Baftas Ceremony A ‘Triggering S**tshow’
-

 Fashion5 days ago
Weekend Open Thread: Iris Top
-

 NewsBeat7 days ago
Cuba says its forces have killed four on US-registered speedboat | World News
-

 Tech4 days ago
Unihertz’s Titan 2 Elite Arrives Just as Physical Keyboards Refuse to Fade Away
-
Sports4 days ago
The Vikings Need a Duck
-
 NewsBeat4 days ago
Dubai flights cancelled as Brit told airspace closed ’10 minutes after boarding’
-
 NewsBeat7 days ago
Manchester Central Mosque issues statement as it imposes new measures ‘with immediate effect’ after armed men enter
-

 NewsBeat3 days ago
‘Significant’ damage to boarded-up Horden house after fire
-
 NewsBeat4 days ago
The empty pub on busy Cambridge road that has been boarded up for years
-

 NewsBeat4 days ago
Abusive parents will now be treated like sex offenders and placed on a ‘child cruelty register’ | News UK
-

 Entertainment2 days ago
Baby Gear Guide: Strollers, Car Seats
-

 Business7 days ago
Discord Pushes Implementation of Global Age Checks to Second Half of 2026
-

 Business6 days ago
Only 4% of women globally reside in countries that offer almost complete legal equality
-
 Tech5 days ago
NASA Reveals Identity of Astronaut Who Suffered Medical Incident Aboard ISS
-
Politics4 days ago
FIFA hypocrisy after Israel murder over 400 Palestinian footballers
-
 NewsBeat3 days ago
Emirates confirms when flights will resume amid Dubai airport chaos
-

 Crypto World6 days ago
From Crypto Treasury to RWA: ETHZilla Retreats and Relaunches as Forum Markets on Nasdaq
-

 NewsBeat2 days ago
Is it acceptable to comment on the appearance of strangers in public? Readers discuss
-

 Tech3 days ago
Viral ad shows aged Musk, Altman, and Bezos using jobless humans to power AI