
Crypto World
Here’s Why Ripple (XRP) Could be on the Verge of a Huge Move

XRP looks primed for significant volatility, yet it remains unclear whether that will translate into a rally or a steep pullback.
Ripple’s native cryptocurrency has been trading in a relatively tight range over the past few days, but one indicator suggests that a major price move could be on the way.
Opinions vary among analysts: some project substantial upside in the short term, whereas others see a renewed correction as the more probable outcome.
Fasten Your Belts
After a period of heavy turbulence earlier this year, XRP’s price movement appears to have calmed down a bit lately. Over the last week, the asset has been hovering between $1.33 and $1.47, currently trading at around $1.40.
Ali Martinez noted the reduced volatility, claiming that a huge move could be on the horizon given the squeezed Bollinger Bands. The technical indicator, developed by John Bollinger in the 1980, helps traders spot oversold or overbought conditions.
It is made up of a moving average with upper and lower bands that widen or narrow as market conditions change. When the bands tighten, it signals a period of low volatility that sometimes precedes a strong rally or a sharp decline.
The analysts on X have been quite divided in XRP’s potential future performance. Some, like Trading Shot, think the valuation could plummet below $1, whereas WealthManager alerted that a “huge drop could be imminent.”
Others, including EGRAG CRYPTO, emphasized that XRP’s RSI has fallen on a weekly scale, entering its most oversold level in history. Such a trend is typically followed by a price pump, whereas overbought territory is seen as a warning for an incoming correction.
You may also like:
Crossing This Zone is Crucial for the Bulls
Another industry participant who touched upon XRP’s performance is X user CRYPTOWZRD. They argued that the asset needs to reclaim $1.4230 to enter bullish territory, whereas a rejection could offer a further decline and short opportunities.
The fading interest in spot XRP ETFs is another development that won’t sit well with the bulls. Data shows that outflows have surpassed inflows over the past four days, suggesting that major institutional players, such as pension funds, hedge funds, and asset managers, have been scaling back their positions.
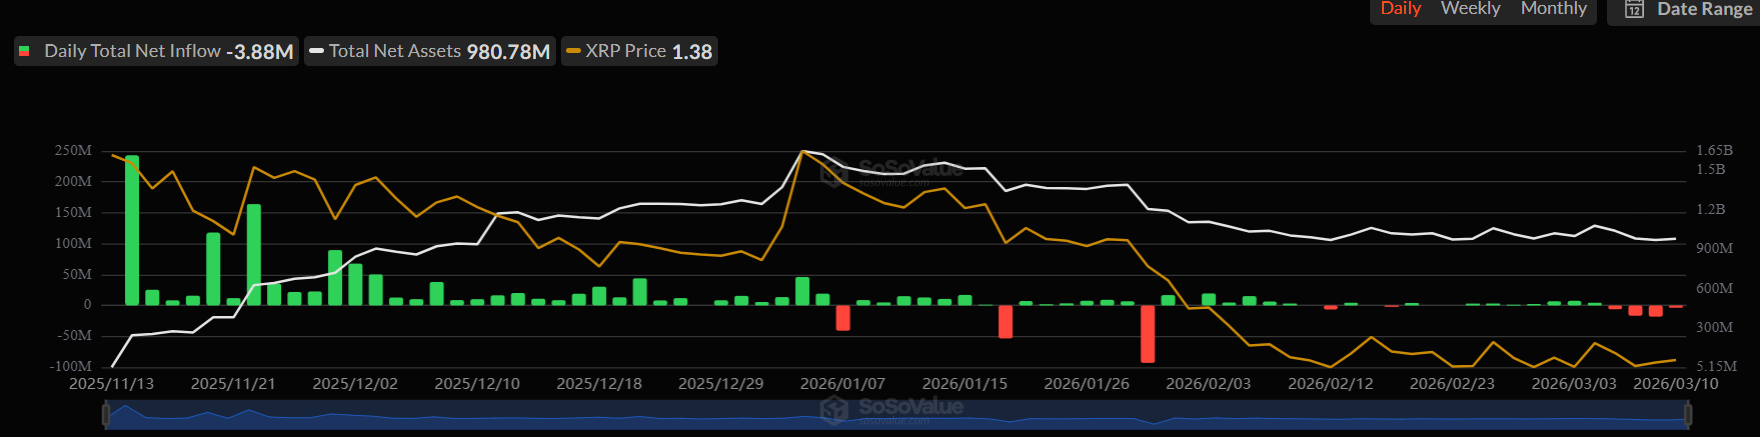
The first company to launch a spot XRP ETF in the US, which has 100% exposure to the token, is Canary Capital. This happened in November 2025, and shortly after, Bitwise, Grayscale, Franklin Templeton, and 21Shares followed suit. According to data from SoSoValue, these financial vehicles have generated a cumulative net inflow of $1.21 billion to date.
Binance Free $600 (CryptoPotato Exclusive): Use this link to register a new account and receive $600 exclusive welcome offer on Binance (full details).
LIMITED OFFER for CryptoPotato readers at Bybit: Use this link to register and open a $500 FREE position on any coin!

Crypto World
Tokenized Real-World Assets Hit $27.65B as Ondo Finance Dominates Equities With 60% Market Share

TLDR:
- The tokenized RWA market reached $27.65B in April 2026, growing 4.07% while most crypto sectors contracted.
- U.S. Treasury debt leads the RWA market at $12.78B, nearly half the total, followed by commodities at $5.4B.
- Tokenized equities hit $941M with a $2.94B monthly transfer volume, marking an 85.78% jump in 30 days.
- Ondo Finance controls 60.07% of the tokenized equity market at $557M, spanning 230 products across 8 asset classes.
Tokenized real-world assets have reached $27.65 billion in total distributed value as of April 2026. The sector grew 4.07% over the past 30 days, standing apart from most crypto verticals.
Capital inflows into RWA remain structurally positive while other segments contract. U.S. Treasuries lead at $12.78 billion, followed by commodities at $5.4 billion and asset-backed credit at $3.19 billion. Tokenized equities are now approaching the $1 billion threshold.
RWA Market Holds Steady as Capital Flows Into Tokenized Instruments
The tokenized RWA market is drawing consistent institutional interest in blockchain-based financial instruments. Investors are moving capital into on-chain versions of Treasuries, commodities, and credit products.
These assets offer dollar-denominated yield without traditional brokerage accounts or wire transfer requirements. Global access without timezone or geographic barriers is a key draw for institutional allocators.
U.S. Treasury debt at $12.78 billion accounts for nearly half the total market value. Commodities follow at $5.4 billion, while asset-backed credit holds $3.19 billion.
Together, these three categories make up the bulk of the $27.65 billion total. The composition reflects a market led by yield-generating and capital-preservation instruments.
The 4.07% monthly growth rate is notable given the current crypto environment. Most sectors are recording outflows, yet RWA continues to attract fresh capital.
That contrast points to a structural shift in how institutional money views on-chain assets. Investors appear to be treating tokenized instruments as a long-term allocation category.
The broader data from rwa.xyz reinforces this trend with consistent upward movement. Monthly figures have held positive across multiple reporting periods.
The market is not being driven by short-term speculation, but by allocation patterns familiar in traditional finance. That behavioral shift separates RWA from most other crypto verticals.
Ondo Finance and xStocks Lead a Concentrated Tokenized Equity Sector
Tokenized equities now sit at $941 million, closing in on the $1 billion mark. Monthly transfer volume reached $2.94 billion, a jump of 85.78% over 30 days.
That creates a 3:1 ratio between transfer volume and total asset value. The ratio points to active trading rather than passive holding behavior among participants.
According to data shared on X, OndoFinance holds 60.07% of the tokenized equity market at $557 million. The platform operates across 230 products and grew 8.28% over the past month.
@xStocksFi holds 26.24% at $243.3 million, making it the second-largest platform. Together, the two platforms control 86% of the entire tokenized equity market.
Securitize, the next closest competitor, holds only $60 million across a single product. That platform declined 38.32% over the same 30-day period.
Every other platform in the space holds under $25 million. The drop-off from the two leaders to the rest of the market is sharp.
Ondo’s growth reflects a portfolio that has evolved well beyond its original design. The platform started with OUSG and USDY as Treasury yield products. It now covers eight asset classes, with U.S. Treasury debt at $2.4 billion making up 76.9% of its total value.
The equity vertical at $557 million has become its second-largest and fastest-growing segment, with top products including S&P 500 ETFs and NVIDIA shares.

Crypto World
Best Crypto to Buy Now as the Search Leads to Pepeto With $8M Raised and 100x Before Binance Listing
The search led right here. The best crypto to buy now is not SOL at $80.49 grinding toward 36% or ADA at $0.24 waiting for a hard fork. It is a presale at millionths of a cent that raised more than $8 million during extreme fear because wallets found it before the crowd had reason to look.
This entry has a higher ceiling because a working exchange stands behind the token, and analysts project 100x before the confirmed Binance listing opens. The search for the best crypto to buy now was leading to Pepeto all along, and the wallets inside acted on that signal first.
Kentucky House Bill 380 mandated hardware wallet backdoors, forcing manufacturers to assist with seed phrase resets per CoinDesk. The provision destroys the foundation of self custody.
CoinGecko showed the market dropping as fears spread across positions. The best crypto to buy now benefits from this shift because capital seeking safety flows toward audited presales with verified contracts, confirmed listings, and tools that protect every wallet before any transaction clears.
Custody Shift and the Presale the Keyword Search Was Leading To
Pepeto: Risk Scorer and Bridge Live With 100x Before Listing
Protecting capital from threats requires action, not another search. Pepeto, considered the best crypto to buy now, delivers contract checking through the risk scorer, keeping wallets safe from malicious tokens before any position opens, the kind of protection that makes a presale entry worth committing to before listing. This is why searching for another update is the wrong approach when the presale fills and the listing draws closer.
The math proves the conviction. More than $8 million entered at $0.000000186 during extreme fear, and analysts project 100x before the Binance listing. That means presale capital converts into returns that SOL at 36% and ADA at 2x cannot come close to matching from current levels.
This setup is why wallets leave large cap targets for the Pepeto entry. The cross chain bridge moves assets at zero cost keeping capital whole, and PepetoSwap processes zero fee trades. The platform condenses research into seconds through a clean interface where every tool runs and the layout makes finding what matters simple.
The cofounder who created the original Pepe coin turned zero products into $11 billion, SolidProof audited every contract, and a former Binance expert drives the listing. Staking at 189% APY compounds returns while listing approaches, and every round filling means fewer entries remain for the wallets that have not moved yet.
Solana (SOL): $80.49 Recovering From $285M Drift Protocol Exploit
SOL sits at $80.49, down 2.77% on the week after the $285 million Drift exploit per CoinMarketCap. Support at $75, resistance at $88.
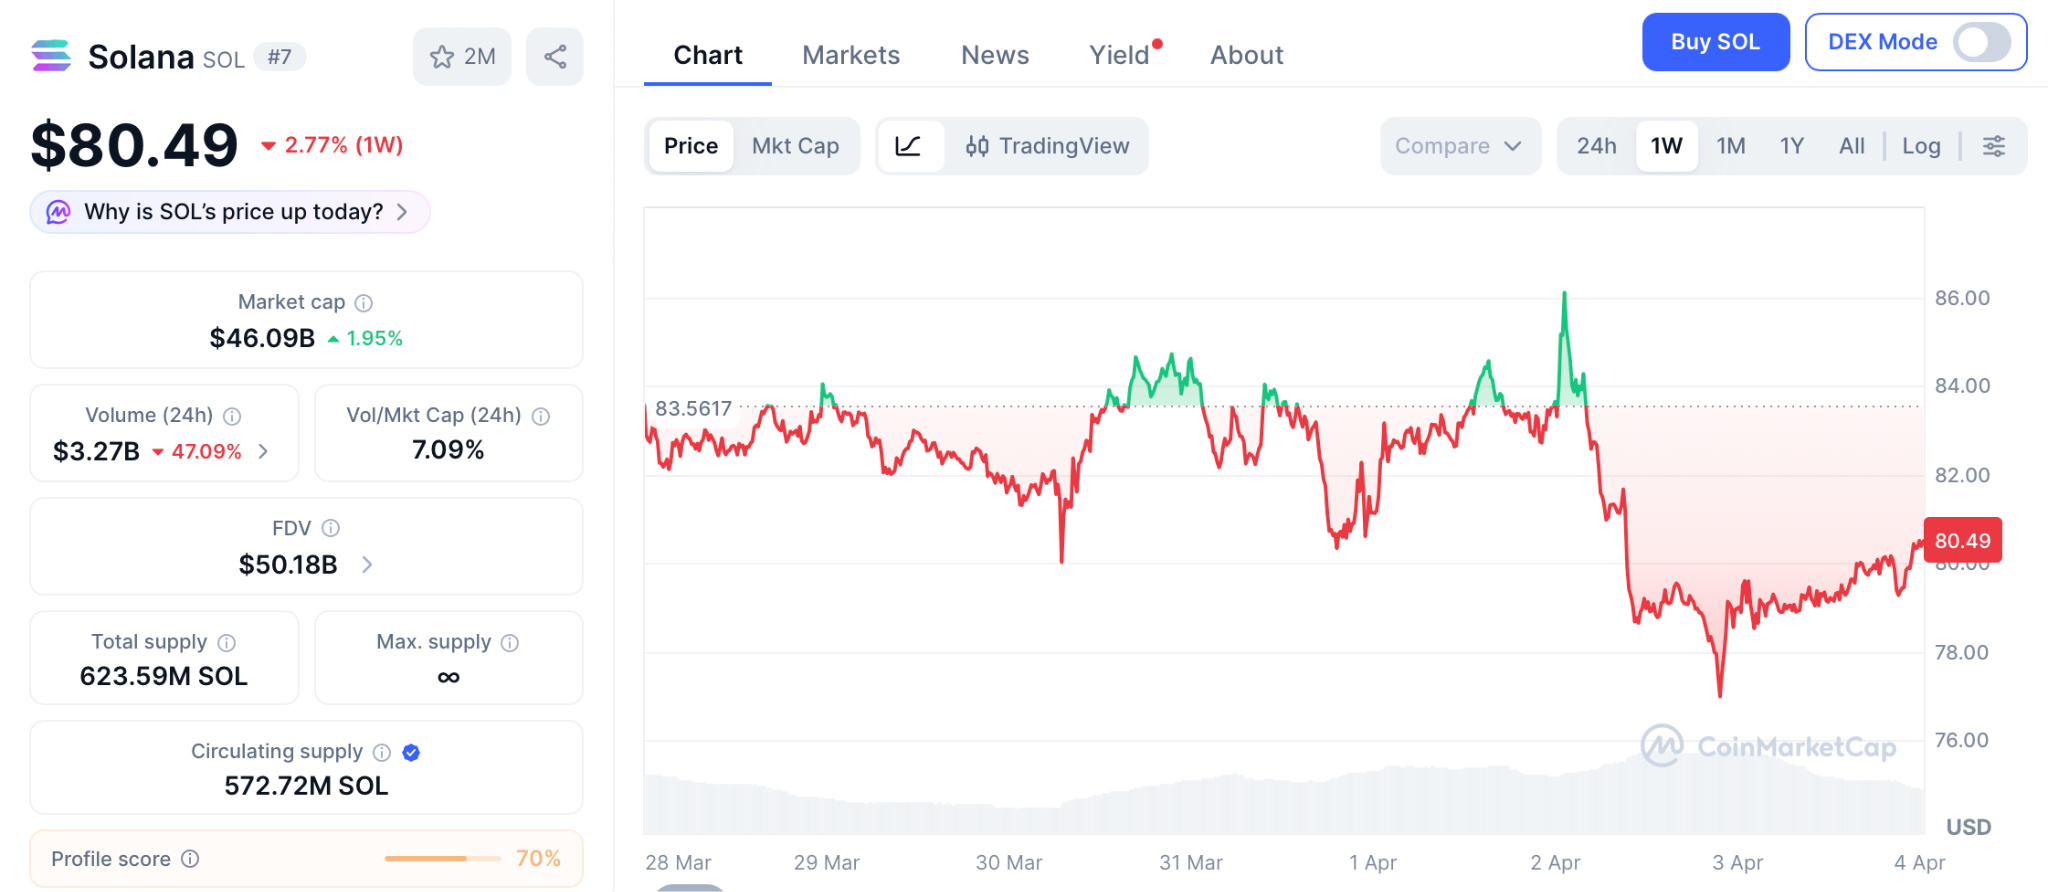
Even $120 delivers 52%, modest next to the presale entry where 100x projections carry a working exchange.
Cardano (ADA): $0.24 Awaits Protocol 11 Governance Overhaul
ADA trades at $0.24 per CoinGecko. Protocol 11 adds on chain governance with the Midnight sidechain.
Even $0.50 delivers 2x from $0.24, a ceiling presale math multiplies past before listing day arrives.
Conclusion: Why the Best Crypto to Buy Now Already Answered the Search
The presale fills right now, making this the best time to enter before the price moves. Another search will not change the outcome for wallets still outside. Early wallets acted before the crowd had reason to look, and the best crypto to buy now has a higher ceiling because a working exchange stands behind the token instead of a whitepaper.
The Pepeto official website shows capital arriving while SOL and ADA debate their next percentage, and entering now means joining the wallets that found the answer before the listing confirms what the capital already proved.
Find the answer at Pepeto before the listing closes the entry the search was leading to.

FAQs
What is the best crypto to buy now in April 2026?
Pepeto leads the best crypto to buy now with a working exchange, risk scorer, and 100x projections before a confirmed Binance listing.
How does the Kentucky bill affect the best crypto to buy now?
The bill threatens custody, making audited presales with verified contracts the safer choice through the Pepeto official website where tools protect positions.
How does the best crypto to buy now compare to SOL and ADA?
SOL and ADA cap returns modestly, while Pepeto offers 100x with working tools, making it the answer the search was leading to.
Disclaimer: This is a Press Release provided by a third party who is responsible for the content. Please conduct your own research before taking any action based on the content.
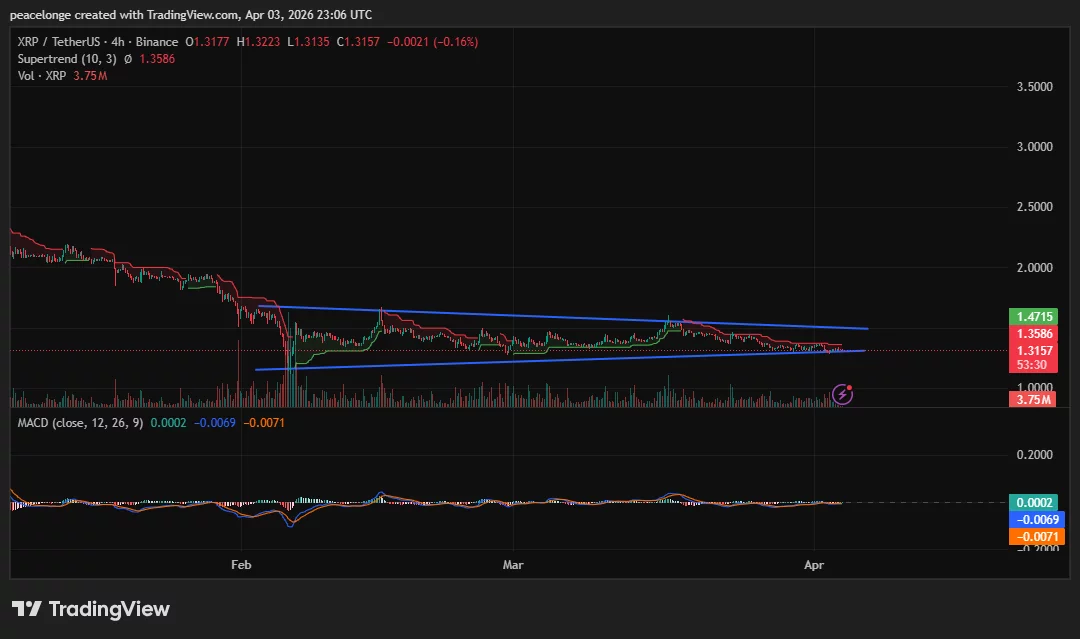
XRP is compressing into the apex of a descending wedge at $1.3157 after months of lower highs and lower lows, with the 4H MACD signal line just crossing into positive territory for the first time since February — a sign that bearish momentum may be approaching exhaustion ahead of what could be the pattern’s most consequential candle close.
Summary
- XRP is trading at $1.3157, pressing against the apex of a descending wedge pattern visible on both the daily and 4H charts, with the daily Supertrend bearish at $1.4894.
- The daily MACD histogram stands at -0.0222, while on the 4H chart the signal line has just crossed marginally into positive territory, signalling that bearish momentum is approaching exhaustion ahead of the wedge resolution.
- A confirmed daily close above $1.47 targets $1.50 and a potential challenge of $1.60, while a break below $1.27 risks an acceleration toward $1.14.
XRP (XRP) is trading at $1.3157 on April 3, 2026, down 0.33% on the day and compressing near the apex of a descending wedge pattern that has formed across both the daily and 4H timeframes since February. The Supertrend indicator on the daily chart sits at $1.4894, in red above price, confirming the prevailing bearish regime. Yet the formation itself is a structure that technical analysts typically associate with bullish reversal potential when it emerges at the end of a prolonged downtrend, provided the lower trendline holds.
On the daily chart, two converging trendlines are clearly visible: a descending upper resistance line and a slightly rising lower support line. Price at $1.3157 is nearing the apex, with the most recent daily low printed at $1.3033. The daily MACD shows a histogram of -0.0222, with the MACD line at -0.0287 below the signal at -0.0065. The reading remains bearish, but the histogram has been contracting, a sign that selling pressure is gradually fading.

On the 4H chart, the same wedge structure is intact. The upper descending trendline aligns with the 4H Supertrend at $1.3586, and the lower rising trendline has provided support on each test since early February. Critically, the 4H signal line has crossed marginally into positive territory at 0.0002, while the MACD line at -0.0069 is approaching zero from below. A full bullish MACD crossover has not yet occurred, but the convergence at near-zero is an early signal of bearish exhaustion.
Key Levels, Price Targets, and Invalidation
Bull case: a daily close above the descending wedge resistance near $1.47 would confirm the breakout, initially targeting $1.4894, the Supertrend level, then $1.50. Above that, $1.60 is the key structural zone where the broader descending channel from July 2025 would be meaningfully challenged. Technical analyst Ali Martinez noted on X (formerly Twitter) that XRP “could offer a short-term buying opportunity” within its multi-year ascending triangle structure at current levels, though he also identified a potential further decline of approximately 30% before a sustained long-term recovery becomes likely.
Bear case: a daily close below $1.27 would break the wedge support and expose XRP to $1.14, the conservative channel breakdown target. A dense supply cluster of approximately 19.6 million XRP is concentrated between $1.27 and $1.28, per Coinglass cost-basis data, making this the most critical demand zone to defend.
Invalidation of the bull case: a daily close below $1.27. Invalidation of the bear case: a daily close above $1.47.
On-Chain and Derivatives Context
U.S. spot XRP ETF monthly inflows turned negative in March 2026 for the first time since the products launched in November 2025, according to SoSoValue data, removing a structural buy-side catalyst that had underpinned price through Q1. XRP open interest across all exchanges now sits near $2.45 billion, down approximately 73% from the September 2025 peak, as detailed in prior crypto.news coverage.
Funding rates have shifted to a positive 0.008%, suggesting fresh long positions are entering near current levels. However, the six-to-twelve month holder cohort has begun trimming positions since March 27, reducing a layer of structural support precisely as the wedge reaches its apex.
As crypto.news has covered, recovery attempts have repeatedly stalled below descending resistance, and the pattern remains intact until buyers produce a decisive daily close above the wedge’s upper trendline. With the 4H signal line at zero and the apex approaching, the next directional candle carries outsized weight.
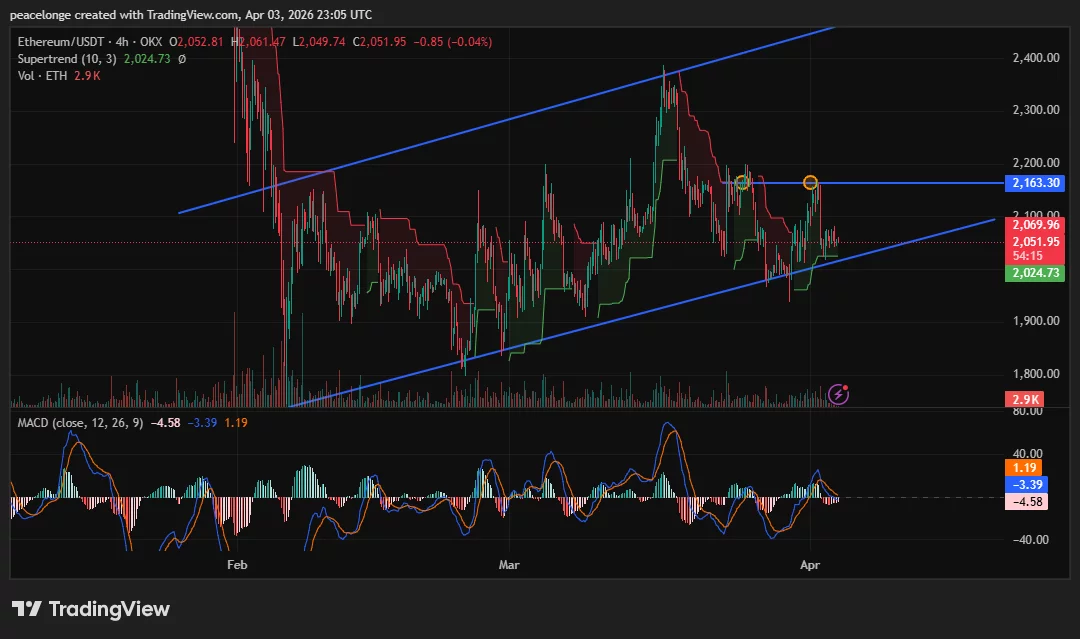
Ethereum is pressing against a double-top resistance zone at $2,163 after two consecutive rejections from the upper boundary of its rising parallel channel, while a marginal bullish MACD crossover on the 4H chart raises the question of whether buyers can finally break through or whether the pattern will resolve to the downside toward $1,980.
Summary
- Ethereum is trading at $2,051.80, holding inside a rising parallel channel on both the daily and 4H timeframes after twice rejecting from the $2,163-$2,166 resistance zone.
- The 4H MACD histogram has just turned positive to 1.19, signalling a bullish crossover, while the daily Supertrend at $1,980.92 remains green, indicating the broader trend structure has not yet broken.
- A confirmed daily close above $2,166 targets $2,250-$2,300, while a loss of $2,024 Supertrend support opens the door to $1,980 and potentially $1,900.
Ethereum (ETH) is trading at $2,051.80 on April 3, 2026, holding inside a rising parallel channel that has been intact since the February lows. Two consecutive rejection candles at the $2,163-$2,166 zone, marked clearly on both the 4H and daily charts, have created a double-top structure at the channel’s upper boundary. With $6.3 billion in Ethereum options having expired today and CME futures offline for Good Friday, traders face a thin-liquidity weekend that could amplify any directional move.
On the 4H chart, Ethereum is trading between the channel’s lower support near $2,024 and the upper resistance at $2,163. The 4H Supertrend at $2,024.73 is still green, confirming the short-term trend has not flipped bearish. More notably, the 4H MACD histogram has just crossed into positive territory at 1.19, with the MACD line at -3.39 crossing above the signal line at -4.58. This is a marginal but technically meaningful bullish crossover, the first since mid-March.

On the daily chart, the picture is more cautious. The MACD histogram sits at -7.33, with the MACD line at -11.11 still below the signal at -3.78. The daily Supertrend at $1,980.92 remains green, meaning the daily trend has not broken bearish. Two orange markers on the chart precisely identify the double-top rejection zone at $2,163-$2,166. A daily close above $2,166 would invalidate the double-top and confirm the rising channel’s upper trendline as the next target.
Key Levels, Price Targets, and Invalidation
Support is layered at $2,024 (4H Supertrend) and $1,980 (daily Supertrend). A daily close below $1,980 would flip the daily Supertrend bearish and break the rising channel structure that has defined price since February, opening a move toward $1,900 as the next major floor.
Resistance: the $2,069 area (the 4H Supertrend upper band visible on the chart) acts as a near-term ceiling, then the double-top zone at $2,163-$2,166. A clean daily close above $2,166 targets $2,250 initially, with $2,300-$2,400 as the broader bull case if the channel’s upper trendline is the objective.
Invalidation for the bullish channel thesis: a 4H close below $2,024 Supertrend support. Invalidation for the bearish double-top thesis: a daily close above $2,200.
Options Expiry and Macro Context
Approximately $6.3 billion in Ethereum options expired on April 3, according to data from Deribit, with spot price trading near the max pain zone for the expiry. Analysts at AnalyticsInsight noted the event is “more like a routine settlement than a major turning point,” given price proximity to max pain, limiting the probability of an expiry-driven spike in either direction.
As crypto.news reported, Ethereum fell 3.4% toward the $2,000 support on April 2 during the broader market selloff tied to U.S.-Iran escalation and the $285 million Drift Protocol exploit on Solana. The fact that the 4H Supertrend held at $2,024 through that sell event is a meaningful signal of buyer resilience at that level.
A sustained hold above $2,024 heading into next week, particularly with the 4H MACD histogram staying positive, would be the first concrete signal that bulls are retaking short-term control. If $2,024 fails, the double-top breakdown and a move toward $1,900 become the primary scenario to watch.


United States President Donald Trump took credit for an unprecedented attack on the Ghadir Bridge, Iran’s largest bridge, as continued geopolitical tensions kept crypto markets suppressed.
Summary
- Trump claimed responsibility for a strike on Iran’s Ghadir Bridge and warned of further attacks if negotiations fail.
- Escalation fears weighed on crypto markets, with Bitcoin dropping from $67,376 to $66,345 following the announcement.
On April 2, Trump shared a video of part of the newly built 136-metre-high cable-stayed bridge between Tehran and Karaj collapsing.
“The biggest bridge in Iran comes tumbling down, never to be used again,” he wrote on Truth Social, and warned that there would be “much more to follow” if Iran doesn’t negotiate.
“Our Military, the greatest and most powerful (by far!) anywhere in the World, hasn’t even started destroying what’s left in Iran. Bridges next, then Electric Power Plants! New Regime leadership knows what has to be done, and has to be done, FAST!” Trump said in a later post.
The latest attack comes just a day after Trump vowed to hit Iran “extremely hard” over the next two to three weeks. The president also reiterated his threat to destroy Iran’s power plants.
“We are going to hit each and every one of their electric generating plants very hard and probably simultaneously,” and has since doubled down after the latest strike.
Trump also added that a new nuclear deal is “nearing completion,” but authorities in Iran have denied that official talks are underway and have vowed to launch a “devastating” retaliation.
Japan’s Nikkei 225 rose 1.28%, while South Korea’s Kospi climbed 2.91%, moving alongside the S&P 500, which erased its 1.1% intraday loss to close up 0.11% on reports that senior Iranian diplomat Kazem Gharibabadi was drafting a protocol with Oman to oversee transit in the Strait of Hormuz.
Bitcoin was also recovering from recent lows near $65,000, but the bullish euphoria was short-lived as news of attacks saw the flagship crypto falling from an intraday high of $67,376 to $66,345 within hours after the Truth Social post.
If no deal is reached between the two nations, the flagship crypto risks falling below the $65,000 mark, which has been acting as a major support level over the past months.
Losing this level would likely confirm a bearish structural breakdown and could weigh heavily on the broader market.


Bitcoin miner Riot Platforms sold a sizeable portion of its holdings in the first quarter, offloading 3,778 BTC as crypto firms navigated a tough market environment.
Summary
- Riot Platforms sold 3,778 BTC in Q1 for about $289.5 million at an average price of $76,626.
- The company mined 1,473 BTC during the quarter and held 15,680 BTC on its balance sheet at the end of Q1.
According to its Thursday operational update, the company sold the Bitcoin at an average price of $76,626, generating about $289.5 million in proceeds. At the time of writing on April 3, Bitcoin was trading near $66,867, placing those sales above current levels.
Riot mined 1,473 BTC in the quarter and held 15,680 BTC at the end of Q1. Data from Arkham Intelligence also showed a 500 BTC outflow from a wallet linked to the miner earlier in the week.
Riot’s latest sale adds to a growing list of crypto firms that have shed Bitcoin holdings in recent months. Over the past week, companies including MARA Holdings, Genius Group, and Nakamoto Holdings disclosed combined sales of 15,501 BTC.
Selling pressure has been building across the market. Data from CryptoQuant showed Bitcoin’s apparent demand falling to negative 63,000 BTC by late March, indicating that distribution has outweighed accumulation in recent weeks.
Institutional buying, however, has not fully stepped back. Strategy purchased 44,377 BTC in March, accounting for 94% of all acquisitions by public companies during the month.
In Japan, Metaplanet added 5,075 BTC for about $398 million in Q1, bringing its total holdings to 40,177 BTC.
Ongoing tensions in the Middle East have kept risk appetite in check, weighing on both traditional and digital assets. Bitcoin continues to trade under pressure in that environment, with prices sitting more than 46% below their all-time high as of April 3.

C Cambodia’s parliament has advanced a new criminal framework aimed at curbing scam operations that use online schemes, including those tied to cryptocurrency, to defraud victims. On Friday, the Senate unanimously approved the draft law with a 58-0 vote, though it still requires the king’s signature to become law. The proposed legislation would introduce criminal rules designed to close gaps in existing statutes and strengthen enforcement against fraud tied to digital and tech-enabled schemes.
The Senate’s Friday notice stressed that the bill seeks to fill gaps in the current legal framework, addressing risks that strike at social security, the economy, and citizens’ wellbeing, and that could tarnish Cambodia’s international reputation. It also highlighted the aim to enhance the effectiveness of fighting fraud through technological means and to bolster cooperation in combating these crimes.
Key takeaways
- Parliamentary action: Cambodia’s Senate approved the draft cybercrime bill unanimously (58 votes in favor) and sent it toward the king for royal assent, a prerequisite for enactment.
- Stricter penalties: The bill would impose prison terms ranging from two to five years and fines up to $125,000 for specified offenses, with penalties doubling if the offense involves a gang or targets multiple victims.
- Broader mandate: The legislation is pitched as filling gaps in current laws and strengthening the state’s ability to counter technology-enabled fraud and scams, including those linked to crypto schemes.
- Context of rising enforcement: The move comes amid a wider international push against scam operations in Southeast Asia, including sanctions and extradition actions by other countries against Cambodia-linked operators.
- Regulatory backdrop: The measure aligns with growing concern over scam compounds described by international bodies and echoed in U.S. and U.N. reporting about trafficking and exploitation linked to fraud centers in the region.
Cambodia’s cybercrime bill in a regional enforcement frame
The parliamentary action comes amid heightened scrutiny of scam operations that leverage digital platforms and crypto-related narratives to lure victims. The law’s authors argue that clarifying criminal rules is essential to address evolving fraud methods and to safeguard public security and order. The bill’s proponents also point to enhanced cross-border cooperation as a key outcome of a more robust statutory framework.
Observers note this is part of a broader regional pattern. Earlier this year, UK authorities sanctioned Cambodia-based scam operations and moved to sever ties between illicit actors and legitimate crypto ecosystems. Separately, Cambodia’s national assembly had already advanced the bill on March 30, with all 112 members voting in favor, signaling a unified stance on tightening controls around fraud and cybercrime. The international attention surrounding Cambodia’s crackdown includes coverage of extradition actions and ongoing law-enforcement cooperation with neighboring jurisdictions.
What scam compounds look like—and why this matters for crypto
Criminal networks operating scam compounds in parts of Southeast Asia have drawn particular concern for their concentrated, facility-based models. A 2024 UN News report described several compounds as large-scale operations where residents were housed in self-contained facilities designed so workers could remain on-site for extended periods. In such centers, individuals are trafficked, held against their will, and exposed to violence, with daily life arranged to keep them inside the compound for lengthy durations. The report underscored that residents often perform the core scam work while being isolated from the outside world.
These dynamics have direct implications for how authorities view digital-asset-related fraud. By targeting the underlying infrastructure and organizational models that enable such schemes, the Cambodian bill signals a willingness to tackle the infrastructure that allows high-volume fraud to persist. The combination of a strengthened legal framework and international pressure could influence how crypto-related services, exchange activities, and promoter networks operate within Cambodia and across the region.
Context for investors and builders is nuanced. On one hand, tougher penalties and clearer offenses can reduce systemic fraud risk and improve trust in legitimate blockchain ventures. On the other hand, a stricter regulatory environment may raise compliance costs for legitimate crypto businesses and require heightened transparency around token offerings, marketing practices, and customer due diligence. Market participants should monitor not only royal assent but also any implementing regulations that would spell out which specific acts fall under the new offenses and how penalties are calculated in practice.
Implications for the crypto ecosystem and regional policy signals
Beyond Cambodia’s borders, the episode sits within a wider wave of policy action against crypto scams tied to fraud centers and “compound” operations in Southeast Asia. The UK’s sanctions actions and related enforcement dynamics reflect heightened international appetite to disrupt networks that blend traditional fraud with crypto narratives. In parallel, U.S. and United Nations assessments have repeatedly highlighted the human costs of scam operations and the need for stronger law enforcement and cross-border cooperation. While these reports do not prove causal links to every crypto scheme, they establish a policy climate in which regulators are increasingly wary of technologies that facilitate large-scale deception and exploitation.
For market participants, the developing Cambodian framework represents a reminder of the ongoing regulatory risk landscape in the region. Firms offering crypto services or engaging in crypto-adjacent activity may need to adapt compliance programs, ensure clear disclosures, and maintain robust governance to withstand scrutiny under new cybercrime provisions. The law’s passage, still pending royal assent, will be watched for how it defines the scope of “technological systems” used to fight fraud and how agencies will enforce the new rules in a rapidly evolving digital landscape.
As regulators in Cambodia and neighboring jurisdictions refine their approaches to cybercrime, investors and developers should stay alert to any forthcoming implementing guidelines, definitions of covered offenses, and enforcement priorities. The balance between protecting users and enabling legitimate innovation will likely shape regulatory posture in the months ahead, particularly for projects that intersect with online scams or are perceived as cryptoeconomic platforms.
What remains uncertain is the exact content of the royal assent and any subsequent regulations that will operationalize the draft law. Readers should watch for official statements from the Cambodian government and for updates on how enforcement bodies intend to apply the new provisions to real-world cases, including crypto-related scams that traffickers may attempt to reframe as legitimate business plans.
In the near term, observers will be looking for any new measures that detail how authorities will pursue offenders, whether additional cybercrime statutes will be expanded, and how cross-border cooperation will be structured to dismantle scam networks that span multiple jurisdictions. The Cambodian move underscores a broader trend: regulators are increasingly willing to use criminal law to counter sophisticated, tech-enabled fraud, with potential ramifications for the region’s crypto industry and its participants.


SlowMist finds no key leaks in OKX Web3 wallet, but BOM-style malware and compromised devices keep user-side security the weak link.
Summary
- SlowMist says OKX Web3 Wallet does not transmit private keys or mnemonics to external servers.
- Core wallet credentials are processed locally, as OKX stresses its self-custody design amid rising malware attacks.
- The audit follows SlowMist’s February 2026 review of Binance Wallet and comes after BOM malware stole over $1.82 million from more than 13,000 wallets.
Blockchain security firm SlowMist has issued a new assessment of OKX’s Web3 wallet, concluding that the audited version “shows no behavior transmitting private keys or mnemonic phrases to external servers,” with “no sensitive data leakage risk” identified in its analysis. According to OKX’s own security white paper, the wallet’s underlying system is designed so that “the user’s mnemonic and private key related information are all encrypted and stored locally on the user’s device,” reinforcing its self-custodial model. The findings arrive as wallet security concerns escalate across the industry, and just months after a malicious BOM app was found to have drained over $1.82 million from at least 13,000 crypto wallets by stealing users’ keys.
SlowMist said its security team used a mix of automated tooling and manual reviews “from an attacker’s perspective” to probe OKX Wallet’s code and traffic, similar to the methodology it recently applied in a comprehensive audit of Binance Wallet announced by Binance on X in early February 2026. In that earlier review, SlowMist “conducted an in-depth security audit through manual analysis and automated tools,” with Binance saying the exercise aimed to “ensure the highest level of security” for users managing digital assets.
OKX founder and CEO Star Xu has repeatedly argued that recent wallet incidents stem from compromised user devices, not flaws in the OKX Web3 wallet itself. “The risk originates from compromised user devices rather than the OKX Web3 wallet,” Star said in March, emphasizing that private keys and passwords are “stored only on user devices,” making endpoint hygiene critical. OKX also notes its Web3 stack has been audited by firms including CertiK, Hacken and SlowMist and hardened through a bug bounty program, framing third‑party reviews as part of a layered defense strategy.
The renewed scrutiny follows a joint investigation in February 2025, when SlowMist and OKX Web3 Security disclosed that a fake app called BOM had “secretly accessed users’ private keys and mnemonic phrases,” ultimately stealing “over $1.82 million in crypto” from victims across Android and iOS. SlowMist tracked one primary hacker address siphoning funds from more than 13,000 wallets, moving assets such as Tether (USDT), Ethereum (ETH), Wrapped Bitcoin (WBTC) and Dogecoin (DOGE) across BNB Chain, Ethereum, Polygon, Arbitrum and Base. In a separate report, the firm warned that private key leaks, phishing and fraud schemes remained key weak points, after its MistTrack team logged 467 stolen fund cases and froze roughly $20.66 million in just one quarter.
SlowMist has cautioned that even well‑designed wallets can become vulnerable when users install Trojanized apps or grant excessive permissions, allowing attackers to “scan and collect media files” and exfiltrate mnemonic phrases or key backups. OKX and SlowMist jointly urged users to avoid storing seed phrases via screenshots, photos or cloud services and instead rely on offline methods such as paper backups or hardware wallets.
Within this context, the latest OKX Wallet assessment is being framed as a trust signal rather than a guarantee, underscoring that infrastructure audits and self‑custody designs must still be paired with basic operational security on the user side. As SlowMist’s broader analysis shows, fake wallets, compromised devices and social engineering remain among the most efficient ways for attackers to turn even the strongest wallet architectures into exploitable weak links.


Disclosure: The views and opinions expressed here belong solely to the author and do not represent the views and opinions of crypto.news’ editorial.
Eight years ago, on April 29, 2018, quoting a crypto industry founder, Dr. Emin Gun Sirer, I wrote about Ethereum’s (ETH) decentralized nature, which qualified ETH as a commodity for US law purposes.
The regulatory uncertainty, regarding whether ETH [and other digital assets] is classified as securities or commodities, has historically been a primary barrier to institutional capital adoption since it created legal risks, complicated custody, and hampered compliance, causing investors to hold back in investing.
Summary
- SEC and CFTC issued a joint memorandum formally classifying most decentralized digital assets, including Ethereum, as commodities under US law.
- The framework shifts oversight toward the CFTC and signals a move away from enforcement-driven regulation toward clearer, principles-based guidance.
- Regulatory clarity is expected to ease compliance concerns and open the door for greater institutional participation in crypto markets.
Two months after I wrote my article on June 14, 2018, former SEC Director of Corporation Finance William Hinman clarified in a speech that, based on the decentralized nature of the Ethereum network, current offers and sales of Ether (ETH) were not securities transactions. This signaled that ETH functioned more like a commodity than a security, reducing regulatory uncertainty and providing temporary regulatory clarity on its legal classification.
Nevertheless, in the absence of authoritative regulatory certainty from the SEC or the Commodity Futures Trading Commission (CFTC), lawsuits challenged whether ETH [and other digital assets] was a regulated security or a commodity.
Lawsuits in 2023–2024, including actions against KuCoin by the New York Attorney General (NYAG) and SEC actions involving liquid staking providers, highlighted significant regulatory uncertainty regarding whether ETH and staking services constitute securities. While early cases suggested a security classification, subsequent 2025 developments indicated a shift toward treating staking as “ministerial” and not securities, impacting the classification of ETH-related assets.
The SEC & CFTC Issued a Memorandum of Understanding (MOU)
Eight years after I wrote my article concerning the classification of ETH for US law purposes, on March 11, 2026, and the subsequent joint interpretation on March 17, 2026 the SEC and CFTC finally issued a landmark MOU providing the most comprehensive regulatory clarity for digital assets to date resolving the uncertainty surrounding ETH [and other digital assets], with U.S. regulators formally classifying it as a commodity, overcoming the primary barrier to institutional adoption that existed in 2018.
The guidance marked a shift from “regulation by enforcement” to a principles-based framework, explicitly stating that most digital assets are not themselves securities. This provided regulatory clarity, placing these digital assets under the jurisdiction of the CFTC as opposed to the SEC, allowing them to be listed on designated contract markets for derivatives trading.
The CFTC has indicated a willingness to treat tokens as commodities if they are truly decentralized and not managed by a central party. The agencies define a decentralized system as one that “functions and operates autonomously with no person, entity, or group of persons or entities having operational, economic, or voting control”. The framework acknowledges that tokens initially sold as part of an investment contract (security) can transition into a digital commodity once the network becomes sufficiently decentralized or functional.
Digital Commodities: Digital assets intrinsically linked to a functional system are commodities, with 16 digital assets classified as commodities that represent a significant shift from previous stances that often treated many of these digital assets as securities.
As of late March 2026, these 16 tokens collectively represent approximately 78% to 80% of the total cryptocurrency market capitalization. As of early 2026, there are over 37 million unique cryptocurrencies and digital tokens created, according to The Motley Fool.
However, only about 10,000 to 17,000 are considered active or actively tracked on major platforms like CoinGecko, with a high percentage of the total being inactive, scams, or “dead coins”. The vast majority of this share is held by BTC and ETH, which together account for nearly 70% of the entire market.
The remaining 14 tokens contribute a combined share of roughly 8% to 10%.
- Bitcoin (BTC)
- Ethereum (ETH)
- Solana (SOL)
- XRP (XRP)
- Cardano (ADA)
- Chainlink (LINK)
- Avalanche (AVAX)
- Polkadot (DOT)
- Hedera (HBAR)
- Litecoin (LTC)
- Dogecoin (DOGE)
- Shiba Inu (SHIB)
- Tezos (XTZ)
- Bitcoin Cash (BCH)
- Aptos (APT)
- Stellar (XLM)
Based on the MOU, native tokens that are intrinsically linked to a functional, decentralized crypto system—such as those used for “gas” (transaction fees) or governance—generally do not meet the definition of an investment contract under the Howey test and are not securities.
Xin Yan, Co-Founder and CEO of Sign, said, “The global impact of SEC and CFTC instituting a landmark joint regulatory framework is a positive one. It gives a green light to trillions of institutional capital that’s been sitting on the sidelines. I can see a lot of projects moving past the “Wild West” phase.
Digital Collectibles: The MOU issued by the SEC and CFTC significantly impacts the NFT collectible market by creating a “token taxonomy” that generally treats digital collectibles as non-securities. Digital collectibles that are fractionalized (providing fractional ownership in one asset) or structured with an expectation of profit from others’ managerial efforts may still be deemed securities.
The SEC’s 2026 interpretation clarifies that standard creator royalties do not, by themselves, transform a digital collectible into a security. However, if an NFT is marketed with promises of passive income or profits derived from the seller’s ongoing management, it could still be considered part of an investment contract (a security).
This guidance offers a path to a more stable NFT market. While the era of speculative profile picture NFT hype has subsided, more NFTs are being listed with a focus on utility, real-world assets (RWAs), brand engagement, and sports betting.
Digital Tools: Assets with functional utility, such as membership tokens or digital credentials; these are not securities.
Stablecoins: Payment stablecoins issued under the GENIUS Act are excluded from the definition of a security.
The Stablecoin market capitalization hit a record $320 billion in March, with FATF’s report quoting Chainalysis flagging that stablecoins accounted for 84% of illicit virtual asset transaction volume in 2025, often involving unhosted wallets and complex laundering techniques designed to obscure fund origins.
Xin Yan, Co-Founder and CEO of Sign—a Singapore-based firm building sovereign digital currency infrastructure—suggests that the Federal Reserve’s hesitation to issue a Central Bank Digital Currency (CBDC) before 2031, despite 49+ CBDC global pilot projects, creates a scenario where “the Fed is not directly competing with private stablecoins, while the slow U.S. CBDC adoption means U.S. commercial banks maintain control of the financial system rather than being disintermediated by a retail CBDC and continue to dominate the domestic financial market.” Yan argues that “the world is dividing into different camps.”
The CBDC vs. Stablecoin with China pushing its e-CNY (a CBDC) to enhance state control, while the U.S. leans towards pushing stablecoins to maintain dollar dominance”, a move seen as a defense against China’s potential challenge to the US-dominated payment system.
Digital Securities: Tokenized traditional financial instruments; these remain securities regardless of their on-chain format.
Safe Harbors for Blockchain Activities
The joint interpretation confirms that several foundational activities generally do not involve securities transactions:
Protocol Mining: Proof-of-work validation and mining pool participation.
Protocol Staking: Proof-of-stake validation, including custodial and liquid staking, provided service providers act in an administrative capacity.
Wrapping: Depositing assets for one-to-one redeemable tokens across chains.
Airdrops: Distributions where recipients provide no consideration (money or services) in exchange.
Coordination of Digital Asset Legislation and its impact on Tokenization
The regulatory landscape for digital assets in the US has undergone a historic transformation, characterized by the enactment of the GENIUS Act (July 18, 2025) and a landmark joint interpretation and memorandum of understanding (MOU) between the SEC and CFTC.
This shift, supported by the pending CLARITY Act, marks a definitive end to a decade of “turf wars” over digital asset jurisdiction, aims to stabilize markets, and has initiated a “re-onshoring” of crypto activity to the United States which represents the world’s largest cryptocurrency market, commanding roughly 23.6% of global crypto revenue in 2025 and will accelerate tokenization of financial markets.
Wojciech Kaszycki, CSO of BTCS SA — (formerly Vakomtek S.A.) is a Polish technology company headquartered in Warsaw, recognized as Europe’s first dedicated Digital Asset Treasury Company (DATCO) — believes “The regulatory clarity provided by the SEC and CFTC is a step in the right direction. It will speed up tokenization of the global financial markets to allow for fractional ownership of expensive, traditionally restricted world assets like private credit, real estate, and infrastructure to bring liquidity, pricing to illiquid assets. Tokenization will make investing easier, thereby helping more people build long-term financial security and share in economic growth.”
As of early April 2026, the digital asset market is experiencing significant volatility, with Bitcoin trading around $65,000–$69,000 following a “double shock” from Middle East geopolitical tensions and broader risk-asset sell-offs. Amidst this, projects focused on Artificial Intelligence (AI) and Real-World Asset (RWA) tokenization have shown notable resilience, often outperforming the broader market. Mirroring the world’s largest asset manager, BlackRock CEO Larry Fink’s commitment to tokenized funds positions the technology as the “next generation for markets”.
In his 2026 Chairman’s Letter to Investors, Larry Fink compared the current state of tokenization to the internet in 1996, arguing that it will fundamentally “update the plumbing” of the global financial system. Fink argued that tokenization will fundamentally transform TradFi by making investing faster, cheaper, and more accessible, directly impacting how ownership is recorded and traded.
About the Author:
Selva Ozelli Esq, CPA is an international digital asset legal expert and author of Sustainably Investing in Digital Assets Globally. Her writings are translated into 45 languages and republished in over 200 global publications. She is recognized as an expert media/TV commentator on global digital asset regulation, tax and technology matters.
Disclosure: The views and opinions expressed here belong solely to the author and do not represent the views and opinions of crypto.news’ editorial.

Bitcoin is holding just above a broken support level at $66,900 as a potential bear flag forms on the 4H chart and the daily MACD hits one of its most negative readings of the current cycle, raising the risk of a move toward $63,000 heading into a low-liquidity Good Friday weekend.
Summary
- Bitcoin is trading at $66,891, holding just above a broken $66,188 support level after selling off from a March peak near $76,000.
- The 4H chart shows a small ascending channel forming within the downtrend, a structure that could represent a bear flag, while the daily MACD histogram stands at -639, one of its most extreme negative readings in the current cycle.
- A failure of the $65,549 Supertrend support targets $63,000, while a confirmed daily close above $68,400 would be the first signal of short-term relief.
Bitcoin (BTC) is trading at $66,891 on April 3, 2026, holding just above what was previously a horizontal support level at $66,188 after declining from a March high near $76,000. The daily Supertrend indicator sits at $74,093, positioned well above the price in red, confirming the dominant bearish regime. Volume on the daily chart spiked sharply during the most recent leg lower, a pattern broadly consistent with forced selling rather than orderly distribution.
On the 4H chart, price has formed a small ascending channel since the most recent intraday low, with the current close near $66,891 printing just above the 4H Supertrend support at $65,549. This short-term structure appears tentatively constructive on the 4H, but it sits inside a much larger downtrend, raising the probability that it is a bear flag rather than a genuine reversal.
A bear flag is a brief, shallow recovery that forms within a downtrend before the next leg lower. The 4H ascending channel on the Bitcoin chart fits this description: price is recovering at a modest angle, and the MACD histogram on the 4H remains deeply negative at -169, with the MACD line at -203 compared to a signal of -33. There is no bullish crossover on the 4H MACD, and the histogram continues to expand in the red.
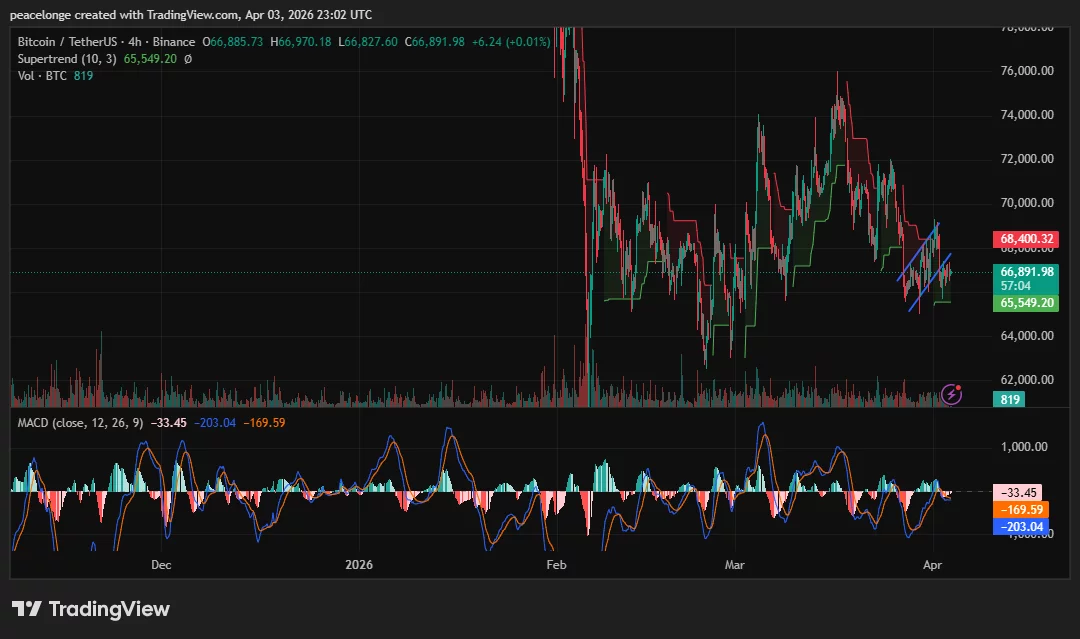
On the daily chart, the MACD readings are more extreme. The MACD line stands at -862 against a signal of -223, producing a histogram of -639. Investtech’s technical assessment for April 3 notes that Bitcoin “has broken the floor of the rising trend channel in the short term” and broken through support at $67,300, concluding that “this predicts a further decline.” The 50-day SMA at approximately $69,089 and the 200-day near $70,280 both sit above current price in declining trajectories, providing stacked resistance on any attempted recovery.
Key Levels, Price Targets, and Invalidation
Immediate support sits at $65,549, the current 4H Supertrend reading. A 4H close below this level would likely accelerate the move toward $63,000-$64,000, the next major support region from early 2026 price history. A deeper breakdown below $60,490 targets $54,000, according to technical analysis published by CoinDCX.
Resistance to the upside: the broken $66,188 level is now a resistance flip. The upper boundary of the 4H ascending channel near $68,400, which also aligns with the 4H Supertrend bear line, is the first meaningful ceiling. A confirmed daily close above $68,400 would neutralize the bear flag thesis and open a relief rally toward $70,000.
Options Expiry and Market Context
Around 27,600 Bitcoin options contracts expired on April 3 with a notional value near $1.8 billion and a max pain level of $68,000, according to data from Coinglass. The put/call ratio near 0.55 shows slightly more calls than puts expiring, but with price trading below max pain, an options-driven bounce faces an uphill battle.
As crypto.news reported, Bitcoin fell over 4% to $66,250 on April 2 as escalating U.S.-Iran tensions pushed oil above $100 and triggered more than $420 million in leveraged liquidations across the market. CME futures are closed today for Good Friday, removing institutional demand and liquidity at a critical juncture.
CoinDCX’s research team noted that “a sustained daily close of the $67,500 support zone” is required for a 5-7% April recovery toward $72,000 to remain viable. A failure to reclaim that level into next week, combined with the deeply negative daily MACD, places $63,000 as the most likely next directional target.
Form 13D/A The New Germany Fund For: 3 April
2026 Augusta National Women’s Amateur Saturday TV coverage
In Chiles V. Salazar The Supreme Court Issues A Bad Good First Amendment Decision


-

 NewsBeat1 day ago
Steven Gerrard disagrees with Gary Neville over ‘shock’ Chelsea and Arsenal claim | Football
-

 Business1 day ago
No Jackpot Winner and $194 Million Prize Rolls Over
-
Entertainment4 days ago
Fans slam 'heartbreaking' Barbie Dream Fest convention debacle with 'cardboard cutout' experience
-

 Fashion7 hours ago
Weekend Open Thread: Spanx – Corporette.com
-

 Crypto World2 days ago
Gold Price Prediction: Worst Month in 17 Years fo Save Haven Rock
-

 Tech5 days ago
The Pixel 10a doesn’t have a camera bump, and it’s great
-
 Entertainment6 days ago
Lana Del Rey Celebrates Her Husband’s 51st Birthday In New Post
-
Crypto World4 days ago
Dems press CFTC, ethics board on prediction-market insider trades
-

 Tech5 days ago
Avatar Legends: The Fighting Game comes out in July and it looks pretty slick
-

 Sports3 days ago
Tallest college basketball player ever, standing at 7-foot-9, entering transfer portal
-

 Tech4 days ago
EE TV is using AI to help you find something to watch
-

 Fashion6 days ago
Amazon Sundays: Soft Spring Layers
-

 Business2 days ago
Login and Checkout Issues Spark Merchant Frustration
-

 Fashion7 days ago
When Evening Dressing Gets Colorful for Spring
-

 Tech6 days ago
Elon Musk’s last co-founder reportedly leaves xAI
-

 Tech4 days ago
How to back up your iPhone & iPad to your Mac before something goes wrong
-

 Tech4 days ago
Apple will hide your email address from apps and websites, but not cops
-

 Politics4 days ago
Should Trump Be Scared Strait?
-

 Crypto World4 days ago
U.S. rule change may open trillions in 401(k) funds to crypto
-

 Tech4 days ago
Flipsnack and the shift toward motion-first business content with living visuals
You must be logged in to post a comment Login