
Crypto World
How to Check My Health with an App? Eight Trending Apps in 2021


by Gonzalo Wangüemert Villalba
•
4 September 2025
Introduction The open-source AI ecosystem reached a turning point in August 2025 when Elon Musk’s company xAI released Grok 2.5 and, almost simultaneously, OpenAI launched two new models under the names GPT-OSS-20B and GPT-OSS-120B. While both announcements signalled a commitment to transparency and broader accessibility, the details of these releases highlight strikingly different approaches to what open AI should mean. This article explores the architecture, accessibility, performance benchmarks, regulatory compliance and wider industry impact of these three models. The aim is to clarify whether xAI’s Grok or OpenAI’s GPT-OSS family currently offers more value for developers, businesses and regulators in Europe and beyond. What Was Released Grok 2.5, described by xAI as a 270 billion parameter model, was made available through the release of its weights and tokenizer. These files amount to roughly half a terabyte and were published on Hugging Face. Yet the release lacks critical elements such as training code, detailed architectural notes or dataset documentation. Most importantly, Grok 2.5 comes with a bespoke licence drafted by xAI that has not yet been clearly scrutinised by legal or open-source communities. Analysts have noted that its terms could be revocable or carry restrictions that prevent the model from being considered genuinely open source. Elon Musk promised on social media that Grok 3 would be published in the same manner within six months, suggesting this is just the beginning of a broader strategy by xAI to join the open-source race. By contrast, OpenAI unveiled GPT-OSS-20B and GPT-OSS-120B on 5 August 2025 with a far more comprehensive package. The models were released under the widely recognised Apache 2.0 licence, which is permissive, business-friendly and in line with requirements of the European Union’s AI Act. OpenAI did not only share the weights but also architectural details, training methodology, evaluation benchmarks, code samples and usage guidelines. This represents one of the most transparent releases ever made by the company, which historically faced criticism for keeping its frontier models proprietary. Architectural Approach The architectural differences between these models reveal much about their intended use. Grok 2.5 is a dense transformer with all 270 billion parameters engaged in computation. Without detailed documentation, it is unclear how efficiently it handles scaling or what kinds of attention mechanisms are employed. Meanwhile, GPT-OSS-20B and GPT-OSS-120B make use of a Mixture-of-Experts design. In practice this means that although the models contain 21 and 117 billion parameters respectively, only a small subset of those parameters are activated for each token. GPT-OSS-20B activates 3.6 billion and GPT-OSS-120B activates just over 5 billion. This architecture leads to far greater efficiency, allowing the smaller of the two to run comfortably on devices with only 16 gigabytes of memory, including Snapdragon laptops and consumer-grade graphics cards. The larger model requires 80 gigabytes of GPU memory, placing it in the range of high-end professional hardware, yet still far more efficient than a dense model of similar size. This is a deliberate choice by OpenAI to ensure that open-weight models are not only theoretically available but practically usable. Documentation and Transparency The difference in documentation further separates the two releases. OpenAI’s GPT-OSS models include explanations of their sparse attention layers, grouped multi-query attention, and support for extended context lengths up to 128,000 tokens. These details allow independent researchers to understand, test and even modify the architecture. By contrast, Grok 2.5 offers little more than its weight files and tokenizer, making it effectively a black box. From a developer’s perspective this is crucial: having access to weights without knowing how the system was trained or structured limits reproducibility and hinders adaptation. Transparency also affects regulatory compliance and community trust, making OpenAI’s approach significantly more robust. Performance and Benchmarks Benchmark performance is another area where GPT-OSS models shine. According to OpenAI’s technical documentation and independent testing, GPT-OSS-120B rivals or exceeds the reasoning ability of the company’s o4-mini model, while GPT-OSS-20B achieves parity with the o3-mini. On benchmarks such as MMLU, Codeforces, HealthBench and the AIME mathematics tests from 2024 and 2025, the models perform strongly, especially considering their efficient architecture. GPT-OSS-20B in particular impressed researchers by outperforming much larger competitors such as Qwen3-32B on certain coding and reasoning tasks, despite using less energy and memory. Academic studies published on arXiv in August 2025 highlighted that the model achieved nearly 32 per cent higher throughput and more than 25 per cent lower energy consumption per 1,000 tokens than rival models. Interestingly, one paper noted that GPT-OSS-20B outperformed its larger sibling GPT-OSS-120B on some human evaluation benchmarks, suggesting that sparse scaling does not always correlate linearly with capability. In terms of safety and robustness, the GPT-OSS models again appear carefully designed. They perform comparably to o4-mini on jailbreak resistance and bias testing, though they display higher hallucination rates in simple factual question-answering tasks. This transparency allows researchers to target weaknesses directly, which is part of the value of an open-weight release. Grok 2.5, however, lacks publicly available benchmarks altogether. Without independent testing, its actual capabilities remain uncertain, leaving the community with only Musk’s promotional statements to go by. Regulatory Compliance Regulatory compliance is a particularly important issue for organisations in Europe under the EU AI Act. The legislation requires general-purpose AI models to be released under genuinely open licences, accompanied by detailed technical documentation, information on training and testing datasets, and usage reporting. For models that exceed systemic risk thresholds, such as those trained with more than 10²⁵ floating point operations, further obligations apply, including risk assessment and registration. Grok 2.5, by virtue of its vague licence and lack of documentation, appears non-compliant on several counts. Unless xAI publishes more details or adapts its licensing, European businesses may find it difficult or legally risky to adopt Grok in their workflows. GPT-OSS-20B and 120B, by contrast, seem carefully aligned with the requirements of the AI Act. Their Apache 2.0 licence is recognised under the Act, their documentation meets transparency demands, and OpenAI has signalled a commitment to provide usage reporting. From a regulatory standpoint, OpenAI’s releases are safer bets for integration within the UK and EU. Community Reception The reception from the AI community reflects these differences. Developers welcomed OpenAI’s move as a long-awaited recognition of the open-source movement, especially after years of criticism that the company had become overly protective of its models. Some users, however, expressed frustration with the mixture-of-experts design, reporting that it can lead to repetitive tool-calling behaviours and less engaging conversational output. Yet most acknowledged that for tasks requiring structured reasoning, coding or mathematical precision, the GPT-OSS family performs exceptionally well. Grok 2.5’s release was greeted with more scepticism. While some praised Musk for at least releasing weights, others argued that without a proper licence or documentation it was little more than a symbolic gesture designed to signal openness while avoiding true transparency. Strategic Implications The strategic motivations behind these releases are also worth considering. For xAI, releasing Grok 2.5 may be less about immediate usability and more about positioning in the competitive AI landscape, particularly against Chinese developers and American rivals. For OpenAI, the move appears to be a balancing act: maintaining leadership in proprietary frontier models like GPT-5 while offering credible open-weight alternatives that address regulatory scrutiny and community pressure. This dual strategy could prove effective, enabling the company to dominate both commercial and open-source markets. Conclusion Ultimately, the comparison between Grok 2.5 and GPT-OSS-20B and 120B is not merely technical but philosophical. xAI’s release demonstrates a willingness to participate in the open-source movement but stops short of true openness. OpenAI, on the other hand, has set a new standard for what open-weight releases should look like in 2025: efficient architectures, extensive documentation, clear licensing, strong benchmark performance and regulatory compliance. For European businesses and policymakers evaluating open-source AI options, GPT-OSS currently represents the more practical, compliant and capable choice. In conclusion, while both xAI and OpenAI contributed to the momentum of open-source AI in August 2025, the details reveal that not all openness is created equal. Grok 2.5 stands as an important symbolic release, but OpenAI’s GPT-OSS family sets the benchmark for practical usability, compliance with the EU AI Act, and genuine transparency.

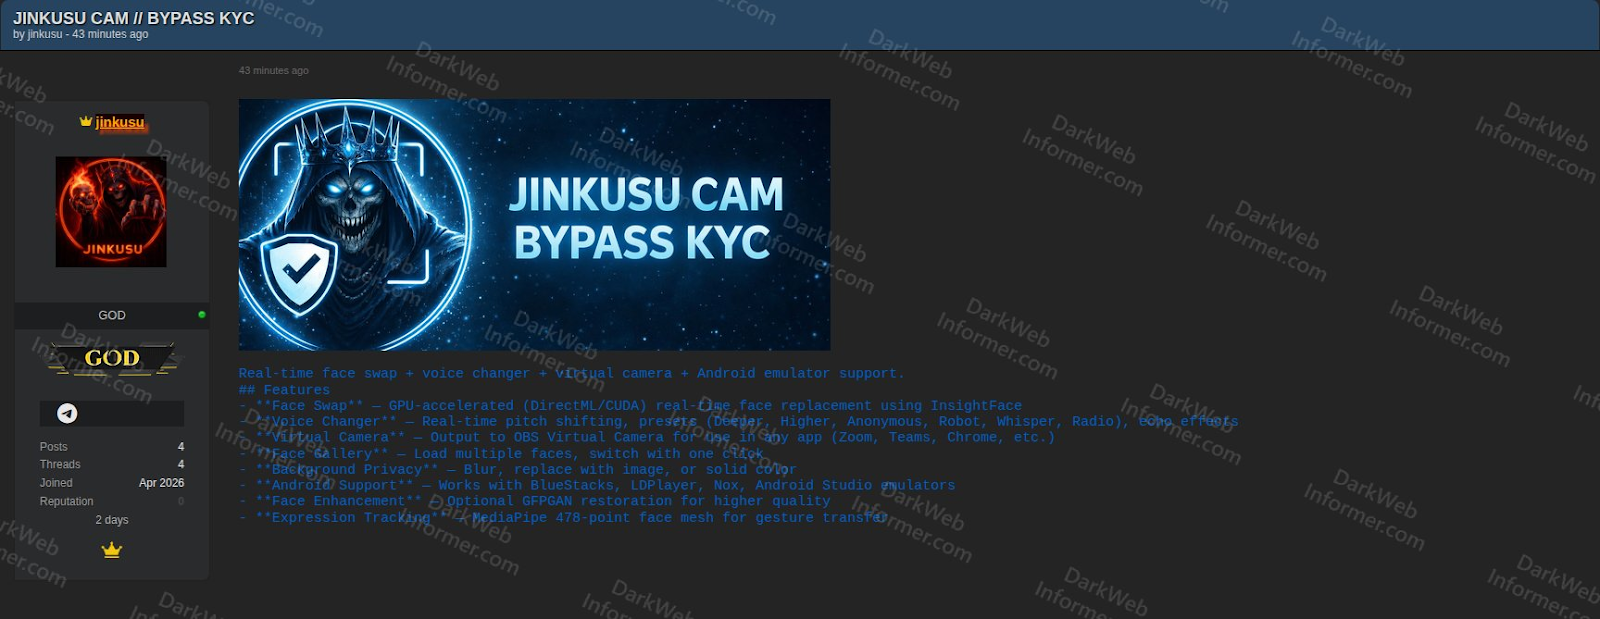
A threat actor known as “Jinkusu” is allegedly selling cybercrime tools designed to bypass Know Your Customer (KYC) checks at banks and crypto platforms.
The tool uses deepfakes and voice manipulation to trick KYC verification systems on finance platforms, cybercrime tracker Dark Web Informer wrote in a Sunday X post.
Cybersecurity company Vecert Analyzer added that Jinkusu uses AI for real-time face swaps via InsightFace for “fluid gesture transfers,” along with voice modulation to evade biometrics.

The emergence of deepfake tools is a “wake-up call” for the industry, as it highlights the shortcomings of KYC verification systems, according to Deddy Lavid, CEO of blockchain security platform Cyvers.
“As AI lowers the barriers to synthetic identity fraud, the front door will always remain vulnerable,” Lavid told Cointelegraph, urging platforms to adopt a layered security approach combining identity verification with real-time AI monitoring.
AI can crack KYC systems with a single picture
Binance chief security officer Jimmy Su highlighted the growing threat of deepfake technology back in May 2023.
He warned that improving AI algorithms will be able to crack KYC identity systems by using a single picture of the victim.
Related: Revolut confirms ex-employee threatened to leak KYC data for crypto ransom
The new fraud kit also enables scammers to run romance scams, such as “pig butchering,” with no technical knowledge.
Crypto investors lost $5.5 billion to 200,000 flagged pig butchering cases in 2024.
Scam-as-a-service threatens crypto investors
The author of the new fraud package, Jinkusu, is suspected to be the same threat actor who released the phishing kit Starkiller in February 2026.
Unlike traditional, HTML-based phishing kits, Starkiller creates a real-time reverse proxy by creating a headless Chrome browser inside a Docker container, loading the genuine login page of the target brand and relaying all user input, including login and passwords, to the threat actor, explained cybersecurity platform Abnormal, in a Feb. 19 report.

While losses to crypto phishing attacks fell 83% in 2025, malicious crypto wallet drainer scripts remained active and new malware continued to emerge, Scam Sniffer said in a January report.
Magazine: Everybody hates GPT-5, AI shows social media can’t be fixed


Strategy was willing to lose more than a billion dollars buying bitcoin (BTC) during the first three months of 2026. Had management not made that sacrifice on behalf of their shareholders, almost no other buying would have occurred at publicly traded bitcoin companies.
If it wasn’t for Michael Saylor’s money-losing, leveraged trades at Strategy (formerly MicroStrategy), 94% of BTC purchased by public companies in Q1 2026 would have never happened.
As of Friday’s market close, Strategy had lost $6.7 billion over its corporate lifetime buying 762,099 BTC at an average $75,694 apiece. At the New York close of trading for Strategy’s MSTR common stock on Friday, BTC was trading at $66,830 or 11.7% below Strategy’s average cost basis.
Limiting the time window to Q1, Strategy purchased 88,594 BTC between January and March, spending $7.25 billion at a volume-weighted average of $80,929 per coin. At Friday’s close, it had lost $1.25 billion or $14,099 per BTC on those purchases.
Read more: Buying the dip? Strategy prefers the top of the range
Across the quarter as well as during the month of March, Strategy represented 94% of the roughly 47,000 BTC acquired by all corporate treasuries, per a report from BitcoinTreasuries.net.
In January, the company similarly accounted for 93% of gross corporate buying, per the same tracker.
Indeed, all other 194 public companies combined added a comparatively paltry 4,000 BTC over Q1.
One company with two-thirds of all assets in its industry
Strategy now holds 762,099 BTC, roughly 65% of all bitcoin on public company balance sheets.
Over the weekend, BTC was trading below $67,000, well below Strategy’s 2026 average purchase price.
As of Friday, the company’s entire Q1 buying activities lost more than $1.2 billion for its shareholders.
The contrast with the rest of the sector is remarkable. Non-Strategy treasury companies purchased a combined 1,000 BTC in the 30 days ending late March, a nearly 99% decline from their August 2025 peak of 69,000 BTC. Their share of total corporate purchases collapsed to 2%, down from 95% in October 2024.
Several large bitcoin treasury companies actually liquidated portions of their holdings. MARA Holdings sold over 15,100 BTC for roughly $1 billion in Q1. Riot Platforms dumped over 3,700 BTC for about $290 million. Cango slashed holdings by roughly 60%, unloading more than 4,400 BTC. Bitdeer Technologies fully liquidated its bitcoin treasury over several months, reducing its position to zero.
The only other notable buyer was Japan’s Metaplanet, which acquired 5,075 BTC at roughly $79,900 per coin, vaulting past MARA to become the third-largest corporate holder at 40,177 BTC.
Strategy leads industry buys and its losses
Worse, Protos has previously documented how Strategy consistently bought near the top of each week’s trading range. Across 12 weekly SEC filings in Q1, Saylor’s purchases landed above the midpoint of the available price range 80% of the time.
Strategy funded its Q1 buying mostly through dilution of its non-dividend paying MSTR common stock as well as sales of STRC preferred shares, which pay an 11.5% annualized dividend.
Strategy’s common stock has lost 21% year to date and sits 74% below its 52-week high.
Corporate bitcoin has lost its appeal and consolidated toward a one-buyer market. Strategy holds more BTC than the next couple hundred public companies combined, and it purchased more in a single quarter than all of them put together.
Got a tip? Send us an email securely via Protos Leaks. For more informed news, follow us on X, Bluesky, and Google News, or subscribe to our YouTube channel.
The U.S. Department of the Treasury has announced a major milestone in the rollout of its new “Trump Accounts” program. It named BNY Mellon as its official financial agent and bringing Robinhood on board as a key partner.
According to a Treasury statement released Monday, BNY Mellon will oversee the management of the initial accounts while also helping develop a dedicated mobile application designed to give families easy access to their funds.
Treasury Partners Robinhood and BNY Mellon to Launch Trump Accounts App
The app, described as a secure, white-label platform, is being built exclusively for the Treasury and will remain under full government control.
Robinhood’s role will center on brokerage services, acting as the initial trustee for the accounts. This partnership signals a notable collaboration between traditional banking infrastructure and a fintech platform known for its retail investing reach.
“We’re bringing our technology and resources to this groundbreaking initiative to democratize finance for the next generation,” Robinhood shared on X.
Officials say the goal of the Trump Accounts initiative is to streamline financial access for eligible families, with a strong emphasis on usability and security.
The platform’s interface is being designed to ensure that even first-time users can navigate their accounts with confidence.
The Treasury emphasized that, despite private-sector involvement, it will maintain strict oversight of the program. This includes enforcing performance standards, safeguarding public funds, and ensuring compliance with federal regulations.
The announcement comes as part of broader efforts tied to financial inclusion and literacy initiatives, with the government aiming to expand access to structured savings or investment accounts for younger Americans.
While details on eligibility and funding mechanisms are still emerging, the partnership with BNY Mellon and Robinhood marks a significant step toward bringing the Trump Accounts program from concept to reality.
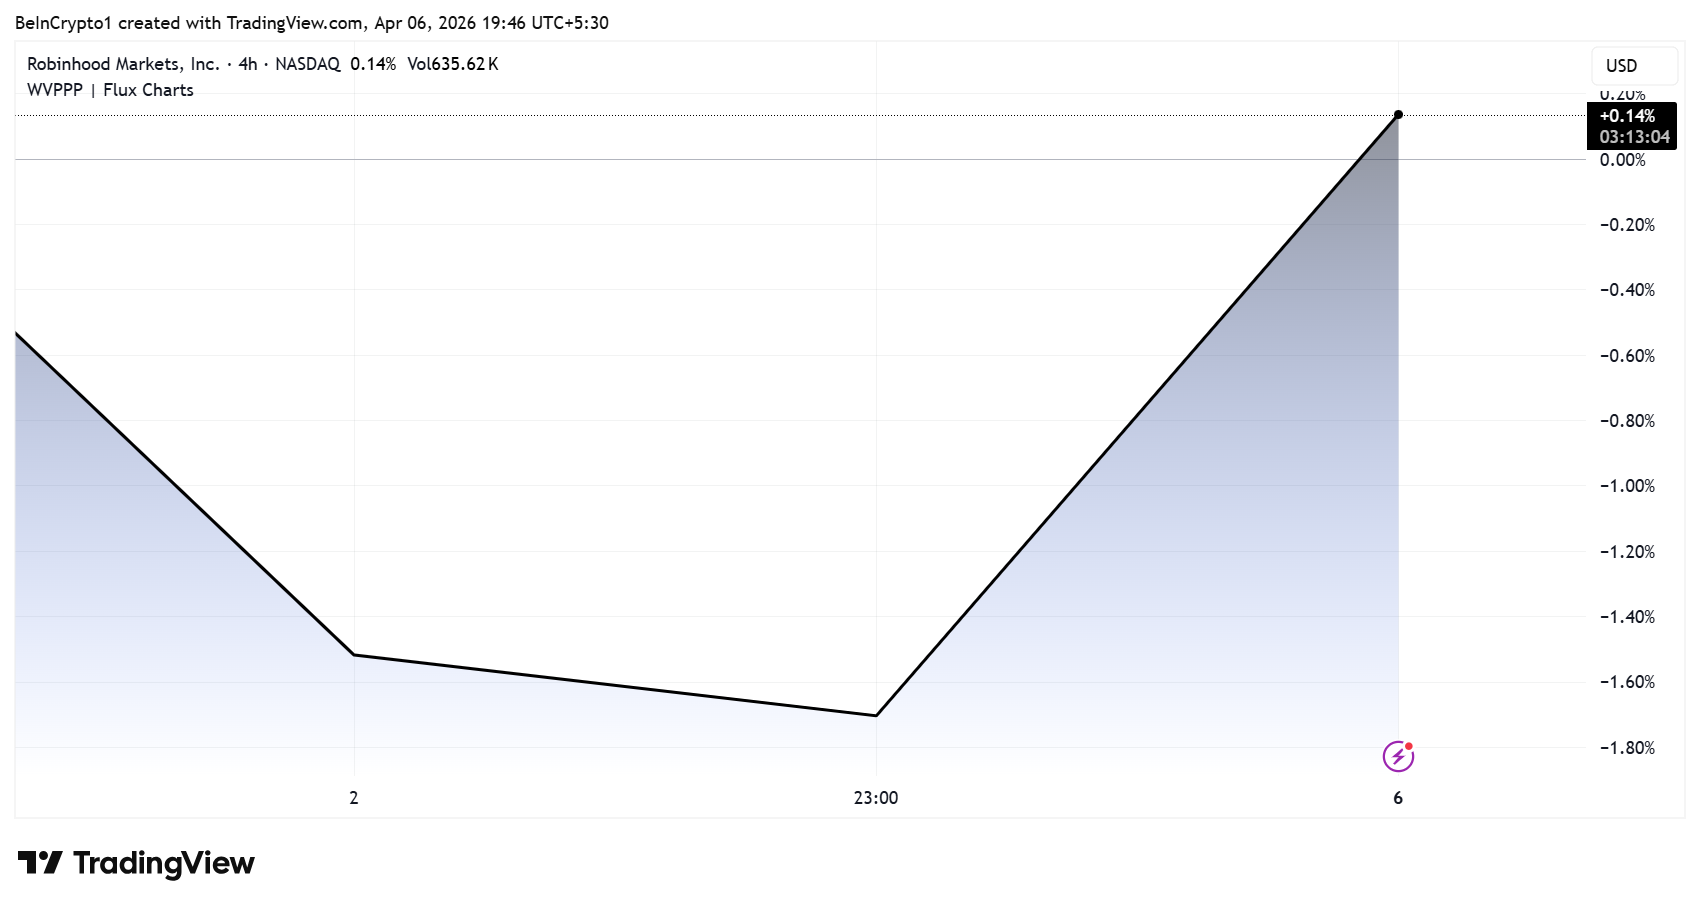
Despite the news, Robinhood’s HOOD stock only saw a modest surge, rising only slightly. As of this writing, HOOD was trading for $70.13.
The post Trump Accounts Go Live: Kids Get Early Access to Investing Via Robinhood and BNY appeared first on BeInCrypto.

Key Takeaways
- Commercial spaceflight operations remain suspended at Virgin Galactic while the company develops its Delta Class spacecraft program.
- The inaugural test flights for the new spacecraft are scheduled for Q3 2026, with commercial operations targeting a Q4 2026 launch.
- Q4 2025 revenue totaled a mere $0.31 million, reflecting the operational pause.
- The company recorded negative free cash flow of $438 million throughout 2025, representing improvement year-over-year despite the magnitude.
- Analyst sentiment leans bearish with a Reduce rating and a consensus 12-month price target of $3.45.
Shares of SPCE are trading at significantly depressed valuations, with the Street’s consensus 12-month forecast pegged at $3.45.
Virgin Galactic Holdings, Inc., SPCE
The space tourism company reported minimal quarterly revenue of $0.31 million during Q4 2025. Flight operations have been deliberately suspended while resources focus on developing the Delta Class fleet.
For the complete 2025 fiscal year, free cash flow registered at negative $438 million. This figure encompasses $240 million in operational cash usage plus an additional $198 million allocated to capital investments.
While the latest earnings release showed the company exceeded analyst estimates on a loss-per-share basis, the virtually nonexistent revenue makes this achievement largely symbolic.
The Delta Class system promises enhanced flight frequency capabilities and significantly reduced operational expenses compared to Virgin Galactic’s earlier generation technology. The prior platform generated substantial public interest but ultimately failed to achieve commercial viability at scale.
Company leadership has established an explicit development schedule. Initial test operations are targeted for Q3 2026. Following successful testing, commercial service resumption is planned for Q4 2026, beginning with a research-focused mission.
For shareholders in SPCE, this timeline represents the critical factor determining the investment thesis. Execution failures will likely intensify downward pressure on shares. Successful milestone achievement could reinvigorate investor interest and market confidence.
Liquidity Concerns Demand Attention
Virgin Galactic continues consuming substantial capital reserves while generating virtually zero flight revenue. Each passing quarter without operational Delta Class spacecraft extends the financial runway required.
The year-over-year reduction in cash consumption from 2024 to 2025 provides some reassurance, yet the absolute figures remain substantial. The company must eventually reach an operational state where flight revenues meaningfully offset ongoing expenditures.
Current financial disclosures don’t suggest immediate solvency concerns, but liquidity management will remain a focal point for investors as the 2026 milestones draw closer.
Analyst Perspectives on SPCE
Wall Street analysts maintain a Reduce consensus rating on SPCE stock. The breakdown includes 1 buy rating, 3 hold ratings, and 2 sell ratings, per MarketBeat data.
The consensus 12-month target price stands at $3.45. While this suggests modest appreciation potential from current trading levels, it underscores the prevailing analyst skepticism.
The Virgin Galactic brand maintains recognition. The high-profile founder narrative continues generating media coverage. However, neither factor directly funds Delta Class development costs.
Absent tangible flight performance data and meaningful revenue generation, analyst community sentiment is unlikely to shift materially in a positive direction.
Bottom Line
Virgin Galactic represents a high-risk, binary investment proposition as the second half of 2026 approaches. The outcome hinges on whether Delta Class achieves performance targets and commercial operations restart according to plan, or whether additional delays materialize and financial sustainability becomes increasingly questionable.
A legitimate catalyst exists on the near-term horizon. The Q3 2026 testing phase and subsequent Q4 2026 commercial restart constitute a meaningful opportunity to transform the company’s narrative trajectory.
Analyst sentiment remains decidedly cautious, reflected in the Reduce consensus and $3.45 average target, while SPCE continues generating essentially zero revenue in the interim.


Key Takeaways
- Mizuho Securities upgraded Dell’s price objective to $215 from $180, maintaining its Outperform designation.
- Projected market share for Dell in AI servers is expected to climb from 19% in 2025 to 25% by the end of 2029.
- Super Micro (SMCI) saw its target reduced to $25 from $33, primarily due to regulatory challenges rather than demand concerns.
- Cloud service providers are expected to spend $689 billion in capex during 2026, representing a 64% increase from the previous year.
- The AI server market is anticipated to reach $862 billion by 2029, with a compound annual growth rate of 44% starting from 2024.
Mizuho Securities opened the trading week with an optimistic assessment of Dell, increasing its price objective to $215 from a previous $180 target while maintaining its Outperform rating. This revision signals strengthening confidence that Dell stands ready to secure an expanding portion of the rapidly growing AI server marketplace.
Analyst Vijay Rakesh from Mizuho highlighted increasing capital investments from leading technology giants as a primary catalyst. Anticipated capital expenditure from cloud service providers reaches $689 billion for 2026, marking a 64% annual increase, with projections for 2027 consensus climbing to $811 billion.
Dell appears positioned as a major winner from this investment surge. The company’s AI server backlog currently stands at approximately $85 billion spanning five quarters, with Mizuho’s updated forecasts estimating AI server orders reaching $53 billion during fiscal 2027 and $68 billion in fiscal 2028 — revised upward from earlier projections of $50 billion and $61 billion respectively.
Shares have advanced 39% year-to-date and soared 148% over the trailing twelve months, currently trading at a price-to-earnings ratio of 20 and a PEG ratio of 0.53, which Mizuho considers appealing given the anticipated growth trajectory.
Explosive Growth in AI Infrastructure Market
Mizuho elevated its 2029 AI server shipment projection to 5.67 million units, up significantly from its earlier estimate of 3.67 million units. Total spending on AI servers is forecasted to hit $862 billion by 2029, compared to approximately $140 billion in 2024 — representing a remarkable 44% compound annual growth rate.
Demand extends beyond hyperscale operators. Smaller cloud service providers, corporate enterprises, and government-sponsored data centers are all anticipated to expand their server infrastructure as agentic artificial intelligence applications proliferate. Rakesh observed that “all key customers indicate continued willingness to stand up additional AI server clusters.”
Dell’s competitive position in AI servers is forecast to strengthen from 19% market share in 2025 to 25% by 2029, capturing territory from Super Micro and Taiwan-based manufacturers such as Foxconn and Quanta Computer.
Evercore ISI independently increased its Dell price target to $205, also sustaining an Outperform rating, pointing to sustained strength in CPU-based server demand.
Regulatory Issues Weigh on Super Micro
Super Micro faced contrasting circumstances. Mizuho retained its Neutral stance on SMCI and lowered its price target to $25 from $33 — though the reduction stems from legal complications rather than deteriorating AI server market conditions.
Federal authorities filed charges against a Super Micro co-founder and two additional individuals for allegedly redirecting servers to China in violation of export restriction regulations. Super Micro as a corporate entity was not included as a defendant. SMCI shares have declined 21% year-to-date, currently trading near $23.31.
Rakesh acknowledged that immediate legal uncertainties might redirect certain orders toward Dell, but emphasized that Super Micro’s extended-term prospects remain solid considering the robust momentum in AI infrastructure investments.
SMCI increased 0.4% during premarket trading on Monday, while DELL advanced 2.95%.
Michael Saylor’s Strategy, the world’s largest publicly listed holder of Bitcoin, resumed buying BTC last week after reporting no purchases in the final week of March.
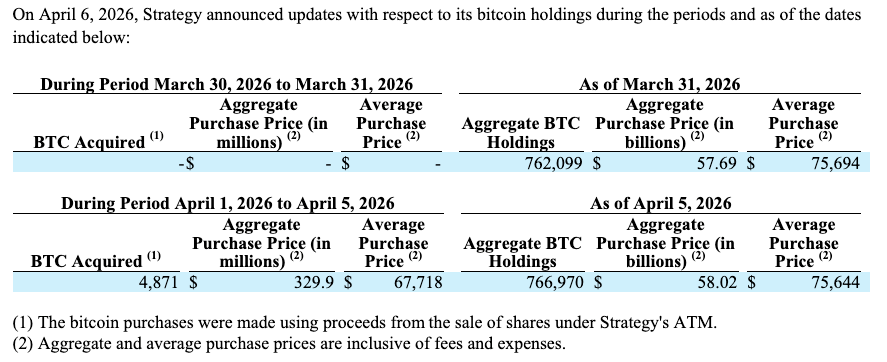
Strategy acquired 4,871 Bitcoin (BTC) for $329.9 million last week, according to an 8-K filing with the US Securities and Exchange Commission on Monday.
The purchases were made at an average price of $67,718 per coin, below the company’s overall average acquisition price of $75,644. The new acquisitions bring Strategy’s holdings to 766,970 BTC, acquired for a total cost of around $58 billion.

In addition to the purchase update, Strategy also reported its first-quarter financial results, including a $14.46 billion unrealized loss on digital assets and a $2.42 billion deferred tax benefit.
Deferred tax asset offset by valuation allowance as bitcoin trades below cost basis
Strategy said its Bitcoin holdings continue to trade below their cost basis, resulting in the recognition of a deferred tax asset tied to unrealized losses on its digital assets.
As of March 31, the company recorded a $1.73 billion deferred tax asset related to those unrealized losses, which was offset by a corresponding $1.73 billion valuation allowance against the amount.

“Because the fair value of Strategy’s Bitcoin holdings is below its cost basis, Strategy expects to establish an additional valuation allowance of $0.5 billion against these deferred tax assets,” the company said.
Strategy saw Bitcoin fall below its average purchase price in early February, marking the first time since late 2023 that BTC traded below its cost basis.
Related: 80% of Strategy’s ‘Stretch’ buyers are mom-and-pop investors
Despite the decline, the company has continued accumulating Bitcoin, buying roughly 54,000 BTC since Feb. 2. Strategy was especially aggressive in March, making some of its largest weekly purchases on record during the month, with monthly acquisitions netting 41,362 BTC.
Strategy’s total Bitcoin purchases in the first quarter of 2026 reached 89,316 BTC, with an aggregate spend of approximately $6.3 billion.
$21 billion offering of STRC and a new $21 billion MSTR offering
Strategy mentioned that the company is updating its at-the-market (ATM) program, including a new $21 billion offering of Stretch (STRC) stock and a new $21 billion offering of Common A (MSTR) stock. The company also terminated its prior Strike (STRK) stock offering and launched a new $2.1 billion STRK stock offering.
The amounts available for STRC and MSTR stock reflect the total remaining capacity under both the existing programs and the newly added offerings. Sales under the STRC and MSTR increases may begin once the existing capacity is substantially used, the company said.

During March 30–31, Strategy sold approximately 2.28 million shares of STRC and 582,550 shares of MSTR, generating about $299.3 million in net proceeds. From April 1–5, the company sold an additional 1 million shares of STRC and 593,294 shares of MSTR, raising roughly $174.6 million.


A solo bitcoin miner running roughly 230 terahashes per second of computing power validated block 943,411 on Thursday, pocketing 3.139 BTC worth about $210,000 despite controlling a share of total network hashrate so small it rounds to zero on most dashboards.
The miner was connected to solo.ckpool.org, the anonymous solo mining pool introduced in 2014 that lets operators keep their full block rewards minus a 2% fee. CKpool developer Con Kolivas confirmed the win on X, noting the miner had roughly a 1-in-28,000 chance of finding a block on any given day.
At 230 terahashes, the winning rig represents about 0.00002% of bitcoin’s total estimated hashrate of roughly 1 zetahash per second as of early April. That output is consistent with a small stack of home-scale ASICs running under a single roof rather than a rented cloud burst or industrial operation.
For context, listed miner Riot Platforms alone runs more than 30 exahashes, roughly 130,000 times the hashrate of Thursday’s winner.
The block is the 312th solo win registered on CKpool since its inception, and the first since Feb. 28, ending a 33-day drought. Solo pools have found just 20 bitcoin blocks over the past 12 months, distributing a combined 62.96 BTC. That’s roughly one solo block every 18.7 days on average, with a longest gap of 58 days.
The win continues a pattern that has repeated with surprising regularity through this cycle.
In December, a roughly 270 TH/s miner cleared 1-in-30,000 daily odds to claim a $284,633 reward. In November, a miner running just 6 TH/s, the output of a single old-generation ASIC that would not normally expect to find a block in hundreds of years of continuous mining, beat 1-in-180-million odds to land roughly $265,000.
And in late February, a miner turned approximately $75 of rented cloud hashrate into a $200,000 reward by pointing just 1 petahash at CKpool for a few hours.
Bitcoin is consolidating just below $70,000 with one scheduled event this week capable of breaking the pattern in either direction: the March CPI print dropping April 10 at 8:30 AM ET. The binary is clean, if U.S. inflation data comes in soft enough to shift Federal Reserve language toward cuts, BTC $75K becomes an immediate technical target; if core CPI stays sticky above 0.3% month-over-month, the “higher for longer” scenario reasserts itself, and the path of least resistance points back toward $60,000–$62,000.
The Cleveland Fed’s nowcast – built on late-March data – projects a 0.84% monthly headline surge driven by gasoline prices up 26.2% year-over-year and diesel up 50.4%. That reading, if confirmed, would mark a sharp acceleration from February’s 0.27% headline and would effectively freeze any Federal Reserve pivot conversation through at least mid-summer. Macro crypto trading desks are already pricing two radically different worlds into options flow. Thursday’s print decides which one we’re in.
Bitcoin’s $75K Level: Full Technical Breakdown and Price Scenarios
Bitcoin Price Prediction: Reclaim $75,000 or Retreat to $60,000

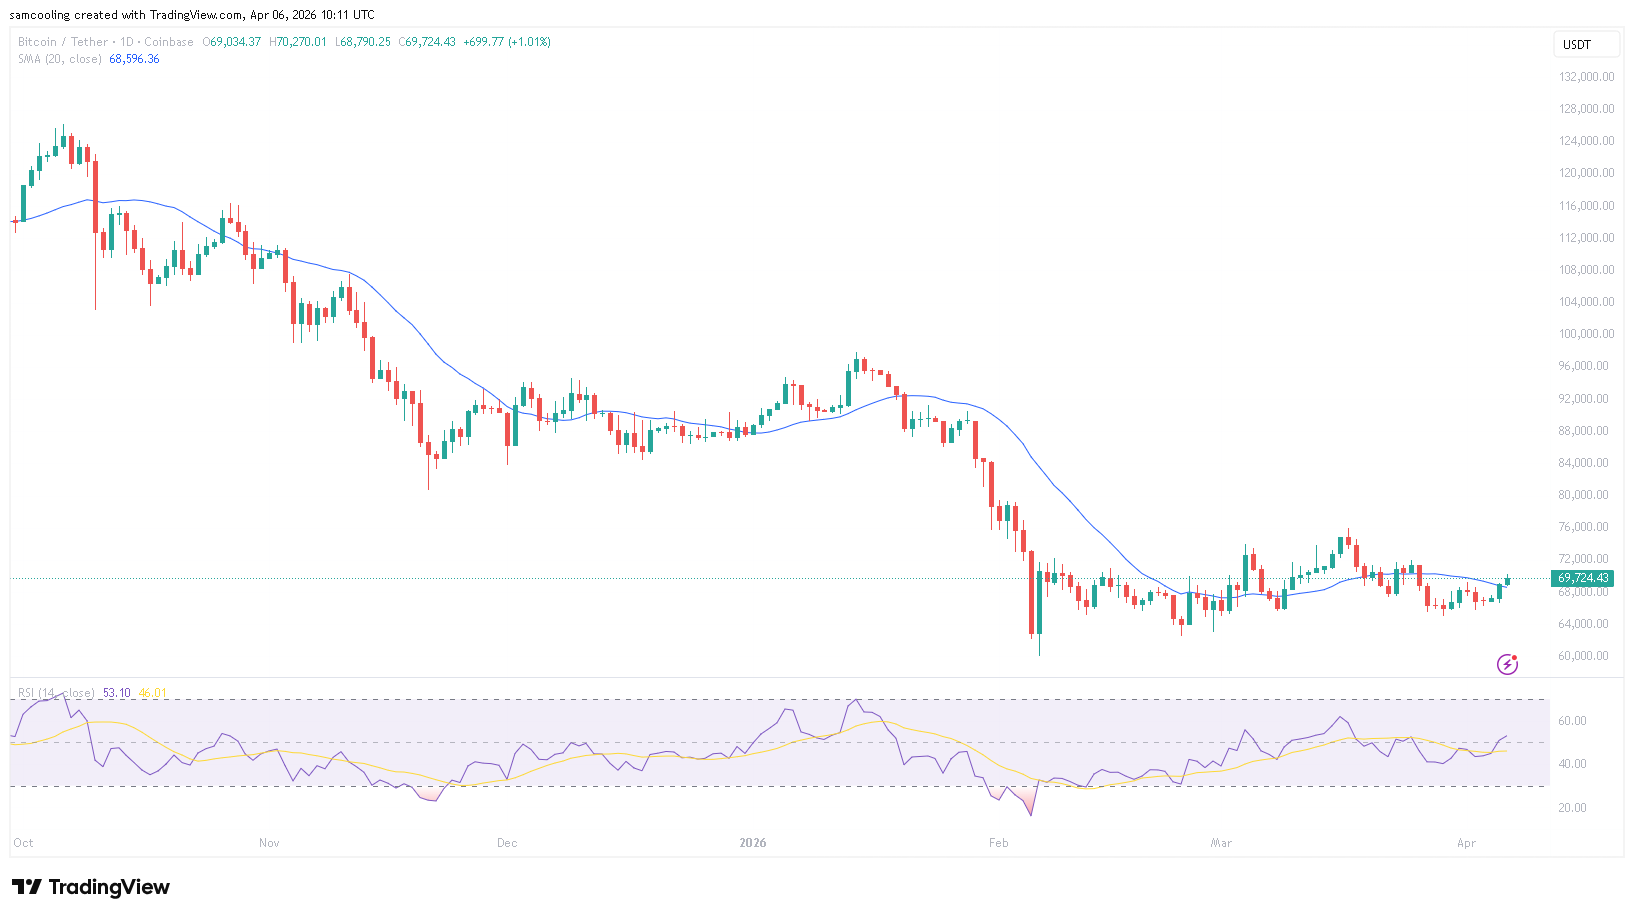
(Source – BTC USD, TradingView)
Bitcoin is currently rangebound between $65,000 and $71,000, a compression zone that has held for several weeks and is coiling into what chart structure suggests is a decision point. The $73,700 level above is the immediate overhead resistance; above that is the $75,000 psychological ceiling, which has acted as a load-bearing level since BTC’s last failed breakout attempt.
A weekly close above $75,000 on CPI-driven volume would be the first structural confirmation that the bull case is intact.
RSI on the daily is sitting near 53 – neutral, not oversold, which means there’s no technical floor being built from momentum exhaustion alone. The 200-day EMA is converging with the $67,500 support zone, making that level load-bearing in the near term. A daily close below $67,500 opens the door to $62,000, where significant order book depth and prior accumulation structure sit. MVRV ratio remains below 1.5, suggesting the market hasn’t reached the euphoria zone – but that also means on-chain buying pressure isn’t yet dominant enough to generate self-sustaining momentum.
The bull case requires a CPI-triggered risk-on move through $71,000, then a reclaim of $73,700 on sustained volume, with $75,000 as the confirming close. The bear case activates on a hot print: a rejection at $71,000 that cascades back through the 200-day EMA and targets the $60,000–$62,000 whale accumulation zone. For traders already holding, the downside scenario below $66,000 deserves serious risk modeling before Thursday. The single most important level: $71,000. Hold it post-print and the bull case lives. Lose it and $62,000 becomes the next anchor.
Why the April 10 CPI Print Resets the Fed Timeline – and Bitcoin’s Ceiling
The Bitcoin CPI relationship isn’t incidental – it’s mechanical. CPI drives Fed rate expectations, rate expectations drive the dollar and treasury yields, and dollar strength directly compresses institutional appetite for risk assets, including BTC. February’s CPI landed at 2.4% year-over-year with core holding at 2.5% annually for the second consecutive month, driven by shelter costs rising 0.2%. That stickiness kept “higher for longer” as the dominant Fed posture heading into April’s data cycle.
The threshold that matters for a Federal Reserve pivot signal is a core monthly reading at or below 0.2% – anything above 0.3% entrenches current policy and delays the first cut. CME FedWatch currently prices fewer than two cuts for 2025, a dramatic repricing from the four-cut consensus that opened the year. Energy is the wild card: the Cleveland Fed’s nowcast is being driven almost entirely by gasoline and diesel spikes, and the Fed has historically looked through volatile energy components when assessing underlying inflation trends. If headline runs hot but core stays controlled, traders may interpret that as a conditional green light.
March payrolls added 178,000 jobs, with unemployment holding at 4.3% – a labor market that doesn’t scream imminent recession and therefore gives the Fed cover to hold. The April 10 U.S. inflation data release won’t just move Bitcoin on the day; it will recalibrate the entire rate-cut timeline that institutional crypto positioning is built on.
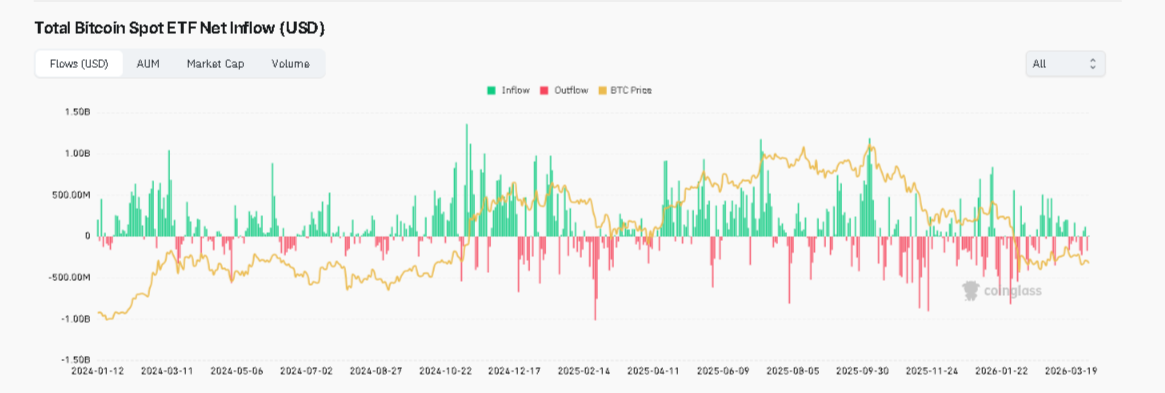
(Source – CoinGlass)
Spot Bitcoin ETF inflows from BlackRock’s IBIT and Fidelity’s FBTC have shown direct sensitivity to CPI beats and misses – a hot print tightens that inflow tap immediately.
The post CPI Data Countdown: Why the April 10 Print Is Make or Break for Bitcoin’s $75K Push appeared first on Cryptonews.


Bitmine Immersion Technologies (BMNR) said it now holds 4.8 million ether (ETH) worth roughly $10.2 billion at current prices, putting the company within reach of its stated goal of accumulating 5% of the total ether supply.
In a Monday statement, the company also said its shares will start trading on the New York Stock Exchange, uplisted from NYSE American, starting April 9.
Bitmine holds 3.98% of ether’s 120.7 million circulating supply, compared with Strategy’s 3.8% of bitcoin’s 20 million. Both companies have turned treasury accumulation into a stock market narrative, and both are buying aggressively as prices decline.
Bitmine acquired 71,252 ETH in the past week, its highest pace of purchases since late December, according to Chairman Tom Lee, who framed the buying as a bet that ether is in “the final stages of the mini-crypto winter.”
Total crypto and cash holdings are now $11.4 billion, including $864 million in cash, 198 BTC, and smaller positions in Beast Industries and Eightco Holdings.
Bitmine’s model diverges from Strategy when it comes to staking, or depositing tokens to help secure the Ethereum blockchain in exchange for a reward. Of the 4.8 million ETH held, 3.33 million are staked through Mavan, the company’s institutional-grade validator network that started operating Monday.
That staked position is worth roughly $7.1 billion and generates $196 million in annualized staking revenue at a 2.78% yield, giving Bitmine a recurring income stream that Strategy’s bitcoin treasury does not have.
At full deployment, when all of Bitmine’s ETH is staked, the company projects $282 million in annual staking rewards.
Lee made a wartime case for ether in the announcement, noting that ETH has gained 6.8% since the Iran conflict began, outperforming the S&P 500 by 1,130 basis points and gold by 1,840 basis points. “ETH is the wartime store of value,” Lee said, a framing that would have been difficult to argue six months ago but has data behind it now.
Bitmine is now the 96th most traded stock in the U.S. with average daily volume of $987 million, ranking between Schlumberger and Adobe. The investor base includes ARK Invest, Founders Fund, Pantera, Galaxy Digital, and Kraken.

TLDR:
-
- Tom Lee’s Bitmine acquired 71,252 ETH last week, its highest single-week buying pace since December 2025.
- Bitmine’s total ETH holdings reached 4,803,334 tokens, representing 3.98% of the entire Ethereum supply.
- With 3,334,637 ETH staked at $7.1B, annualized staking revenues have grown to $196 million as of April 2026.
- Bitmine’s combined crypto, cash, and investment holdings reached $11.4B, backed by $864 million in available cash reserves.
- Tom Lee’s Bitmine acquired 71,252 ETH last week, its highest single-week buying pace since December 2025.
Tom Lee’s Bitmine Immersion Technologies (NYSE American: BMNR) acquired an additional 71,252 ETH last week, pushing total holdings to 4,803,334 ETH.
That figure represents approximately 3.98% of the entire Ethereum supply. Combined crypto, cash, and investment holdings reached $11.4 billion, including $8.64 billion in ETH and $864 million in cash.
With 3,334,637 ETH currently staked at $7.1 billion, Bitmine remains the largest Ethereum treasury in the world.
Weekly ETH Purchase Marks Highest Acquisition Pace Since December 2025
The 71,252 ETH acquired last week marks Bitmine’s fastest weekly buying pace since December 22, 2025. At $2,123 per ETH, the total ETH stack is now valued at approximately $8.64 billion.
Chairman Tom Lee has maintained an accelerated buying schedule over each of the past four consecutive weeks.
Lee attributed the increased pace to a broader market view. He described the current period as the final stages of what he calls a “mini-crypto winter.”
The company sees present prices as an entry opportunity before an anticipated ETH leadership cycle.
Bitmine is now 79% of the way toward its stated target of owning 5% of the total ETH supply. Lee referred to this milestone internally as the “Alchemy of 5%,” a goal the company has been pursuing over the past nine months.
“In the past week, we acquired 71,252 ETH which is the highest pace of buys since the week of December 22, 2025,” Lee stated.
The pace of acquisitions shows no sign of slowing, given the company’s cash reserves of $864 million still available for deployment.
$7.1 Billion in Staked ETH Powers Growing Staking Revenue
Of Bitmine’s 4,803,334 ETH, a total of 3,334,637 tokens are currently staked, representing roughly 69% of total holdings.
At $2,123 per ETH, that staked position carries a current value of $7.1 billion. Annualized staking revenues have reached $196 million, with a seven-day yield of 2.78%.
That yield slightly exceeds the CESR benchmark rate of 2.74%, administered by Quatrefoil. At full deployment through its MAVAN staking platform, Bitmine projects annual staking rewards of $282 million.
MAVAN, the Made in America Validator Network, was built initially to support Bitmine’s own treasury operations.
The platform is now being opened to institutional investors, custodians, and ecosystem partners.
Lee noted that Bitmine has staked more ETH than any other entity globally, a position supported by the scale of its treasury.
Beyond ETH, total holdings include 198 Bitcoin, $200 million in Beast Industries, and $92 million in Eightco Holdings (NASDAQ: ORBS). The ORBS position gives Bitmine indirect exposure to OpenAI.
The company also received approval to uplist from NYSE American to the New York Stock Exchange, effective April 9, 2026, continuing under the ticker “BMNR.”
This Morning star leaves Rylan Clark and Emma Willis stunned with shocking accident story

Drinkwater Tops the List in 2026

New AI Cybercrime Tool Targets Crypto, Bank KYC Systems via Deepfakes


-

 NewsBeat4 days ago
Steven Gerrard disagrees with Gary Neville over ‘shock’ Chelsea and Arsenal claim | Football
-

 Business4 days ago
No Jackpot Winner and $194 Million Prize Rolls Over
-

 Fashion3 days ago
Weekend Open Thread: Spanx – Corporette.com
-
Entertainment7 days ago
Fans slam 'heartbreaking' Barbie Dream Fest convention debacle with 'cardboard cutout' experience
-

 Crypto World5 days ago
Gold Price Prediction: Worst Month in 17 Years fo Save Haven Rock
-

 Business15 hours ago
Three Gulf funds agree to back Paramount’s $81 billion takeover of Warner, WSJ reports
-
Crypto World6 days ago
Dems press CFTC, ethics board on prediction-market insider trades
-

 Sports2 days ago
India men’s 4x400m and mixed 4x100m relay teams register big progress | Other Sports News
-

 Business4 days ago
Login and Checkout Issues Spark Merchant Frustration
-

 Tech7 days ago
Apple will hide your email address from apps and websites, but not cops
-

 Tech6 days ago
EE TV is using AI to help you find something to watch
-

 Sports6 days ago
Tallest college basketball player ever, standing at 7-foot-9, entering transfer portal
-

 Politics7 days ago
Should Trump Be Scared Strait?
-
Tech6 days ago
Daily Deal: StackSkills Premium Annual Pass
-

 Tech6 days ago
Flipsnack and the shift toward motion-first business content with living visuals
-

 Sports7 days ago
Women’s hockey camp eyes fitness boost, tactics ahead of WC 2026 campaign | Other Sports News
-

 Crypto World7 days ago
U.S. rule change may open trillions in 401(k) funds to crypto
-

 Tech6 days ago
How to back up your iPhone & iPad to your Mac before something goes wrong
-

 Politics7 days ago
BBC slammed for ignoring author of The Fraud
-

 Tech7 days ago
This is a 3D-Printed Macintosh That Apple Never Built
You must be logged in to post a comment Login