
Crypto World
HYPE drops below $70 as retail demand weakens despite ETF inflows



Key takeaways
- Hyperliquid (HYPE) has fallen below $70, extending its losing streak as broader crypto market sentiment turns risk-off.
- Retail participation is weakening, with futures open interest declining and long liquidations dominating the derivatives market.
Hyperliquid (HYPE) continued to trade lower on Wednesday, slipping below the $70 level as cautious sentiment across the cryptocurrency market dampened retail participation.
The token has recorded three consecutive days of losses, reflecting growing uncertainty among short-term traders. Despite the pullback, institutional investors continue to show confidence, highlighting a divergence between retail and professional market participants.
Retail traders reduce exposure
Recent derivatives data points to weakening retail demand for HYPE. According to CoinGlass, Hyperliquid futures open interest (OI) declined by more than 2% over the past 24 hours to $2.80 billion, indicating that traders are either reducing leverage or closing positions altogether.
During the same period, the market recorded $7.09 million in liquidations, with approximately $6.29 million coming from long positions.
The dominance of long liquidations suggests that bullish traders have been forced to exit as prices moved lower, reinforcing short-term selling pressure.
Despite the decline in positioning, the funding rate remains positive at 0.0078%, indicating that some traders continue to maintain bullish expectations and are willing to pay a premium to hold long positions.
While retail sentiment has weakened, institutional interest continues to provide support.
Data from CoinGlass shows that HYPE exchange-traded funds (ETFs) attracted $4.32 million in net inflows on Tuesday, following $8.43 million in inflows recorded on Monday.
The continued inflows suggest that larger investors remain optimistic about Hyperliquid’s longer-term outlook despite ongoing short-term market volatility.
This divergence between institutional accumulation and cautious retail positioning could become an important factor in determining the token’s next major move.
Hyperliquid price outlook: Support near $64.75 comes into focus
At the time of writing, HYPE is trading around $68, maintaining its broader bullish structure despite recent weakness.
The token remains comfortably above its 50-day Exponential Moving Average (EMA) at $62.36, which continues to trend above the 200-day EMA at $48.40—a positive sign for the longer-term trend.
However, the recent rejection from a local resistance trendline near $72.75 has increased the likelihood of a deeper short-term correction.
From a technical standpoint, HYPE could continue sliding toward a rising support trendline around $64.75, an area reinforced by the nearby 50-day EMA.
Momentum indicators continue to lean cautiously bullish but show signs of slowing. The Moving Average Convergence Divergence (MACD) remains slightly above its signal line, indicating that positive momentum has not disappeared completely.
Meanwhile, the Relative Strength Index (RSI) sits around 54, reflecting moderate buying strength while gradually moving back toward neutral territory.
Unless buying activity strengthens, the current pullback could continue before the broader uptrend resumes.
The first major support lies near the ascending trendline around $64.75, followed by the 50-day EMA at $62.36. A decisive break below these levels could expose HYPE to a deeper correction, potentially bringing the $60 level into focus.

On the upside, bulls must reclaim the $72.73 resistance zone, which aligns with the recent descending trendline. A successful breakout above this level could restore upward momentum and pave the way toward the R1 Pivot Point at $77.09, followed by the R2 Pivot Point at $89.14.
For now, the short-term outlook remains cautious, with weakening retail demand offset by continued institutional accumulation.



Tether’s US-focused USAT stablecoin has launched on Celo, marking its second mainnet deployment after Ethereum and extending the token to a network widely used for digital-dollar payments.
Summary
- USAT now supports native minting and burning on Celo rather than relying solely on bridged tokens.
- Celo users can pay network gas fees with USAT through the blockchain’s CIP-64 fee abstraction.
- USAT has reached a market capitalization of about $185 million since launching in January.
- Tether recently led a $7 million Pact Labs round to expand USAT into US payroll payments.
USAT adds native issuance and gas payments on Celo
Tether announced the USAT deployment on Wednesday, several months after the two companies disclosed plans for the launch in March. Celo becomes the stablecoin’s second supported mainnet following its initial rollout on Ethereum.
USAT holders will be able to use native mint-and-burn functions on Celo. Native issuance reduces the need to move tokens through third-party bridges, which can introduce additional technical and custody risks.
The token can also be used to pay transaction fees on the network. Celo introduced this function through its CIP-64 upgrade, which allows approved ERC-20 tokens to serve as gas currencies instead of requiring users to hold a separate network token.
“Expanding USA₮ to Celo was a deliberate decision,” Tether US CEO Bo Hines said in a statement.
“USA₮ is designed to operate in environments where digital dollars are already being used at scale, and that is what Celo has built, with hundreds of thousands of people transacting on the network every day.”
Celo already handles 28% of cross-chain USDT transfers
Celo has become Tether’s largest USDT distribution network by weekly active users since the flagship stablecoin launched on the blockchain in 2024, according to the announcement.
The network accounts for 28% of cross-blockchain USDT transfers. It also holds more than 90% of the market for XAUt0, the omnichain version of Tether Gold.
Tether’s transparency data lists about $470 million in authorized USDT on Celo, making it the token’s eighth-largest supported blockchain by that measure. Authorized tokens include inventory available for future issuance and do not necessarily represent the amount currently circulating.
Separate market estimates place Celo’s total circulating stablecoin supply near $136 million. USDT accounts for about $78.8 million, giving Tether a 57.6% share of that market.
Opera has also launched a self-custodial stablecoin wallet on Celo with Tether’s support. The product has reportedly reached more than 18 million users worldwide.
USAT targets regulated dollar payments in the US
USAT launched in January and has grown to a market capitalization of about $185 million. That remains a small fraction of USDT’s roughly $180 billion supply, but the two tokens serve different markets.
Tether designed USAT around the requirements of the US GENIUS Act. The stablecoin maintains reserves in cash or liquid cash equivalents, including US Treasury securities, to support one-to-one redemptions.
Anchorage Digital Bank, a federally chartered crypto bank supervised by the Office of the Comptroller of the Currency, issues the token. Hines joined Tether US after serving as executive director of the President’s Council of Advisers on Digital Assets from January through August 2025.
The regulated structure places USAT at the center of Tether’s effort to expand beyond crypto trading and into everyday US payments.
Tether extends USAT into the $11 trillion payroll market
As crypto.news reported in mid-July, Tether led Pact Labs’ $7 million Series A funding round alongside Blockchange Ventures and Lasagna. The deal aims to integrate USAT into payroll and payment systems used by American employers.
Pact Labs plans to let businesses process wages through blockchain payment rails while adding embedded digital wallets and related financial services. Tether is targeting a US payroll market that processes more than $11 trillion annually.
Celo’s low fees, mobile-focused design and existing stablecoin activity could provide another settlement network for those applications. The blockchain began as a Layer 1 in 2020 before moving to an Ethereum Layer 2 built on the OP Stack in March 2025.


Binance.US plans to apply for a U.S. Commodity Futures Trading Commission (CFTC) Designated Contract Market (DCM) license next month, marking a major step in its expansion beyond spot crypto trading.
CEO Stephen Gregory reportedly announced the move at RareEvo, saying the exchange aims to launch regulated prediction markets as part of its broader comeback strategy centered on lower fees, perpetuals, and new trading products.
Binance.US Targets CFTC Approval for Prediction Markets
Binance.US is preparing to apply for Designated Contract Market (DCM) status with the CFTC next month, a move that would pave the way for the exchange to offer regulated prediction markets in the United States.
CEO Stephen Gregory, known online as Stevie_Satoshi, revealed the plan during an on-stage conversation with journalist Eleanor Terrett at the RareEvo conference.
The announcement represents another milestone in Binance.US’s efforts to rebuild its U.S. business following years of regulatory challenges and reduced product offerings.
A Bigger Comeback Strategy Takes Shape
Prediction markets are only one part of Binance.US’s broader strategy.
According to Gregory, the exchange is also focused on reducing trading fees and expanding beyond traditional spot markets into products such as perpetual contracts. The goal is to attract more traders while competing more directly with U.S. crypto exchanges offering a wider range of regulated products.
A DCM designation is the regulatory framework that allows exchanges to list futures, options, and certain event contracts under CFTC oversight. Obtaining the license would place Binance.US among platforms pursuing regulated prediction markets as demand for event-based trading continues to grow.
Why Investors Are Watching
The announcement comes as prediction markets gain increasing attention across financial markets, with traders using event contracts to hedge risk and express views on elections, economic data, sports, and other outcomes.
For Binance.US, securing a DCM license could significantly expand its product lineup while reinforcing its regulatory credentials in the United States.
However, the company has not yet submitted its application, and any approval process could take months. CFTC review timelines vary, and there is no guarantee the application will be approved.
What’s Next?
Investors will now watch for Binance.US’s formal CFTC filing, expected next month. Any updates on the application process, regulatory feedback, or future product launches could shape the exchange’s next phase of growth and influence competition in the rapidly evolving U.S. prediction markets sector.
Binance.US did not immediately respond to BeInCrypto’s request for comment.
The post Binance.US Reportedly Eyes CFTC License in Bold Prediction Markets Push appeared first on BeInCrypto.
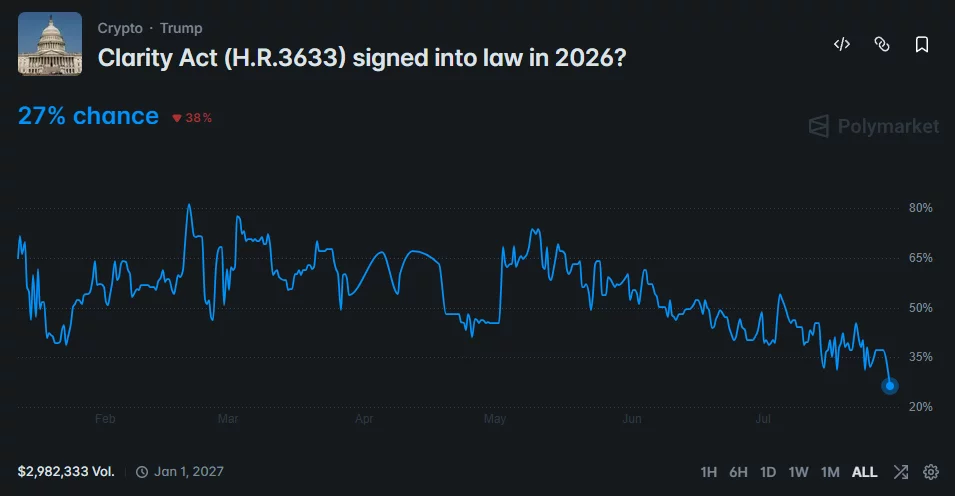
Polymarket traders cut the CLARITY Act’s chances of becoming law in 2026 to a record-low 27% after the Senate postponed action on the crypto market structure bill.
Summary
- CLARITY Act passage odds fell to 27%, their lowest level since the Polymarket market opened.
- Senate leaders prioritized Russia sanctions and federal nominations before the scheduled Aug. 8 recess.
- Senators Ruben Gallego and Thom Tillis are preparing a bipartisan ethics counteroffer for the White House.
- SEC Chair Paul Atkins said the agency could write crypto rules without Congress if negotiations fail.
CLARITY Act odds fall as Senate changes priorities
The Polymarket contract asking whether crypto market structure legislation will become law in 2026 fell to 27% on July 29. The price represents traders’ assessment rather than an independent forecast, but it shows growing doubts about the bill’s shrinking legislative window.
Galaxy Digital has also lowered its estimated probability of passage to 30% as negotiations extend further into the Senate calendar.
As crypto.news reported, Senate Majority Leader John Thune postponed action on the CLARITY Act while lawmakers considered a Russia sanctions package and a group of federal nominees. The Senate voted on July 28 to advance the sanctions legislation, leaving fewer working days for the crypto bill before the Aug. 8 recess.
Industry participants have urged Thune to begin the cloture process before the break, even if the Senate cannot complete a final vote. A procedural vote could establish whether the measure has enough bipartisan support to advance later in the year.
Senators prepare a new ethics counteroffer
Democratic Sen. Ruben Gallego and Republican Sen. Thom Tillis are finalizing a bipartisan counteroffer covering ethics restrictions in the bill. The lawmakers expect to submit the language to the White House within days.
Tillis indicated that the proposal could allow state attorneys general to enforce its ethics provisions instead of giving that authority only to the Department of Justice. Ethics rules covering elected officials and their financial interests in digital assets have become a central point in negotiations.
A separate dispute over stablecoin rewards could create another delay. Banking groups have pushed lawmakers to restrict yield-bearing products that may compete with traditional deposits, while crypto companies argue that broad limits could reduce consumer choice.
Even if senators reach an ethics agreement, the bill must still clear procedural thresholds, pass the Senate and resolve any differences with the House version. Those steps make passage before the recess increasingly unlikely.
US crypto firms seek federal market rules
The CLARITY Act would divide digital asset oversight between the Securities and Exchange Commission and the Commodity Futures Trading Commission. Its supporters say the framework would give exchanges, token issuers and blockchain developers clearer rules for operating in the United States.
Florida Rep. Mike Haridopolos renewed his support for the measure during a July 28 appearance on Fox Business. As crypto.news previously reported, the House Financial Services Committee member warned that continued delays could send investment and jobs to countries with clearer regulations.
“This is about making sure that American markets are the premier markets in the world,” Haridopolos said.
BlackRock, Goldman Sachs, Franklin Templeton, Fidelity, Charles Schwab and SoFi have also supported passage, challenging claims that Wall Street broadly opposes the legislation.
“The Big Bank Lobby is trying to say that all of Wall Street is opposed to the Clarity Act. That’s completely false,” Sen. Cynthia Lummis said.
The Consumer Technology Association has made a similar economic argument, warning that regulatory uncertainty could push capital and employment outside the country.
SEC could move ahead without Congress
SEC Chair Paul Atkins said the regulator remains prepared to address parts of the crypto market structure debate through agency rulemaking if Congress fails to act.
Atkins described the SEC as “ready, willing and able” to write rules under its existing authority. However, he said legislation remains preferable because a statute would provide a more durable framework than regulations that a future administration could revise.
Independent SEC action may clarify how the agency treats certain tokens, trading platforms and tokenized securities. It would not fully replace legislation establishing statutory jurisdiction between the SEC and CFTC.
The bipartisan ethics counteroffer is now the bill’s most immediate test. White House acceptance could help negotiations continue after the recess, but the Senate calendar and unresolved stablecoin dispute leave the CLARITY Act facing its weakest outlook so far.
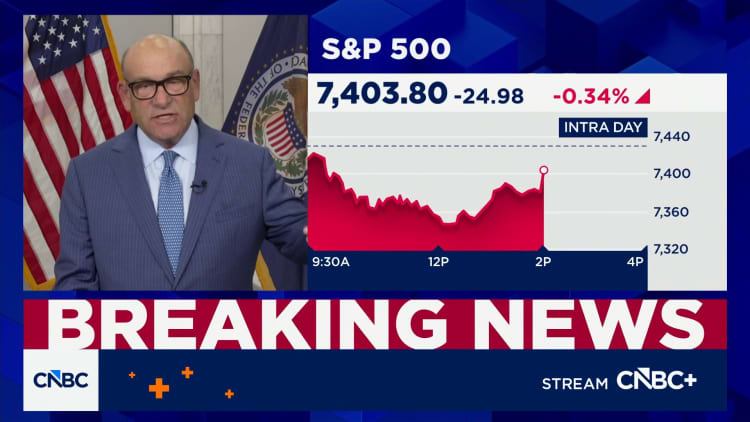

WASHINGTON – The Federal Reserve on Wednesday voted to hold its key interest rate steady but not without opposition from three officials who have expressed concern over inflation and wanted to hike.
Despite increasing support among some officials for a rate increase, the Federal Open Market Committee voted 9-3 to leave the federal funds rate in a range between 3.5% and 3.75%.
All of the “no” votes came from regional presidents – Beth Hammack of Cleveland, Neel Kashkari of Minneapolis and Lorie Logan of Dallas – who had been the most explicit about the need for higher rates to address inflation that has been above the Fed’s 2% target for more than five years.
The post-meeting statement noted that the three dissenters “preferred to raise the target range for the federal funds rate by ¼ percentage point at this meeting.”
An early challenge for Warsh
This is the first time since September 2016 that three policymakers dissented with a unified view of which direction rates should head.
“We’re reading this as a Committee with vocal hawks,” said Ian Lyngen, head of U.S. rates at BMO Capital Markets.
The no votes presented an early challenge for Chairman Kevin Warsh, whose refusal to provide clear road signs on where monetary policy is headed led to an unusually high level of uncertainty heading into the meeting.
Markets largely had expected the central bank policymakers to approve another hold on rates, though there had been some inclination – about a 1-in-3 chance, according to the CME Group’s FedWatch tool – that a surprise rate hike was in the cards. Prediction markets had a higher level of certainty that the Fed would hold.
Warsh has argued that the Fed should spend less time trying to tell markets what it will do and instead emphasizing the conditions under which action would be taken. However, Wednesday’s statement provided neither, even with markets largely expecting the Fed to hike in September.
The post-meeting statement was almost identical to the one following the June 17 decision and was in keeping with the Fed’s actions all year, following three rate cuts in the latter part of 2025.
Officials again noted that “Economic activity is expanding at a solid pace despite elevated uncertainty that owes, in part, to the conflict in the Middle East.” The statement further said that job growth has “kept pace with the workforce and the unemployment rate has changed little” even as the U.S. labor force has contracted.
As in June, the statement concluded with the simple declaratory, “The Committee will deliver price stability.”
“The Fed appears to be running out of patience with above-target inflation, despite recent data coming in cold,” said Kay Haigh, global head and chief investment officer of fixed income and liquidity solutions at Goldman Sachs Asset Management. “The committee’s growing hawkish sentiment, shown by the three dissents against today’s hold, has also likely been exacerbated by the recent flare up in hostilities in the Middle East.”
Officials favoring tighter policy argued inflation has been a burden on households and is not showing clear signs of abating. Recent price pressures have reflected both tariffs imposed by President Donald Trump and higher energy costs tied to the Iran conflict.
The full committee in June penciled in one quarter-percentage-point increase by the end of 2026.
Disparate policy views
Governor Christopher Waller also voiced worries recently over inflation, saying higher rates could be necessary if more progress isn’t made. However, he voted in favor of a hold at this meeting.
For his part, Warsh has called inflation “a choice,” and he repeatedly stressed the importance of getting prices in check during recent hearings on Capitol Hill.
But from a policy perspective, Warsh has expressed disdain for the Fed’s past practice of providing forward guidance on its expectations for rates.
Keeping with Warsh’s first meeting, the statement was much shorter than what had become the norm. Warsh has stressed changing the way the Fed communicates, even dedicating one of five task forces he has created to address the issue.
In the weeks leading up to the meeting, his FOMC colleagues had expressed disparate policy views.
New York Fed Chair John Williams has said he sees current policy well positioned to bring inflation back to target. However, Logan countered that “modestly” higher rates would be needed. Hammack also has been an inflation hawk, citing the pressure households are facing from persistently higher prices across the board.
Earlier this week, Trump showed support for Warsh, calling him “fantastic” while noting other Fed officials had “bad intentions” and perhaps had political motivations.
Crypto World
Velotrade publishes comparative review of six prop firms’ rulebooks, finding most funded accounts are closed by rules, not trading


- Hidden trading rules often matter more than profit splits.
- Compare drawdown and payout rules before buying a challenge.
- Rulebook transparency helps traders avoid costly surprises.
HONG KONG, July 29, 2026 — Velotrade today released its 2026 Prop Firm Transparency Report, a comparative review of the published rulebooks of six proprietary trading firms, Topstep, FTMO, FundingPips, Blue Guardian, HyroTrader and Velotrade.
The report examines the terms that determine whether a funded trader is ultimately paid, and concludes that most funded accounts are closed not because of poor trading, but because of rules set out in evaluation guides and help-center pages.
According to the report, across more than 300,000 funded accounts, only around 7% of traders ever drew a payout, and the reason typically had little to do with trading ability.
The report is intended, Velotrade said, to help traders compare firms on the terms that most often decide a payout rather than on profit splits alone.
Its central finding is that a trader can clear every stage of a challenge and close a position in profit, yet still have the account terminated over a clause that was not read at the point of purchase.
“Could a trader read our rules once, in one sitting, and know every way their account could end?
If the answer is no, the rulebook is not finished. Most of this industry has treated that as a marketing problem.
We think it is the entire product,” said Gianluca Pizzituti, Chief Executive Officer of Velotrade.
Rules, not losing trades, account for most closures
The report cites two separate industry datasets in support of its central claim:
- In a 2024 study by FPFX Tech covering more than 300,000 accounts (reported via Finance Magnates), just 7% of traders ever reached a payout, and only about 14% cleared a challenge in the first place.
- A separate 500,000-trader analysis by hoc-trade found that roughly 70% of failures came from hitting loss limits, not from missing profit targets.
- Consistency rules can erase 33% to 50% of the profit made on a single strong day. Four of the six firms reviewed apply one.
Taken together, the report argues, the figures point to a consistent conclusion: the trade is seldom the issue, the rulebook is.
A market expanding as firms fail
The report situates its findings against rapid growth in the sector.
It notes that monthly searches for “prop firm” climbed from roughly 880 in early 2020 to about 49,500 by 2025, a 56-fold increase, drawing waves of first-time buyers into an industry whose decisive terms sit off the sales page.
That growth, the report states, has been accompanied by high-profile failures.
After MetaQuotes withdrew MT4 and MT5 licenses from prop firms serving US clients in February 2024, several prominent names collapsed.
The report records that The Funded Trader halted operations and later acknowledged more than $2 million in denied payouts; True Forex Funds shut down citing insolvency, leaving roughly 300 traders owed $1.2 million; and SurgeTrader closed within days, with its CEO conceding that about 10% of payout obligations went unpaid.
The same trade, two firms, two outcomes
Every prop account has a maximum-loss line, the report explains, but firms set it in fundamentally different ways, and the difference can decide the identical trade twice.
A fixed drawdown is set from the starting balance and does not shift: on a $100,000 account with a 10% limit, the account fails at $90,000. A trailing drawdown rises with equity and does not fall back.
To illustrate, the report models one account through both approaches.
An ordinary day-seven pullback bottoms out about $10,000 above a fixed $90,000 floor, leaving the account intact and finishing up roughly $6,500.
Under a trailing floor that has ratcheted up near the peak, the report states, the very same dip breaches the line and closes the account outright.
It notes that FTMO anchors its maximum loss at 10% of the starting balance, while Topstep’s trailing limit rises with the end-of-day balance and locks at the start.
Neither firm conceals its model, the report says, but the distinction between fixed and trailing is decisive rather than a footnote.
Consistency rules and the penalty for a strong day
A consistency rule limits how much of a trader’s total profit can come from any one session, the report explains, meaning a trader can perform strongly and still fail.
Under a 40% single-day cap with a $1,000 target, it notes, a strong $450 session represents 45% of profit, over the line, so the evaluation fails even though the target was met.
According to the report, Topstep, FundingPips, Blue Guardian and HyroTrader each apply a version of the rule, during evaluation or on a payout tier, and FTMO applies a 50% Best Day Rule on its 1-Step product, documented in its help center rather than the headline rules.
It adds that the tightest single-day caps tend to sit on the most attractive payout options, and that Velotrade applies no consistency rule at any stage.
For readers weighing the crypto-focused end of the market, Velotrade’s rundown of the top crypto prop firms sets these terms out side by side.
The rule that can close a profitable trade
Loss limits close the most accounts, the report states, but it identifies a quieter rule as the hardest to anticipate, because it can shut an account on a trade that never closes at a loss.
The report describes a max-risk-per-trade rule, which caps how much any single position or trade idea may lose at any moment, measured on unrealized, floating profit and loss rather than on closed trades.
It sits beneath the advertised daily loss limit.
If an open trade’s paper loss so much as touches the cap intraday, even for a second, the report explains, the rule can trigger and the account is closed, even if that trade would have gone on to close in profit.
The report identifies three features that make the rule easy to miss at the point of purchase:
- It is measured on unrealized loss, so the trade never has to close in the red.
- It can switch on only after funding, meaning a trader can pass the entire evaluation without ever meeting the rule that then governs the funded account.
- It can aggregate re-entries, so closing a losing trade and reopening in the same direction can combine the losses toward the cap.
The report notes that firms name the rule differently. Blue Guardian’s “Guardian Shield” force-closes trades near 1-2% unrealized (depending on account type), with a first breach cutting the split to 50% and a second closing the account.
FundingPips applies a “Risk Per Trade Idea” rule at the funded stage that aggregates re-entries. HyroTrader requires a stop-loss within five minutes of every trade, monitored live.
Velotrade, the report states, publishes no secondary per-trade or per-idea cap beneath its daily limit.
None of these is illegitimate as risk management, the report says. Its argument concerns placement: a rule that can end a funded account arguably belongs next to the price, not several pages into a help center.
The six rulebooks, side by side
The report’s full rulebook comparison sets all six firms against the terms that most often decide a payout.
Velotrade noted that, because it both published the report and appears in the final column, that column reflects a market participant’s own position rather than a neutral grade, and said traders should verify current terms directly with each firm.
The comparison, as published in the report, is reproduced below.
| Firm | Drawdown Model | Floating P&L Counted | Consistency Rule | Position Risk Rule | News Trading | Weekend Holding | Rules Change | Where the Detail Lives |
|---|---|---|---|---|---|---|---|---|
| FTMO | Fixed, from initial balance (10%) | Yes, loss line includes unrealized P&L | Best day threshold on some account types | No secondary per-trade cap on standard accounts | Unrestricted in evaluation; short window around targeted releases once funded | Allowed in evaluation; funded Standard must close before the weekend; Swing exempt | Yes, news and weekend rules tighten at the funded Standard stage | Trading objectives pages, FAQ |
| Topstep | Trailing, end of day, locks at starting balance | Yes, realized and unrealized P&L | Best day threshold in evaluation; separate threshold on payout | No formal per-trade cap; full size into major news is a listed risk | No fixed blackout window; maximum size into major news flagged | Not permitted at any stage; day-trading program with a fixed daily loss | Consistency requirement and payout path differ once funded | Help center articles |
| FundingPips | Varies by product; most models fixed, one product trails 5% from peak equity | Yes, on the daily loss limit across models | Consistency score gates the higher on-demand payout tier | “Risk Per Trade Idea” cap, funded stage only, aggregates re-entries | Unrestricted in evaluation; funded accounts restricted near high-impact news | Allowed in evaluation; funded accounts under a temporary restriction | Yes; per-trade cap and news and weekend rules activate once funded | Rules pages and payout terms |
| Blue Guardian | Daily loss limit plus trailing mechanics, varies by product | Yes, uses balance or equity, whichever is higher | Applies during evaluation; varies by product | “Guardian Shield” near 2% unrealized; first trigger cuts split, second closes | Broadly permitted in evaluation; short restricted window | Generally permitted, subject to plan rules | Yes; the floating loss shield and news restriction are documented | Blog and rules documentation |
| HyroTrader | Varies by plan; optional upgrade converts trailing daily | Yes, daily drawdown monitored in real time | Applies during evaluation only; drops away once funded | Mandatory stop-loss within 5 minutes of every trade, monitored live | Holding through news permitted; news-only strategies restricted | Permitted at every stage, reflecting 24/7 crypto markets | Yes; the consistency requirement applies only during evaluation | Terms and FAQ |
| Velotrade | Fixed, disclosed from initial balance | No secondary floating loss cap published | None at any stage, per published rules | None published beneath the daily limit | Permitted at every stage, per published rules | Permitted at every stage, per published rules | No; rules stated as consistent from purchase | Single published rules page |
Source: each firm’s own published rules pages, help-center articles and FAQs, captured July 2026. “Varies by product” means the answer differs across a firm’s account types. Terms change frequently, so confirm current conditions before purchasing.
Where the established firms lead
The report is candid about the other side of the ledger. As a prop firm, Velotrade is new, having launched its challenges in 2026, while FTMO (2015) and Topstep (2012) have run trader evaluations for far longer.
Paying out funded traders at scale, the report acknowledges, is something only time proves, and on that specific record the incumbents have years of history while Velotrade is early.
It notes that several firms also scale funded accounts well beyond Velotrade’s $200,000 ceiling and support more platforms, and advises traders to weigh a clean rulebook and a paid-out track record together.
A ten-minute check before buying a challenge
The report’s practical recommendation is that ten minutes spent reading the terms may matter more than any comparison of profit splits. Drawing on its review of six prop firm rulebooks, it advises traders to establish:
- Drawdown mechanics: fixed from the initial balance or trailing equity? If trailing, end-of-day or tick-by-tick, and when does it lock?
- Consistency rules: evaluation, funded, or both? Tied to a payout tier? What is the exact single-day cap?
- Per-trade caps: is there a secondary cap beneath the daily limit, does it measure unrealized losses, and does it aggregate re-entries?
- Funded-stage changes: do rules activate, tighten or disappear once funded, and does the account start at a reduced balance?
- Payout conditions: minimum trading days, withdrawal frequency, first-payout waiting periods, and whether a payout can be declined at the firm’s discretion.
- Where it is written: are all account-ending rules on a single page, and can support point to each one in writing?
Regulatory attention is increasing
The report notes growing regulatory scrutiny of the sector.
The US Commodity Futures Trading Commission is expected to open a public consultation on 1 August 2026 (comments close 30 November 2026) on whether challenge fees amount to “commodity-pool participation interests”, a designation that could bring evaluation-based US futures prop firms under CFTC and NFA registration.
In Europe, the report states, the FCA and ESMA have reiterated that prop marketing to retail must carry prominent risk warnings and drop misleading performance claims, and regulators in Europe, Australia and North America are examining whether charging a fee without delivering funding resembles a pay-to-play model.
None of this is settled law, the report cautions, and some bodies, including CySEC and, for now, ESMA, have signalled that prop trading is not an immediate priority.
But the direction of travel, it argues, is toward standardised, upfront disclosure, the same shift most other consumer financial products have already made.
Conclusion
The report concludes that the prop model itself is sound, since backing skilled traders with firm capital is a reasonable idea, and that what lags is disclosure at the point of sale.
Comparing rulebooks, it argues, deserves at least the same weight traders give to comparing profit splits, because the rulebook, in the end, decides whether the split is ever paid.
About Velotrade
Velotrade is a proprietary trading firm offering funded trading challenges across crypto, forex, stocks, indices and commodities, built around a single, fully published rulebook and a fixed drawdown model.
The firm puts transparency at the center of its offering, aiming to ensure that every rule capable of ending an account is disclosed in one place before a trader buys.
Velotrade Re Limited is incorporated and registered in Hong Kong, where its founding team has operated a licensed invoice-finance business since 2016, with founders drawn from JP Morgan, Bank of America and Dresdner Kleinwort.
All trading services are provided in a simulated environment using demo accounts with simulated funds. For more information, visit velotrade.com.
Media Contact: Velotrade Press Office, [email protected]
Disclaimer: This press release is for general informational purposes only and does not constitute financial or investment advice. Figures and firm terms are drawn from Velotrade’s 2026 Prop Firm Transparency Report and publicly available sources as of mid-2026; terms change frequently, and readers should verify current conditions directly with each firm before purchasing any evaluation. Trading carries significant risk.
This article is authored by a third party, and CoinJournal does not endorse or take responsibility for its content, accuracy, quality, advertisements, products, or materials. Readers should independently research and exercise due diligence before making decisions related to the mentioned company.


Freehand has raised $75 million to expand AI agents that handle invoices, supplier negotiations, payments, and other supply-chain tasks for large companies.
Summary
- Battery Ventures and NewRoad Capital Partners co-led the $75 million funding round.
- Freehand says its agents are deployed at Meta, Unilever, Pfizer, and Johnson & Johnson.
- Customers recovered 5% to 10% of spending in some categories, according to company data.
- The startup will expand beyond invoice management into broader supply-chain operations.
Freehand secures $75 million from US investors
Battery Ventures and NewRoad Capital Partners co-led the round, with Nexus Venture Partners and PSP Growth also participating. Former US Commerce Secretary Penny Pritzker runs PSP Growth.
Freehand did not disclose the funding round’s valuation or specify whether it issued equity, debt, or another security. Battery Ventures general partner Dharmesh Thakker will join the startup’s board as part of the transaction.
The funding follows Freehand’s emergence from stealth in February. The company says its software is already used by Meta, Unilever, Johnson & Johnson, Pfizer, Dunkin’, and Cardinal Health, although it has not disclosed the size or duration of those commercial agreements.
Unilever confirmed it had adopted the technology for supply-chain work.
“Freehand marks one of the first full-scale agentic deployments at Unilever,” Matt Algar, the company’s global vice-president of supply chain, said.
Algar described the deployment as a shift “from software that assists to software that runs our supply chain.”
How Freehand’s AI agents manage company spending
Freehand focuses on the procure-to-pay process, beginning with invoices. Its AI agents can review contracts, negotiate supplier rates, identify overbilling, process payments, and reconcile transactions inside a customer’s enterprise resource planning system.
These jobs have traditionally required a mix of legacy software and outsourced back-office teams. Freehand is betting that companies will increasingly use autonomous software to complete the work instead of only producing recommendations for human employees.
Its system uses what the company calls a Category Context Graph. The data structure connects information from emails and documents with transaction records stored inside company systems, creating a history of decisions, exceptions, and spending within each category.
Freehand claims early customers completed workflows five to seven times faster and reduced procure-to-pay cycles by more than 70%. It also says some customers recovered between 5% and 10% of spending in complex categories, but those figures have not been independently audited.
US supply-chain costs create an opening for AI
Freehand is targeting a large segment of American business spending. US companies spend more than $20 trillion annually on materials, logistics, data centers, and services, according to Bureau of Economic Analysis figures cited by the startup.
The company estimates that enterprises also spend $16 billion each year on supply-chain software and $348 billion on workers handling tasks that existing systems cannot complete. Those figures are Freehand’s estimates rather than independently verified market totals.
Tariffs, taxes, and tighter immigration rules are adding costs to the outsourcing model used by many US companies. Freehand argues that these pressures could encourage businesses to automate more finance and supply-chain operations.
Funding continues across AI, fintech, and crypto infrastructure
Freehand’s round comes amid continued investor interest in software that automates financial and operational processes. Financial infrastructure startup Augustus raised $180 million in a Series B round at a $1 billion valuation to connect traditional payment networks with stablecoins and continuous settlement.
As crypto.news previously reported, World Foundation secured $52.5 million through a strategic WLD token sale to expand its World ID network. All tokens purchased in that transaction will remain locked for one year.
Robinhood Chain launch platform Memecoin.Fun also raised $3.5 million through USDG. The platform plans to develop launchpad infrastructure, cross-chain bridge functions, and tools supporting memecoins across several blockchains.
Freehand will use its new capital to move beyond invoice checking and payments. Its longer-term plan is to deploy agents across more supply-chain processes and spending categories, placing the company in direct competition with procurement platforms, business-process outsourcing firms, and established enterprise software providers.

Before Max’s death, Sara and Max discover an opening that could lead outside the cave. However, they realize the drop is too high to escape safely. Their plan is to wait for the tide to rise, allowing them to jump safely into the ocean from the opening without risking a dangerous fall.
After Max dies, Sara is alone inside the cave. She uses the flare she was carrying to distract the shark and force it away. With it still following her, Sara creates a trap using the unstable rocks inside the cave. She draws the shark toward her and causes it to repeatedly crash into the rocks, until they eventually collapse and crush the shark.
After defeating the shark, Sara searches for another way out of the cave. She finds a second opening in the cave system and climbs through it, emerging near the beach, with trees and sand surrounding the area. Unlike the previous opening that led out toward the ocean, this exit allows Sara to reach land and finally escape the Devil’s Mouth alive.
Reflecting on Sara’s transformation, Newton says portraying her growth required embracing the character’s initial insecurity and her reliance on Max as a source of confidence. “I didn’t like that Sara was such a baby and had to lean into it to discover her strength,” she says. She also highlights the importance of Sara and Max’s complicated friendship, explaining that Wadlow was drawn to “how they have to really turn against each other to find each other.”
By the end of the film, Sara becomes the one making the decisions and taking control of her own survival. “Once I became the apex predator that a teenage girl is, I couldn’t be stopped,” Newton adds.
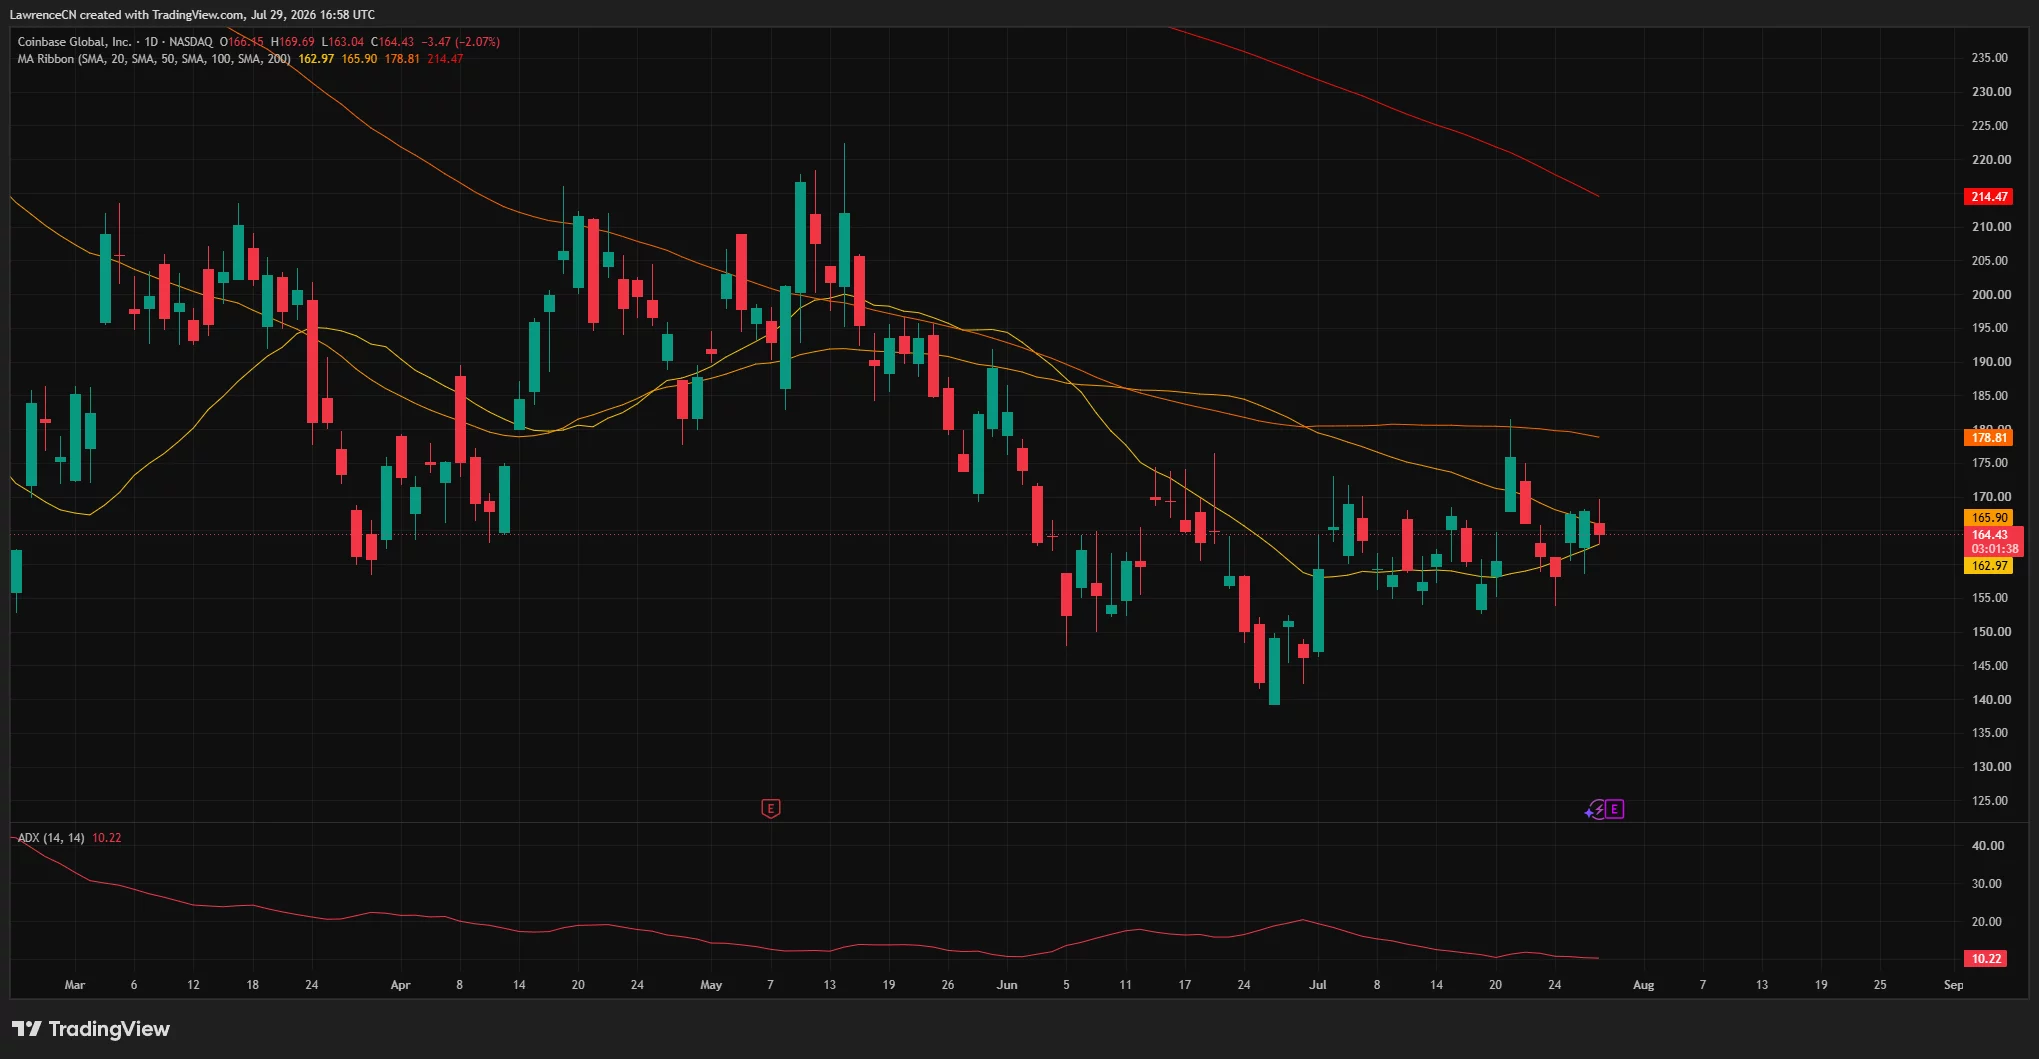
Coinbase stock traded near $164 on Wednesday as investors weighed weak Q2 revenue expectations against Rosenblatt’s $240 price target and growth in newer business lines.
Summary
- COIN fell 2.07% to $164.43, remaining close to its 20-day and 50-day moving averages.
- Analysts expect Q2 revenue of $1.31 billion, down 12.8% from a year earlier.
- Rosenblatt maintained its Buy rating and $240 target, citing derivatives and prediction markets.
- An ADX reading of 10.22 signals weak momentum before the July 30 earnings release.
Coinbase stock consolidates ahead of earnings
Coinbase (COIN) shares traded at $164.43 on July 29, down 2.07% during the session after moving between $163.04 and $169.69. The stock has stabilized since falling below $140 in late June, but buyers have yet to establish a clear upward trend.
The company will publish its second-quarter results after the market closes on July 30. Coinbase has also scheduled a question-and-answer session for 2 p.m. Pacific Time that day, according to its investor relations announcement.
Wall Street expects revenue to reach approximately $1.31 billion for the April-to-June period. That would represent a 12.8% decline from the $1.50 billion reported in the second quarter of 2025. It would also fall below the $1.41 billion generated during Q1 2026.
Lower crypto trading activity remains the main earnings risk. Coinbase depends partly on transaction fees, leaving its quarterly results exposed to changes in digital asset prices, volatility and retail participation.
Rosenblatt sees Coinbase reaching $240
Rosenblatt maintained its Buy rating and $240 price target before the report. That target implies roughly 46% upside from the stock’s current price.
The investment firm expects Coinbase’s core crypto trading business to remain under pressure but sees derivatives and prediction markets becoming more meaningful revenue sources. Its target is based on 25 times the firm’s estimate for Coinbase’s adjusted earnings before interest, taxes, depreciation and amortization in 2027.
That view reflects Coinbase’s attempt to reduce its reliance on spot trading fees. Investors will therefore look beyond total revenue and examine whether newer products can offset weakness in the company’s core exchange business.
JPMorgan has taken a more cautious position. The bank recently cut its Coinbase price target from $283 to $196 after lowering earnings estimates linked to the company’s USDC revenue-sharing arrangement with Hyperliquid.
Under that structure, Coinbase can classify USDC held on Hyperliquid as on-platform balances but returns 90% of the related reserve income to the decentralized exchange. JPMorgan argued that the agreement could weaken the economics of Coinbase’s stablecoin business, according to a previous crypto.news report.
COIN price lacks a clear trend
The daily chart shows COIN trading between two short-term moving averages. Price at $164.43 sits below the 20-day simple moving average at $165.90 but remains above the 50-day SMA at $162.97.
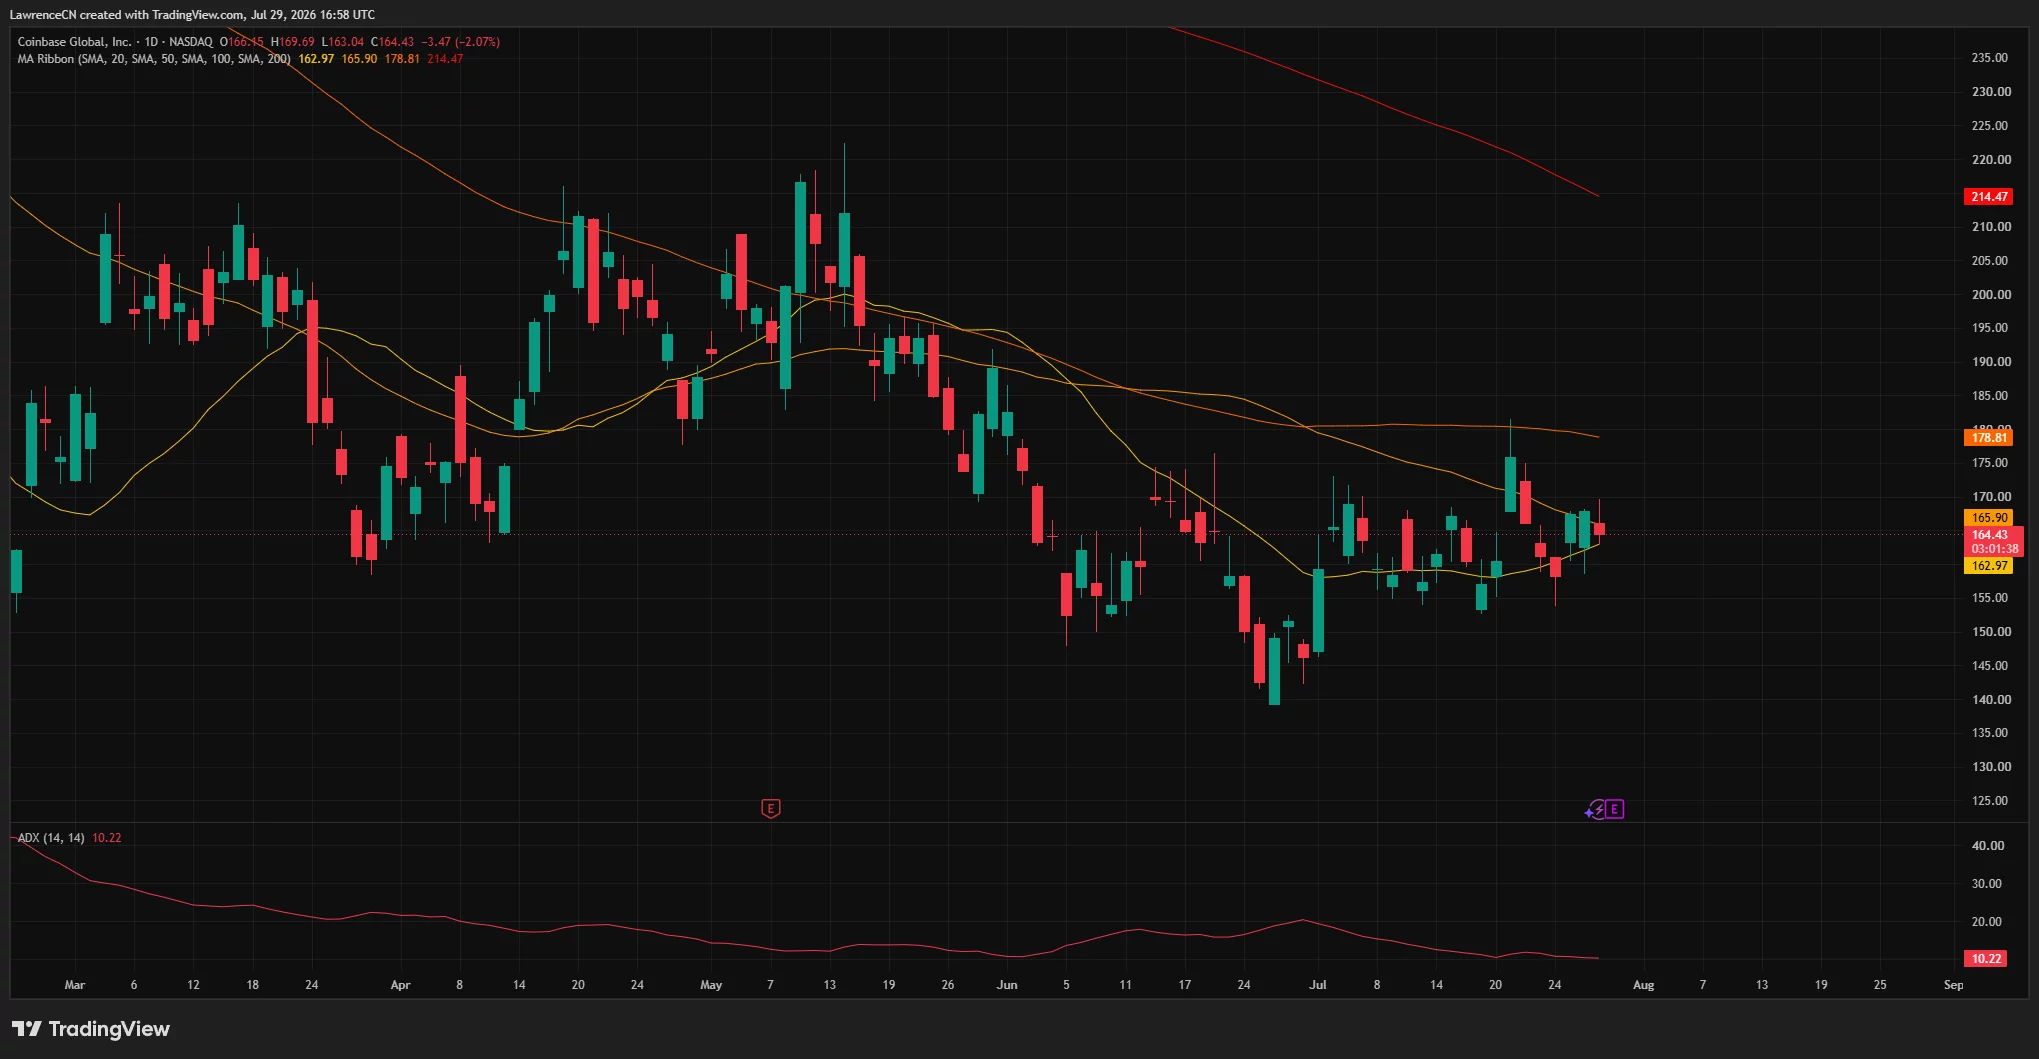
That positioning points to consolidation rather than a confirmed breakout. A close above $165.90 would be an initial sign of improving short-term momentum, while the $169–$170 area forms the next resistance zone.
A stronger move could bring the 100-day SMA at $178.81 into focus. That level has been falling and remains the main medium-term barrier. Reclaiming it would place COIN on firmer technical ground, although the stock would still trade well below its 200-day SMA at $214.47.
The average directional index stands at 10.22. ADX readings below 20 generally indicate that neither buyers nor sellers control a strong trend. The low reading also suggests earnings could provide the catalyst needed for COIN to move out of its recent range.
Key Coinbase stock levels to watch
Immediate support sits at the 50-day SMA of $162.97. A daily close below that line could expose the $155 region, where buyers returned several times during July.
Further selling would place the $145–$150 zone at risk. That area includes the late-June reversal range, while the June low near $139 remains the larger downside level.
On the bullish side, COIN must first break through $166 and then clear $170. A move above both levels could support a test of $178.81. Earnings above expectations or evidence of stronger derivatives, stablecoin and prediction-market revenue could help drive that scenario.
Rosenblatt’s $240 target remains more ambitious. COIN would need to recover the 100-day and 200-day averages before that level becomes technically viable.
CLARITY Act remains a post-earnings risk
US regulatory developments could influence Coinbase shares after the earnings-driven volatility fades. The CLARITY Act is intended to define the respective roles of the Securities and Exchange Commission and Commodity Futures Trading Commission in overseeing digital assets.
Lower expectations for the bill’s passage could limit the regulatory upside previously priced into US crypto stocks. A delay would preserve uncertainty for exchanges, token issuers and institutional investors considering broader participation in the market.
Coinbase could benefit if lawmakers establish clearer rules and bring more activity onshore. However, its immediate direction will depend on Q2 revenue, trading volumes, stablecoin income and management’s outlook for the rest of 2026.


White House crypto adviser Patrick Witt criticized banking leaders seeking tighter stablecoin reward restrictions as Senate delays pushed the CLARITY Act’s passage odds to a record low.
Summary
- 134 banking executives and leaders urged senators to expand restrictions on stablecoin rewards and incentives.
- Witt accused banks of opposing legislation that already prohibits stablecoin issuers from paying interest.
- Polymarket traders cut the bill’s 2026 passage odds to a record-low 27%.
- Senate scheduling decisions have narrowed the window for action before the Aug. 8 recess.
Patrick Witt challenges banks over CLARITY Act
Witt pushed back after 134 banking executives and industry leaders sent Senate lawmakers a letter seeking changes to Section 10404 of the CLARITY Act.
The section restricts issuers from paying interest or yield on payment stablecoins. Banking groups want lawmakers to extend the restriction to rewards, bonuses and other incentives offered by stablecoin firms or their partners.
Witt framed the request as inconsistent with the industry’s wider opposition to the market structure bill.
“Banks: We must ban the payment of interest on stablecoins to protect community bank lending!.”
He then noted that the CLARITY Act already bans interest payments before criticizing banks that still warn the bill could damage community lending.
His comments targeted the difference between banks’ support for an interest ban and their objections to other parts of the legislation. Bank representatives maintain that the existing language may leave room for stablecoin platforms to offer benefits with the same economic effect as interest.
Why banks want a wider stablecoin reward ban
Signatories included leaders tied to Bank of America, U.S. Bank, Zions Bank, First Hawaiian Bank, Bank of Hawaii, Hancock Whitney Bank, FNBO, Eastern Bank, Lake City Bank and Univest Financial Corporation.
The group said payment stablecoins should function as transaction tools rather than long-term savings products. It warned that rewards linked to a user’s balance or holding period could encourage customers to move money out of insured bank accounts.
Banking leaders claimed that large deposit outflows could reduce the funding available for lending to households, farmers, small businesses and local employers. They estimated that the effect could drain hundreds of billions of dollars from the traditional banking system.
Goldman Sachs CEO David Solomon has taken a different position by supporting the CLARITY Act. His stance separates the investment bank from groups demanding tighter stablecoin provisions before the Senate moves forward.
The debate has direct implications for US stablecoin users. Broader restrictions could limit the rewards that exchanges and other service providers offer, even when stablecoin issuers do not pay interest directly.
CLARITY Act odds fall to a record-low 27%
The banking dispute comes as the CLARITY Act faces a shrinking Senate calendar. Polymarket traders have reduced the probability that the legislation becomes law in 2026 to 27%, its lowest recorded level.
Galaxy Digital has separately lowered its passage estimate to 30% as negotiations extend deeper into the legislative year.
Senate Republicans recently released an updated 616-page draft combining texts from the Senate Banking and Agriculture committees. The framework would place digital commodity spot markets under the Commodity Futures Trading Commission while allowing the Securities and Exchange Commission to oversee investment contract assets.
It also includes protections for certain software developers, blockchain developers and decentralized networks that do not control customer assets. White House-backed ethics provisions would restrict digital asset issuance involving federal officials and their spouses.
Senate delay leaves little time before recess
Senate Majority Leader John Thune postponed CLARITY Act action while lawmakers considered federal nominees and the Lindsey O. Graham Sanctioning Russia Act of 2026. Senators voted on July 28 to advance the sanctions package, leaving fewer working days before the Aug. 8 recess.
Crypto industry participants have urged Thune to begin the cloture process before lawmakers leave Washington, even if a final vote cannot occur. A procedural vote would test whether the bill has enough bipartisan support to overcome Senate hurdles later in 2026.
Failure to begin that process would push the legislation further into an already crowded calendar. Stablecoin reward rules remain one of the issues lawmakers must resolve before the broader US crypto market structure framework can advance.
Crypto World
Federal Reserve holds rates steady, extending pause as markets await Warsh’s policy roadmap
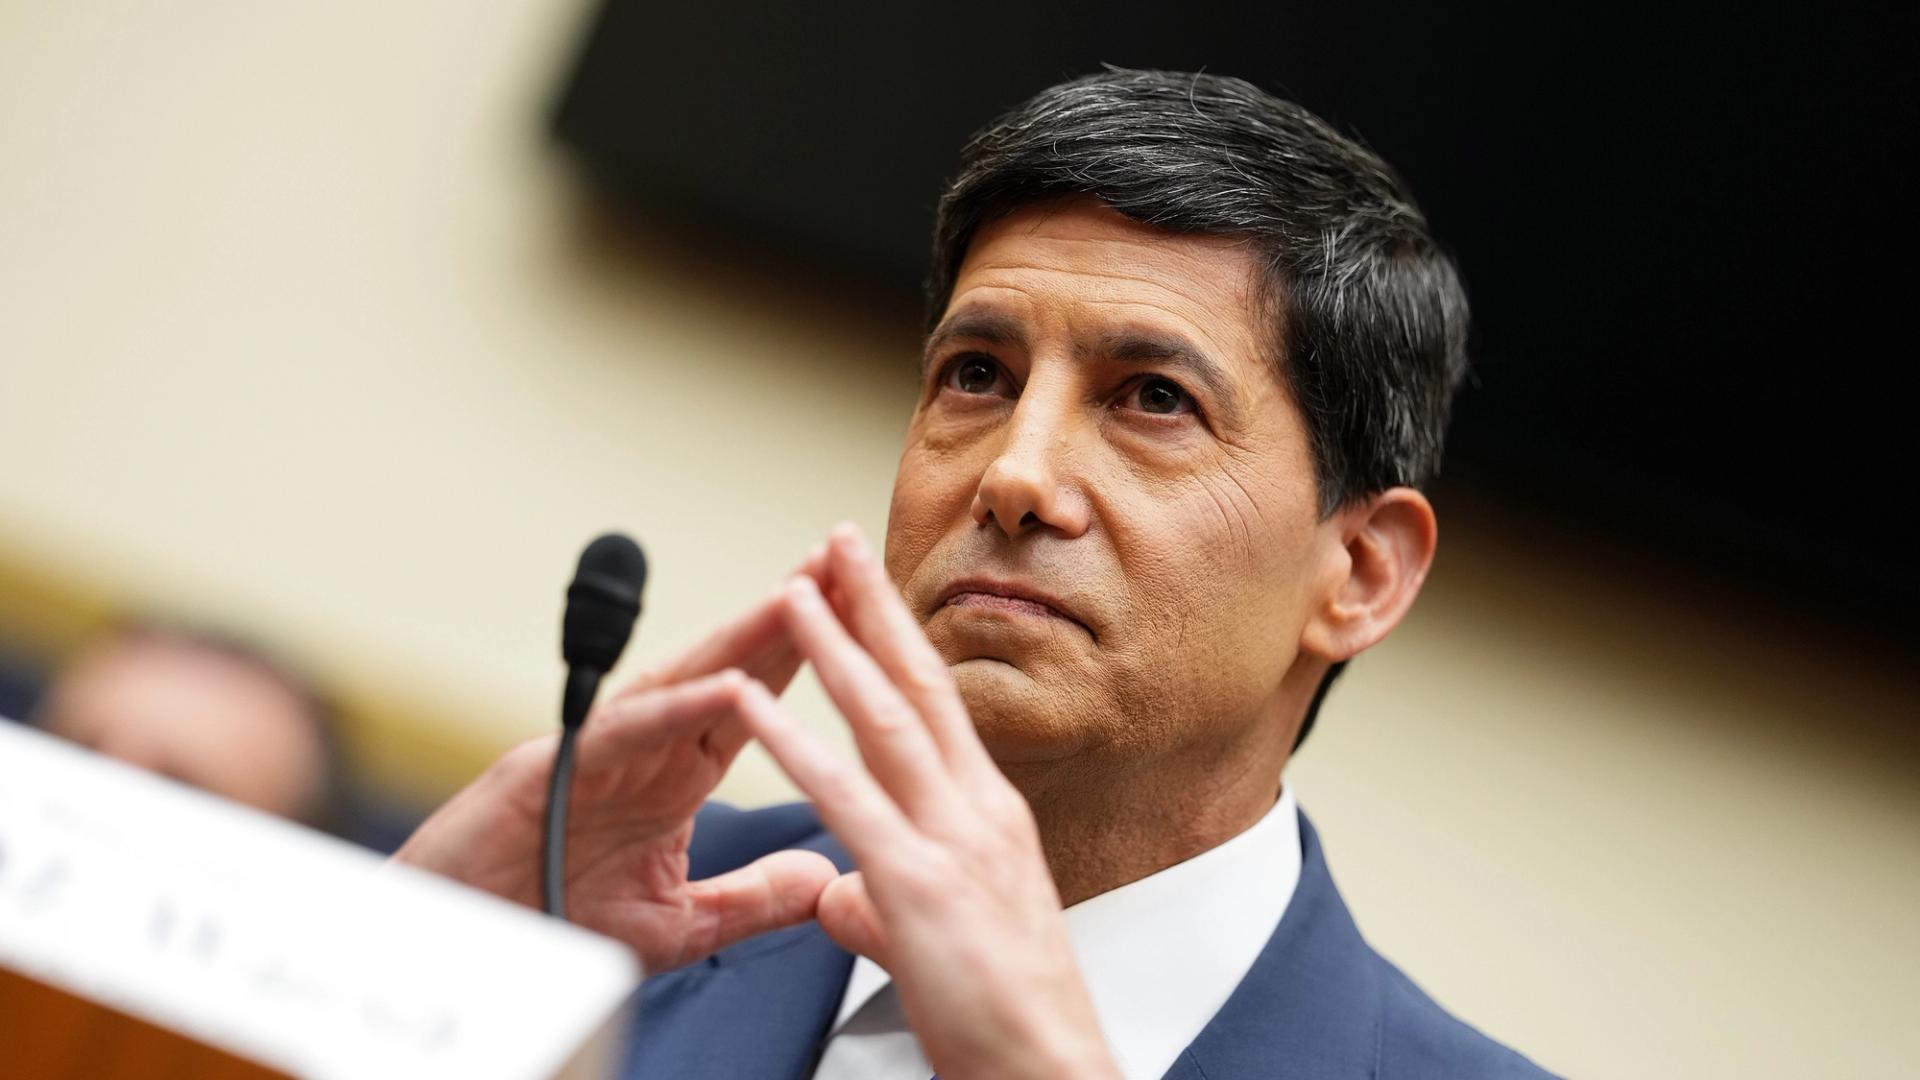
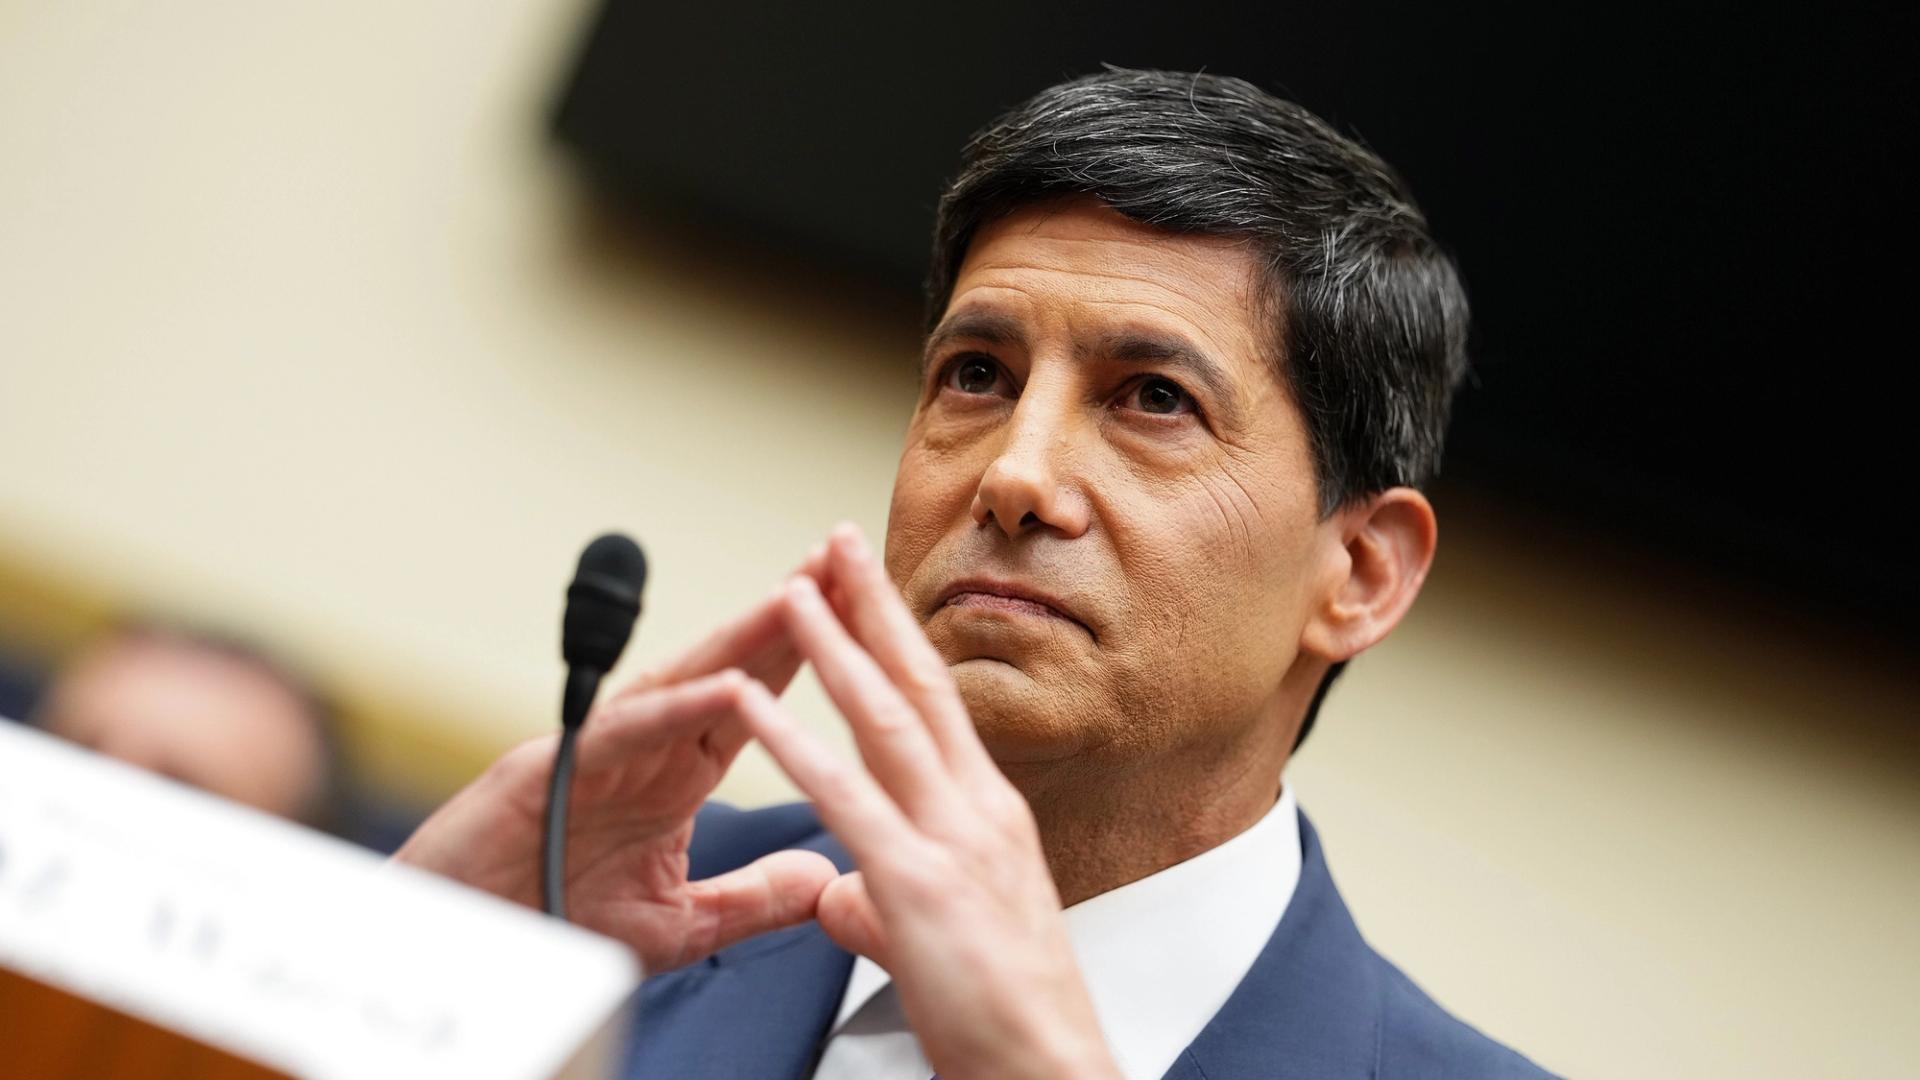
The Federal Reserve left its benchmark fed funds rate range unchanged at 3.50%-3.75% on Wednesday, extending its pause for a sixth consecutive meeting as policymakers continue to grapple with stubborn inflation.
“Inflation remains elevated relative to the Committee’s 2 percent goal, in part reflecting supply shocks that have driven price increases in certain sectors, including energy,” the policy statement read.
“Economic activity is expanding at a solid pace despite elevated uncertainty that owes, in part, to the conflict in the Middle East. Productivity growth and capital investment are strong,” the statement added. “Job gains have kept pace with the workforce, and the unemployment rate has changed little.”
There were three committee members dissenting, preferring to raise rates by 25 basis points. Nine voted to keep policy in place.
Bitcoin climbed to above $64,400 following the decision, up over 1% over the past 24 hours. The S&P 500 and Nasdaq bounced, trimming earlier declines. Gold also rose, up 1.2% through the day.
The decision came after one of the most uncertain pre-meeting setups in years. Futures markets had assigned roughly a 65% probability to a hold and 35% odds of a quarter-point increase, according to CME FedWatch data.

Investment fueling growth for Smash Foods

Tether USAT launches on Celo as second mainnet

Outer Banks Season 5 Trailer Hints at More Deaths After JJ Exit


-

 Fashion5 days ago
Weekend Open Thread: Brooks Brothers
-
 Sports3 days ago
Commonwealth Games boxing: Jadumani Singh seals dominant 5-0 win over Pakistan’s Sumama Rehman to enter quarter-finals | Commonwealth Games News
-

 Tech3 days ago
Intel is reversing course and bringing hyper-threading back to its server chips
-

 Crypto World7 days ago
Ethics, other provisions in crypto Clarity Act to be further discussed
-

 Politics2 days ago
Luke Littler dismantles Gerwyn Price to retain title in Blackpool
-

 Crypto World4 days ago
Ripple bought a bank in pieces. The $4 billion audit
-
 Entertainment5 days ago
A New Post-Apocalyptic Gundam Anime Series Blasts Into SDCC
-

 News Videos3 days ago
BITCOIN JUST ENTERED THIS CRITICAL ZONE…
-

 Politics1 day ago
The Part of the Electric Transition Nobody Wants to Discuss
-

 Sports6 days ago
2026 3M Open leaderboard: Scottie Scheffler finds putter in Round 1, sits three back
-

 Fashion6 days ago
16 Dresses for the High Summer Event
-

 News Videos6 days ago
The Peugeot Family: How 200 Years of an “Old Money” Dynasty Died in A Boardroom
-

 Business15 hours ago
Major shareholder moves on Canyon
-

 Crypto World4 days ago
XRP Ledger adds $2.6B as RWA inflows rank second
-

 Politics3 days ago
Spain sweeps the board at 2026 World Cup with individual awards
-

 Crypto World6 days ago
Uniswap (UNI) pushes deeper into tokenized RWAs with permissioned trading pools
-
 Entertainment1 day ago
‘Stargate’ Creator’s New Sci-Fi Series Returns for Season 3 Tomorrow
-
Crypto World7 days ago
SEC Agrees to Overhaul Recordkeeping After Settling Coinbase Lawsuit Over Gensler’s Lost Texts
-

 Tech5 days ago
Anthropic launches Claude Opus 5, a cheaper AI model for coding, agents and enterprise workflows
-

 Entertainment4 days ago
Sara Gilson Killed By Husband After Viral “Pedophile” TikTok Video
You must be logged in to post a comment Login