

Crypto World
HYPE Price Prediction: $50 Rally? Why Not
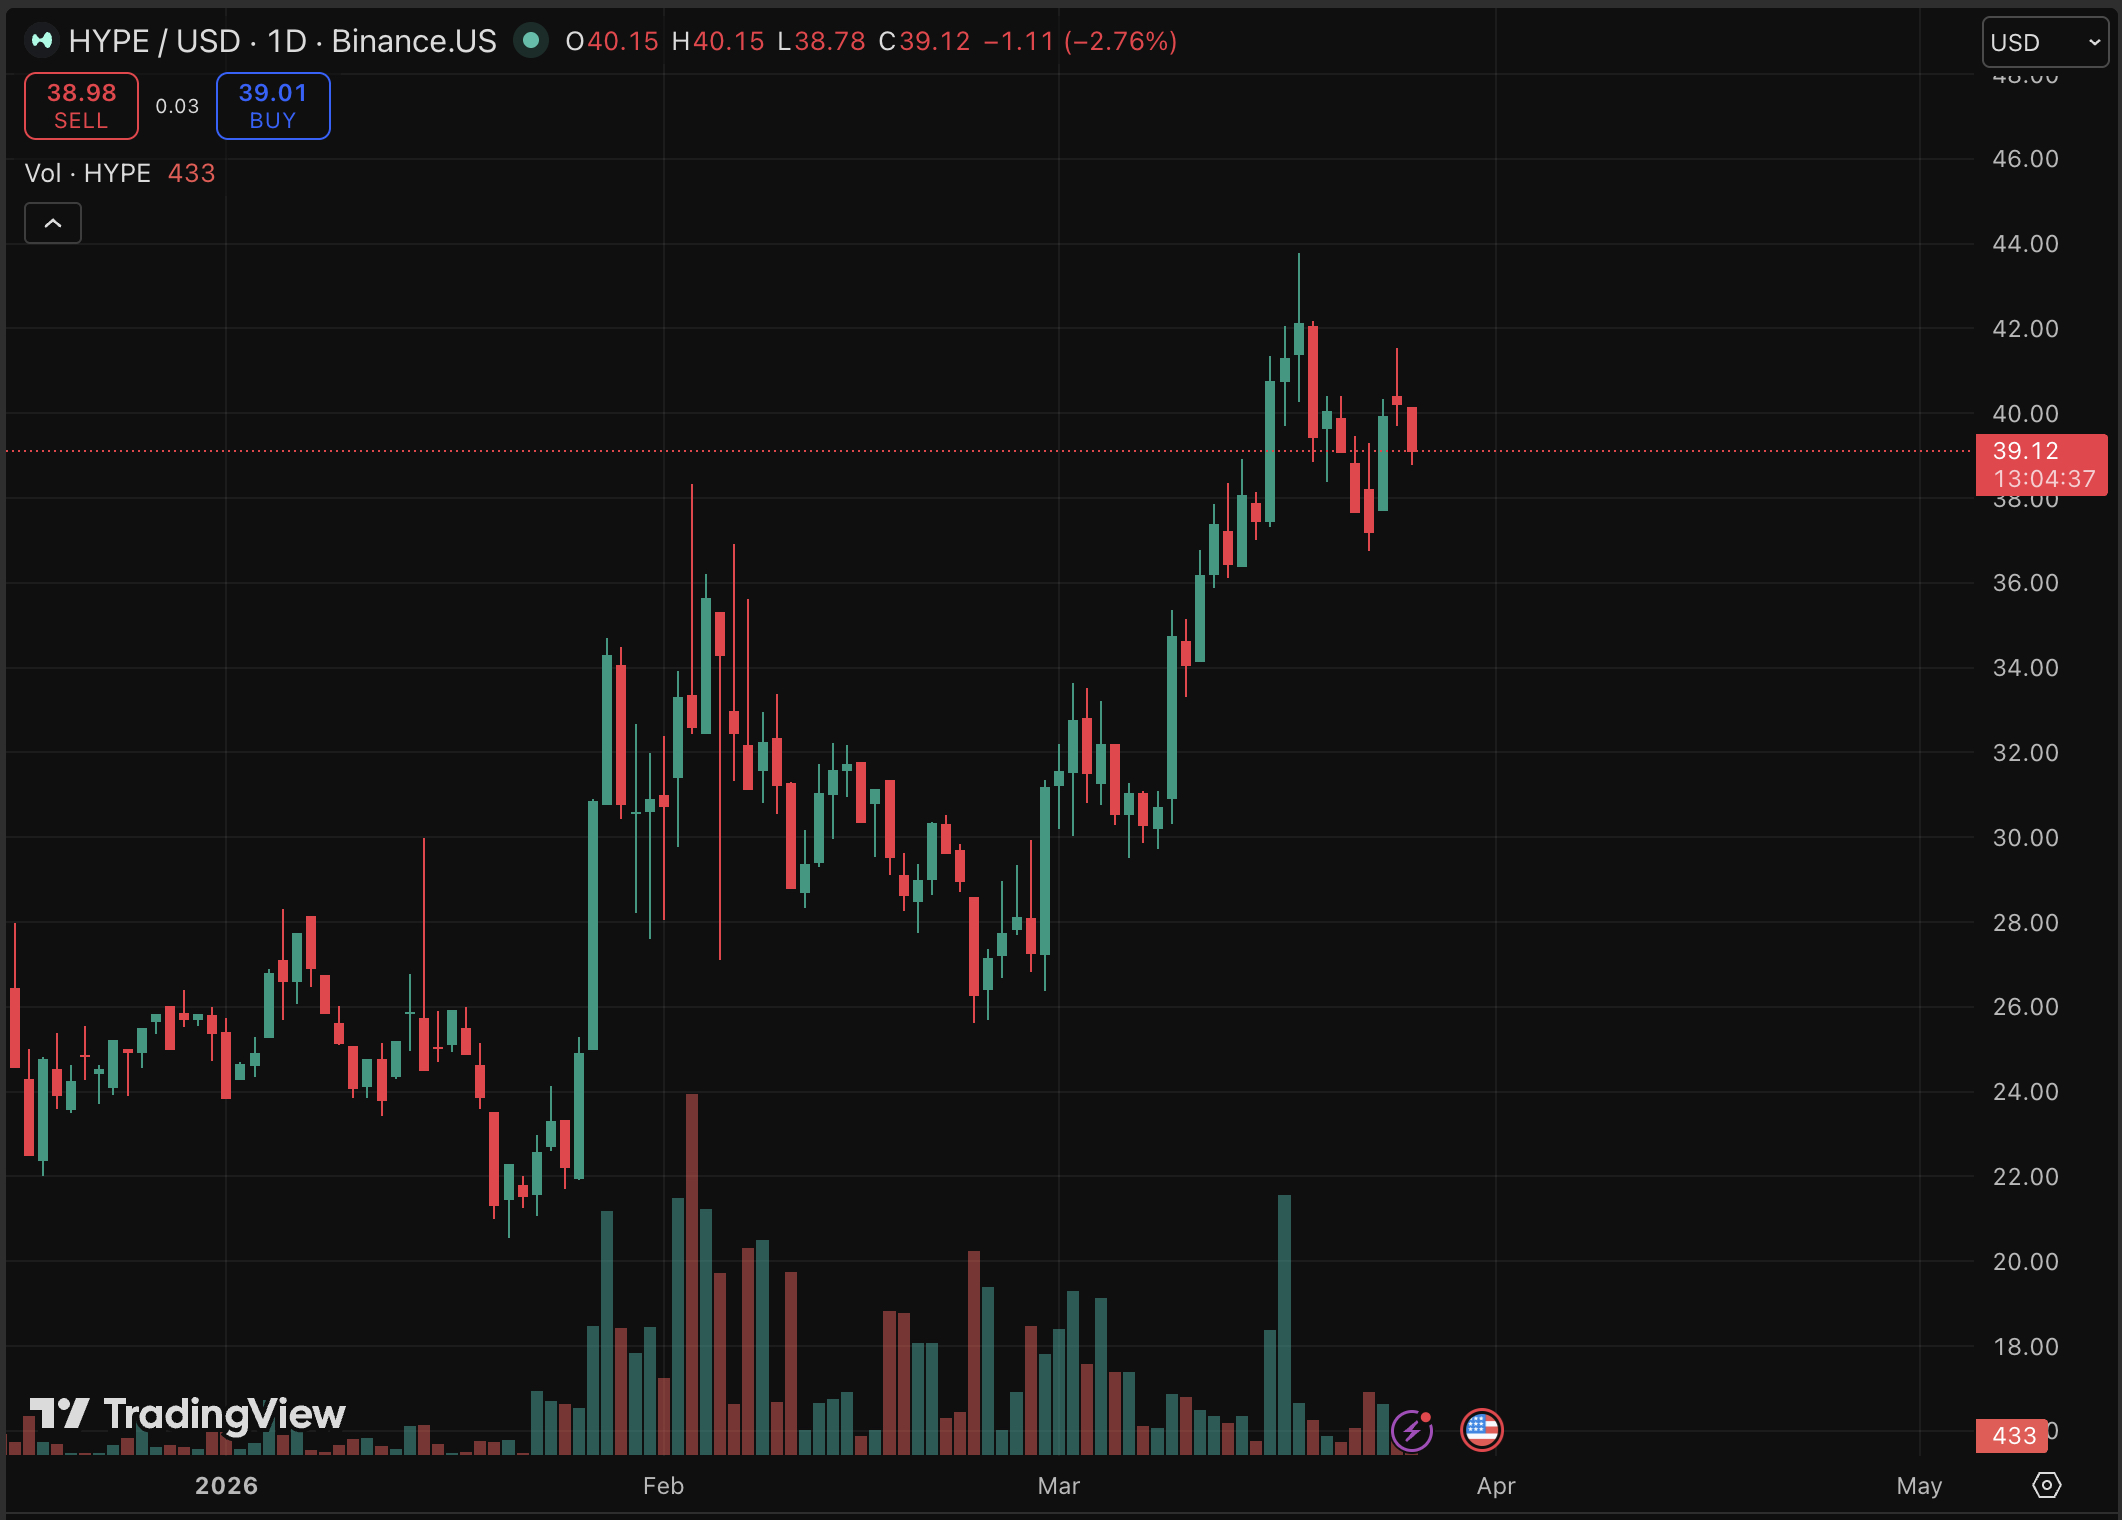
Hyperliquid’s HYPE is trading at $39, down almost 4% in the last 24 hours, but in the longer-term, the price chart tells a different prediction. A rising channel pattern in place since January 2026 remains structurally intact, and the question of whether $50 is achievable isn’t as outlandish as the daily candle suggests.
The catalyst mix last week was unusually strong. Hyperliquid launched an exclusive S&P 500 perpetual contract through a licensed deal with S&P Dow Jones Indices, covered by both the Wall Street Journal and Bloomberg.
HIP-3 open interest has hit $1.7 billion with 24-hour volume reaching $5.9 billion. Coinbase also enabled USDC transfers on HyperEVM. Fiat onboarding via credit card and bank deposit went live in select regions through a Swapped integration, a genuinely significant friction reduction for new traders.
Despite the micro pullback, broader market pressure from U.S.-Iran diplomatic uncertainty is the more likely culprit than any Hyperliquid weakness. The platform’s fundamentals are moving in one direction, and price is catching up.
Discover: The best pre-launch token sales
HYPE Price Prediction: Will Hyperliquid Hit $50 Before Q2?
At $39, HYPE sits near the lower boundary of its rising channel and just above the key support cluster at $37.
Resistance levels stack at $42. Breaking through this with volume would reopen the path toward the recent $44 high. From there, $50 requires roughly a 33% move from current levels, aggressive, but not unprecedented for an asset that has gained more than 140% over the past year.

The S&P 500 perp launch, running 24/7 with no traditional market hours, is the kind of product that attracts institutional-adjacent volume. That’s not priced in yet.
Discover: The best crypto to diversify your portfolio with
LiquidChain Targets Early Mover Upside as HYPE Tests Key Levels
HYPE’s rally potential is real, but a 33% move on a $4B+ market cap asset moves slower than infrastructure plays at the ground floor. Traders watching HYPE’s channel breakout while also tracking where liquidity infrastructure is heading might find the asymmetry elsewhere, specifically at the untapped L3 layer, where fragmentation is still an unsolved problem.
LiquidChain ($LIQUID) is a Layer 3 infrastructure project built around a single thesis: fuse Bitcoin, Ethereum, and Solana liquidity into one execution environment. No bridge hopping. No split deployments. Its Unified Liquidity Layer enables Single-Step Execution across chains, with Verifiable Settlement and a Deploy-Once Architecture that lets developers ship once and access all three ecosystems.
A new layer emerges. Only a few see it first. — LiquidChain (@getliquidchain) March 24, 2026
The future is LiquidChain  ⟁https://t.co/vqvBcdSj94 pic.twitter.com/R7ZeZ0NPGl
The presale is currently at $0.014 per $LIQUID, with more than $600K raised, and a 1700% APY staking rewards. For traders tracking cross-chain liquidity narratives, the entry price is worth examining.
This article is not financial advice. Crypto assets are volatile. Do your own research before making any investment decisions.
The post HYPE Price Prediction: $50 Rally? Why Not appeared first on Cryptonews.

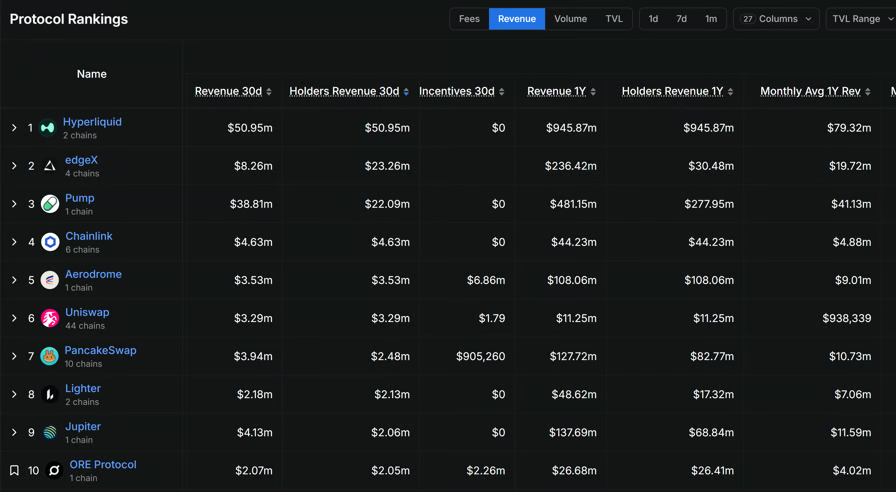
Three of DeFi’s relatively young applications, including Hyperliquid, EdgeX and Pump.fun, have distributed a combined $96.3 million to token holders over the past 30 days, as the sector’s focus shifts to actual earnings.
Hyperliquid led the pack, generating $50.95 million in revenue over the period, all of which went directly to token holders with zero spent on incentives, according to data from DefiLlama. Pump.fun came in second with $22.09 million returned to holders out of $38.81 million in total revenue. EdgeX followed with $23.26 million distributed to holders from $8.26 million in protocol revenue, suggesting that the platform is drawing on reserves or alternative income streams to reward holders.
On an annualized basis, Hyperliquid has generated $945.87 million in revenue over the past year, all returned to holders, while Pump.fun sits at $481.15 million and EdgeX at $236.42 million.
Among other major protocols, Chainlink returned $4.63 million to holders, Aerodrome $3.53 million and Uniswap $3.29 million across 44 chains. PancakeSwap generated $3.94 million in revenue but returned $2.48 million to holders while spending $905,260 on incentives.
Related: DeFi can freeze stolen funds, but not everyone agrees it should
Crypto community now focuses on revenue
The data comes as revenue is becoming the metric that matters most in crypto, with token holders pushing protocols to justify their valuations through actual earnings rather than transaction volumes or network growth figures.
“Nobody cares that your chain does 10x the TPS anymore,” wrote Robbie Klages, co-founder of The Rollup, referring to a blockchain’s measure of transactions per second. “The market is ‘show me the money right now.’ Treat it like a business not a network growth thesis,” he added.

Top DeFi protocols by Holders Revenue. Source: DefiLlama
Another X user wrote that the shift from narrative to earnings is “permanent now,” warning that protocols unable to show real revenue will be valued like pre-revenue startups in a rate hike environment, a reference to the kind of sharp devaluations that hit speculative assets when capital gets expensive.
Related: Aave-Linked DeFi United Details rsETH Recovery Plan
DeFi is becoming backend for onchain economy
Andre Cronje, founder of the popular DeFi protocol Yearn.Finance, said that DeFi in 2026 looks less like a speculative playground and more like functioning financial infrastructure. He noted that stablecoins have grown into a $320 billion market led by Tether and Circle, decentralized exchanges are processing over $160 billion in monthly spot volume and perpetual DEXs are handling $540 billion monthly.
Cronje added that lending protocols, including Aave, Morpho and Maple Finance, are sitting on $28 billion in active loans, while real-world assets are increasingly being used as onchain collateral. “DeFi is no longer just competing for APY. It is becoming the backend for the onchain economy,” he wrote on X.
Magazine: Guide to the top and emerging global crypto hubs — Mid-2026
Crypto World
BeInCrypto Institutional Research: 15 Digital Asset Custody Providers Behind Crypto Adoption


Digital asset custody is one of the core trust layers behind institutional crypto adoption. Best Custody Provider is an award category within The BeInCrypto Institutional 100, an annual research-driven program recognising institutional digital asset excellence across 26 categories and six pillars.
This category sits in Pillar 2: Capital Markets & Infrastructure. The 15 firms below are its longlist. A shortlist will be named in May 2026, with the winner announced at Proof of Talk in Paris on June 2–3, 2026.
- Long list: 15 custody providers across federal charters, NYDFS trust companies, MPC platforms, bank-backed JVs, APAC custodians, and off-exchange settlement networks
- Initial pool: More than 30 qualified custodians and digital asset custody platforms screened; 15 advanced to the long list
- Scoring: 50% quantitative data · 50% Expert Council
- Criteria assessed: Qualified custodian status, assets under custody, institutional client base, audit posture, product depth, jurisdictional reach, settlement innovation, reputation
- Data sources: OCC, NYDFS, FCA, FINMA, BaFin, MAS, MiCA-CASP registers, Jersey FSC, audited filings, company disclosures, PitchBook, Tracxn, and Crunchbase
| # | Firm | Custody Sub-Segment | HQ | Reach | Top Licensure / Charter | Representative Work |
|---|---|---|---|---|---|---|
| 1 | Anchorage Digital | Federal-chartered crypto custody | SF / NY / Sioux Falls / Singapore / Porto | $4.2B valuation Backed by a16z, GIC, Goldman Sachs, KKR, Visa, Tether |
First federally chartered US crypto bank Atlas Settlement Network is live with institutional integrations |
OCC National Trust Bank Charter MiCA via BaFin, VARA, Singapore, Korea |
| 2 | Coinbase Custody | US ETF custody provider | Wilmington / SF, USA | Custodian for 8 of 11 spot Bitcoin ETFs 80%+ of US Bitcoin ETF assets routed via Coinbase |
NYDFS Limited Purpose Trust Charter Coinbase Custody Trust Company |
Primary custodian for IBIT Co-custodian for Morgan Stanley Bitcoin Trust |
| 3 | BitGo | Federally chartered public custody | Sioux Falls / Palo Alto, USA | $104B+ AUC Thousands of institutional clients |
Custody tech used by TradFi banks Coverage across the US, EU, Switzerland, UAE, Singapore, Australia, Hong Kong |
NYSE IPO completed in Jan 2026 First public federally chartered digital asset infrastructure firm |
| 4 | Fidelity Digital Assets, NA | Asset manager-operated federal trust | Boston, USA | Custody for FBTC and FETH Backed by Fidelity’s ~$15T+ AUA platform |
Acquired TRES Finance and Dynamic Building a custody, wallet, and accounting operating system |
OCC charter approved Dec 2025 Plans include stablecoin issuance and staking services |
| 5 | BNY | Global custodian with crypto surface | New York, USA | ~$55.8T AUC/A Live BTC and ETH custody since 2022 |
OCC-regulated bank Institutional custody operations |
Co-custodian for Morgan Stanley MSBT IBIT cash custodian and administrator |
| 6 | Fireblocks | MPC-native institutional platform | New York / Tel Aviv | 2,400+ institutional clients $4T+ annual digital asset transfers in 2025 |
NYDFS BitLicense SOC 2 Type II + ISO 27001 |
OCC conditional national trust bank charter Conversion from the New York State trust |
| 7 | Ripple Custody (Metaco) | Bank custody technology stack | Lausanne / SF | Acquired Tungsten Custody in the UAE Standard Chartered reportedly weighing full takeover |
OCC conditional charter FINMA-regulated custody stack |
Ripple rebranded Metaco as Ripple Custody Ripple National Trust Bank’s charter was conditionally approved |
| 8 | Sygnum | Swiss-licensed crypto bank | Zurich, Switzerland | 2,000+ institutional clients $5B+ AUM; unicorn valuation |
FINMA banking licence MAS, Liechtenstein, ADGM permissions |
Reached unicorn status in Jan 2025 Sygnum Connect and Sygnum Protect live |
| 9 | Komainu | TradFi-backed custody JV | St Helier, Jersey | Operations across Jersey, UK, Italy, Singapore, UAE, Japan ~120 staff target |
Jersey FSC, UK FCA, UAE VARA Italy OAM and Singapore MAS via Propine |
$75M Series B funded in Bitcoin Propine acquisition expanded Singapore custody hub |
| 10 | Zodia Custody | Standard Chartered-backed custody | London, UK | ~150 staff across 7 offices 75+ digital assets supported |
UK FCA, Ireland MiCA-CASP, Lux, ADGM Hong Kong and Japan FSA coverage |
Sub-custodian for Clearstream Crypto offering AnchorNote off-exchange settlement launched |
| 11 | Crypto Finance Group | Exchange-parent regulated custody | Zurich, Switzerland | Deutsche Börse majority-owned Clearstream institutional distribution |
FINMA Switzerland BaFin licences + MiCA-CASP |
Aura private wealth platform launched Qualified custodian in the Fireblocks network |
| 12 | Hex Trust | APAC custody anchor | Hong Kong | $104M raised APAC and MENA institutional coverage |
HK SFC, MAS CMS, ADGM, VARA, DFSA Multiple licence categories |
ClearLoop settlement network expanded Komainu was integrated into ClearLoop in 2025 |
| 13 | Copper | Off-exchange settlement custody | London, UK | 200+ institutional clients Multi-billion-dollar assets under custody |
Switzerland SO-FIT affiliation Abu Dhabi ADGM licence |
~$2B valuation 9+ exchanges on the ClearLoop network |
| 14 | Ceffu | Institutional MPC and OES | Lithuania | 200+ institutional clients Multi-billion assets under custody |
Lithuania MiCA-CASP Multi-jurisdiction sub-custody arrangements |
MirrorX off-exchange settlement integrated with KuCoin EU institutional custody status expanded |
| 15 | Bakkt Trust | NYDFS-regulated US custody | New York, USA | ICE-origin institutional custody Multi-asset custody platform |
NYDFS Limited Purpose Trust Charter BitLicense + 50-state MTLs |
Bakkt Warehouse supports institutional custody $125M+ insurance across cold and warm wallets |
About This List
The BeInCrypto Institutional 100 — Digital Asset Custody (2026 Long List) identifies custody providers supporting institutional digital asset adoption. The category covers federally chartered crypto banks, NYDFS trust-company custodians, MPC-native platforms, bank-backed custody ventures, APAC-regulated custodians, exchange-parent custody platforms, and off-exchange settlement networks.
Firms primarily focused on stablecoin issuance are evaluated separately under stablecoin infrastructure categories. Parent firms may appear in other categories when their custody product line meets that category’s threshold independently.
Methodology
This category is evaluated under Track A of the BeInCrypto Institutional 100 methodology: 50% based on quantitative metrics and 50% on Expert Council scoring.
Assessment spans seven weighted criteria: regulator-recognized qualified custodian status, assets under custody and institutional client base, regulatory and audit posture, product depth, multi-jurisdiction reach, settlement and capital-efficiency innovation, and reputation.
Data was verified using OCC national trust bank charter approvals, NYDFS BitLicense and trust-company registers, FCA, FINMA, BaFin, MAS, MiCA-CASP authorizations, Jersey FSC records, audited filings, company disclosures, partnership announcements, and private-market sources, including PitchBook, Tracxn, and Crunchbase. Figures reflect the most recent available data at the time of publication.
The post BeInCrypto Institutional Research: 15 Digital Asset Custody Providers Behind Crypto Adoption appeared first on BeInCrypto.

TLDR:
- Hyperliquid burned over 45 million HYPE tokens worth more than $2 billion using collected platform fees.
- The exchange generates close to $1 billion annually and directs 100% of revenue toward HYPE buybacks and burns.
- Burned tokens represent roughly 14.5% of the 310 million HYPE distributed in the first trader airdrop.
- Hyperliquid recorded $1.5 billion in net inflows over three months as Arbitrum lost the same amount in outflows.
Hyperliquid has burned more than 45 million HYPE tokens as its fee-driven buyback model gains attention across the crypto market. The decentralized exchange recorded approximately $824,688 in fees within a single 24-hour period.
All collected fees went directly toward purchasing and burning HYPE tokens. The platform now reports close to $1 billion in annual revenue. Net flow data further shows $1.5 billion in inflows over the past three months.
Hyperliquid’s Buyback and Burn Model Sets a New Standard
Hyperliquid’s tokenomics structure differs from most crypto projects in circulation today. Rather than selling tokens to cover operational costs, the platform channels all revenue into buybacks. This approach has resulted in the permanent removal of 45,116,933 HYPE tokens from supply.
According to data shared by Hyperliquid Hub on X, the burned tokens carry a market value of over $2 billion. That figure equals roughly 14.5% of the entire first trader airdrop, which totaled 310,000,000 HYPE tokens. The scale of this burn reflects a consistent and structured approach to reducing supply.
The daily burn has remained steady, which sets it apart from one-time or irregular token removal events seen elsewhere.
Each fee cycle feeds directly into the Auto-Fill mechanism, which executes the buyback and burn automatically. Users who sell their HYPE to the AF effectively contribute to the permanent reduction of circulating supply.
With close to $1 billion in annual revenue, the platform sustains this model without relying on external funding or token sales.
This positions Hyperliquid as a revenue-generating protocol that returns value to its token holders through supply reduction rather than direct distributions.
Hyperliquid Records $1.5 Billion in Net Inflows Over Three Months
Capital movement data shows a strong preference for Hyperliquid among traders shifting funds between platforms.
The exchange recorded $1.5 billion in net inflows over the last three months alone. This trend points to growing user confidence in the platform’s structure and reliability.
By contrast, Hyperliquid Hub on X noted that Arbitrum recorded $1.5 billion in net outflows during the same period.
The contrast between the two figures shows a clear directional shift in where traders are choosing to deploy capital. Hyperliquid appears to be the primary destination for those exiting Arbitrum.
Net flow figures are a common measure of capital movement across blockchain platforms. Consistent inflows typically reflect user acquisition and growing liquidity. For Hyperliquid, the $1.5 billion figure adds to an already active period of protocol growth.
Together, the burn data and the net flow numbers paint a picture of a platform gaining both liquidity and long-term token value. The combination of revenue-backed buybacks and rising inflows continues to draw attention from traders watching on-chain activity closely.

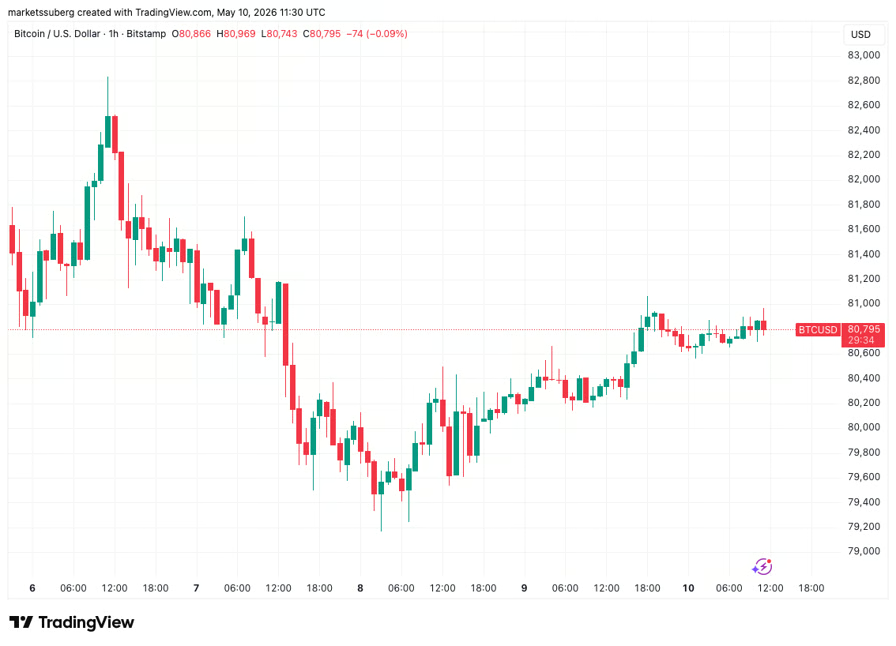
Bitcoin (BTC) eyed $81,000 into Sunday’s weekly close as traders saw a fresh support retest next.
Key points:
- Bitcoin preserves $80,000 over the weekend, but traders are waiting for a dip to retest a familiar chart feature.
- Continuation higher remains the overall consensus for what happens afterward.
- US CPI data is due out, with Bitcoin already “pricing in” the result.
Bitcoin traders: Sub-$80,000 retest next
Data from TradingView showed BTC price action trending higher after a mostly flat weekend, avoiding a return below $80,000.

BTC/USD one-hour chart. Source: Cointelegraph/TradingView
After a midweek trip to near $83,000 failed to hold, however, traders saw the need for BTC/USD to retest support — something that they now reiterated.
Of particular interest was the bull market support band — two moving averages just below the $80,000 mark.
“On the low-timeframes, after rejecting at the high-timeframe resistance range marked in purple, I believe the most likely outcome is a short-term pullback toward the 2D Bull Market Support Band, which has been a strong reversal zone over the last couple of months,” analytics account Cryptic Trades wrote alongside a chart in its latest post on X.
“As long as price continues to hold above the support band and the broader high-timeframe support range marked in blue around $75K, which aligns with the April 2025 bottoming formation, I believe the most likely outcome remains further upside.”

BTC/USD one-day chart. Source: Cryptic Trades/X
Trader Daan Crypto Trades agreed, calling the initial move above the support band “not a clean break.”
“Would want to see a move to at least clear that sticky area around the low $80Ks and hold there for a week or two,” he told X followers.

BTC/USD one-week chart. Source: Daan Crypto Trades/X
CPI already “priced in” to BTC
Ahead of fresh US inflation data next week, trader Killa warned of headwinds returning for BTC price strength.
Related: Bitcoin Bollinger Bands push key breakout as creator acts on positive signal
The Consumer Price Index (CPI) for April, due out on Tuesday, was set to show the ongoing impact of the US-Iran war and oil-price rises on the economy.
“Its priced in,” Killa wrote on X.
“BTC has rallied after the last two CPI releases. However, if we follow 2025 CPI price action, we may see bigger players start de-risking into the event counter narrative.”

BTC/USD chart with CPI releases. Source: Killa/X
Support levels to watch also included the area around the bull market support band, with $74,000 on the radar, should it fail.
“I would watch for liquidity sweeps around this pivot to signal the next move,” Killa added.


Consumer fintechs and payment platforms are becoming one of the main distribution layers for crypto access. Best Digital Assets Fintech is an award category within The BeInCrypto Institutional 100, an annual research-driven program recognising institutional digital asset excellence across 26 categories and six pillars.
This category sits in Pillar 1: Retail to Crypto Bridge. The 15 firms below are its longlist. A shortlist will be named in May 2026, with the winner announced at Proof of Talk in Paris on June 2–3, 2026.
- Long list: 15 fintechs across crypto-native payment infrastructure, stablecoin wallets, Lightning-based consumer rails, retail brokers, enterprise acquirers, and cross-border fintech platforms.
- Initial pool: More than 30 consumer and B2B fintechs screened; 15 advanced to the long list.
- Scoring: 30% quantitative data · 50% Expert Council · 20% disclosed company data.
- Criteria assessed: Crypto product depth, distribution scale, regulatory standing, innovation, capital maturity, geographic reach, and reputation.
- Data sources: NYDFS, FinCEN, FCA, MiCA-CASP, OCC, MAS, CySEC, AUSTRAC, FINTRAC, audited filings, company disclosures, PitchBook, Tracxn, and Crunchbase.
| # | Firm | Fintech Sub-Segment | HQ | Reach | Top Crypto Licensure / Product | Representative Work |
|---|---|---|---|---|---|---|
| 1 | Stripe | Crypto-native payment infrastructure | South San Francisco / Dublin | 100+ country stablecoin accounts 100M+ businesses on Stripe |
Bridge OCC charter conditionally approved | Acquired Bridge and Privy Open Issuance powers Phantom CASH and MetaMask mUSD |
| 2 | PayPal / Venmo | Consumer wallet + stablecoin issuer | San Jose, USA | 436M active accounts PYUSD across 4 chains |
PYUSD issued by Paxos Trust | Expanded PYUSD into 70 markets Launched PYUSDx framework with MoonPay and M0 |
| 3 | Block (Cash App) | BTC-native consumer fintech | San Francisco, USA | 57M Cash App monthly actives $2.4B+ Bitcoin revenue Q4 2024 |
FinCEN MSB + state MTLs | Expanded Lightning integration globally Spiral continued Bitcoin core funding |
| 4 | Robinhood | Retail broker with crypto stack | Menlo Park, USA | 26M funded customers Bitstamp adds 5M+ users |
MiCAR access in EU Bitstamp FCA + NYDFS licences |
Closed Bitstamp acquisition in 2025 Expanded into Canada through WonderFi |
| 5 | Circle | Stablecoin issuer + banking distribution | Boston / NYC | USDC $73B market cap Embedded into core banking platforms |
OCC conditional charter approval | NYSE IPO completed in 2025 Circle Payments Network expanded to 200+ banks |
| 6 | Revolut | Multi-product fintech with crypto | London, UK | 65M customers globally Revolut X across the UK and the EEA |
FCA crypto registration + MiCAR-CASP | Expanded Revolut X across Europe Launched self-custody Revolut Wallet |
| 7 | SoFi Technologies | US fintech with crypto relaunch | San Francisco, USA | 10.9M members Galileo powers 100M+ accounts |
FinCEN MSB + state MTLs | Relaunched crypto trading in 2025 Stablecoin payments roadmap disclosed |
| 8 | KAST | Stablecoin-native cross-border fintech | Singapore | 1M+ users 190+ countries |
Operates through licensed partners | Closed $80M Series A in 2026 Stablecoin spending integrated with Visa |
| 9 | Nubank | LatAm fintech crypto distribution | São Paulo, Brazil | 65M customers globally Revolut X across UK and the EEA |
Paxos institutional trust framework | Expanded token support during 2025 Cross-border crypto custody rollout planned |
| 10 | eToro | Social trading + crypto platform | Tel Aviv / Bnei Brak | 30M users globally 100+ countries |
FCA crypto registration + AUSTRAC + FinCEN | Nasdaq IPO completed in May 2025 Unified crypto, stocks, and ETF trading |
| 11 | Strike | Bitcoin and Lightning fintech | Chicago, USA | 100+ countries 50-state US coverage achieved |
NY BitLicense + FinCEN MSB | Approved for NY operations in 2026 Launched Bitcoin-backed lending products |
| 12 | ChangeNOW | Non-custodial fintech ecosystem | Saint Vincent and the Grenadines | 8M+ users $1B+ monthly volume |
SOC 2 Type II + ISO 27001 | Expanded NOW ecosystem across wallets, custody, APIs, and payments Integrated across major wallet providers |
| 13 | Adyen | Enterprise payment processor | Amsterdam, Netherlands | MiCAR access in the EU Bitstamp FCA + NYDFS licences |
DNB + ECB supervised | Crypto acceptance expanded for Web3 merchants Stablecoin payout rails under development |
| 14 | Checkout.com | Enterprise merchant acquirer | London, UK | 2,000+ employees globally | FCA-authorized + DIFC regulated | Stablecoin settlement pilot announced in 2025 Expanded infrastructure for exchanges and onramps |
| 15 | BitPay | Crypto payments processor | Atlanta, USA | Active since 2011 Supports BTC + 12 other assets |
FinCEN MSB + multi-state MTLs | Expanded BitPay Card nationally Maintained merchant partnerships across retail and payments |
About This List
The BeInCrypto Institutional 100 — Digital Assets Fintech (2026 Long List) identifies fintech firms connecting fiat payment systems with digital assets through consumer apps, enterprise infrastructure, stablecoins, Lightning rails, wallets, and embedded crypto services.
The category includes crypto-native payment processors, retail fintech platforms, enterprise acquirers, stablecoin-driven fintechs, and non-custodial ecosystems. Firms whose primary role is fiat onramp infrastructure are evaluated separately under the Onramp/Offramp category.
Methodology
This category is evaluated under Track B of the BeInCrypto Institutional 100 methodology: 30% quantitative metrics, 50% Expert Council scoring, and 20% disclosed data.
Assessment spans seven weighted criteria: crypto product depth, distribution scale, regulatory standing, innovation, capital maturity, geographic reach, reputation, and contribution across fintech sub-segments.
Data was verified against NYDFS, FinCEN, FCA, MiCA-CASP, OCC, MAS, CySEC, AUSTRAC, and FINTRAC registers, as well as audited filings, company disclosures, partnership announcements, and private-market sources such as PitchBook, Tracxn, and Crunchbase.
The post BeInCrypto Institutional Research: 15 Fintechs Bridging Fiat and Digital Assets appeared first on BeInCrypto.
TLDR:
- CME Group listed SUI futures, making Sui only the fourth L1 alongside BTC, ETH, and SOL in regulated derivatives.
- Sui processed 65.8 million transactions in a single day within two months of its May 2023 mainnet launch.
- Three US staking ETFs from Grayscale, Canary Capital, and 21Shares listed in early 2026 on major exchanges.
- Hashi enables native Bitcoin collateral on Sui without wrapping or custody, with 20-plus institutions committing on day one.
Sui Network has completed three years since its May 2023 mainnet launch, marking the milestone with a string of institutional developments.
CME Group listed SUI futures contracts, making Sui only the fourth Layer-1 blockchain to enter CME’s regulated derivatives market.
The others before it were Bitcoin, Ethereum, and Solana. Three staking ETFs have listed in the US, cumulative active addresses passed 228 million, and DeFi total value locked peaked at $2.6 billion.
From Parallel Execution to Protocol Maturity
Sui launched with a clear architectural thesis: parallel execution should be built into a blockchain’s foundation, not added as an afterthought.
Within two months of launch, the network processed 65.8 million transactions in a single day. That figure was the highest recorded across all blockchains at the time, and gas fees remained nearly flat throughout.
Two infrastructure additions in 2023 shaped the chain’s long-term trajectory. In July, the Sui Foundation launched DeepBook, a native central limit order book embedded directly into the protocol.
Every DeFi application on Sui draws liquidity from the same shared pool, which is an uncommon design choice among Layer-1 networks.
In September 2023, zkLogin went live, allowing users to authenticate Web3 apps using Google or Facebook credentials.
Zero-knowledge proofs handle identity on-chain, removing the need for seed phrases or separate wallet setup. This lowered the entry barrier for mainstream users considerably.
By 2024, the focus shifted to consensus performance. In August, Mysticeti launched as a DAG-based consensus engine, cutting latency by 80% and bringing finality to 640 milliseconds.
Traditional financial players responded: Franklin Templeton announced a strategic partnership, and Grayscale launched the Grayscale Sui Trust.
Stablecoins, Bitcoin Collateral, and Regulated Products
Heading into 2025 and 2026, the infrastructure stack filled in steadily. Walrus Protocol added decentralized storage in March 2025, completing the native stack from execution to data storage. Mysticeti V2 followed in November, delivering sub-second finality and horizontal validator scaling.
In December 2025, 21Shares listed the first-ever SUI ETF on Nasdaq, a 2x leveraged product. By February 2026, three staking ETFs from Grayscale, Canary Capital, and 21Shares had listed in the US.
That same period saw USDsui launch through Stripe’s subsidiary Bridge, and cumulative stablecoin transfers on Sui crossed $1 trillion in March 2026.
Perhaps the most consequential development came with Hashi, developed by Mysten Labs. Hashi is a native Bitcoin collateralization primitive that allows BTC to be used directly as on-chain collateral, without wrapping or centralized custody.
The system is secured through MPC and Move’s ownership model. Over 20 institutions committed on day one, as noted in a post from the official Sui Network account.
Zero-fee stablecoin transfers were also announced at Sui Live Miami as coming soon, extending the chain’s payments utility further.
Crypto World
Caesars Brought Las Vegas Online. DraftKings Brought Fantasy Sports Online. ZunaBet Brought The Future Online.

Every platform’s identity is shaped by where it came from. Caesars brought the weight of Las Vegas online — decades of land-based casino heritage, a loyalty program connecting digital play to physical properties, and a brand that carried implied quality into the online space before the product had to prove it independently. DraftKings brought daily fantasy sports online — an existing engaged audience, American sports cultural fluency, and the operational readiness to capture the US sports betting market when regulation opened it.
Both identities produced genuine platforms for genuine players. The Caesars player who trusts the name from their Las Vegas visits. The DraftKings player who was already using the platform for fantasy leagues before real-money betting was legal. Both platforms continued to serve those players after the transition to licensed gambling.
ZunaBet brought something different online in 2026. Not a land-based heritage. Not a fantasy sports audience. The future — a platform built from scratch in the current year for the player who exists in the current year. The crypto-native player. The esports bettor. The player who wants sixty-three providers worth of game variety and a loyalty program that states its return before the first deposit. This article examines all three and explains what each identity produced.
Caesars: The Las Vegas Identity Online
The Caesars identity online is built on the transfer of trust from physical to digital. A player who has stayed at a Caesars hotel, played at a Caesars casino floor, or earned tier status through land-based activity finds the online product a continuation of a relationship that already existed. The brand’s implied quality arrived before the product had to earn it independently.
The casino product reflects genuine casino heritage. A substantial library from established providers, live dealer content informed by physical table game expertise, and a product that benefits from decades of understanding how casino players engage with their favourite games. The Caesars online casino is built by people who have been operating casinos long enough to understand the category deeply.
The sportsbook covers major US and global sports with in-play betting. The product serves the player who wants sports alongside casino from a trusted name.
Caesars Rewards is the identity’s most distinctive product feature. The cross-platform connection between online activity and land-based tier status — hotel rooms, dining, entertainment, physical casino status — has genuine value for the player who uses Caesars properties. Online gambling becomes part of a broader relationship with the brand rather than a standalone product.
The identity has clear limits for the player outside its profile. The cross-platform loyalty feature that makes Caesars distinctive is irrelevant to the exclusively online player who never visits a physical property — the program reduces to a standard points system for that player. Payment infrastructure is fiat-based with business-day withdrawal timelines. Crypto support is minimal. Geographic operation is bounded by US state licensing.
DraftKings: The Fantasy Sports Identity Online
The DraftKings identity online is built on audience conversion. The daily fantasy sports player who spent years managing lineups and tracking statistical outcomes found the transition to real-money sports betting natural when the legal framework allowed it. The brand they trusted for fantasy became the brand they trusted for betting without requiring them to learn a new platform or extend trust to a new name.
The sportsbook is the product that audience conversion produced. American sports coverage built for the fantasy-origin bettor — NFL with the market depth and statistical orientation that reflects genuine understanding of how this player engages with football, NBA, MLB, NHL, and college sports with comparable investment. The app is refined through years of this specific player’s feedback. In-play coverage is reliable. The product serves its converted audience consistently.
The casino has grown in proportion. A reasonable library, live dealer content, standard table game variants. The product serves the sports-first player’s secondary casino interest.
Dynasty Rewards is the identity’s loyalty expression. Points accumulate through play, tiers reflect volume, and benefits are redeemed through a structure that most experienced players find delivers less actual cash value than the tier descriptions initially implied when the conversion mathematics are properly applied. The gap between promise and delivery is consistent enough that it forms a regular part of how players describe their loyalty experience on review platforms.
The payment identity is fiat banking for the daily fantasy convert. Business-day withdrawal timelines. Bitcoin in select states as a response to demand rather than a native infrastructure commitment. Geographic operation is bounded by licensed US states.
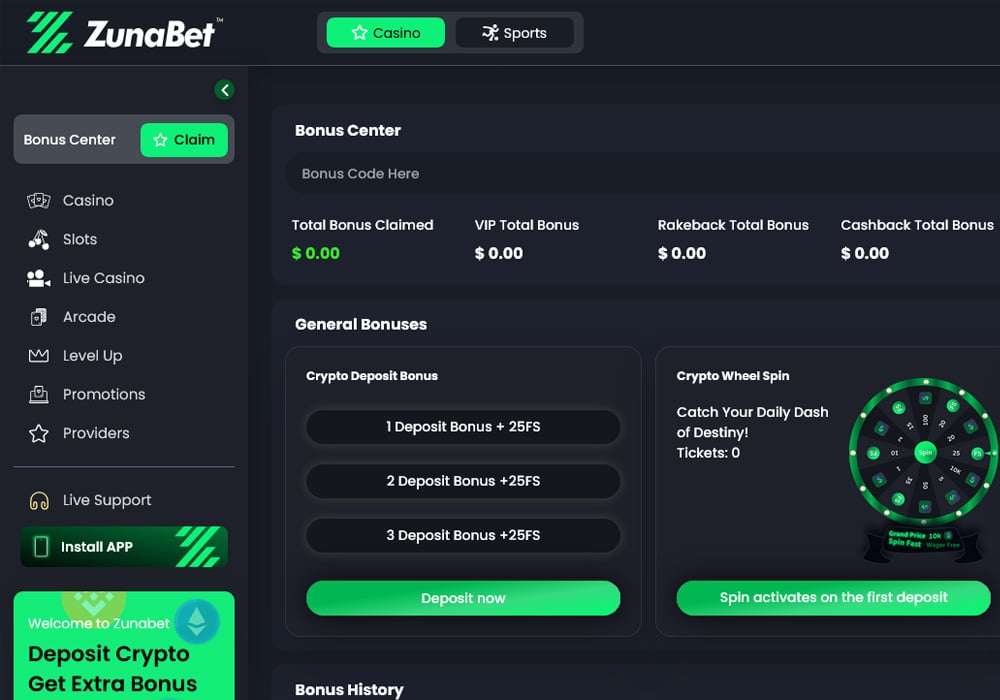
ZunaBet: The Future Identity Online
ZunaBet launched in 2026 under Strathvale Group Ltd, operating under an Anjouan gaming license and registered in Belize. The team carries over 20 years of combined industry experience. It is not a US licensed operator and it does not hold state-level certification. Its identity is not built on transferring trust from a physical brand or converting a pre-existing digital audience. Its identity is built on being built in 2026 for the player who exists in 2026.
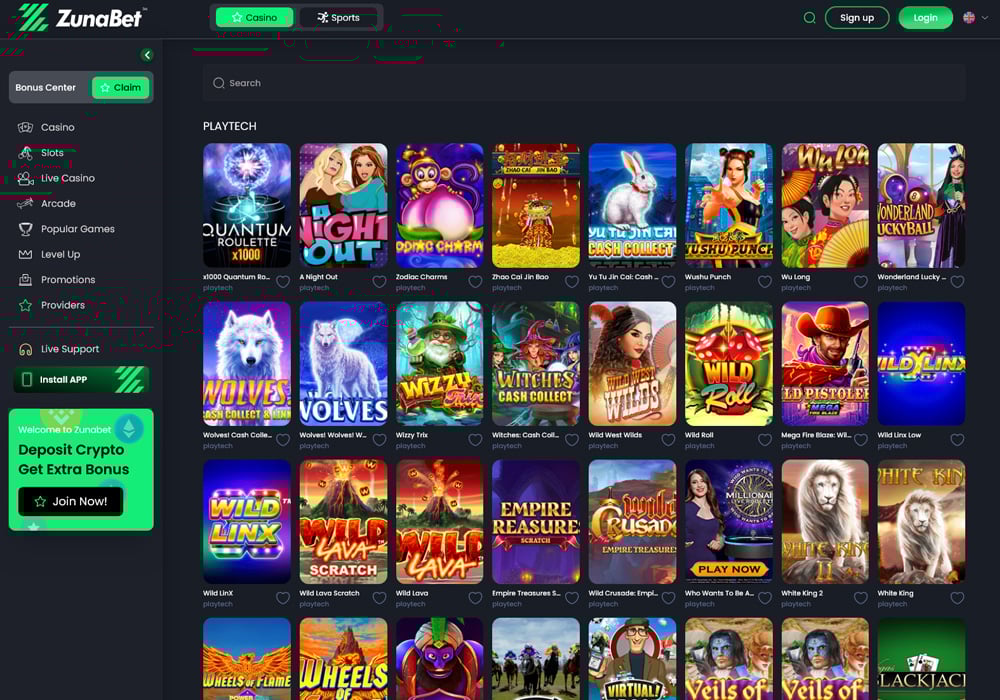
The game library is what a future-built casino identity looks like. ZunaBet carries 11,294 titles from 63 providers. The Caesars casino identity reflects land-based heritage. The DraftKings casino identity reflects sports-first priorities. ZunaBet’s casino identity reflects a player who needs genuine variety from multiple creative sources to stay engaged over the long term — sixty-three different approaches producing content with different mechanics, different volatility profiles, and different visual identities. Evolution for the full live dealer catalogue. Pragmatic Play across multiple categories. Hacksaw Gaming for the high-volatility mechanics experienced players seek. Yggdrasil for its distinctive design philosophy. BGaming for the crypto-native aesthetic. The identity sustains long-term engagement because it was built for the player who cycles through limited libraries quickly.
The sportsbook is what a future-built sportsbook identity covers. Football, basketball, tennis, NHL, and other major global sports alongside CS2, Dota 2, League of Legends, and Valorant as genuine primary markets. The future identity includes esports as a foundational sportsbook category because the player it was built for follows competitive gaming as seriously as traditional sports. Virtual sports and combat sports complete the coverage.
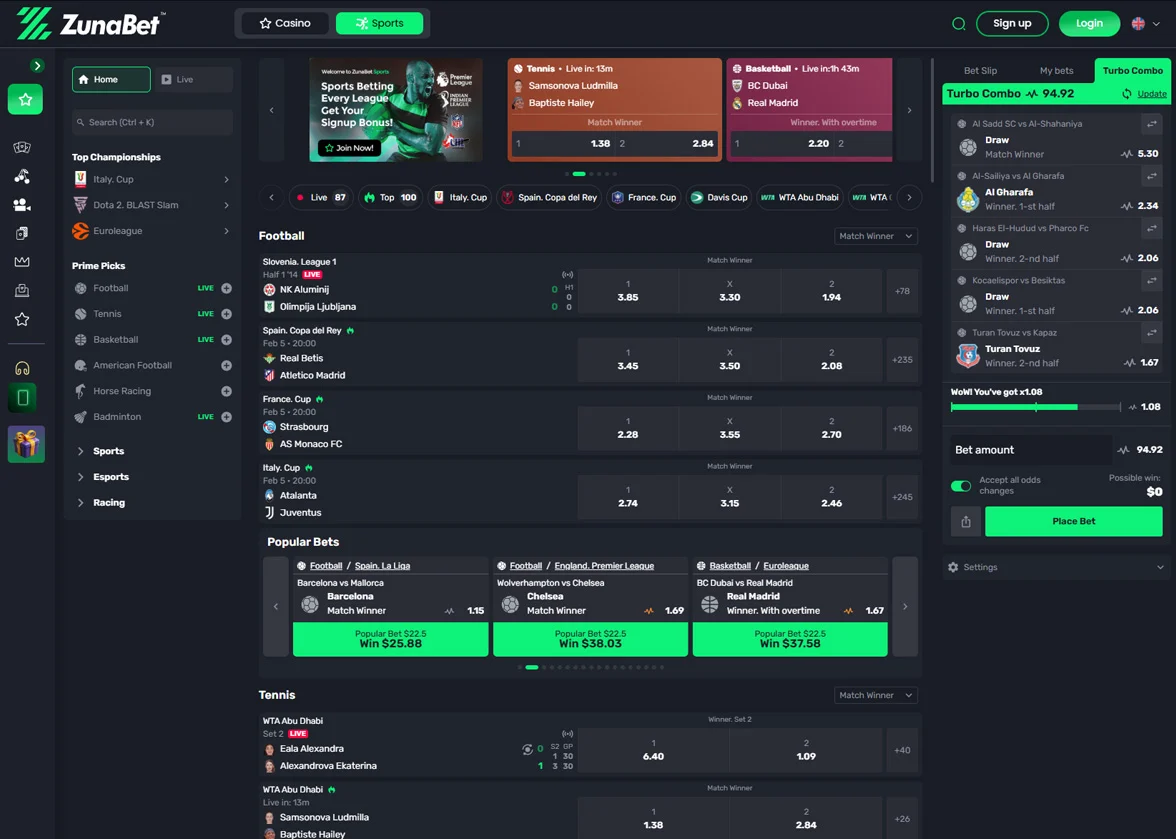
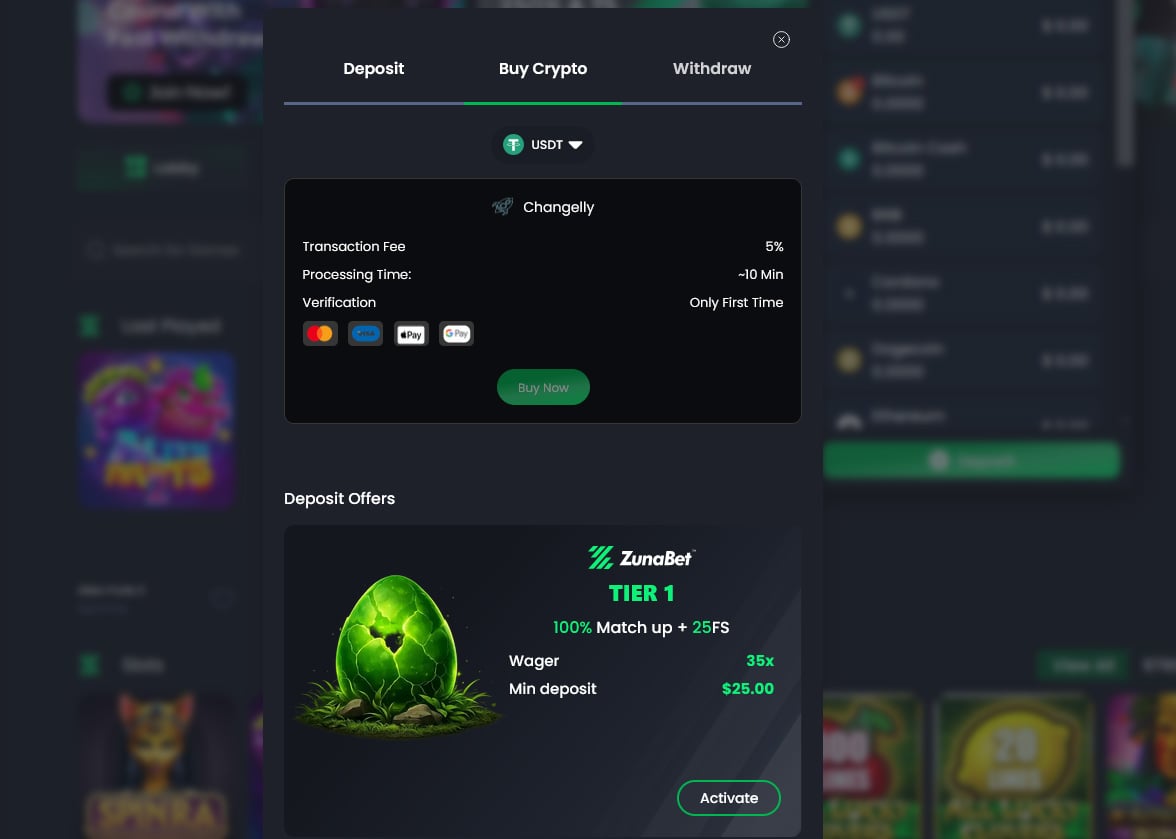
The payment identity is what a future-built crypto infrastructure looks like. More than 20 cryptocurrencies supported natively — BTC, ETH, USDT across multiple chains, SOL, DOGE, ADA, XRP, and others. No platform processing fees. Withdrawals settling in minutes. Apps across iOS, Android, Windows, and MacOS with 24-hour live chat support. The future identity was built for the player who holds cryptocurrency and expects platforms to handle it natively rather than approximately.
Payments: Three Identities, Three Outcomes
The payment comparison is a direct illustration of what three different identity origins produce.
Caesars’ land-based identity produces fiat banking payments — the infrastructure that casino hotels and physical gaming operations have always used. Business-day withdrawal timelines. Minimal crypto. The outcome reflects the identity’s origin.
DraftKings’ daily fantasy identity produces fiat banking payments — the infrastructure the fantasy sports platform was built on and the online sportsbook inherited. Similar timelines. Bitcoin in select states as a concession rather than a commitment. The outcome equally reflects the identity’s origin.
ZunaBet’s 2026 identity produces native crypto payments — the infrastructure built for the player who arrived in 2026 with cryptocurrency as their primary financial instrument. Twenty-plus coins natively supported. Minutes rather than days. No fees beyond network costs. The outcome reflects an identity built for the current moment rather than transferred from a previous one.
Loyalty Programs: Three Identities, Three Outcomes
The loyalty comparison is equally a comparison between identity outcomes.
Caesars’ identity produces Caesars Rewards — a cross-platform program with genuine value for the player who uses physical Caesars properties and a standard points system for the player who does not. The outcome serves one player type distinctively and another adequately.
DraftKings’ identity produces Dynasty Rewards — a points system that accumulates toward redemption options delivering less actual value than the tier descriptions implied for most players who calculate it. The outcome reflects an identity that inherited the points-loyalty standard of its era.
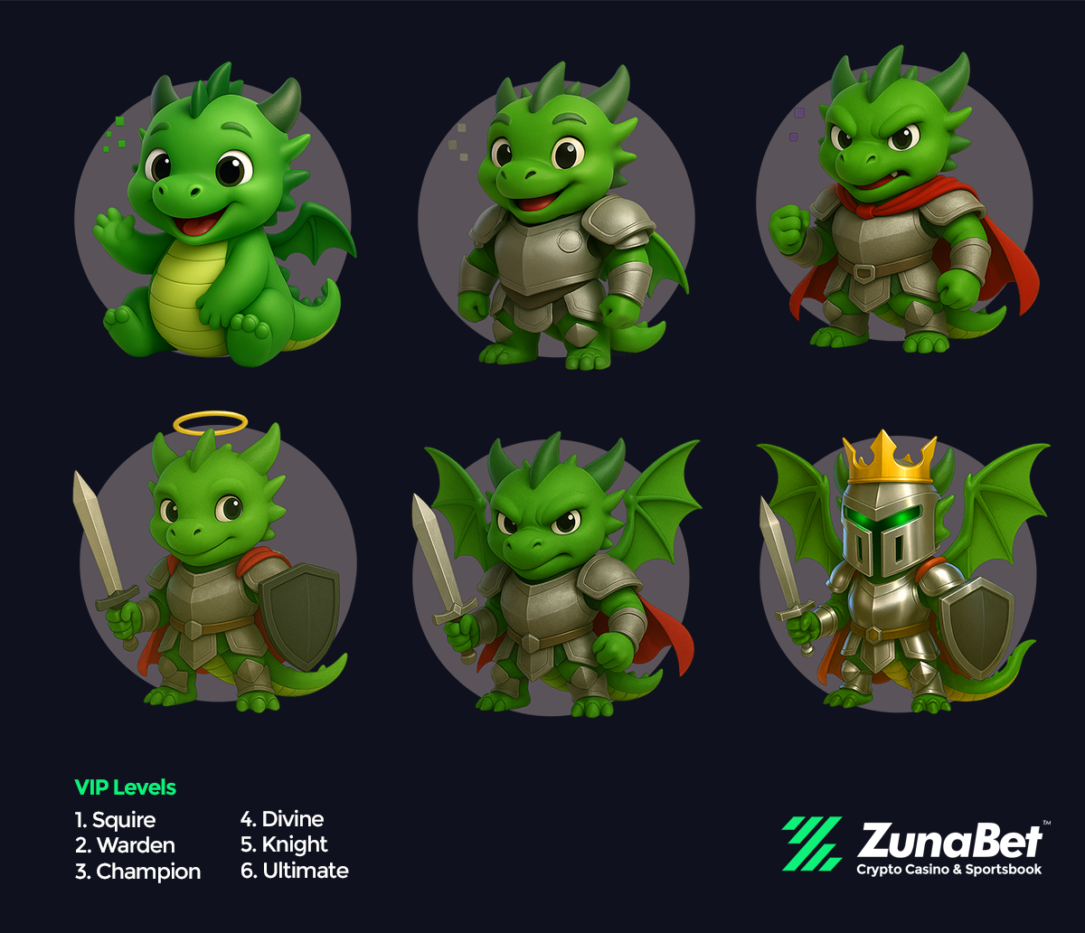
ZunaBet’s identity produces the dragon evolution loyalty system — six tiers, Squire through Ultimate, with a gamified mascot called Zuno and direct rakeback rates of 1%, 2%, 4%, 5%, 10%, and 20%. All tiers open. All rates applying to all activity. No conversion. No invitation. The outcome reflects an identity built for the player whose loyalty expectation is transparency rather than implied value.
Twenty percent at the Ultimate tier. The identity produces a loyalty outcome that the player can calculate before joining and verify throughout membership. Additional tier benefits — up to 1,000 free spins, VIP club access, double wheel spins — extend the identity’s loyalty outcome beyond the core rakeback.
The Welcome Bonus
ZunaBet new players receive a bonus across three deposits totalling up to $5,000 plus 75 free spins. First deposit matched 100% up to $2,000 with 25 free spins. Second deposit matched 50% up to $1,500 with 25 spins. Third deposit matched 100% up to $1,500 with 25 spins.
Caesars and DraftKings offer welcome promotions within their respective regulated US markets. Current terms vary by state and should be confirmed directly on each platform.
Three Identities, One Direction
Caesars brought Las Vegas online and its identity continues to serve the player who values that heritage and the cross-platform loyalty connection it enables. The identity is genuine and the outcome it produces continues to attract its intended player.
DraftKings brought daily fantasy sports online and its identity continues to serve the player who made that conversion. The identity is equally genuine and the outcome it produces continues to attract its intended player.
ZunaBet brought the future online in 2026 and its identity serves the player neither established identity was built for — the crypto-native, esports-betting, rakeback-expecting, large-library-needing player whose profile was not part of either established identity’s origin.
ZunaBet launched in 2026 and its identity is still being proven over time. Both established identities were tested and confirmed across years of consistent operation. ZunaBet’s identity is early in that testing and players should weigh that honestly.
But the identity built for the player who exists now — rather than the player who existed when Caesars built its land-based brand or when DraftKings built its fantasy sports audience — launched in 2026. That identity is ZunaBet’s and in 2026 the player it was built for is finding it.
Disclaimer: This is a Press Release provided by a third party who is responsible for the content. Please conduct your own research before taking any action based on the content.

Bitcoin is entering the week with a cautious outlook as U.S. inflation data loom, and fresh signals from the Cleveland Fed’s inflation nowcast suggest April CPI could reaccelerate. The numbers imply a firmer backdrop for headline inflation, which could limit near-term relief for risk assets, including Bitcoin. The official April CPI release is due on May 12, and market participants will be parsing whether the monthly pace cools while the annual pace re-accelerates.
According to the Cleveland Fed’s inflation nowcast, April CPI is projected at 3.56% year over year, up from 3.3% in March. The model also expects a monthly CPI rise of about 0.45%, with core CPI at 2.56% YoY and 0.21% MoM, compared with 2.6% and 0.2% previously. This mixed picture—headline acceleration alongside a slower monthly pace—keeps the inflation narrative in a tug of war and could influence the Federal Reserve’s next steps on policy. Cleveland Fed inflation nowcasting notes the official data release is approaching on May 12.
Bitcoin has historically shown resilience around CPI prints, but the latest setup underscores a balancing act. After the March CPI report showed headline inflation at 3.3% year over year, BTC advanced more than 15%, a move some observers attributed to fresh institutional demand entering the market. Cointelegraph noted the thrust from institutional buyers following the March print, helping to soak up new supply and support prices despite the inflation backdrop.
That support, however, may be changing. The same reporting highlighted shifts in the buy-side dynamics as institutions recalibrated their approaches to BTC exposure. In particular, Strategy—a notable BTC buyer via its STRC vehicle—has paused its Bitcoin purchases, reducing the immediacy of new capital flowing into the market. The STRC preferred stock remains trading below its $100 par value, a condition that can limit a company’s ability to raise fresh capital for further crypto buys. STRC.LIVE shows weekly Bitcoin buying activity has slowed as a result, tempering what had been a supportive bid from large investors.
Against this backdrop, market watchers are watching a developing technical formation that could shape the next move. A rising wedge pattern has emerged on Bitcoin’s daily chart, a classic bearish reversal setup that often resolves with a break below the lower trend line and a subsequent decline equal to the pattern’s height. Bitcoin was tracing toward the wedge’s apex near the mid-$80,000s, around $84,000, as markets awaited confirmation of the breakout direction. A breakdown from that level could pave the way toward the wedge’s downside target near $70,000, while a breakout above the apex could nullify the setup and open the door to higher prices, potentially toward the $90,000–$95,000 zone if momentum resumes. TradingView-based analysis puts the apex and pattern in focus as risk assets digest the CPI outlook.
Key takeaways
- The Cleveland Fed nowcast projects April CPI at 3.56% year over year, with a monthly rise of about 0.45% and core CPI at 2.56% YoY and 0.21% MoM.
- Bitcoin is forming a rising wedge on the daily chart, with a potential breakdown toward $70,000 if the lower trend line is breached.
- Institutional demand that aided BTC in prior CPI cycles appears to be cooling, as Strategy pauses new BTC purchases and its STRC stock trades below par, limiting fresh capital flow.
- If Bitcoin breaks above the wedge apex near $84,000 and clears the 200-day moving average, the next upside could target the $90,000–$95,000 region.
Inflation dynamics and the risk-asset calculus
In macro terms, the April CPI picture remains mixed. A firmer annual headline can reinforce the view that the Fed has limited room to trim rates quickly, which tends to weigh on speculative trades such as Bitcoin. Yet the slower monthly pace keeps the probability of a more gradual policy adjustment on the table. For crypto investors, the key takeaway is that the macro backdrop continues to hinge on inflation’s trajectory and the Fed’s response, rather than a single data point alone.
Historically, CPI surprises have amplified volatility around inflation data releases. The market’s reaction often depends on how the prints align with expectations and how they alter rate-cut expectations. The CME Group’s FedWatch tool tracks these probabilities, illustrating how traders reprice expectations around key CPI milestones and Federal Reserve communications. CME FedWatch remains a barometer for the path of policy around CPI days.
Technical setup and what it could mean for traders
The rising wedge formation on BTC’s daily chart is a cautionary sign for bulls. Historically, such patterns precede a bearish reversal, particularly when price tests the apex near major moving averages or trend lines. In this case, the apex sits close to the $84,000 mark, with a break lower threatening a move toward $70,000—the midpoint of the wedge’s downside projection. On the upside, a sustained break above the apex could invalidate the pattern and reframe risk into an upside run toward the next resistance belt around $90,000 to $95,000, contingent on broader market momentum and on-chain demand.
In the longer view, traders will be watching for interactions with the 200-day exponential moving average, a common inflection point that can determine whether the market sustains a new uptrend or reverts to a range-bound pattern. A clean breakout above the 200-day EMA in the current regime could refresh upside targets, but that hinges on a continuing positive impulse from macro data and on-chain liquidity.
Market structure and the buy-side dynamics to watch
The domino effect of a cooling on institutional demand is a material shift for Bitcoin’s near-term trajectory. The March CPI-driven rally benefited from a surge in institutional absorption of freshly mined supply, a trend that tempered sell-side pressure and helped sustain price gains. With Strategy pausing its BTC purchases and the STRC stock trading below par, the market faces a potential reset in the capital allocation that had supported higher price floors in previous cycles. The likelihood of liquidity-driven moves around CPI print days adds another layer of complexity, as large players may reprice risk and reduce exposure in advance of the data release.
Analyst commentary this week underscored a risk-off stance around inflation-print days. In a Sunday note, an analyst highlighted that larger players could begin de-risking around CPI events, a pattern observed in prior cycles. The emphasis remains on monitoring key liquidity pivots—such as the 78,600 to 84,000 area—where a breach or a sweep of liquidity could signal the next directional impulse. For context, traders have pointed to the significance of a weekly open around 78.6k as a critical reference level to hold or lose, with downside targets clustering near the mid-70s to mid-70s thousand-dollar range if breached.
“Key level to hold is the 78.6K weekly open; if lost, 74–75K is the next downside target. I would watch for liquidity sweeps around this pivot to signal the next move.”
As with any CPI cycle, the interaction of macro data, on-chain activity, and traditional market liquidity will determine whether Bitcoin can sustain a constructive breakout or revert to a risk-off posture. The flow of fresh capital from major buyers, while potentially volatile in the near term, will be a crucial barometer for the next leg of the trend.
Meanwhile, the upside scenario remains intact in the sense that a decisive move beyond the apex could clear the path to higher targets if demand returns. The market’s attention remains fixed on how inflation data evolves, how the Fed responds, and whether on-chain buyers re-emerge with renewed vigor to re-anchor price to higher levels.
Looking ahead, traders should monitor the CPI release window, the trajectory of core inflation, and the evolving buy-sell dynamics around major levels. The coming days will reveal whether Bitcoin can sustain momentum amid a cautious macro backdrop or whether the price revisits key support toward the region around $70,000.
What happens next may hinge on more than one data point. If inflation continues to surprise on the upside and rate expectations stay elevated, BTC could face renewed selling pressure near critical inflection zones. Conversely, a softer inflation surprise, or a fresh wave of institutional interest, could rekindle the upside move into the mid-to-high tens of thousands. Investors should stay patient and prepared for rapid, data-driven shifts as CPI day approaches.
Crypto prices marked gains over the past week, including a multi-month high for the market leader, and some of the reasons are the return of demand for spot ETFs tracking their performance.
Here are the precise numbers from last week: the big gainers and those who didn’t see any action.
BTC ETFs: The Winner
The first and largest crypto ETFs were the undisputed leaders in terms of attracting funds last week, despite the rough ending. The financial vehicles saw net inflows of $532 million on Monday, $467 million on Tuesday, and $46 million on Wednesday when the asset peaked at almost $83,000.
Its price momentum began to fade at the end of the business week, coinciding with substantial net outflows of $277 million on Thursday and $146 million on Friday. Nevertheless, the total weekly inflow stood at an impressive $622.75 million, up from the previous week’s $154 million.
The cumulative total net inflows have risen to well over $59 billion as of Friday’s market close.

ETH ETFs Follow Suit
The spot Ethereum ETFs, on the other hand, had only one day in the red, but it was painful. After pulling $61 million on Monday, $97.6 million on Tuesday, $11.6 million on Wednesday, and a more modest $3.6 million on Friday, the funds saw a significant withdrawal of over $103.5 million on Thursday, according to SoSoValue data.
Nevertheless, the week ended well in the green, with net inflows of over $70 million. However, it still couldn’t offset the losses seen from the previous week, which ended on May 1, when investors pulled out over $82 million from the funds.
The cumulative net inflows into the spot ETH ETFs remain above $12 billion since their inception in mid-2024.

XRP ETFs and Some Honorable Mentions
The funds tracking Ripple’s cross-border token didn’t have a single day in the red last week, but Thursday was a no-action day with $0.00 reportable flows. Investors inserted nearly $4 million on Monday, over $11 million on Tuesday, $13 million on Wednesday, and $6 million on Friday.
The week ended with more than $34 million in net inflows, which is significantly more impressive than the minor $35K in net outflows during the previous week. The total net flows are up to another all-time high of $1.32 billion.

The honorable mentions are the SOL ETFs, which saw almost $40 million in net inflows last week, while the LINK and DOGE ETFs gained somewhere around $1 million each.
The post BTC vs. ETH vs. XRP ETFs: Which Pulled the Most Money Last Week? appeared first on CryptoPotato.


Strategy CEO Phong Le said the company’s success rests on more than the Bitcoin held on its balance sheet.
Summary
- Strategy said Q1 revenue rose 11.9% year over year to $124.3 million.
- Phong Le said cloud revenue grew 59% during the company’s strongest software quarter in years.
- Strategy’s Bitcoin model faces scrutiny as debt and losses mount.
In a post on X, he argued that Strategy’s enterprise software business remains a core part of the company’s long-term model.
Le said the software unit gives Strategy engineers, cloud teams, enterprise customers, compliance systems, and global operations that most digital asset firms do not have. “Strategy’s success is rooted in more than Bitcoin” is the key claim, but it depends on whether the software business can keep growing while Bitcoin drives most investor attention.
Q1 software growth supports Bitcoin costs
Strategy reported $124.3 million in total Q1 2026 revenue, up 11.9% from $111.1 million a year earlier. The company also posted gross profit of $83.4 million, with a 67.1% gross margin.
Le said Q1 was the strongest software quarter in a decade, helped by 12% revenue growth and 59% cloud revenue growth. He added that controllable margin rose 27%, helping fund Bitcoin operating expenses.
The update comes as Strategy’s Bitcoin strategy remains under scrutiny. The company reported a $12.54 billion Q1 net loss, compared with a $4.22 billion loss in the same period last year.
As Crypto.news reported, Strategy had raised $25.3 billion in 2025 to expand its Bitcoin treasury strategy. That report also noted Phong Le’s focus on expanding STRC to support growth in Bitcoin per share.
Strategy turns to AI and enterprise data
Le said Strategy has built an AI data foundation called Mosaic. The platform links large language models, hyperscalers, and data warehouses into a secure enterprise data layer.
He also said the company is rebuilding internal systems with AI and expects more workflows to become automated.
For Strategy, the message is clear: the software arm is no longer just a legacy business. It is part of the company’s case for why its Bitcoin treasury model can operate at institutional scale.

CAF Keeps Jean Ndala As Referee For Champions League Final

‘Marshals’ Release Schedule: When Episode 11 Hits Paramount Plus
Roman’s ‘very pretty’ boho-style crochet summer top ‘goes with anything’
Manchester United reach agreement with Casemiro over contract clause amid transfer speculation

US brings back mandatory military draft registration

Steven Gerrard disagrees with Gary Neville over ‘shock’ Chelsea and Arsenal claim | Football


-
 Crypto World2 days ago
HarrisX Poll Found 52% of Registered Voters Support the CLARITY Act
-

 NewsBeat7 days ago
Channel 5 – All Creatures Great and Small series 7 new post
-

 Crypto World3 days ago
Upbit adds B3 Korean won pair as Base token gains Korea access
-

 Fashion2 days ago
Weekend Open Thread: Marianne Dress
-

 Tech6 days ago
Image AI models now drive app growth, beating chatbot upgrades
-
 NewsBeat3 days ago
NCP car park operator enters administration putting 340 UK sites at risk of closure
-

 Politics1 day ago
Politics Home Article | Starmer Enters The Danger Zone
-
 Business1 day ago
Ignore market noise, India’s long-term story intact, say D-Street bulls Ramesh Damani and Sunil Singhania
-

 Crypto World7 days ago
BlackRock Buys $284M In Bitcoin On May 1 As The Best Crypto To Invest In For 2026 Sits Below A Pending Binance Listing
-

 Entertainment7 days ago
Olivia Wilde Reacts To Viral ‘Corpse’ Comparison
-

 Sports6 days ago
Inter Milan Win Serie A Title After Victory Over Parma
-

 Business7 days ago
Can LeBron James Lead LA Past OKC Without Injured Luka Doncic?
-
 Sports6 days ago
Every word of Arne Slot’s heated rant after Manchester United win vs Liverpool
-

 Crypto World5 days ago
UAE Free Zone Deploys Blockchain IDs to Verify Registered Firms
-

 Entertainment7 days ago
Other Bennet Sister Love Triangle Cast: Ella Bruccoleri, Donal Finn
-

 Sports7 days ago
La Liga: Vinicius Jr scores twice as Real Madrid win to keep Barcelona waiting for title
-

 Sports7 days ago
Joel Embiid urges Sixers fans not to sell playoff tickets to Knicks fans
-
Entertainment7 days ago
Jennifer Lawrence’s Mary Jane Sneakers Are Spring’s It-Girl Shoe
-
 Sports6 days ago
2026 NHL playoff picks: Second-round predictions, series odds, Stanley Cup bracket
-
 Sports7 days ago
Kobbie Mainoo plays hero as Manchester United beat Liverpool in five-goal thriller, secure Champions League football | Football News
You must be logged in to post a comment Login