
Crypto World
Hyperliquid price nears $46 channel resistance
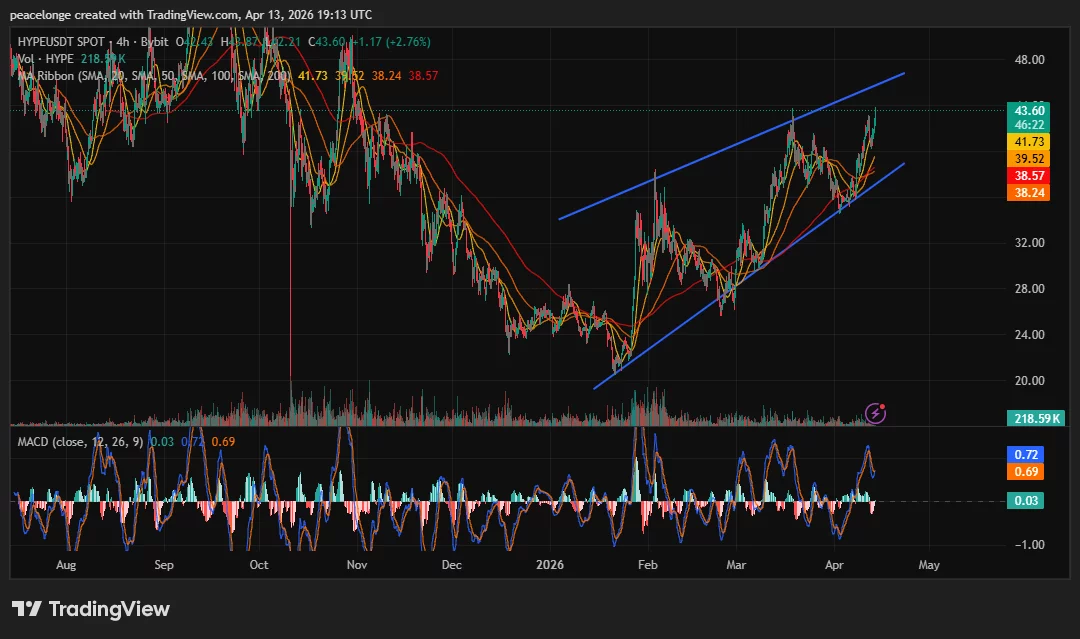
Hyperliquid is trading at $43.60 on April 13, up 2.76% on the 4H session, after printing a high of $46.22 that marks the upper boundary of an ascending channel built from the December 2025 lows near $22. The 4H MACD histogram has compressed to just 0.03, raising the question of whether momentum can sustain a breakout above channel resistance or whether a pullback toward mid-channel support is the more likely outcome.
Summary
- Hyperliquid price is trading at $43.60 on April 13, up 2.76%, after a session high of $46.22 aligning precisely with the upper boundary of a 4H ascending channel from December 2025.
- The MACD (12,26,9) shows the MACD line at 0.72, signal at 0.69, and histogram at just 0.03, indicating momentum is thinning significantly at channel resistance while all four SMAs remain bullishly stacked below price.
- A confirmed 4H close above $46.22 targets the $50 psychological level; a rejection at the upper channel risks a pullback to the SMA 20 at $41.73, with the $38 to $39 SMA cluster as the structural floor.
Hyperliquid (HYPE) price is trading at $43.60 on April 13, up 2.76% on the 4H chart, as a clear ascending channel from the December 2025 lows near $22 carries price into contact with the upper boundary at the $46.22 session high. The MA ribbon is bullishly arranged: SMA 20 at $41.73, SMA 50 at $39.52, SMA 100 at $38.57, and SMA 200 at $38.24 are all stacked below current price. The 4H MACD histogram reading of 0.03 suggests the channel advance is losing upside velocity precisely as it meets its most significant resistance since the channel formed.
The 4H chart shows Hyperliquid tracing a defined ascending channel across roughly four months, with two parallel upward-sloping trendlines connecting the December 2025 base near $22 to the current upper boundary near $46.22. Each retest of the lower channel trendline produced a recovery, and price has printed successive higher lows that have remained above the full SMA ribbon throughout the advance.

The MACD (12,26,9) signals caution at the current level: the MACD line at 0.72 is barely above the signal at 0.69, producing a histogram of just 0.03. This is a sharp deceleration from the momentum readings that drove the channel advance through March and early April. A histogram this close to zero at a known resistance level can precede either a brief consolidation before a breakout, or a rejection back toward mid-channel support. The bullish flag breakout confirmed on April 8 at $39.50 with a target of $44 has now been achieved, placing price at the next structural test.
Arthur Hayes stated publicly that he projects Hyperliquid could reach $150 by August 2026, citing the platform’s real revenue generation and its ability to take market share from centralized exchanges. Hyperliquid currently holds approximately 40% of total decentralized perpetual trading volume globally.
Key Levels: Support, Resistance, and Price Targets
The immediate resistance is $46.22, the 4H session high and upper channel trendline. A confirmed 4H close above it confirms a channel breakout and opens $50 as the first major target. An extended move above $50 brings the September 2025 all-time high at $59.30 into the medium-term picture.
On the downside, the SMA 20 at $41.73 is the first dynamic support. A 4H close below it brings the SMA 50 at $39.52 into focus alongside the SMA 100 at $38.57 and SMA 200 at $38.24, which together form a dense support cluster between $38 and $39. This zone also aligns with the lower boundary of the ascending channel, making it the critical structural defense for the bull case.
Invalidation: a daily close below $38.24 confirms a channel breakdown and shifts the near-term bias bearish.
On-Chain and Market Data Context
Hyperliquid open interest stands at approximately $1.53 billion per Coinglass data, reflecting sustained derivatives participation. Futures volume over the past 24 hours reached approximately $715 million, consistent with the elevated activity the platform has maintained since HIP-3 expanded its offering to include gold, silver, and crude oil perpetuals. Tokenized assets now represent 33% of total weekly trading volume on Hyperliquid, a record share per Blockworks data, with the protocol’s Assistance Fund directing up to 97% of trading fees into HYPE buybacks.
High Stakes Capital fully exited a 602,421 HYPE position worth $22.9 million near $38, a level now sitting at the SMA cluster and lower channel boundary. The proximity of that whale exit to the current support zone adds structural significance to the $38 to $39 zone as a key floor beneath the ascending channel.
If Hyperliquid secures a 4H close above $46.22, $50 is the immediate target. A rejection at the upper channel with continued MACD compression points to a pullback toward the SMA 20 at $41.73, with the $38 to $39 cluster as the level that must hold for the ascending channel structure to remain intact.


Prediction markets are transitioning from retail speculation platforms to institutional-grade financial instruments, driven by demand for precise macro hedging and clearly defined binary outcomes. A May 4 Bernstein report highlights how bespoke contracts and block trades are helping bridge the gap between retail-driven volatility and the risk management needs of institutions.
The report notes a notable milestone: the first bespoke institutional block trade executed on Kalshi last week. The privately negotiated transaction was arranged by Greenlight Commodities, with Jump Trading as the liquidity provider, and centered on the clearing price of California’s May carbon allowance auction. The example demonstrates how prediction markets can be tailored to meet specific client needs and risk appetites, beyond standard yes-or-no event contracts.
Bernstein analysts emphasize that the move toward block trading and bespoke contracts could broaden participation among investors seeking targeted exposure to event risks—ranging from tariffs and elections to geopolitical developments—while preserving the binary resolution structure that characterizes these markets.
Separately, Bernstein notes that institutional access to prediction markets is aided by infrastructure partnerships, such as Clear Street’s collaboration with Kalshi, which gives qualified investors a regulated pathway to trade these contracts alongside traditional asset classes like stocks and futures.
Key takeaways
- Bespoke contracts and large, privately negotiated block trades are unlocking institutional participation in prediction markets.
- Regulated access channels are maturing, with Kalshi operating under the Commodity Futures Trading Commission and Polymarket moving toward US-enabled, regulated trading through conditional approvals.
- Retail activity still dominates volume, but institutional demand could accelerate market growth and product innovation.
- Real-world hedging applications are emerging, including contracts tied to specific regulatory events such as carbon allowance auctions.
Block trades and bespoke contracts open institutional doors
The California carbon allowance example demonstrates how tailor-made contracts can provide targeted risk hedging for institutions managing exposure to policy-driven events. The Kalshi block trade brokered by Greenlight Commodities linked to the May auction price illustrates how buyers can structure settlements around precise, verifiable outcomes rather than generic event bets. Bernstein’s analysis envisions a broader adoption curve where bespoke structures serve as a bridge between traditional risk management tools and emerging digital markets. As one analyst note from Bernstein states, “We believe the introduction of block trading and bespoke contracts could expand participation from institutional investors seeking targeted exposure to event risks.”
In parallel, the market is seeing infrastructure-backed paths to access. Bernstein highlights the partnership between Kalshi and Clear Street as a key development that could enable institutions to trade these contracts in a regulated, broker-dealer framework, integrating them into the broader suite of tradable assets available to professional desks.
Retail leads prediction markets as institutional interest grows
Despite growing institutional interest, retail activity continues to drive the sector’s scale. A Bitget Wallet and Polymarket report found that retail users accounted for more than 80% of the $25.7 billion in prediction-market volumes recorded in March, underscoring the sector’s retail-first dynamic despite signs of deeper liquidity support from professional traders.
Market watchers see the developing institutional framework as a potential accelerant for growth. Bernstein’s broader market outlook cites a potential expansion toward a trillion-dollar sector by the end of the decade, a view that CNBC coverage has echoed in recent reporting on the forecast for prediction markets.
Regulatory momentum in the United States continues to shape the trajectory, even as the landscape remains uneven. Kalshi operates as a federally regulated exchange under the Commodity Futures Trading Commission, while Polymarket has secured conditional approval to offer event contracts in the US through regulated channels.
Despite the progress, the path forward will hinge on how regulators balance innovation with consumer protection and market integrity. The evolving ecosystem also faces questions about liquidity depth, price discovery, and risk controls as more institutions participate.
What comes next for the ecosystem
As institutions begin to test bespoke exposure and block-trade workflows, market participants will be watching for additional evidence of durable liquidity, robust hedging performance, and clearer regulatory guidelines across jurisdictions. The emergence of tailored contracts tied to concrete policy outcomes—such as carbon markets or electoral events—could concretize the usefulness of prediction markets for risk management. However, investors should remain mindful of evolving regulatory scrutiny and potential limitations on cross-border access, which could influence adoption pace and product design.
For readers tracking the sector, the next milestones to watch include more institutional block trades, broader access through regulated venues, and any shifts in US policy or international regulation that could impact how these markets price and settle event outcomes.
In the near term, the trajectory suggests a cautious but deliberate shift: retail volume remains the engine of growth, while institutional demand quietly shapes the next generation of prediction-market products and the platforms that host them.


The Polygon wallet now offers a “Privately Send” option that hides sender, receiver, and amount onchain, with KYT screening built into every transfer.

Prediction markets traders aren’t confident in GameStop’s ability to take over eBay, according to contracts launched on Monday.
Traders on Kalshi give GameStop just a 26% chance to pull off the acquisition in 2026, though total trading volume on the new contract was low at just over $2,000.
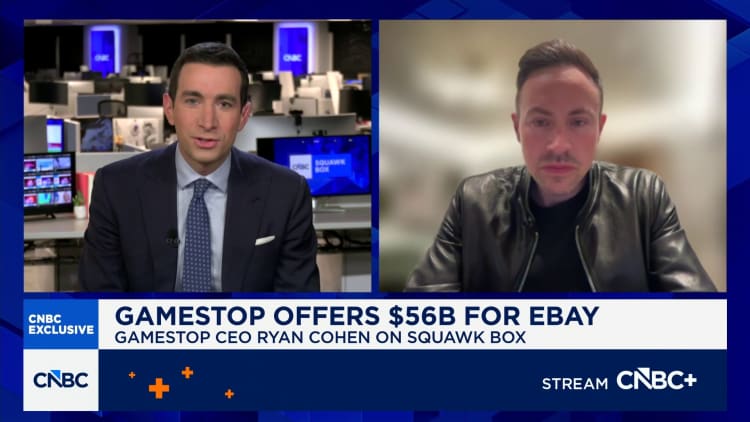
GameStop announced on Sunday that it was making a play to acquire the online marketplace in a cash-and-stock deal that valued the company at $55.5 billion. That valuation raised questions about how GameStop could finance its proposal. The video game retailer has a market cap of just under $11.9 billion.
In an appearance on CNBC’s “Squawk Box,” GameStop CEO Ryan Cohen didn’t disclose exactly how he planned on financing the deal, instead reiterating the makeup of the transaction.
“We are offering half cash, half stock, and we have the ability to issue stock in order to get the deal done. But the full details of the offer are on our website,” Cohen said. “We will see what happens.”
Shares of GameStop fell nearly 8% on Monday in reaction to the proposal, while eBay jumped more than 5.5%.
On Polymarket, traders were even less optimistic. Traders on that platform gave GameStop just a 15% chance at completing the takeover.
— CNBC’s Yun Li contributed reporting
Disclosure: CNBC and Kalshi have a commercial relationship that includes a CNBC minority investment.
Markets shift and headlines fade, but the core principles of building long-term wealth remain constant. Join us for our third CNBC Pro LIVE, where investors of all backgrounds – from financial professionals to everyday individuals – come together to cut through the noise and gain actionable strategies for smarter, more disciplined investing. No matter where you’re starting from, you’ll leave with clearer thinking, stronger strategies. Enter your email here to get a discount code
Bitcoin extended its latest ascent into the new week, clearing the $80,500 zone and nudging toward the $84,000 level as bulls attempt to take charge. The move comes with a constellation of supporting indicators—from on-chain liquidity signals to rising institutional participation—suggesting the upside may have more room to run, at least in the near term. Yet traders are also weighing potential resistance at key levels and the broader macro backdrop, including equities and the dollar, which could curb momentum if risk-off conditions return.
On-chain dynamics are featuring prominently in the bullish narrative. An indicator tracked by analysts points to a potentially explosive setup if Bitcoin clears the $84,000 mark: a surge above that level could unleash around $2.85 billion in short liquidations across exchanges, underscoring how fragile a breakout can be without broad participation. Meanwhile, capacity for institutional demand remains a recurring theme as funds continue to accumulate exposure to BTC, with observers citing a sustained appetite among large buyers that could propel prices higher in the weeks ahead.
Key takeaways
- BTC has cleared the $80,500 hurdle and eyes a test of $84,000; a break above could trigger meaningful short liquidations around $2.85 billion across exchanges.
- Institutional demand remains a persuasive force, with reports noting periods where buyers absorb 500%+ of Bitcoin’s daily mined supply, a pattern historically associated with further upside in the ensuing weeks.
- The broader market backdrop shows the S&P 500 at fresh highs while the U.S. dollar trades within a tight range, setting up a delicate balance between macro risk and crypto momentum.
- Among the top altcoins, Ether, XRP, and Dogecoin are showing relative strength, while several other major alts have yet to gain sustained traction—highlighting a bifurcated momentum landscape.
Bitcoin momentum and on-chain signals
BTC’s breakout above the $79,500 resistance has investors weighing the next leg higher. If the current momentum holds, the next clear target appears near $84,000, a level that, if decisively breached, could reframe the near-term trajectory for the pair. Traders will be watching whether the price can remain above the 20‑day exponential moving average, currently acting as a short-term fulcrum around the mid-$70,000s; a sustained hold above this EMA would bolster the case for an extended rally.
Analysts have been revisiting the implications of an extended move higher. One widely cited perspective notes that a breakout through $84,000 could prompt substantial short liquidations, a signal that risk appetites across the market could intensify further. In parallel, commentary from market observers has highlighted how on-chain behavior—particularly the pace at which new supply is absorbed by market participants—can serve as a leading indicator for price action in the weeks ahead.
In a contrasting view, some traders emphasize that upside catalysts must be confirmed by a broadening base of buyers, not just a handful of momentum players. As BTC remains tightly correlated with macro catalysts, any escalation in risk-off sentiment could cap gains or trigger a swift pullback, especially if liquidity pockets thin out at key levels.
For context, analysts and industry observers have pointed to notable institutional activity as a contributing factor behind recent price momentum. Charles Edwards, founder of Capriole Investments, noted on X that institutions have been “slurping up 500%+ of Bitcoin’s daily mined supply.” Historical patterns following similar bursts of demand have coincided with multimonth strength, though observers caution that past performance is not a guarantee of future results. If the trend continues, some expect BTC to flirt with higher targets in the near term—potentially into the mid-$90,000s if momentum sustains.
Markets in macro context
Beyond crypto-specific signals, the traditional markets present a mixed but constructive backdrop. The S&P 500 climbed to a fresh high, with the index trading in an uptrend as buyers maintain an edge above the 20-day exponential moving average. The key support around 7,000 remains a strategic line in the sand; a sturdy bounce at that level would bolster the case for a continued rally toward higher targets, while a close below could open the door to a deeper pullback and a test of the 50-day moving average.
The U.S. Dollar Index, meanwhile, has been oscillating between the 50-day moving average near 98.97 and support around 97.74. The near-term bias remains nuanced: a move above the 50-day line could signal renewed dollar strength, potentially weighing on crypto gains, whereas a break below the 97.74 support might invite a renewed risk-on rotation that could help crypto assets extend their gains toward higher resistance levels.
Taken together, the macro backdrop underscores a delicate balance. If risk assets continue to outperform, crypto markets could ride the wave of optimism into the next leg higher. Conversely, a shift toward safer assets or rising volatility could pressure prices, particularly for fragile altcoin momentum where liquidity and sentiment can diverge quickly from BTC.
Altcoin landscape: a mixed bag of signals
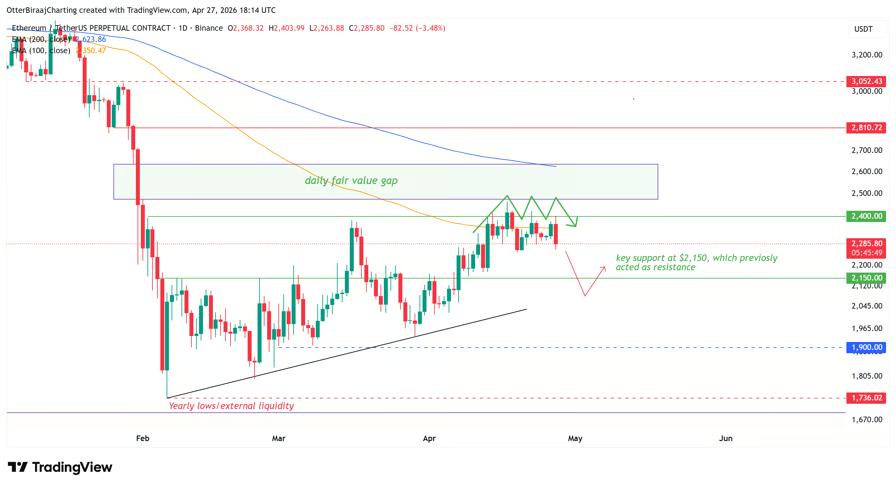
Ether extended its recent strength, clearing the 20-day EMA near $2,298 and marching toward the $2,465 overhead resistance. Traders will be watching whether demand can push ETH through that threshold; a sustained breakout could open the door toward a higher target in the vicinity of $3,050, should the momentum persist. A stall at the $2,465 level would be a warning sign that resistance is mounting and that a consolidation phase could ensue, keeping ETH within a defined range for a period.
XRP has also moved higher, lifted by a broader rally in selective large-cap altcoins. A close above the key $1.61 level would put the XRP/USDT pair on track to revisit the $2.00 area and push toward $2.40 as buyers attempt to shoulder the next leg higher. If the price fails to clear that hurdle, XRP could remain trapped in a range roughly between $1.27 and $1.61, delaying a decisive breakout.
BNB seems to be treading water near its moving averages, suggesting indecision between bulls and bears. The immediate range sits around $570 to $687; a sustained close above $687 could unleash a rally toward $790, while a break below $570 would open the path back to $500 as bears attempt to reassert control.
Solana has shown tentative strength as it tests the moving averages. A decisive close above the $82.65 area could propel SOL toward the $90.73 resistance, with a breakout potentially taking the price toward $98. Below $82.65, buyers would need to defend the level to prevent a retrace toward $76, keeping the short-term trajectory uncertain until a clear breakout direction emerges.
Dogecoin has cleared the $0.11 barrier, opening the door to a move toward $0.12 and beyond if bullish momentum persists. A sustained push through $0.12 could target the $0.14–$0.16 region, though a reversal lower from current levels would likely anchor DOGE within a tight range near $0.09–$0.12 for longer.
Hyperliquid has maintained above its 20-day EMA around $41, but a long upper wick hints selling pressure at higher levels. The price could face resistance in the $43.76–$45.77 zone; a break above this area might push the pace of the rally toward $50 and beyond to around $51.43, while a break below the 50-day moving average could tilt the chart back to the bears’ favor toward the mid-$30s.
Cardano has inched above the downtrend line but faces an uphill battle at the 50-day moving average near $0.25. A sustained push above that level could see ADA rise toward $0.29 and then $0.31, with $0.22 acting as a critical support. A break below could reintroduce a corrective phase for the token within its current range.
Overall, the altcoin picture remains nuanced. A handful of the big-cap tokens are showing resilience and fresh demand, while others lag, underscoring a market where breadth and participation remain uneven. Traders should monitor how cross-asset risk appetite evolves, as crypto markets often amplify shifts in macro sentiment more quickly than traditional equities.
What to watch next
Looking ahead, the immediate questions center on whether BTC can sustain its breakout above $84,000 and how the surrounding macro environment will react to continued risk-on or risk-off shifts. A clean close above $84,000 would strengthen the case for higher targets, but traders should remain mindful of potential liquidity-driven volatility and the possibility of a quick pullback if selling pressure intensifies at resistance levels.
On the altcoin side, the next few sessions will reveal whether ETH and XRP can extend their breakouts, whether BNB can decisively clear the $687 hurdle, and how the broader momentum across Solana, Dogecoin, and the niche players like Hyperliquid and Cardano evolves. Investors should watch for confirmation signals—volume expansion, sustained closes above critical thresholds, and evolving correlations with BTC and traditional markets—to gauge whether the current momentum has legs or simply marks a pause before the next chapter.
As always, the evolving interplay between macro drivers, on-chain signals, and trader sentiment will determine whether the week’s rallies solidify into a lasting trend or fade into a consolidation phase. Keep a close eye on how BTC behaves around the $84,000 level and how the SPX and DXY respond to ongoing macro data releases in the days ahead.

The tension between the two geopolitical entities in the Middle East drove Bitcoin downwards as missile attacks were launched on the United Arab Emirates. The progress eroded trust in a shaky ceasefire between the United States and Iran. As a result, Bitcoin slipped below the $80,000 mark after briefly trading above that level earlier.
Bitcoin Retracts Once More Following New Middle East Tensions
Bitcoin dropped when it was announced that there were missile attacks being launched by Iran and directed towards the United Arab Emirates. The UAE military officials identified four missiles, and most of them were successfully intercepted. Nevertheless, the landing of one of the missiles in the surrounding waters has brought up new security issues.
In turn, the market mood changed swiftly as traders responded to the risk of the escalation. Bitcoin dropped out of its highs of over 80,000 and settled around 79,800 in intraday trade. Although the asset decreased, it still experienced relatively low increases in its value each day because of the previous bullish trend.
Bitcoin had been boosted by optimism at an earlier stage as the markets hoped that the United States and Iran would stabilise their relations. Nevertheless, the recent strikes upset such a story and brought a new wave of uncertainty. Consequently, Bitcoin experienced instant selling pressure on large exchanges.
Oil Prices Soar, and Crypto is Under Pressure
The geopolitical events were met with a strong reaction in oil markets, which were concerned about issues of supply disruptions. Brent crude futures shot up more than four per cent and momentarily climbed above the $114 mark. Meanwhile, the West Texas Intermediate futures also surged by over $105 over the period.
Increased oil prices tend to affect the overall financial situation and risk appetite in the markets. In the present scenario, the increase in energy prices put a strain on Bitcoin and other digital currencies. The crypto market, in turn, responded adversely, as the macroeconomic issues grew.
Simultaneously, the tensions around the Strait of Hormuz added to the fears of the interrupted global oil supplies. It was reported that there was increased military activity in the region, though some reports could not be confirmed. However, uncertainty was the only factor that was enough to affect both commodities and cryptocurrencies.
Ceasefire Risks Introduce Uncertainty To the Market Direction
The current missile action poses a threat to a ceasefire agreement that already is fragile between the United States and Iran. The two parties have been recording instances of defusing tensions since the recent developments have been witnessed. Nevertheless, the scenario now seems to be shaky and might change rapidly.
Also, political cues have been inconsistent, and that has contributed to confusion in the market. Some of the proposals that were made to end the conflict had been rejected previously by the United States. Meanwhile, Iran has shown willingness to retaliate in case the tensions continue to escalate.
This dynamic reality has put global financial markets in a complex environment, including cryptocurrencies. Bitcoin was recently on its knees in anticipation of less geopolitical risk and favourable policy changes. The recent surge has, however, undone some of those gains and brought in new volatility.
In general, the recent price trend of Bitcoin indicates its vulnerability to the geopolitical changes and macroeconomic changes in the world. Although the asset is still robust, unexpected incidents still affect the immediate trend. The market can be subjected to additional movements as the tensions continue due to the external forces.
Key points:
- Bitcoin’s rally through $79,500 opens the door to a move toward $84,000.
- Ether, Dogecoin and Hyperliquid are showing strength, but the other major altcoins are yet to pick up momentum.
Bitcoin (BTC) opened the new week with a rally above $80,500, suggesting the bulls are attempting to take charge. Analysts are closely watching the $80,000 level, as some believe a failure to close above it could trigger a move toward $60,000.
However, crypto analyst Matthew Hyland said in a post on X that traders calling BTC’s fall to $60,000 and lower ‘will be the ones flipping bullish late above $90K.”
BTC’s 30-day liquidation map shows that a rally above $84,000 would trigger $2.85 billion worth of short liquidations across all exchanges.

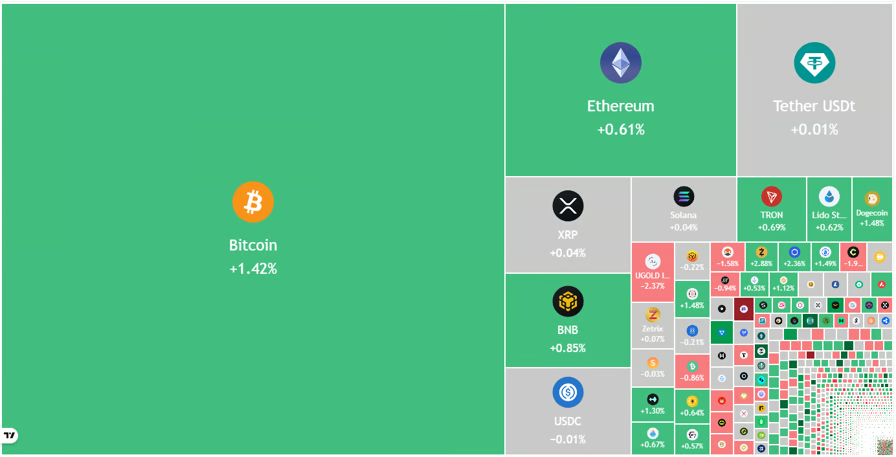
Crypto market data daily view. Source: TradingView
A positive sign for the bulls is that BTC’s rise continues to be supported by institutional investors. Capriole Investments founder Charles Edwards said in a post on X that institutions have been “slurping up 500%+ of Bitcoin’s daily mined supply.” Such instances in the past have boosted prices by more than 24% in the following month. If history repeats, BTC may surge to around $96,000.
Could BTC and the major altcoins sustain the breakout? Let’s analyze the charts of the top 10 cryptocurrencies to find out.
S&P 500 Index price prediction
The S&P 500 Index (SPX) remains in a strong uptrend, rising to a new all-time high of 7,272 on Friday.

SPX daily chart. Source: Cointelegraph/TradingView
The upsloping 20-day exponential moving average (7,043) indicates an advantage to buyers, but the relative strength index (RSI) near the overbought zone signals that a minor consolidation or correction is possible in the near term.
The 7,000 level is the crucial support to watch out for on the downside. A solid bounce off the 7,000 level suggests that the bulls have flipped it into support. That improves the prospects of a rally to 7,500.
On the contrary, a close below the 7,000 support may sink the index to the 50-day simple moving average (6,827).
US Dollar Index price prediction
The US Dollar Index (DXY) has been stuck between the 50-day SMA (98.97) and the 97.74 support.

DXY daily chart. Source: Cointelegraph/TradingView
The downsloping 20-day EMA (98.61) and the RSI in the negative territory indicate that the bears are at a slight advantage. If the price breaks below the 97.74 support, the index may tumble toward the 96.21 level.
Conversely, a close above the 50-day SMA suggests that the bulls are on a comeback. The index may rally to the 100.54 resistance level, where buyers are expected to encounter solid selling pressure from bears.
Bitcoin price prediction
BTC has broken above the $79,500 resistance, signaling the resumption of the uptrend toward $84,000.

BTC/USDT daily chart. Source: Cointelegraph/TradingView
The uptrend is expected to face solid selling pressure at $84,000, but if the bulls prevent the BTC price from dipping below the 20-day EMA ($76,634), the possibility of a breakout increases. If the $84,000 level is broken, the BTC/USDT pair may surge toward the pattern target of $92,000.
Time is running out for the bears. They will have to swiftly yank the price below $76,000 to weaken bullish momentum. The pair may then tumble to the 50-day SMA ($72,798).
Ether price prediction
Ether (ETH) rose above the 20-day EMA ($2,298) on Friday and is marching toward the $2,465 overhead resistance.

ETH/USDT daily chart. Source: Cointelegraph/TradingView
Sellers will attempt to stall the rally at the $2,465 level, but if the bulls prevail, the ETH/USDT pair may jump to the resistance line. If the ETH price turns down sharply from the resistance line and breaks below the 20-day EMA, it suggests the pair may remain within the channel for some time.
On the other hand, a break and close above the resistance line signals that the bulls are back in control. The pair may then surge toward the $3,050 level.
XRP price prediction
Buyers have pushed XRP (XRP) above the moving averages, opening the door to a rally toward the downtrend line.

XRP/USDT daily chart. Source: Cointelegraph/TradingView
The flattish moving averages and the RSI just above the midpoint do not give either bulls or bears a clear advantage. Buyers will gain the upper hand on a close above the $1.61 level. The XRP/USDT pair may then rally to $2, then to $2.40.
Contrary to this assumption, if the XRP price turns down from the $1.61 level, it would suggest that bears are active at higher levels. That may extend the pair’s stay inside the $1.27 to $1.61 range for a while.
BNB price prediction
BNB (BNB) has been trading near its moving averages over the past few days, indicating indecision between bulls and bears.

BNB/USDT daily chart. Source: Cointelegraph/TradingView
The flattish moving averages and the RSI just above the midpoint suggest that the BNB/USDT pair may remain inside the $570 to $687 range for a few more days.
The next trending move is expected to begin on a close above $687 or below $570. If bulls push the BNB price above the $687 resistance, the pair is expected to gain momentum and surge to $790. Alternatively, a close below $570 signals the resumption of the downtrend toward $500.
Solana price prediction
Solana (SOL) is attempting to rise above the moving averages, indicating demand at lower levels.

SOL/USDT daily chart. Source: Cointelegraph/TradingView
A close above the moving averages may push the SOL price to the $90.73 resistance. Sellers will attempt to defend the $90.73 level, but if the bulls prevail, the SOL/USDT pair may surge to $98.
On the downside, the bears will need to push the price below $82.65 to gain the upper hand. If they do that, the pair may descend to the solid support at $76. The next trending move is expected to begin on a close above $98 or below $76.
Related: BTC price can ‘easily’ hit $95K: Five things to know in Bitcoin this week
Dogecoin price prediction
Dogecoin (DOGE) has broken above the $0.11 resistance level, clearing the path for a rally toward $0.12.

DOGE/USDT daily chart. Source: Cointelegraph/TradingView
The 20-day EMA ($0.10) has started to turn up, and the RSI is in the overbought zone, indicating that the buyers have the edge. Sellers are expected to mount a strong defense at the $0.12 level, but if buyers bulldoze through, the rally may reach $0.14 and eventually $0.16.
Instead, if the DOGE price turns down sharply from $0.12 and breaks below the moving averages, it suggests that the bears remain sellers on rallies. That may keep the DOGE/USDT pair within the $0.09-$0.12 range for a few more days.
Hyperliquid price prediction
Hyperliquid (HYPE) is maintaining above the 20-day EMA ($41.04), but the long wick on the candlestick shows selling at higher levels.

HYPE/USDT daily chart. Source: Cointelegraph/TradingView
The uptrend is expected to face selling pressure in the $43.76 to $45.77 resistance zone. If the HYPE price turns down from the current level or the overhead zone and breaks below the 50-day SMA ($40.11), the advantage will tilt toward the bears. The HYPE/USDT pair may then tumble to $38.70.
Contrarily, a break and close above the overhead zone signals the resumption of the uptrend. The pair may surge to $50 and then to $51.43.
Cardano price prediction
Cardano (ADA) has risen above the downtrend line, but the bulls are facing stiff resistance at the 50-day SMA ($0.25).

ADA/USDT daily chart. Source: Cointelegraph/TradingView
The RSI has risen just above the midpoint, signaling a slight advantage to the bulls. If buyers push the price above the 50-day SMA, the ADA/USDT pair may rally to $0.29, then to $0.31. Sellers are again expected to pose a strong challenge at the $0.31 level, as a close above it suggests that the pair may have bottomed out in the short term.
The $0.22 level is the critical support to watch out for on the downside. If the ADA price turns down and breaks below the $0.22 support level, it signals a resumption of the downtrend.

XRP price is now trading at the $1.40 level, and the prediction around it turns bullish. A headline board appointment has injected fresh institutional credibility into the Ripple ecosystem.
Evernorth Holdings, the Ripple-backed XRP treasury company, filed its second SEC S-4 amendment this week, naming OpenAI Foundation CFO Robert Kaiden and Antalpha COO Derar Islim as independent directors ahead of its planned Nasdaq listing under ticker XRPN.
— ALLINCRYPTO (@RealAllinCrypto) May 4, 2026
 EVERNORTH HIRES OPENAI CFO AHEAD OF NASDAQ LISTING$XRP treasury firm @evernorthxrp are preparing for their Nasdaq listing $XRPN and ahead of this they've appointed OpenAI CFO Robert Kaiden to its board!
Evernorth has raised over $1B and currently holds 473 million $XRP pic.twitter.com/A8GFC0nn2p
The filing also confirms Ripple CLO Stuart Alderoty on the board, alongside a 126.79 million XRP anchor commitment from Ripple Labs itself. Evernorth holds over 473 million XRP valued at approximately $656 million, and is targeting a Q2 2026 Nasdaq debut via SPAC merger with Armada Acquisition Corp II.
The board build-out signals governance is being hardened for public markets. But is it the time to buy?
Discover: The best crypto to diversify your portfolio with
XRP Price Prediction: $3 Too Much to Ask?
At the $1.40 level, XRP is consolidating in the lower half of its post-2024 impulse range. Recent Ripple-related developments have repeatedly tested XRP’s ability to hold ground above the $1.20–$1.30 support band, and that floor remains the critical level to monitor.

Elliott Wave identifies the current structure as a potential ABC correction bottom, with a confirmed breakout targeting the $2.50–$3.30 range depending on market sentiment.
Bitcoin’s behavior is the swing variable here. Macro analyst DonAlt, who called XRP’s prior 700% rally, ties XRP’s next leg to Bitcoin holding above $73,500 support, with resistance capped near $80,000. A clean Bitcoin reclaim of that upper band would likely provide the liquidity and risk-on sentiment XRP needs to attempt a genuine breakout.
Longer-term, analysts project XRP reaching $10 by year-end, a target that would require a market cap surpassing $607 billion, ahead of Ethereum’s current valuation. That scenario demands institutional inflows at a scale XRP hasn’t yet demonstrated.
Goldman Sachs’ $153.8 million XRP ETF position and the NYSE Arca commodity trust filing move the needle, but $10 remains the optimistic outlier, not the consensus. Ripple’s own IPO valuation near $40 billion adds a separate but reinforcing narrative thread that keeps institutional attention on the XRP ecosystem through mid-2026.
Discover: The best pre-launch token sales
Maxi Doge Eyes Early-Stage Upside as XRP Consolidates Below Breakout
XRP’s setup is constructive, but the asymmetry that early XRP holders captured simply doesn’t exist at this entry point. Traders chasing a 2x from here are playing a different game than those who loaded sub-$0.50.
That gap in risk-reward is exactly where early-stage presales attract attention from market participants seeking aggressive upside without waiting for an established asset to rediscover momentum.
Maxi Doge ($MAXI) is one presale capturing that rotation. Built on Ethereum, the project leans into a deliberately unsubtle identity. It is a 240-lb canine juggernaut representing a 1000x leverage trading culture.
Less absurd than it sounds when the numbers are considered. The presale has raised $4.7 million at a current price of $0.0002816, with 60% APY staking bonus available to early holders only.
Features include holder-only trading competitions with leaderboard rewards and a Maxi Fund treasury allocated toward liquidity and partnerships.
Check out the Maxi Doge Presale Here and Join The Best Dog This Year
The post XRP Price Prediction: OpenAI CFO Joins XRP Firm Ahead of Nasdaq Listing appeared first on Cryptonews.

TLDR
- Ripple announced that it will share exclusive threat intelligence with Crypto ISAC members.
- The shared data includes fraud-linked crypto wallets and malicious domains tied to North Korean campaigns.
- Ripple will also provide context-rich profiles containing emails, LinkedIn accounts, and behavior patterns.
- Crypto ISAC launched a new API that enables companies to integrate threat data into their security systems.
- Coinbase has already adopted the updated API to strengthen its security operations.
Ripple has announced a new threat intelligence sharing initiative focused on North Korean-linked cyber campaigns. The company will provide exclusive data to Crypto ISAC members through a newly launched API. The move aims to strengthen coordinated defense across the digital asset sector.
Ripple Expands Intelligence Sharing Through Crypto ISAC
Ripple stated that crypto firms often face repeated attempts from the same threat actors. The company said attackers who fail background checks at one firm often target others within days. Therefore, Ripple decided to share intelligence to reduce fragmented defenses.
Ripple will provide exclusive threat intelligence to members of Crypto ISAC. Crypto ISAC operates as a collaborative security network for digital asset companies. The company said this level of intelligence sharing has not occurred before within the sector.
The shared data will include fraud-linked crypto wallet addresses and malicious domains. It will also include active Indicators of Compromise tied to North Korean campaigns. Both entities confirmed that the intelligence will extend beyond raw technical data.
Ripple will also share context-rich profiles linked to suspicious actors. These profiles will contain LinkedIn accounts, emails, phone numbers, and behavioral patterns. The company said it aims to convert fragmented clues into operational intelligence.
“The strongest security posture in crypto is a shared one,” Ripple stated in its announcement. The company argued that firms currently rebuild intelligence from zero without shared databases. As a result, it believes coordinated sharing will reduce repeated infiltration attempts.
New API Enables Real-Time Security Integration
Crypto ISAC has launched a new API to distribute the shared intelligence. The API allows companies to integrate threat data directly into internal security systems. This setup enables faster detection and response coordination across platforms.
Coinbase has already adopted the updated API for operational use. Crypto ISAC confirmed that other industry participants have begun onboarding the system. The organization said the tool supports real-time intelligence deployment.
Erin Plante, Director of Brand Security and Intelligence at Ripple, addressed the rollout. She said the API improves how companies share and operationalize intelligence. Plante confirmed that Ripple worked closely with Crypto ISAC during implementation.
“Crypto ISAC’s newly updated API represents a meaningful step forward in how intelligence is shared,” Plante said. She added that Ripple aligned the integration with its internal workflows. She said the result delivers higher-quality intelligence for direct security operations use.
The initiative targets campaigns attributed to North Korean-linked actors. Recent incidents, including the Drift Protocol exploit, have drawn attention to coordinated attacks. Ripple confirmed that it will continue supplying updated intelligence through the Crypto ISAC network.
Crypto ISAC stated that member companies can access and automate the shared data feeds. The organization said the API structure allows continuous updates without manual intervention. The rollout remains active as participating firms complete system integration.


Bitcoin’s 200-week moving average has climbed above $60,000. Blockstream CEO Adam Back flagged the level as confirmation that BTC remains in a structural bull market.
The threshold ranks among the most-watched long-term technical signals in crypto. The line averages nearly 4 years of weekly closes and has served as a price floor at prior cycle bottoms.
Why the 200-Week Moving Average Carries Weight
Few metrics command as much attention from long-term holders as the 200-day moving average. The line filters short-term volatility to expose the broader uptrend, which has shifted steadily higher across every prior cycle.
Each cross above a new round-number threshold tends to draw fresh commentary from cycle-watchers tracking macro shifts in supply absorption.
Bitcoin has held above the indicator during each of its three bear markets since 2015. Brief dips during late-cycle washouts gave way to renewed upward momentum each time.
The 2022 bear market briefly broke that pattern. BTC closed weekly under the line for the first time before reclaiming it. Crossing $60,000 marks a sharp climb from the indicator’s near-$40,000 reading in late 2024.
Recovery From April Lows Adds Momentum
BTC traded near $80,000 on Monday, up roughly 2.3% over 24 hours according to CoinGecko data. The asset has clawed back a meaningful portion of losses sustained during April.
Broader risk-asset weakness had pulled the price well below current levels. Trading volume has held steady through the recovery, suggesting that buy-side interest extends beyond a short-term technical bounce.
Long-term holders and corporate treasuries continue to absorb supply at these prices. Blockstream chief Back argues that public companies holding Bitcoin balance sheets are positioning for a shift away from fiat.
Adam Back has also pushed back on the alarm about miners rotating to AI workloads. He frames the shift as an arbitrage that resolves through hashrate dynamics rather than a structural threat to network security.
Whether the $60,000 threshold proves durable depends on demand sustaining through the next quarter. Sustained strength would extend a run already tied to deeper on-chain signals and a broader bullish phase across Bitcoin markets.
The coming weeks will test whether spot inflows and corporate buying continue to outpace selling from short-term traders.
The post Bitcoin’s 200-Week Moving Average is Signalling Bull Market Cues, Says Adam Back appeared first on BeInCrypto.

A job seeker holds a Now Hiring Correctional Officers paperwork from the Florida Department of Corrections during the Mega JobNewsUSA South Florida Job Fair held in the Amerant Bank Arena on April 30, 2026, in Sunrise, Florida.
Joe Raedle | Getty Images
Traders on prediction markets platform Kalshi are penciling in a better-than consensus estimate for the April labor market report set to release on Friday.
Kalshi traders think there’s about a 50% chance nonfarm payrolls will come in at 66,000 jobs or more created in the month. That’s higher than predictions by economists polled by Dow Jones for 53,000 new jobs.
While in the last year nonfarm payroll growth has swung back and forth between job creation and job losses, traders see an 81% chance this report is a positive number. That would be the first back-to-back month of job growth since May 2025.
But traders are also skeptical of a big six-digit report, as they give it just a 30% chance that the report comes in hot at 100,000 or more.
Nonfarm payroll growth has slowed enormously since 2025. In the last 10 months, five have experienced negative job growth. And in 2026, job growth has been volatile, with more than 150,000 jobs gained in both January and March but 133,000 lost in February.
On Polymarket, traders have a slightly more pessimistic outlook. Traders on that platform think the most likely scenario is a report between zero to 50,000 jobs created, with odds at 26%.
Disclosure: CNBC and Kalshi have a commercial relationship that includes a CNBC minority investment.
Markets shift and headlines fade, but the core principles of building long-term wealth remain constant. Join us for our third CNBC Pro LIVE, where investors of all backgrounds – from financial professionals to everyday individuals – come together to cut through the noise and gain actionable strategies for smarter, more disciplined investing. No matter where you’re starting from, you’ll leave with clearer thinking, stronger strategies. Enter your email here to get a discount code
Pictured: Morgan Gibbs-White issues startling injury update after nasty clash in Chelsea win

Surprise IVF Delivery Stuns Kalgoorlie Family

Prediction Markets Enter Institutional Era After First Block Trade
Manchester United reach agreement with Casemiro over contract clause amid transfer speculation

US brings back mandatory military draft registration

Steven Gerrard disagrees with Gary Neville over ‘shock’ Chelsea and Arsenal claim | Football


-
 Politics7 days ago
Drax board avoid their own AGM, accused of greenwashing & environmental racism
-

 Fashion6 days ago
Kylie Jenner’s KHY Enters a New Era with ‘Born in LA’
-

 NewsBeat1 day ago
Channel 5 – All Creatures Great and Small series 7 new post
-
 Tech3 days ago
Trump’s 25% EU auto tariff breaches Turnberry Agreement that also covers semiconductors and digital trade
-

 Business6 days ago
Most Commercial Energy Audits Miss the Real Losses
-

 Crypto World6 days ago
CFTC’s AI will review U.S. crypto registration applications, chairman tells CoinDesk
-
 Sports3 days ago
Paul Scholes issues Marcus Rashford reality check as agreement emerges over Man United star
-

 Business5 days ago
Barclay Brothers Avoid Bankruptcy: HSBC Drops High Court Petitions After IVA Deal
-
 Business5 days ago
Tesla Officially Registers Elon Musk’s Stock: What Investors Need to Know
-

 Tech6 days ago
Get Ready for More Brain-Scanning Consumer Gadgets
-
Crypto World6 days ago
Robinhood Phishing Scam Exploits Gmail Dot Feature to Bypass Security
-

 Crypto World7 days ago
Gmail Dot Trick Underpins Robinhood Phishing, Sending Real-Looking Emails
-

 Entertainment7 days ago
Sister Wives: Janelle Posts New Scary Warning
-

 Entertainment7 days ago
Michael Jackson’s Biopic Excluded Abuse Allegations For $25M
-

 Business4 days ago
Two Powerball Tickets Split $143 Million Jackpot in Indiana and Kansas
-

 Business7 days ago
Superdry co-founder accused of raping woman
-
 Crypto World7 days ago
Meme Coin Based on White House Shooter Conspiracy Rallies 320%
-
Business7 days ago
Opus Genetics president Benjamin Yerxa sells $39,121 in stock
-

 Politics7 days ago
Starmer to whip MPs to vote against probe into himself
-
 Crypto World7 days ago
ETH Triple Top Rejects $2.4K As Analysts Flag Weakness Against BTC
You must be logged in to post a comment Login