Crypto World
ICT Turtle Soup Trading Strategy Explained

The ICT Turtle Soup is a price action strategy built around false breakouts. It targets failed moves at major support and resistance levels across forex and other markets. Turtle Soup trading focuses on liquidity sweeps that trap breakout traders before price reverses. It uses the reversal that often follows a stop run for entry timing.
This article covers the Turtle Soup forex setup along with its core components. Let’s discuss the conditions traders watch for and the entry framework that goes with them.
What Is the ICT Turtle Soup Pattern?
The ICT Turtle Soup is a reversal approach based on failed breakouts at key support and resistance levels. This forex reversal strategy comes from the Inner Circle Trader (ICT) methodology and frames failed moves as setups.
Traders aim to identify and take advantage of situations where the price briefly moves beyond a major support or resistance level, only to reverse direction shortly after. This movement is often seen in ranging markets where prices oscillate between established highs and lows.
The concept behind ICT Turtle Soup trading is rooted in the idea of stop hunts and market imbalances. When the price breaks out, it often triggers stop-loss orders set by other traders, creating a temporary imbalance. A failed breakout occurs when price returns inside the prior range after sweeping a swing level.
The ICT Turtle Soup strategy seeks to capitalise on this by entering trades in the opposite direction once the breakout fails and the price returns to its previous range.
The ICT version adapts the original Turtle Soup setup from Linda Raschke and Larry Connors. In the ICT strategy, forex traders apply it on intraday charts using liquidity and order flow, not fixed 20-day breakout rules.
Typically, traders look for signs of a false breakout. This often shows as price briefly moving above a recent high or below a recent low. Price then fails to sustain the move.
ICT Turtle Soup vs Breakout Strategies
The Turtle Soup strategy and standard breakout trading sit on opposite sides of the same setup. Breakout traders typically enter when price clears a high or low, expecting momentum to continue. ICT Turtle Soup traders wait for that move to fail, then look to position in the opposite direction.
|
Factor |
Breakout strategy |
Turtle Soup |
|
Entry trigger |
Price clears the level |
Price clears, then reverses back inside |
|
Logic |
Momentum continuation |
Failed move and liquidity sweep |
|
Stop loss |
Beyond the breakout |
Beyond the sweep wick |
|
Direction |
With the breakout |
Against it |
The choice between Turtle Soup vs a breakout strategy depends on the prevailing market context. Breakouts typically work in trending conditions where buying or selling momentum drives continuation. Turtle soup setups work around range edges where liquidity sits and breakouts often fail.
Core Elements of the ICT Turtle Soup Setup
The ICT Turtle Soup setup uses several elements working together to identify failed breakouts. Each element provides context for where price might sweep liquidity before reversing back inside the prior range.
The core elements traders typically work with include:
- Order flow and market structure across higher and lower timeframes
- Liquidity and stop hunts at swing highs and swing lows
- Internal and external liquidity zones inside the range
- Order blocks and imbalances as supportive context
Each element below shows how price typically reacts during a Turtle Soup trading setup.
Order Flow and Market Structure

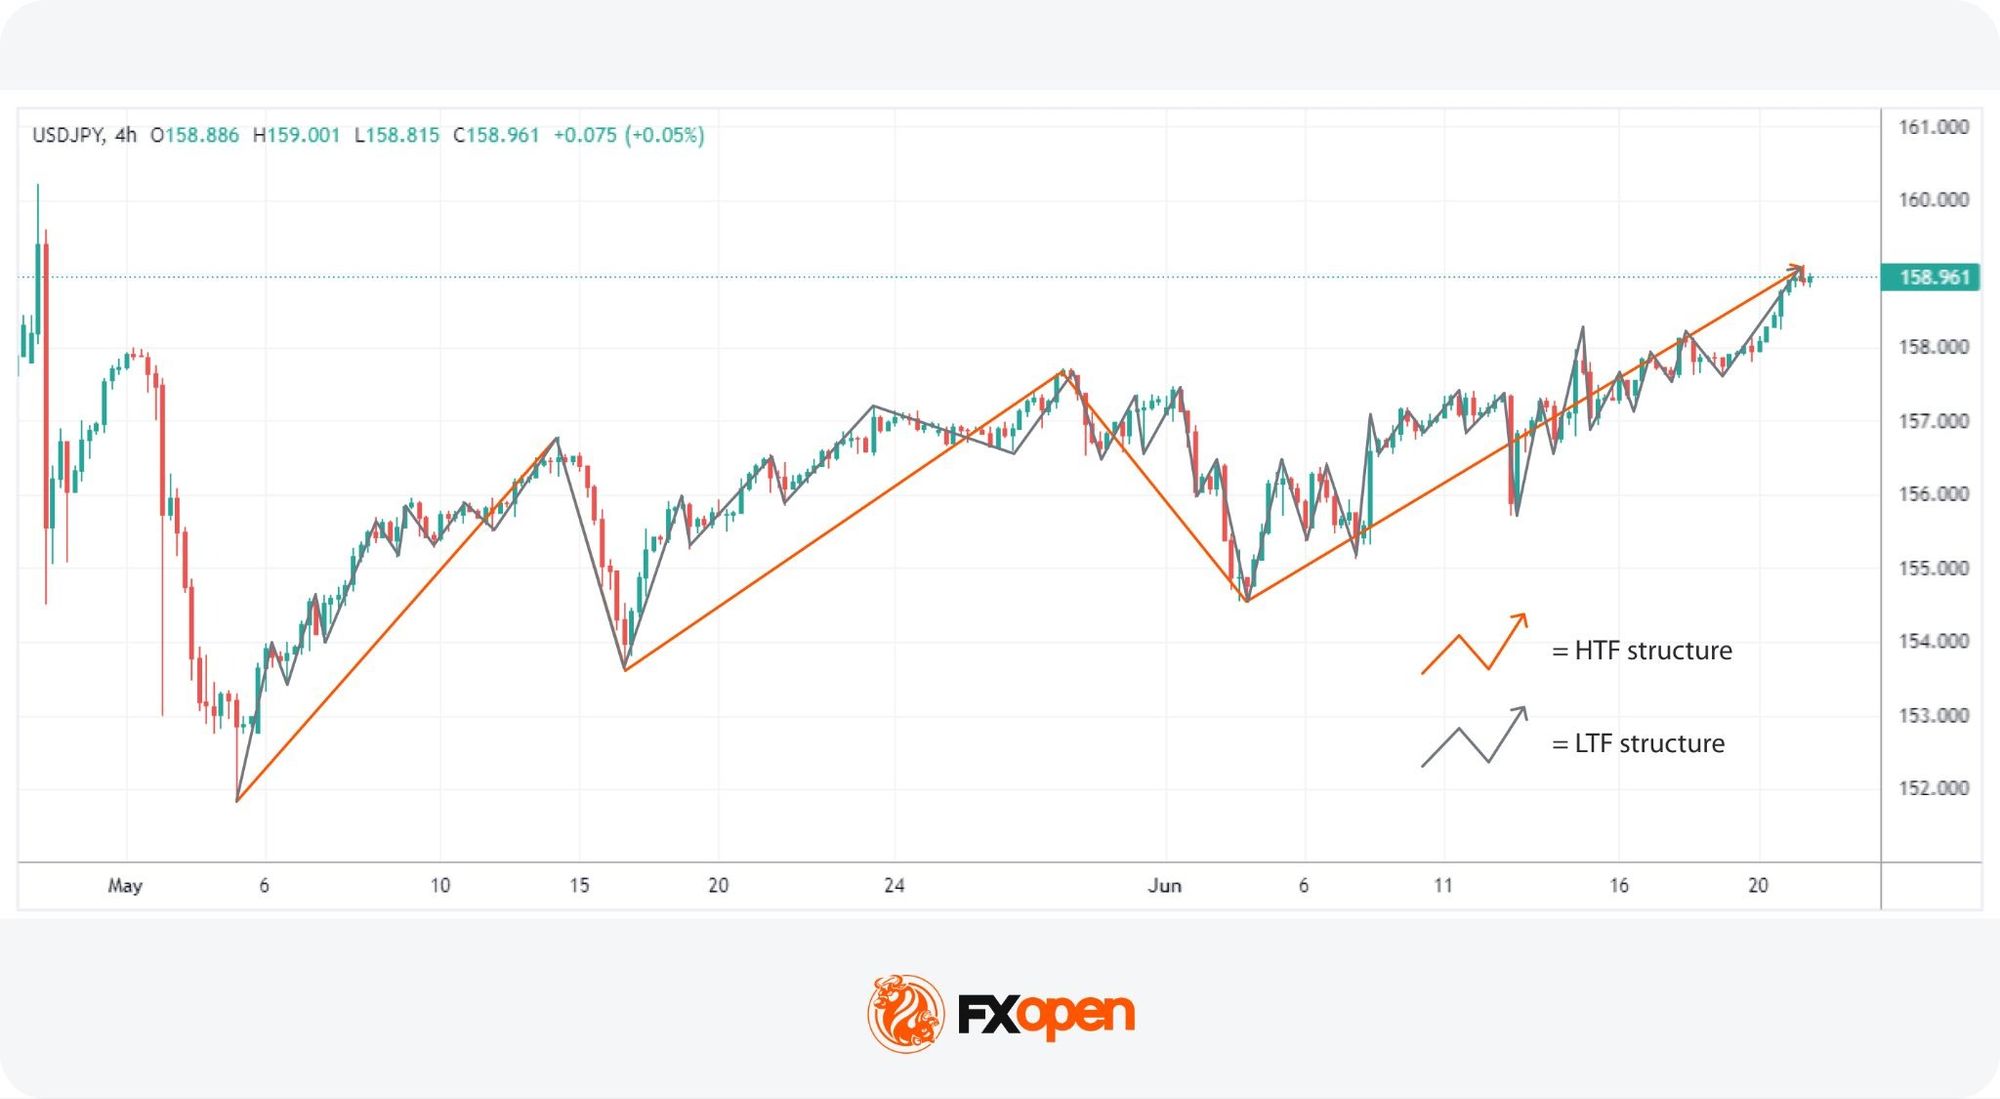
Order flow and market structure are critical in analysing the ICT Turtle Soup pattern. This involves observing price movements and traders’ behaviour in different timeframes.
Order flow refers to the sequence of buying and selling activity that drives price. Market structure organises that activity into recognisable patterns of highs and lows. Together, they describe the directional bias of a market.
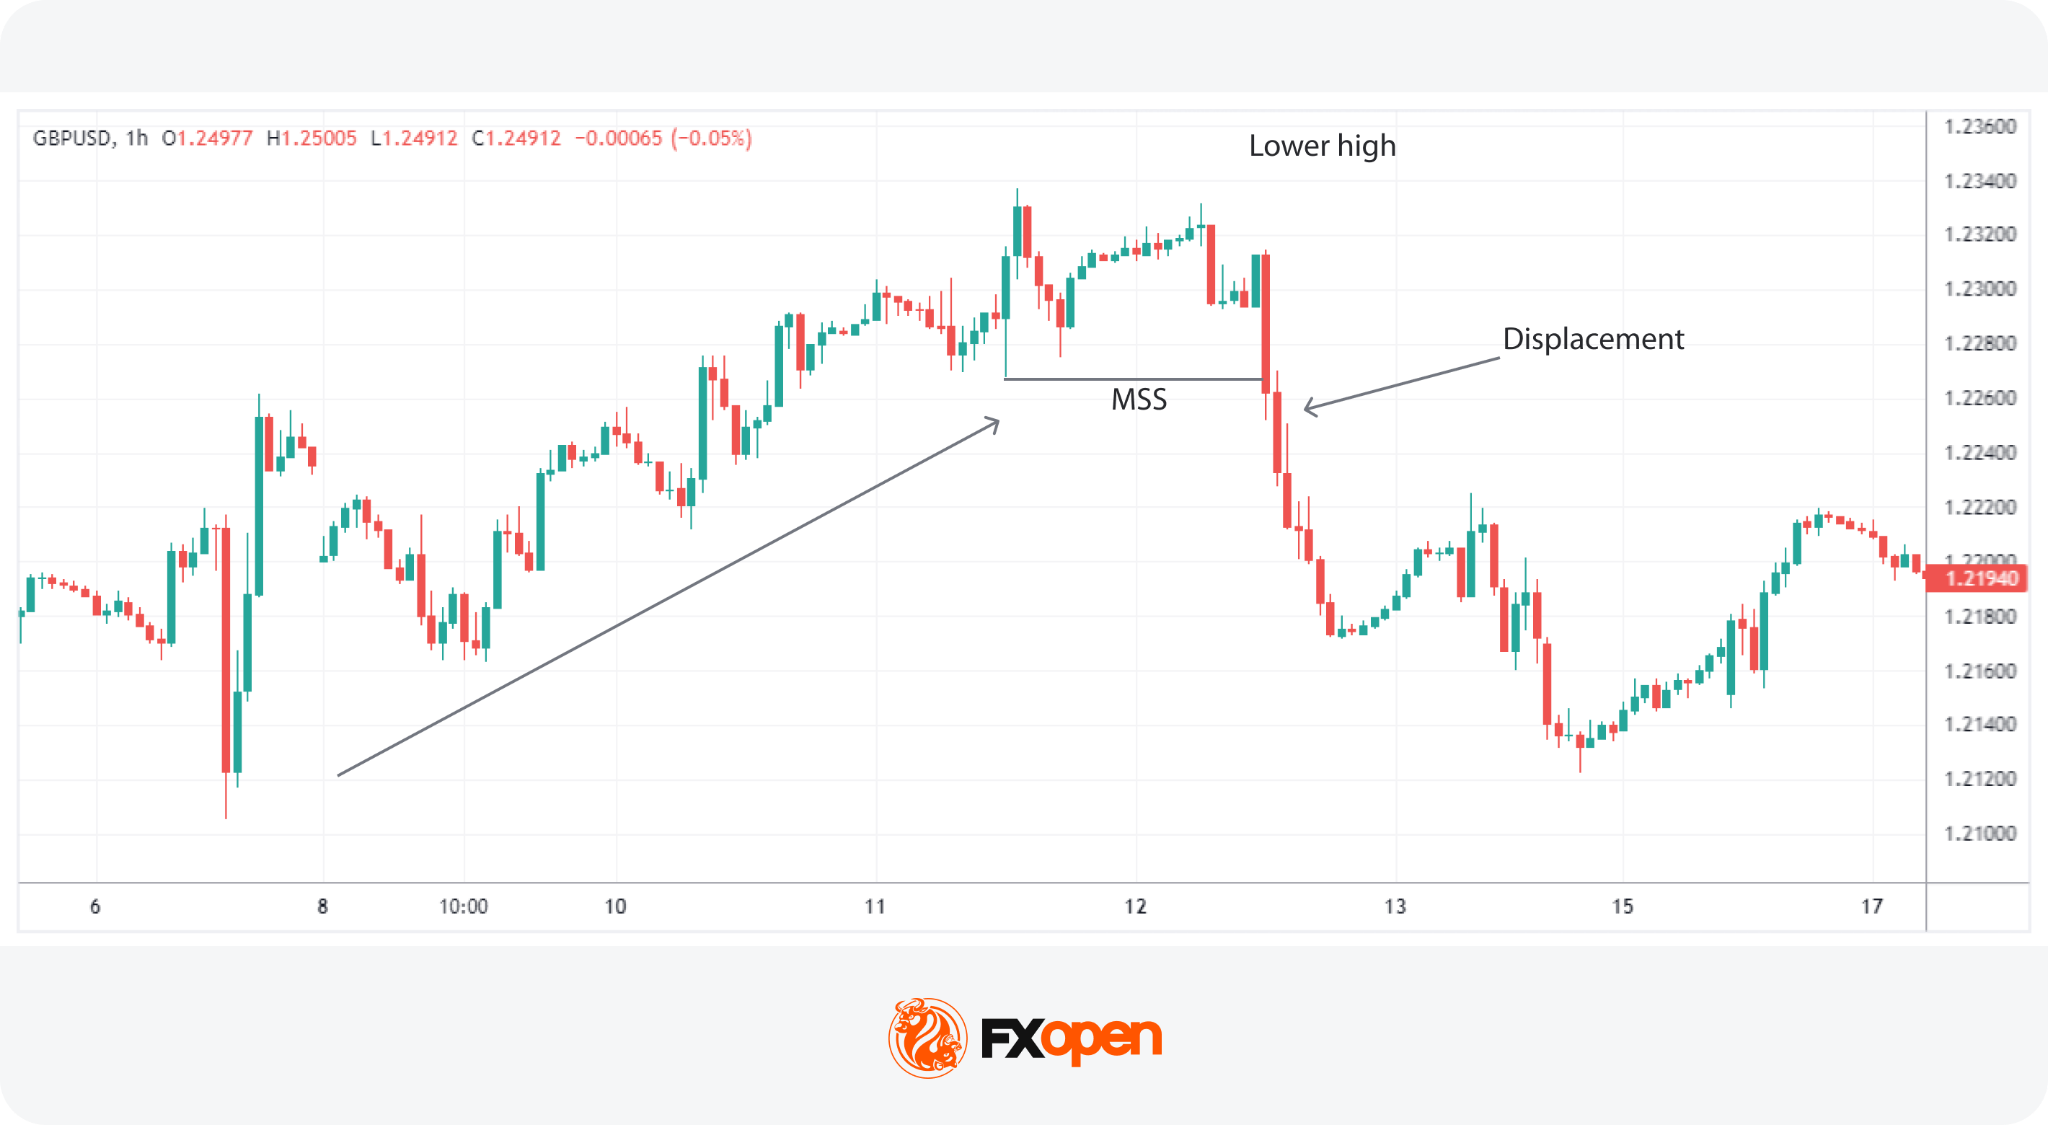
Traders also track a Market Structure Shift (MSS), which signals a potential change in trend direction. An MSS appears when price breaks an opposing swing point with displacement. Displacement here means a strong, single-direction candle that closes well beyond the broken level.
If you want to analyse higher and lower timeframe price movements, consider using FXOpen’s TickTrader platform.
Higher Timeframe Structure
This refers to the broader trend governing the lower timeframe trend. For traders using the 15m-1h charts to trade, this might mean structure visible on 4h or 1d charts.
Higher timeframe structures may help traders identify the major support and resistance levels. These levels are important as they mark the boundaries within which the market generally oscillates. Traders use these to determine the prevailing market direction and potential areas where false breakouts (stop hunts) are likely to occur.
This higher timeframe view sets the directional bias for the Turtle Soup setup. A market making higher highs and higher lows suggests a bullish bias, where traders typically look for long-side setups after liquidity sweeps below swing lows. The reverse applies in a bearish structure of lower highs and lower lows.
Lower Timeframe Structure
Lower timeframe structures are examined on hourly or minute charts. These provide a more detailed view of price action within the higher timeframe’s range. They also account for the bullish and bearish legs that dictate a broader higher timeframe trend.
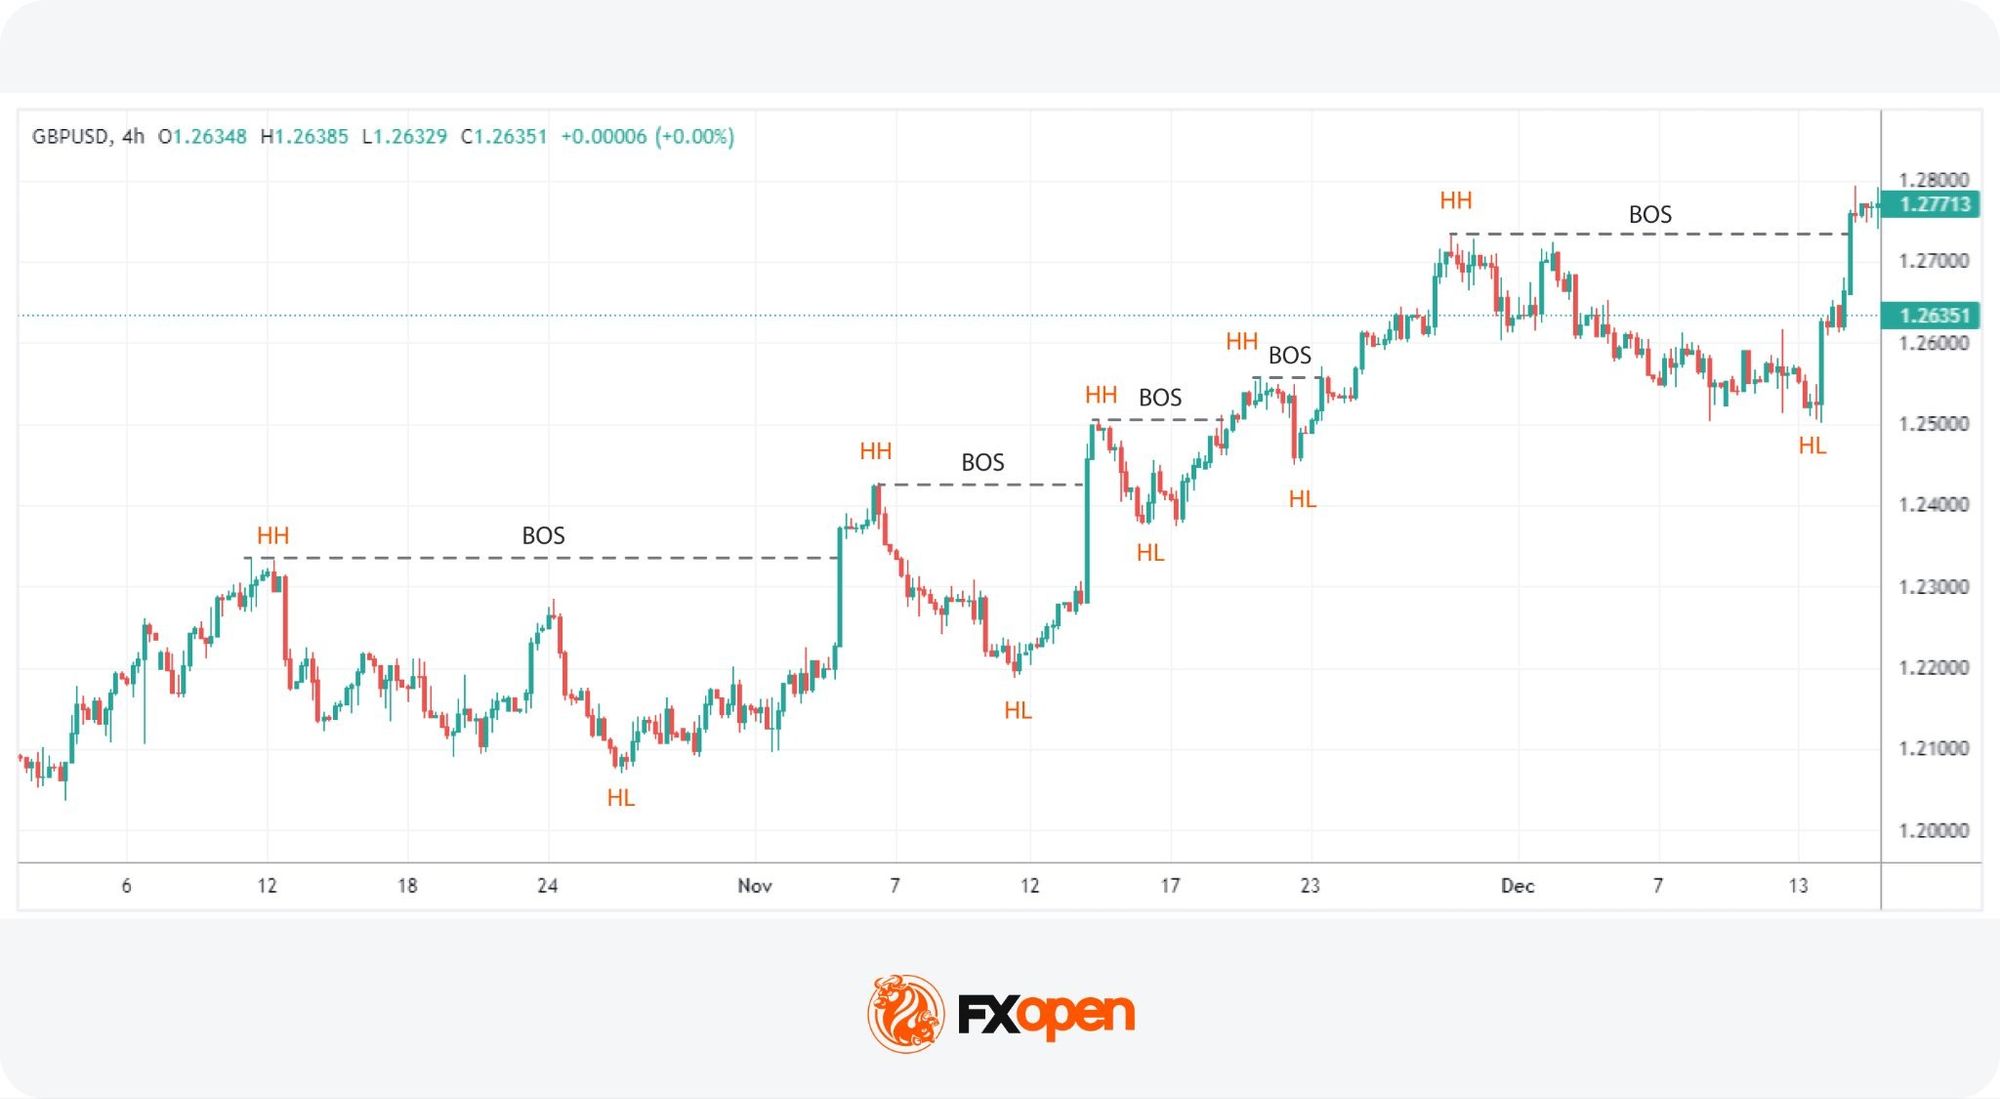
On these charts, traders watch for a Break of Structure (BOS) that aligns with the higher timeframe bias. A BOS occurs when price breaks a recent swing high or low in the trend’s direction. Displacement supports the move when a strong candle closes well beyond that swing point with limited pullback.
Together, these signals confirm the lower timeframe is aligning with the Turtle Soup setup bias.
Liquidity and Stop Hunts
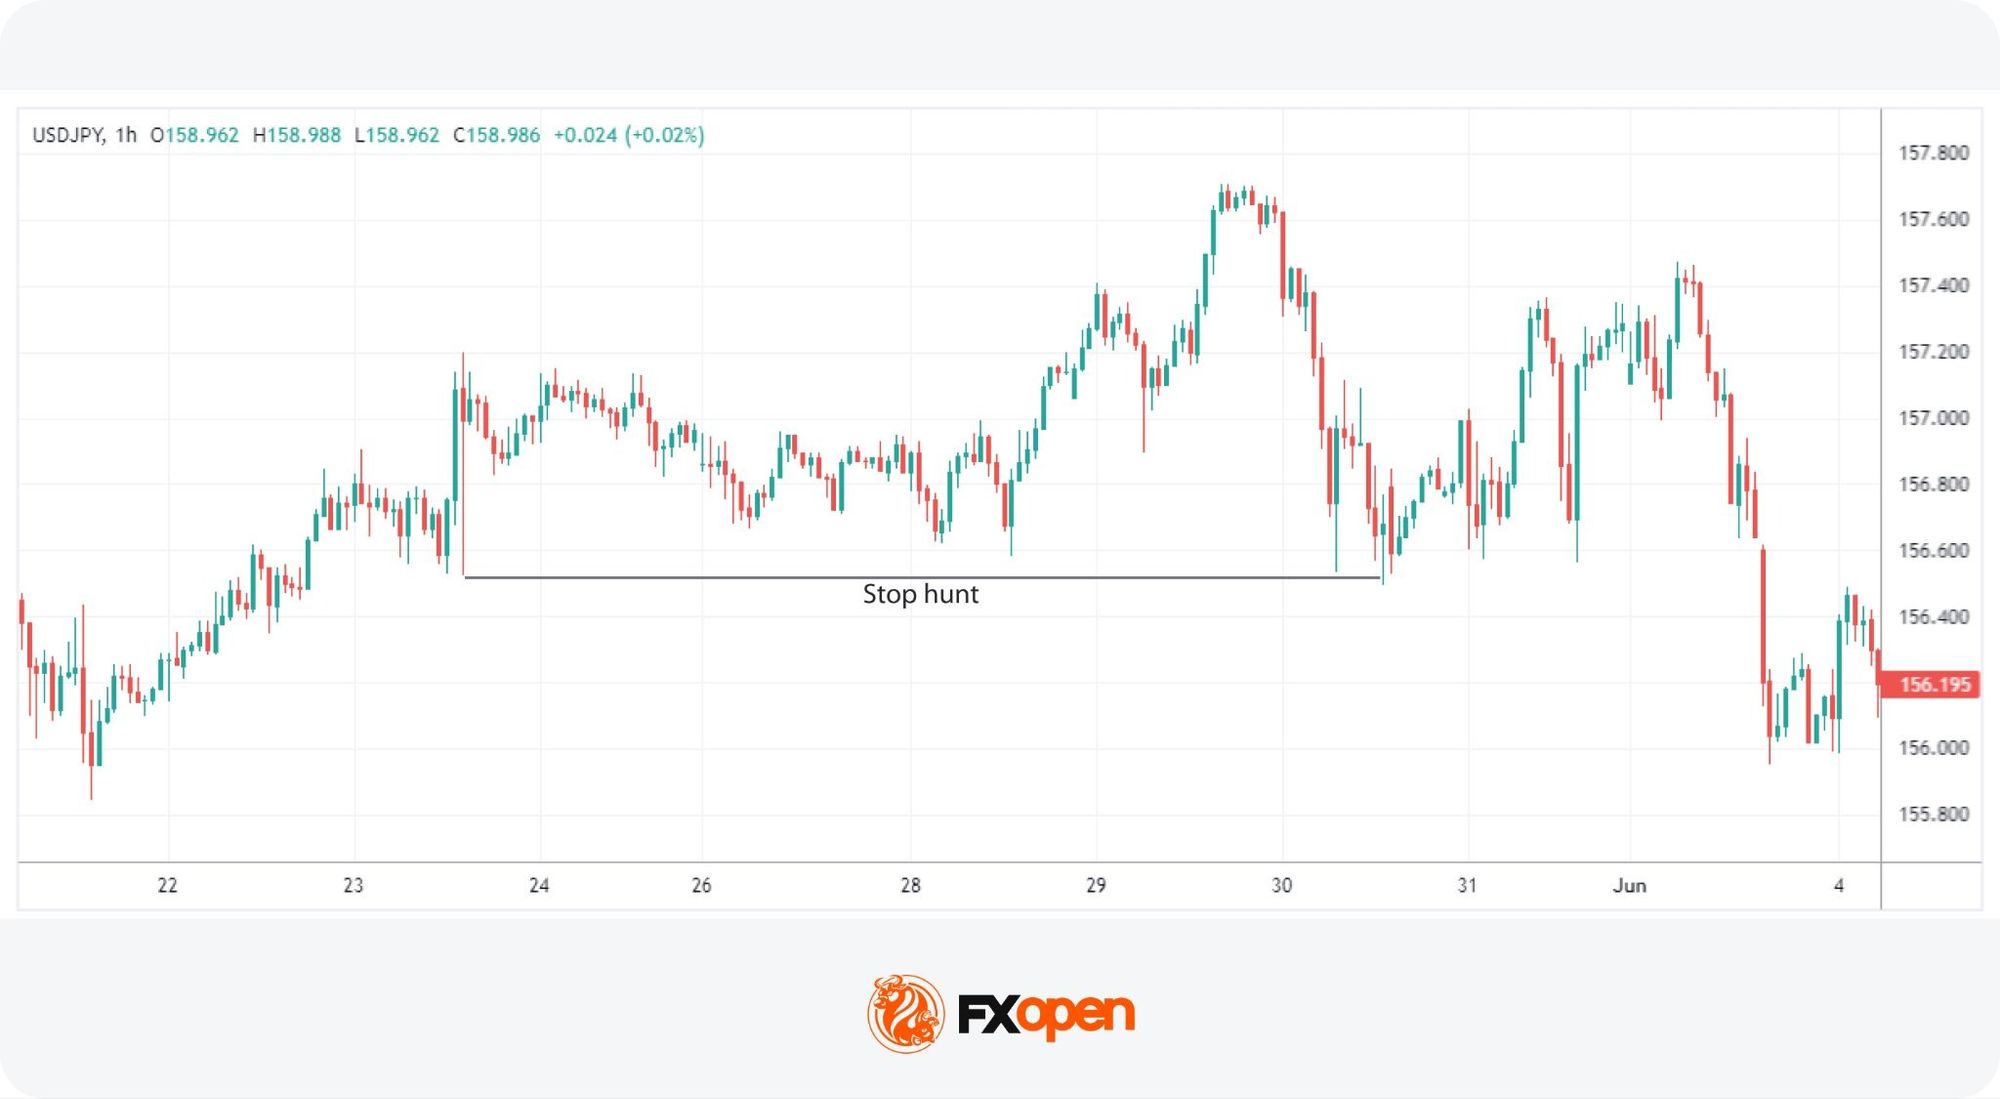
In general trading terms, liquidity represents how easy it is to enter or exit a market. However, in the context of the ICT Turtle Soup pattern, areas of liquidity can be identified beyond key swing points.
These pools of stop-loss orders sit just above swing highs and just below swing lows. These orders are ready to be triggered if price reaches the level.
Stop hunts in trading, also known as a liquidity sweep or stop run, are central to Turtle Soup setups. They occur when price moves through a resistance or support level, triggering clustered stop-loss orders that sit beyond. Triggered stops create a liquidity spike that allows price to reverse back into the range. Traders applying the ICT Turtle Soup strategy typically position against the initial breakout direction once that liquidity has been swept.
Internal and External Liquidity
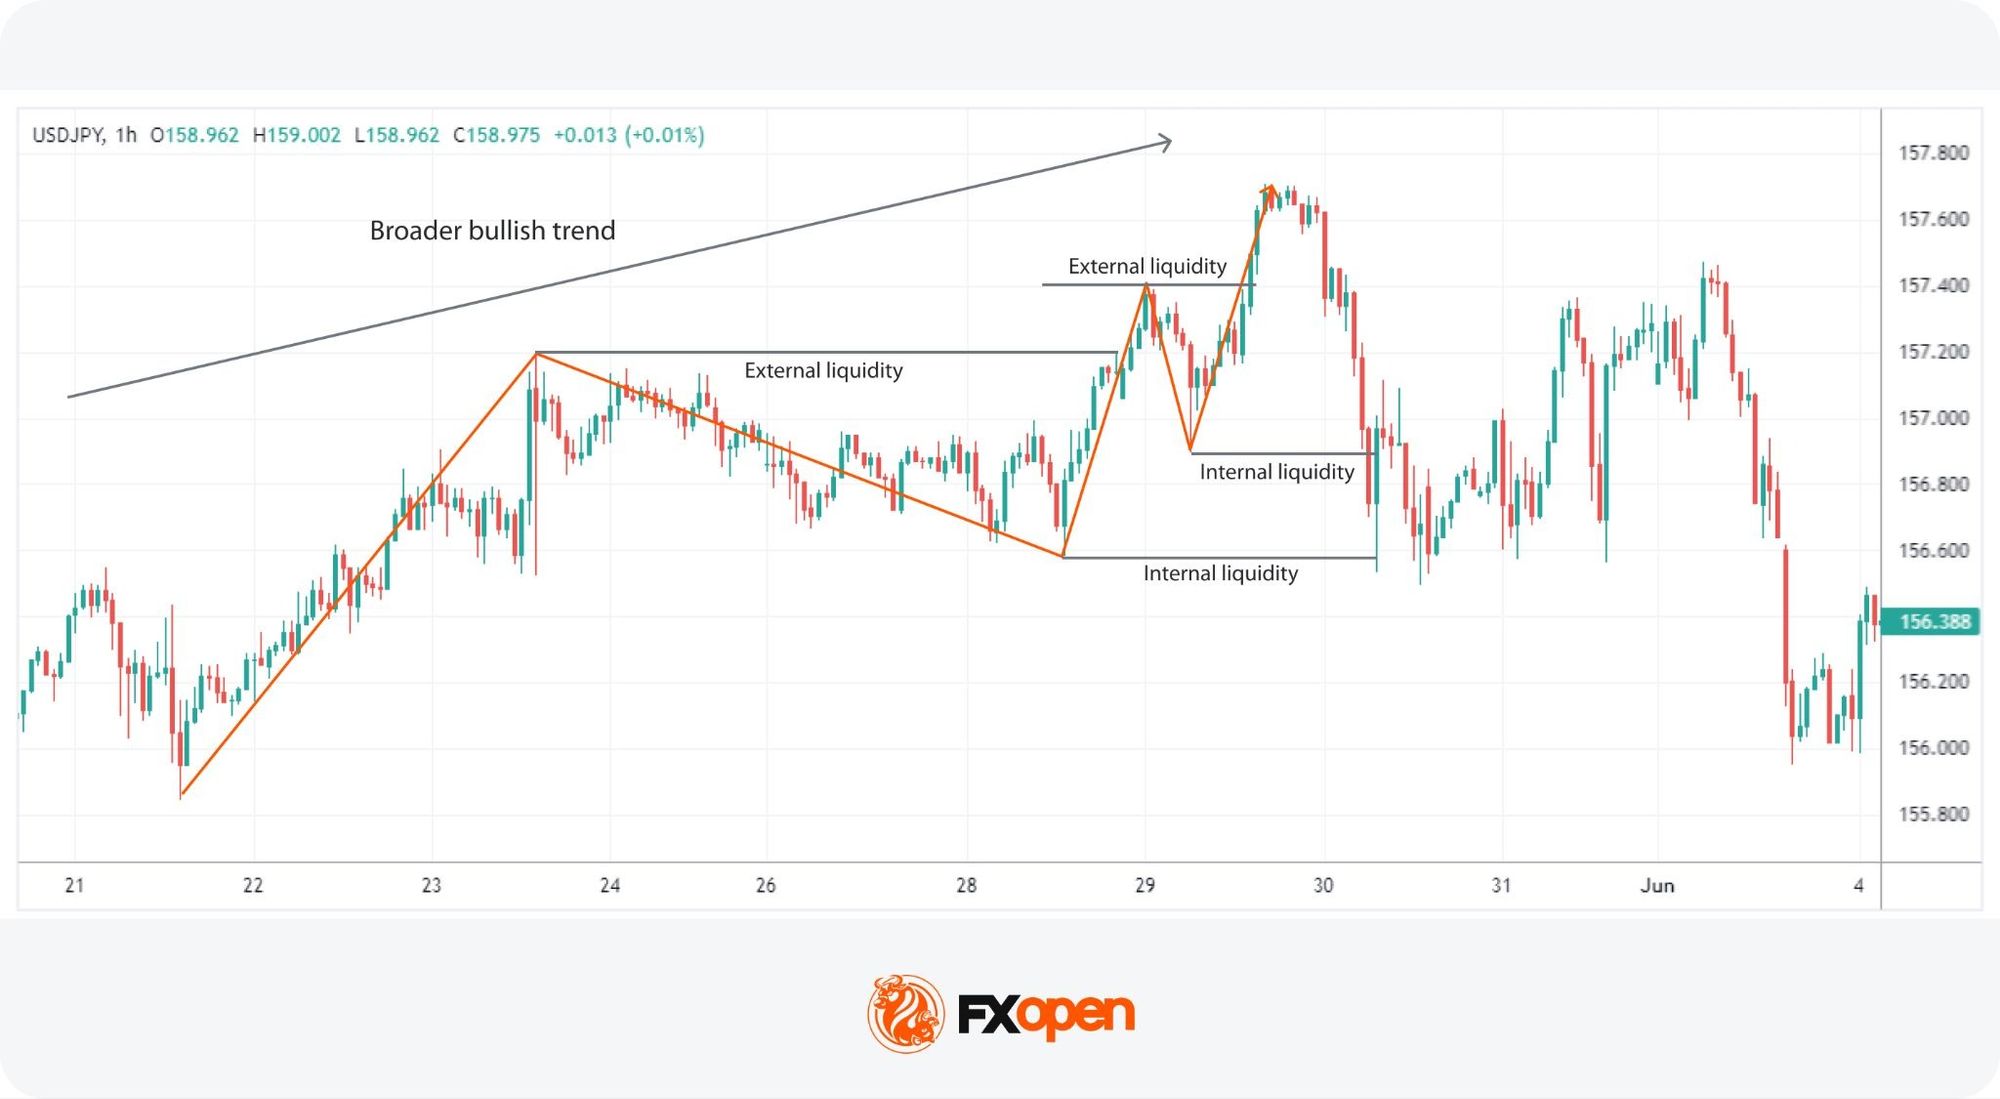
Internal and external liquidity sit on opposite sides of the higher timeframe range. Identifying both is central to Turtle Soup forex setups, since each plays a different role.
Internal liquidity refers to the liquidity available within the range of the higher timeframe structure. It involves identifying smaller support and resistance levels within the larger range. In a bullish leg, internal liquidity rests beneath each higher low. In a bearish leg, it sits above each lower high. This internal liquidity is often swept to start a counter-move within the broader trend.
External liquidity involves liquidity that exists outside the major highs and lows of the higher timeframe trend. The swing low where a bullish leg started is one external liquidity zone. The swing high where a bearish retracement began is another external liquidity zone.
Quick reference:
- Internal liquidity: inside the higher timeframe range, beneath higher lows (bullish) or above lower highs (bearish).
- External liquidity: outside the higher timeframe range, at the extremes that defined the leg.
Context Tools: Order Blocks and Imbalances
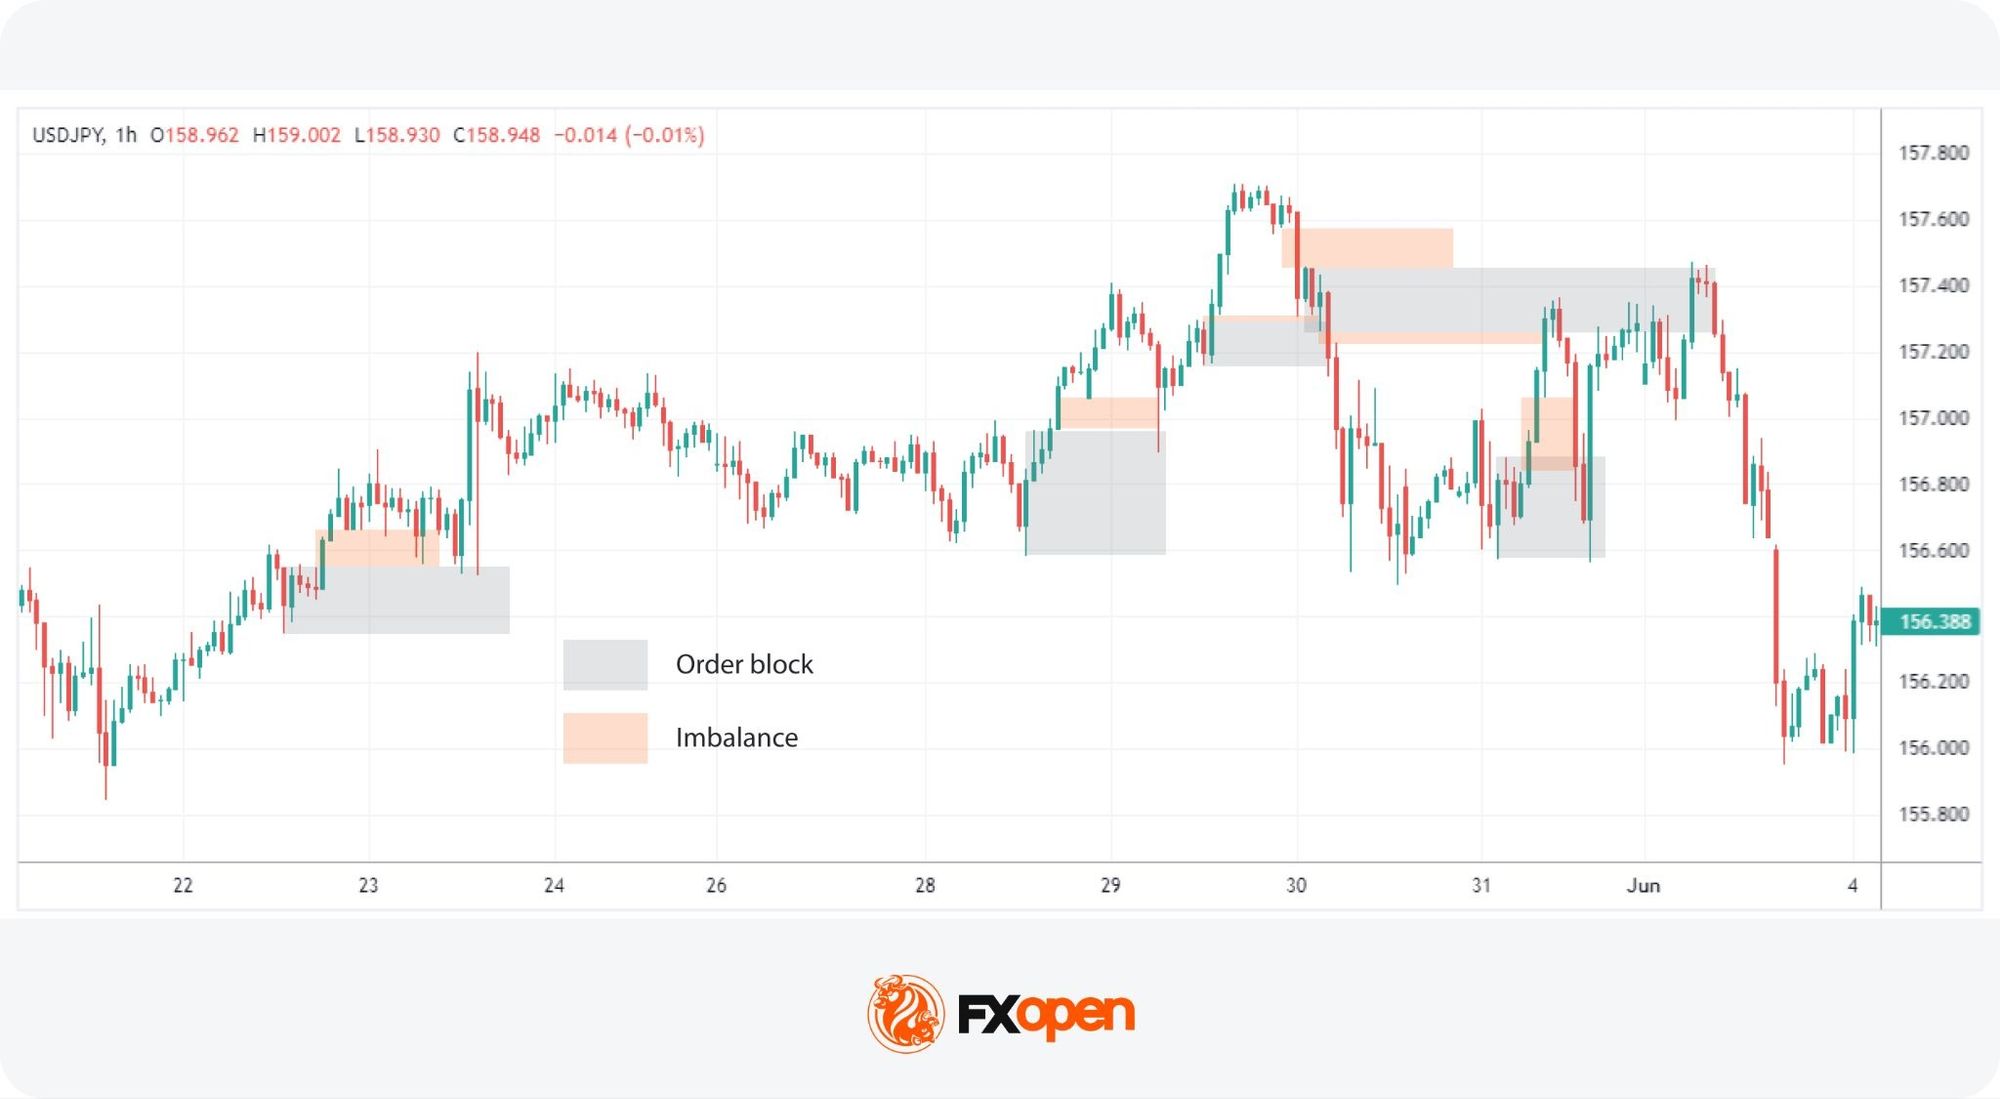
While not directly involved in the ICT Turtle Soup setup, order blocks and imbalances act as supportive context rather than required components. Understanding them can provide insight into where the price might head and the general market context.
Order blocks are areas where significant buying or selling activity has previously occurred, often due to institutional orders. These blocks represent zones of support and resistance where the price is likely to react.
- Bullish order blocks form at the base of upward moves and often act as support on a revisit.
- Bearish order blocks form at the top of downward moves and often act as resistance.
Imbalances, or more precisely fair value gaps (FVGs), are price regions where the market has moved too quickly. When price rapidly moves in one direction, it leaves behind an area with little trading activity. The market often returns to fill these gaps before continuing.
ICT Turtle Soup Setup Conditions
The ICT Turtle Soup setup forms when several conditions appear together on the chart. Each condition narrows the context until a failed breakout becomes the likely outcome.
The conditions for this liquidity grab trading strategy traders typically look for include:
- A defined higher timeframe bias
- Marked internal liquidity inside that bias
- A liquidity sweep that fails to hold
- Lower timeframe confirmation aligned with the higher timeframe direction
Establishing a Bias
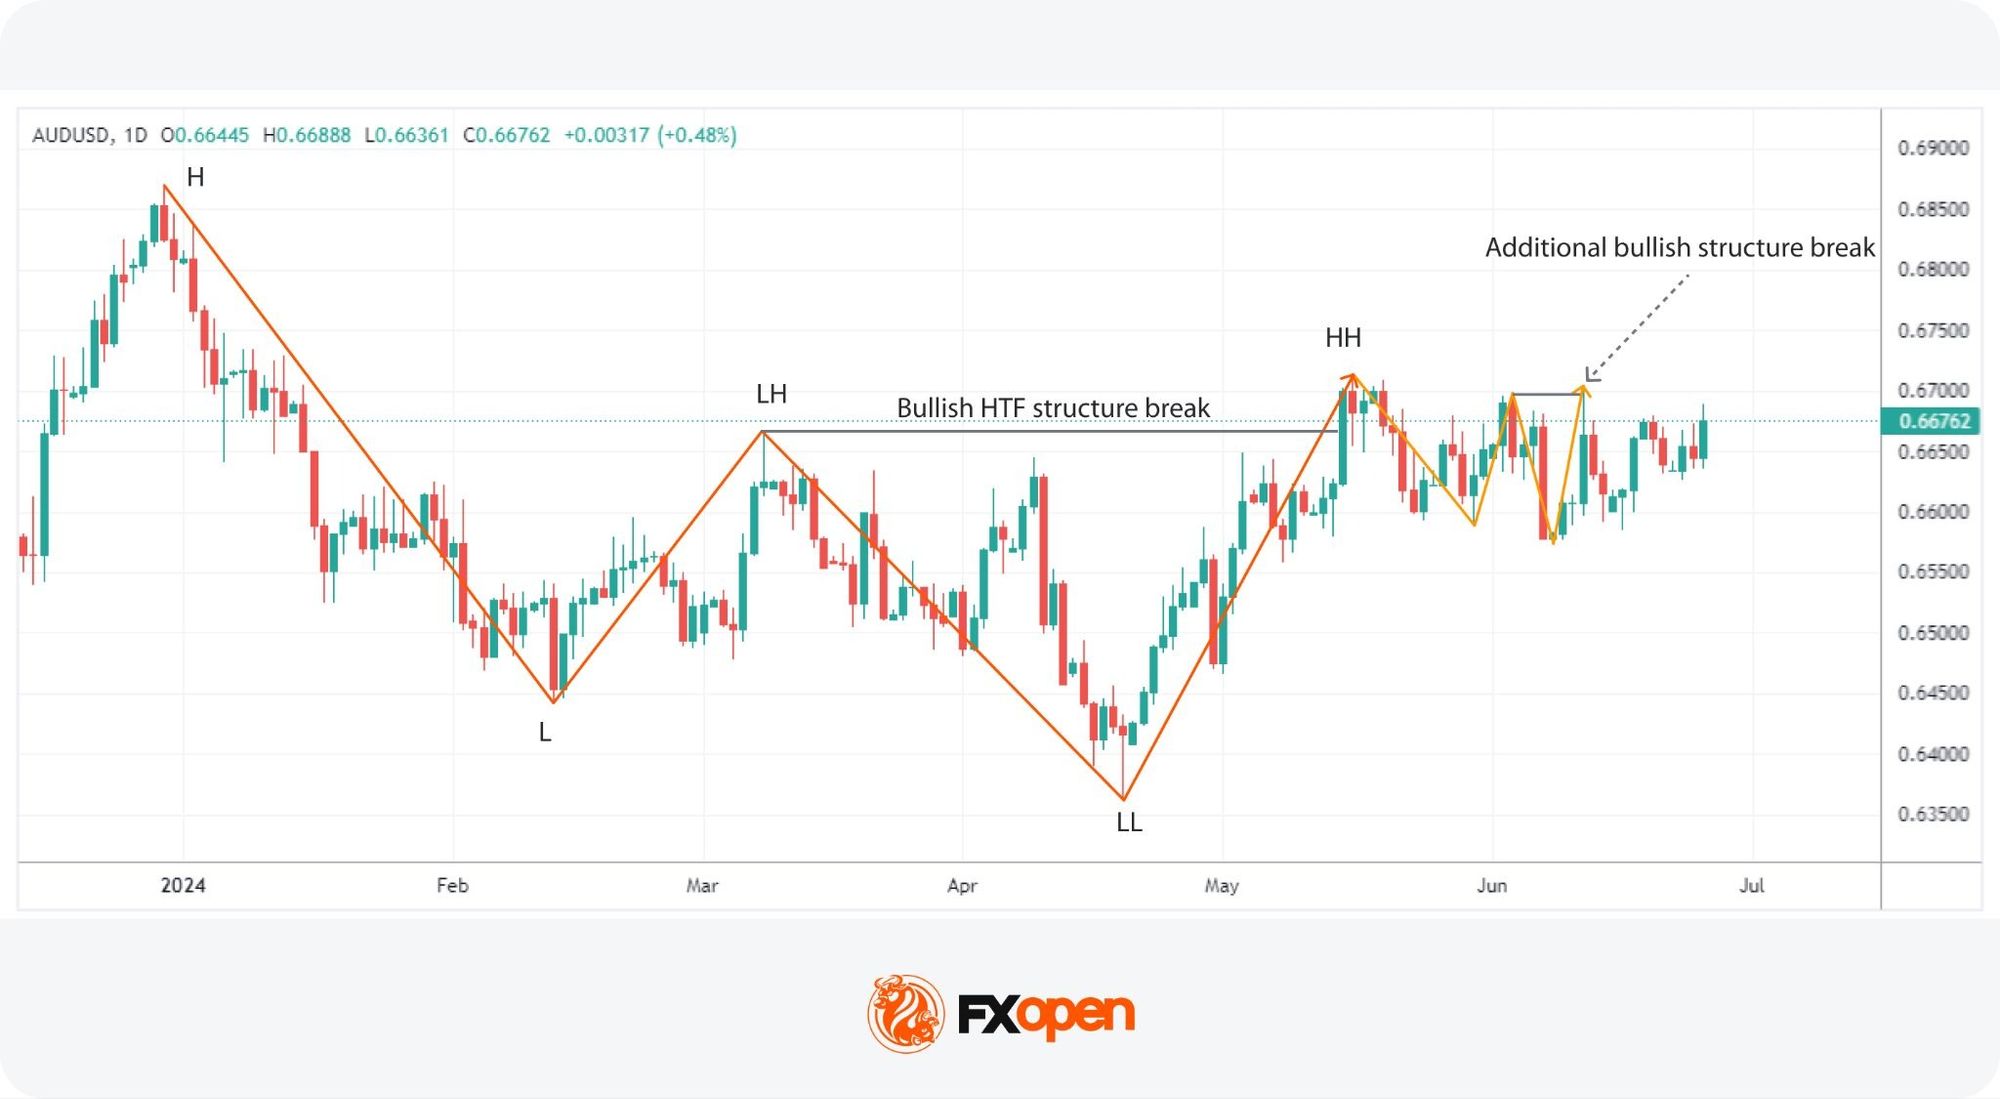
Traders begin by analysing the higher timeframe trend, such as the 4h daily charts, to establish a market bias. This analysis may help determine whether the market is predominantly bullish or bearish.
Measurable criteria for the bias typically include:
- A break of structure in one direction on the higher timeframe
- A series of higher highs and higher lows for a bullish bias
- A series of lower highs and lower lows for a bearish bias
- Price respecting key swing points without violating them in the opposite direction
Once the bias is set, traders only look for setups that align with that direction.
Identifying Internal Liquidity
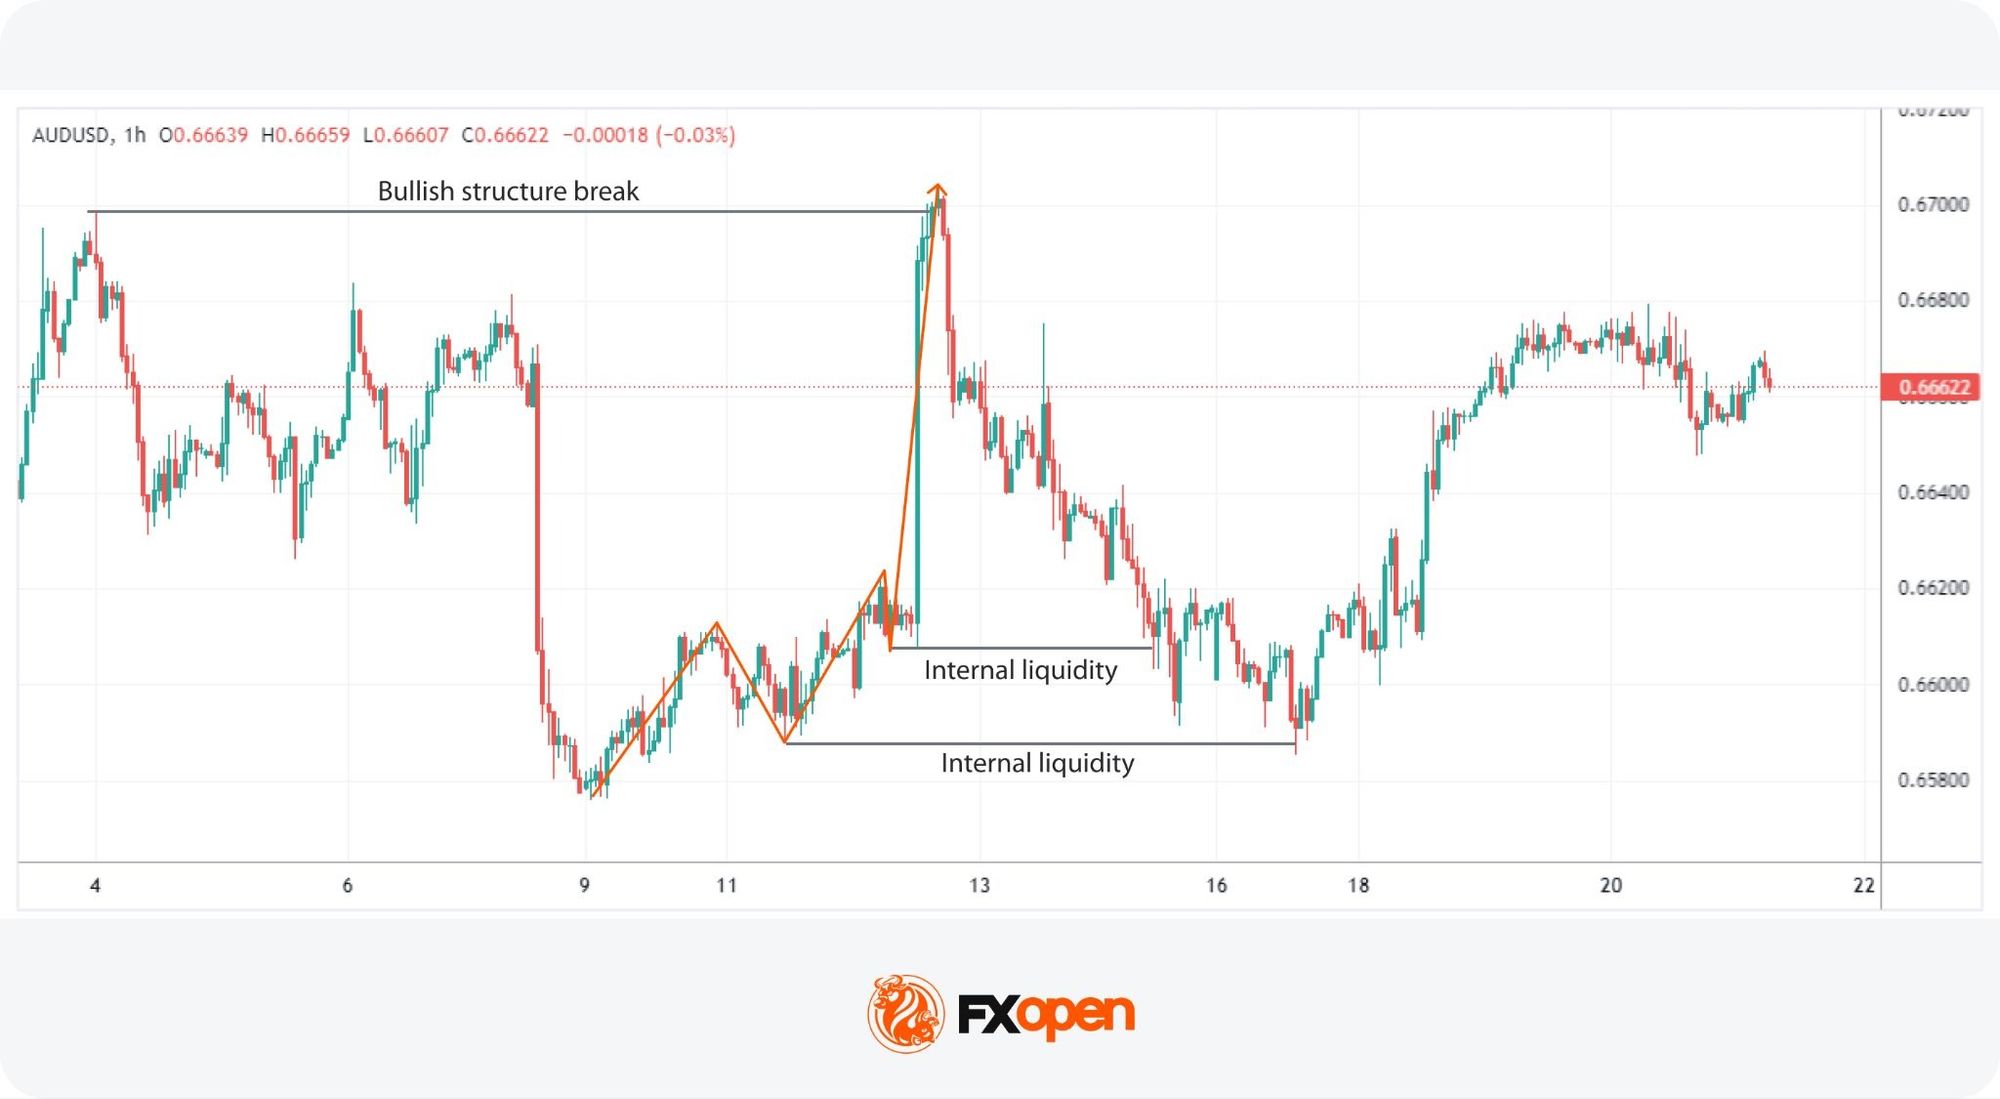
Once the higher timeframe trend is established, traders mark levels of internal liquidity inside the broader leg.
Internal liquidity typically rests in these locations:
- Below recent swing lows in a bullish leg
- Above recent swing highs in a bearish leg
- Beneath equal lows or above equal highs, where stop clusters build
- At round-number levels that attract retail stop placement
These zones are likely to attract stop-loss orders, making them probable targets for a liquidity sweep before the higher timeframe trend resumes.
Liquidity Sweep Trading Condition
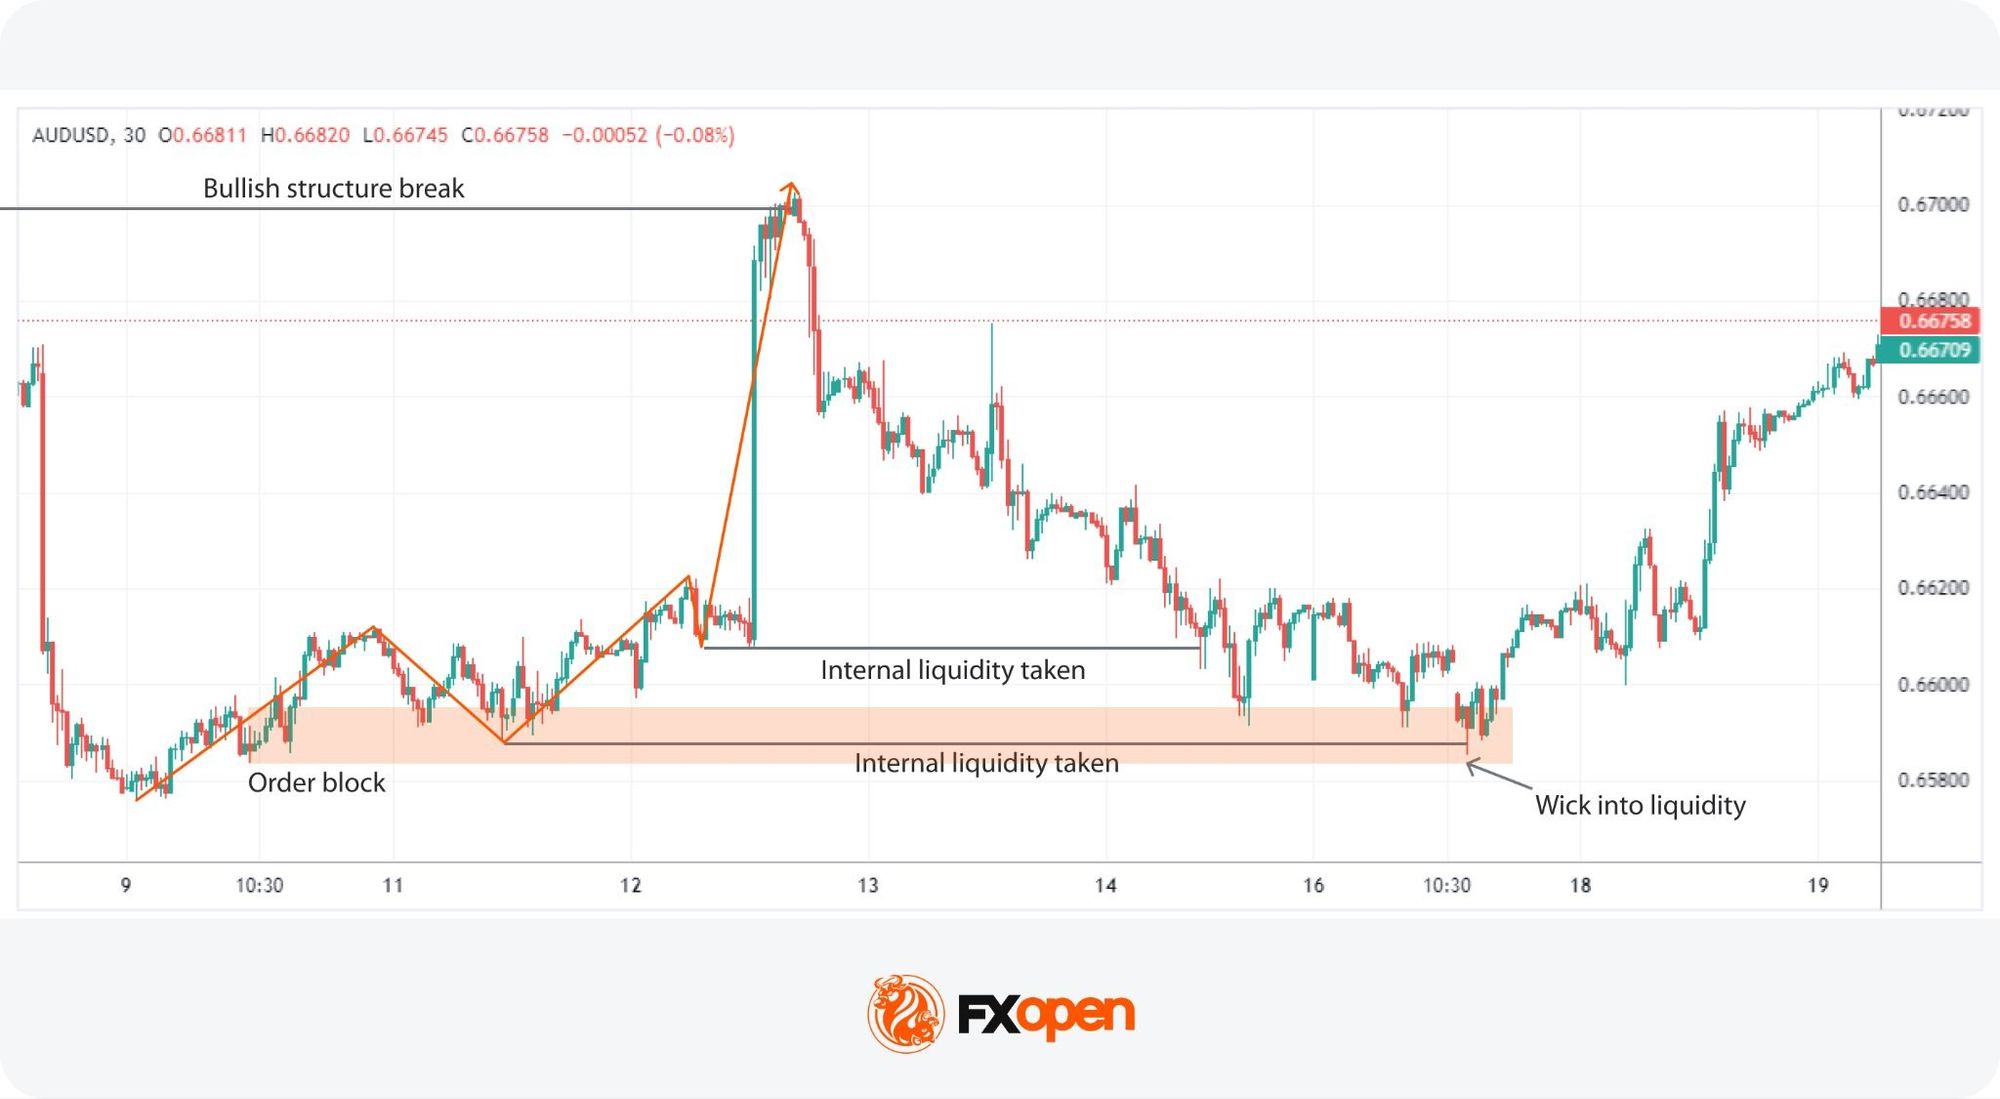
The condition is met when price briefly breaks through a marked internal liquidity level, then reverses back inside the range. This typically happens when stop-loss orders are triggered before price quickly returns.
Confirmation comes from wick and close behaviour. Price should sweep the level with a wick that extends beyond it, then close back inside the prior range on the same candle. A small wick relative to the candle body suggests the sweep absorbed liquidity efficiently.
The setup fails when price closes beyond the swept level instead of reversing. A close outside the range, especially with continuation in the next candle, signals a genuine breakout rather than a Turtle Soup condition.
Lower Timeframe Confirmation
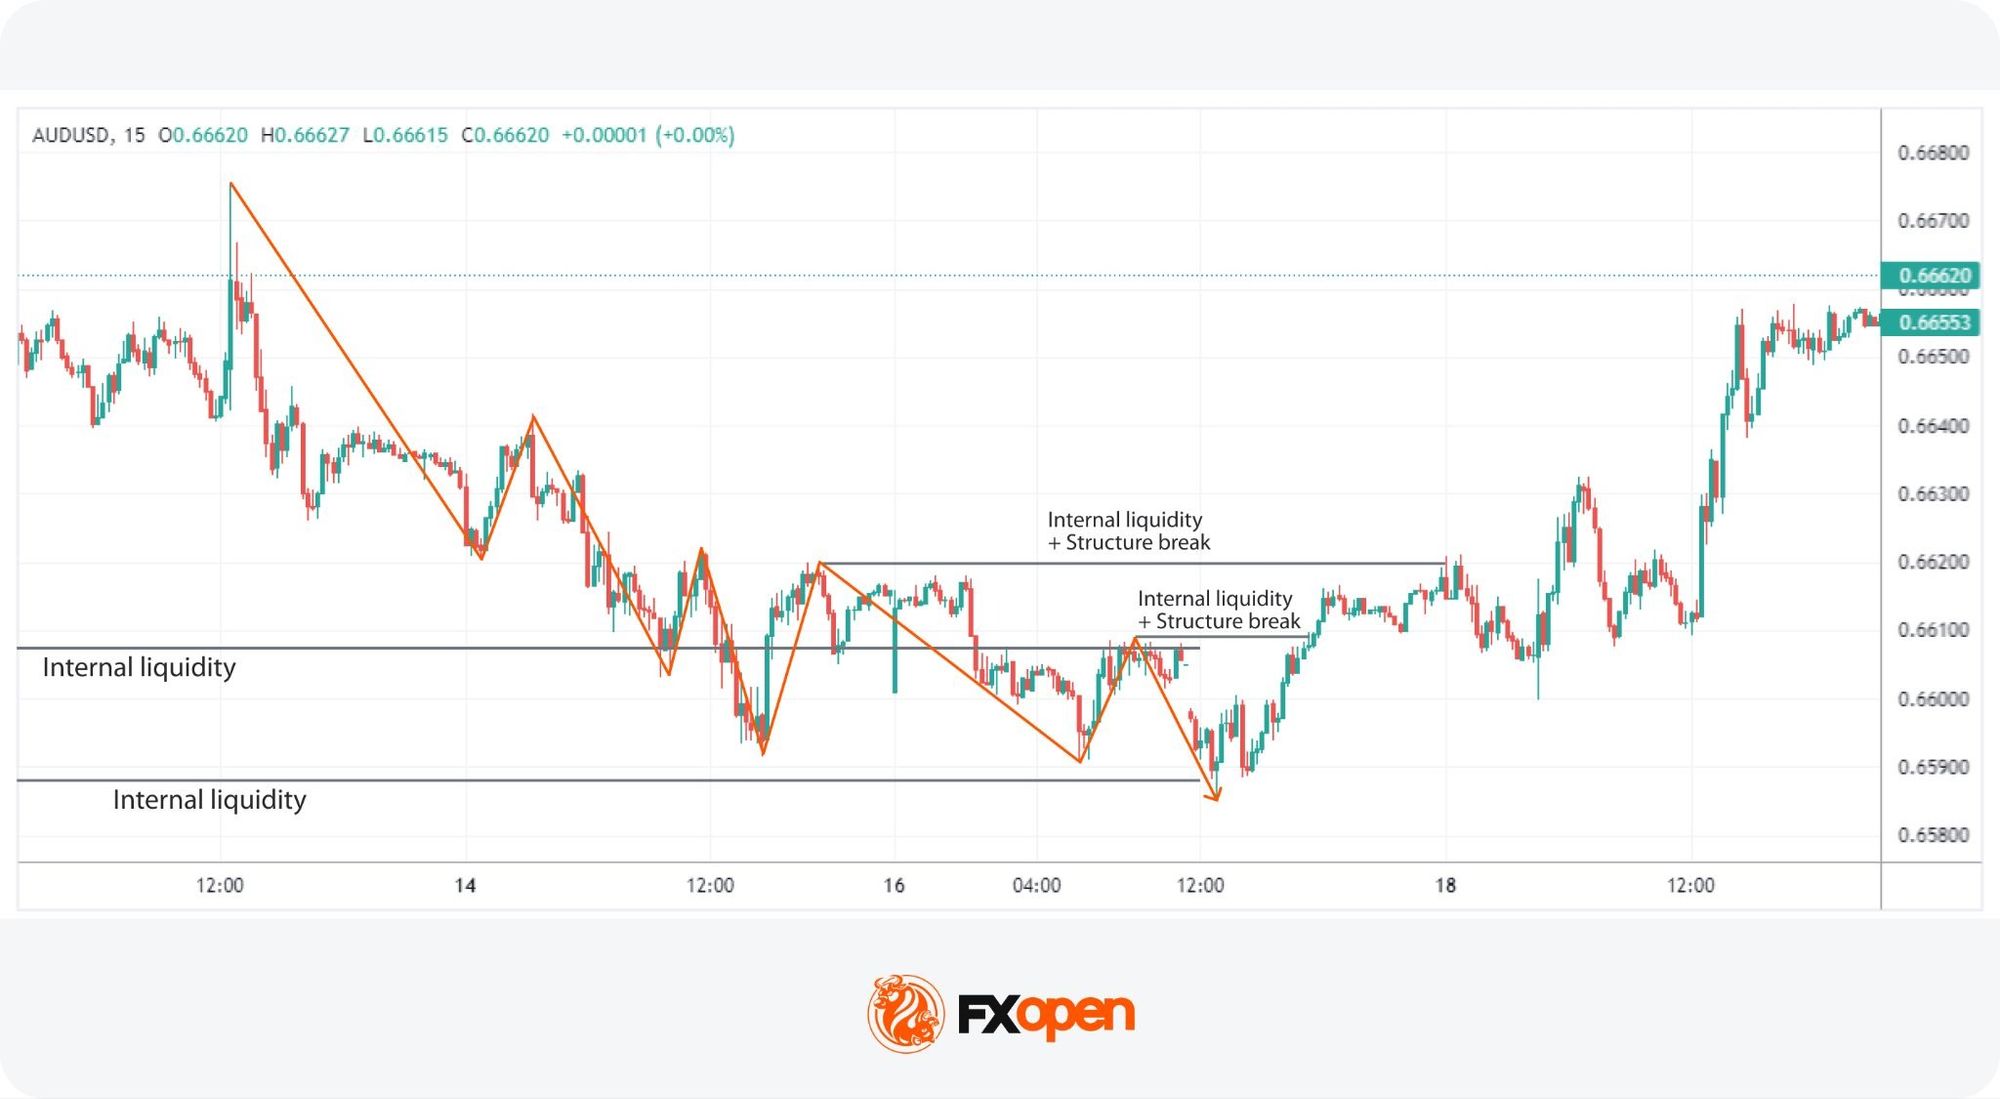
After identifying a liquidity grab beyond this internal liquidity level, traders look for an entry on a lower timeframe. They watch for a Market Structure Shift (MSS) in the direction of the higher timeframe bias. Displacement supports the shift when a strong candle closes well beyond the lower timeframe swing point.
Price often retraces back into the range to fill an imbalance before continuing. This retracement frequently meets an order block left behind by the displacement candle. The combination of MSS, displacement, and an order block retest typically gives a precise entry zone aligned with the higher timeframe direction.
Entry, Stop Loss, and Targets
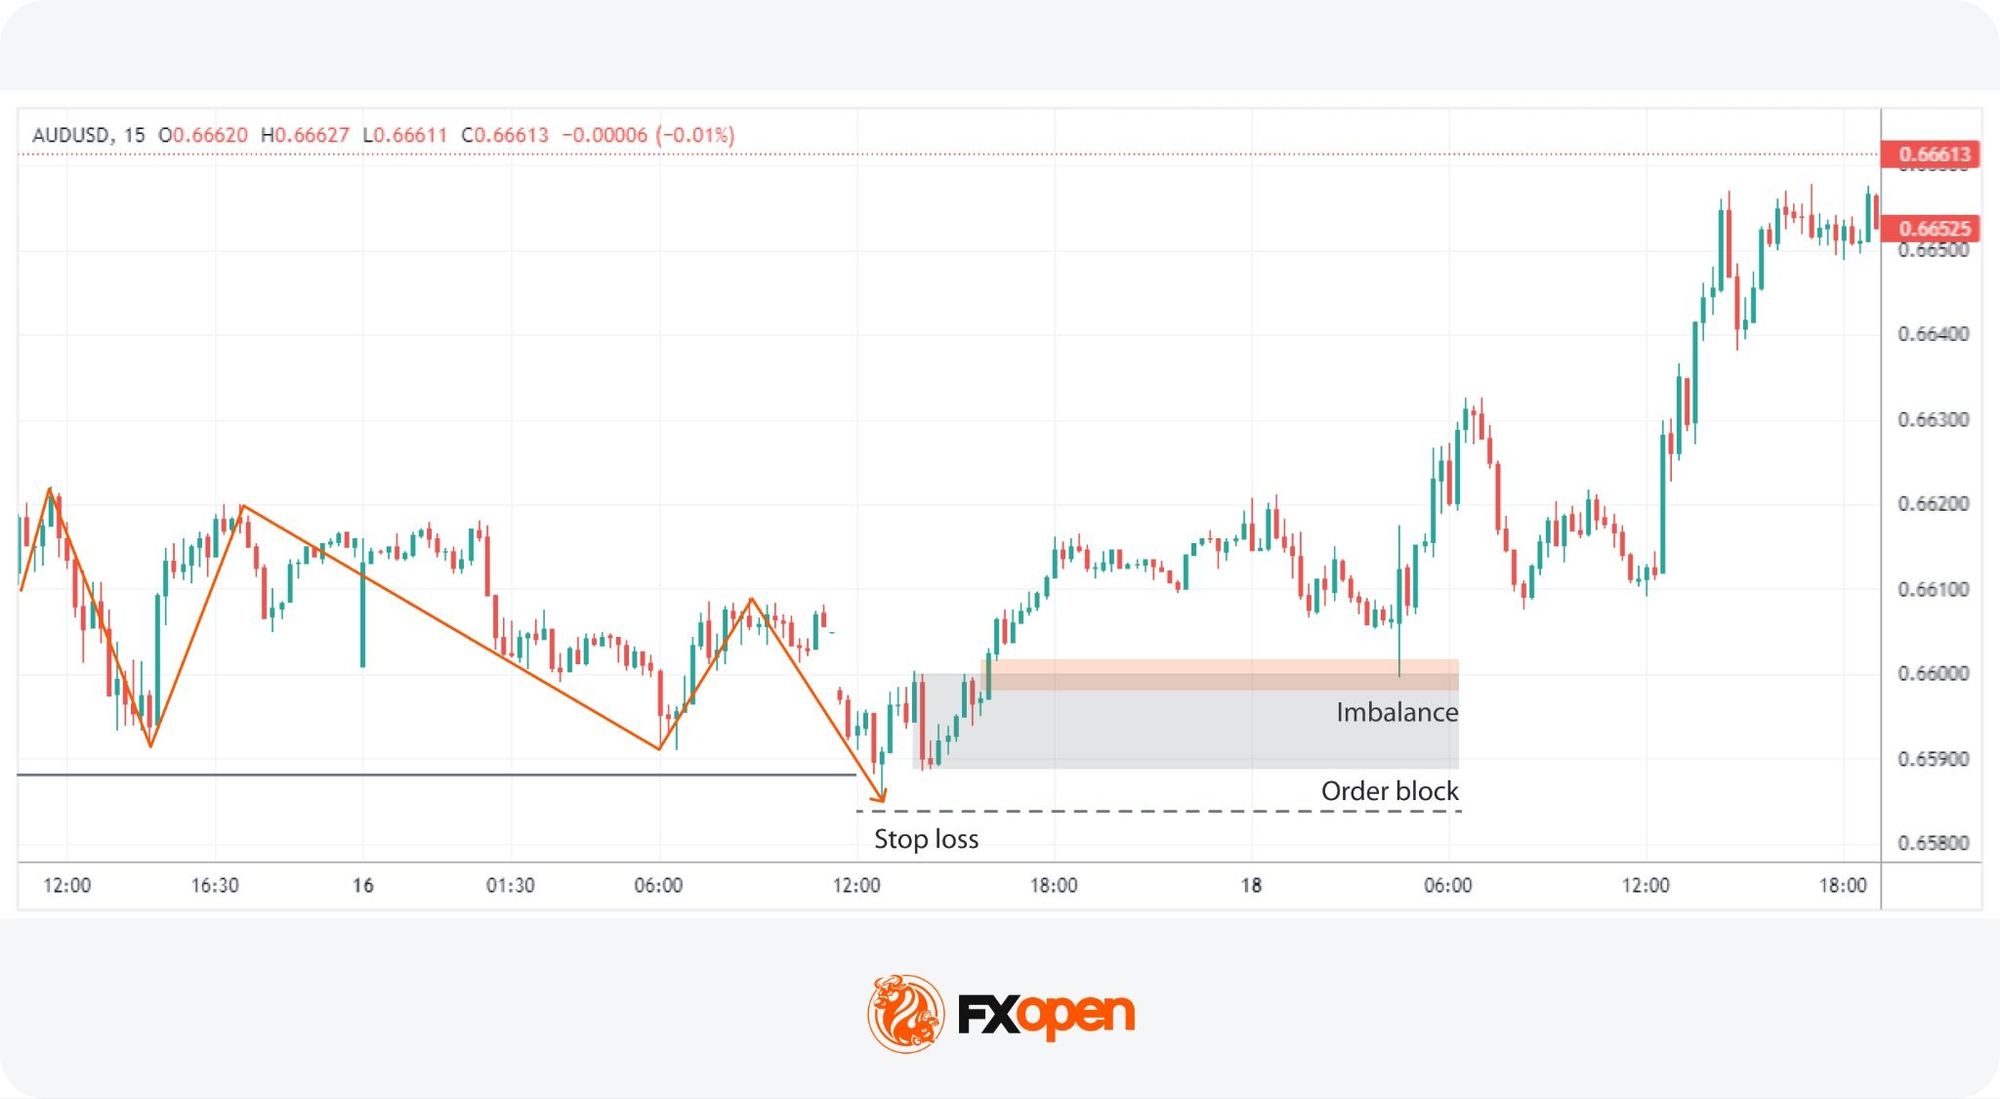
Once the conditions described above appear together, traders typically position in the direction of the higher timeframe bias. The setup gives a clear framework for entry, stop loss, and target placement.
- Entry zone: A limit order at the order block left behind by the displacement candle, in line with the higher timeframe direction.
- Stop loss: Placed just beyond the liquidity sweep wick. Above the recent high for a short trade, below the recent low for a long trade.
- Targets: Set at major liquidity levels such as previous highs or lows, where significant orders are likely to sit.
Position sizing and stop placement should align with the trader’s broader risk management approach. The framework above outlines structure, but potential risk per trade still depends on account-specific factors.
Potential Advantages and Limitations
The ICT Turtle Soup pattern is a trading strategy with several potential benefits and drawbacks.
Advantages
- Defined entry framework: The setup gives a specific entry zone, stop placement, and target structure, which removes ambiguity about where to act.
- Multi-timeframe applicability: The pattern can be applied across different timeframes and market conditions, including ranging and trending markets.
- Structured risk parameters: Stop losses sit just beyond the liquidity sweep, which produces a defined risk distance for each setup.
Limitations
- Steep learning curve: Applying the setup requires familiarity with market structure, liquidity, and order flow, which takes time to build.
- Sensitive to market conditions: Highly volatile or thin markets can produce false signals where sweeps continue rather than reverse.
- Time-intensive: The setup demands monitoring multiple timeframes to identify valid conditions, which limits how many markets a trader can cover at once.
The Bottom Line
The ICT Turtle Soup is a pattern built around failed breakouts and liquidity sweeps at key support and resistance levels. It frames a reversal setup with defined conditions for bias, liquidity sweep behaviour, lower timeframe confirmation, and entry placement.
Like any approach, its outcomes depend on context. The setup tends to work where range edges hold and breakouts fail. It tends to underperform where momentum carries through swept levels. Disciplined execution, careful risk management, and alignment with the broader market context remain the deciding factors.
Traders who want to apply the framework on live markets may open a forex trading account with FXOpen and trade with tight spreads from 0.0 pips and low commissions from $1.50.
FAQs
What Is ICT Turtle Soup in Trading?
ICT Turtle Soup is a method that exploits false breakouts in trading. It identifies potential reversals when the price briefly moves beyond a major support or resistance level, triggering stop-loss orders before reversing direction. This strategy aims to take advantage of these liquidity grabs by entering trades opposite to the initial breakout direction.
What Are the Conditions for ICT Turtle Soup?
To identify the ICT Turtle Soup pattern, traders analyse higher timeframe trends to establish market bias. They then look for counter-trend moves and mark internal liquidity areas. The pattern is identified when the price taps these liquidity zones and reverses quickly, often leaving a small wick. This signals a liquidity grab and potential trade setup in the direction of the higher timeframe trend.
How May Traders Use the ICT Turtle Soup Pattern?
According to theory, using the ICT Turtle Soup pattern involves several steps. First, traders establish a market bias based on higher timeframe analysis. Then, they look for liquidity grabs at marked internal liquidity areas, indicating false breakouts. The next step is to confirm the setup on a lower timeframe by observing a similar liquidity grab and structure break. Lastly, they are supposed to enter trades in the direction of the higher timeframe trend, placing stop losses just beyond the liquidity grab and targeting key liquidity levels for profit-taking.
What Is a Turtle Soup Setup in Forex Markets?
A turtle soup setup in forex markets is a failed breakout pattern at a key swing level. Price briefly breaks a recent high or low and sweeps clustered stop-loss orders. It then reverses back inside the prior range. Traders typically position against the initial breakout once the sweep is confirmed.
What Confirms a Liquidity Sweep in ICT Trading?
A liquidity sweep is confirmed by specific wick and close behaviour. Price should extend beyond a marked swing point, then close back inside the prior range. The wick reaches past the level while the candle body stays inside. A close beyond the level without reversal suggests a genuine breakout instead.
Is Turtle Soup a Reversal or Continuation Pattern?
Turtle soup is classified as a reversal pattern, not a continuation pattern. It targets failed breakouts where price moves through a level and then returns inside the prior range. The setup positions against the initial breakout direction rather than with it. Continuation patterns take the direction of the breakout instead.
This article represents the opinion of the Companies operating under the FXOpen brand only. It is not to be construed as an offer, solicitation, or recommendation with respect to products and services provided by the Companies operating under the FXOpen brand, nor is it to be considered financial advice.
You must be logged in to post a comment Login