

Crypto World
ICT Turtle Soup Trading Strategy Explained

The ICT Turtle Soup is a price action strategy built around false breakouts. It targets failed moves at major support and resistance levels across forex and other markets. Turtle Soup trading focuses on liquidity sweeps that trap breakout traders before price reverses. It uses the reversal that often follows a stop run for entry timing.
This article covers the Turtle Soup forex setup along with its core components. Let’s discuss the conditions traders watch for and the entry framework that goes with them.
What Is the ICT Turtle Soup Pattern?
The ICT Turtle Soup is a reversal approach based on failed breakouts at key support and resistance levels. This forex reversal strategy comes from the Inner Circle Trader (ICT) methodology and frames failed moves as setups.
Traders aim to identify and take advantage of situations where the price briefly moves beyond a major support or resistance level, only to reverse direction shortly after. This movement is often seen in ranging markets where prices oscillate between established highs and lows.
The concept behind ICT Turtle Soup trading is rooted in the idea of stop hunts and market imbalances. When the price breaks out, it often triggers stop-loss orders set by other traders, creating a temporary imbalance. A failed breakout occurs when price returns inside the prior range after sweeping a swing level.
The ICT Turtle Soup strategy seeks to capitalise on this by entering trades in the opposite direction once the breakout fails and the price returns to its previous range.
The ICT version adapts the original Turtle Soup setup from Linda Raschke and Larry Connors. In the ICT strategy, forex traders apply it on intraday charts using liquidity and order flow, not fixed 20-day breakout rules.
Typically, traders look for signs of a false breakout. This often shows as price briefly moving above a recent high or below a recent low. Price then fails to sustain the move.
ICT Turtle Soup vs Breakout Strategies
The Turtle Soup strategy and standard breakout trading sit on opposite sides of the same setup. Breakout traders typically enter when price clears a high or low, expecting momentum to continue. ICT Turtle Soup traders wait for that move to fail, then look to position in the opposite direction.
The choice between Turtle Soup vs a breakout strategy depends on the prevailing market context. Breakouts typically work in trending conditions where buying or selling momentum drives continuation. Turtle soup setups work around range edges where liquidity sits and breakouts often fail.
Core Elements of the ICT Turtle Soup Setup
The ICT Turtle Soup setup uses several elements working together to identify failed breakouts. Each element provides context for where price might sweep liquidity before reversing back inside the prior range.
The core elements traders typically work with include:
- Order flow and market structure across higher and lower timeframes
- Liquidity and stop hunts at swing highs and swing lows
- Internal and external liquidity zones inside the range
- Order blocks and imbalances as supportive context
Each element below shows how price typically reacts during a Turtle Soup trading setup.
Order Flow and Market Structure
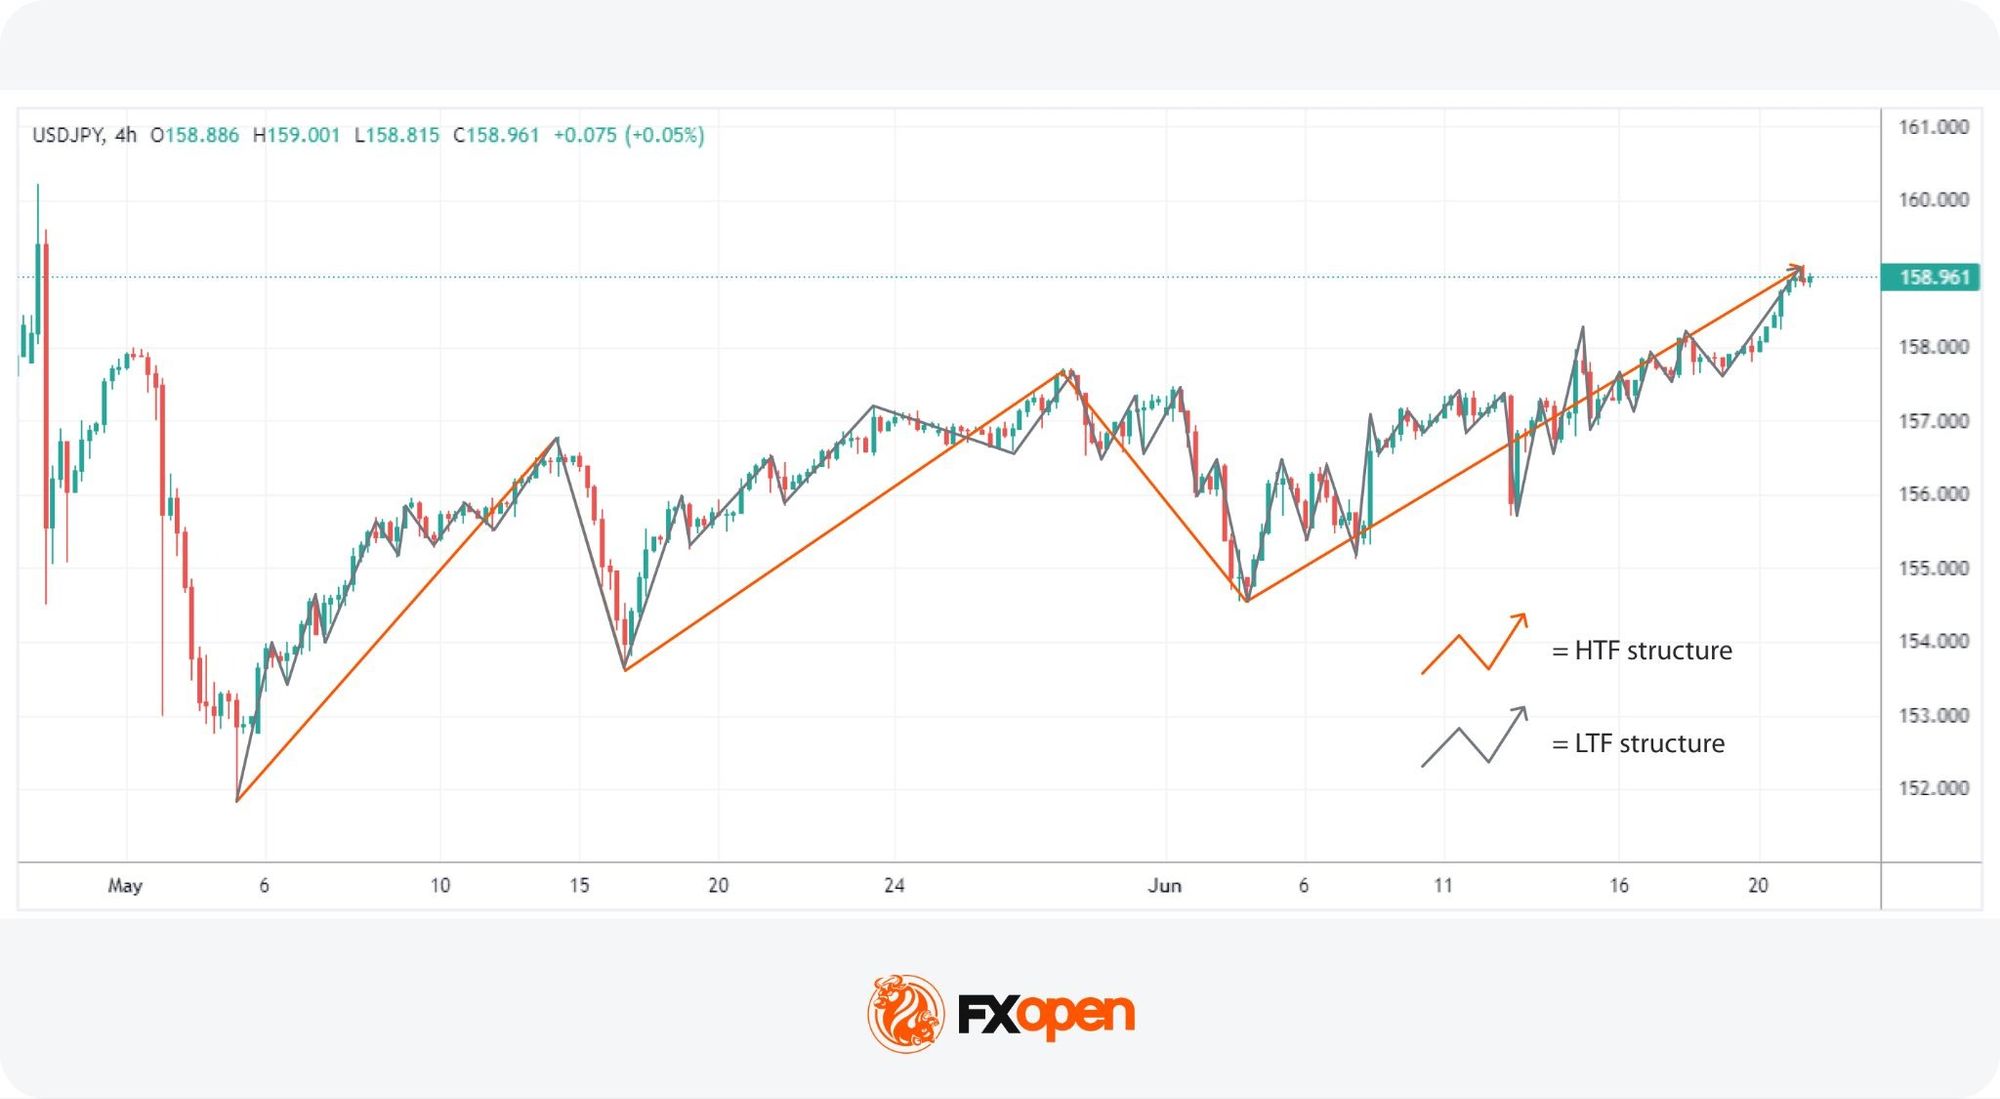
Order flow and market structure are critical in analysing the ICT Turtle Soup pattern. This involves observing price movements and traders’ behaviour in different timeframes.
Order flow refers to the sequence of buying and selling activity that drives price. Market structure organises that activity into recognisable patterns of highs and lows. Together, they describe the directional bias of a market.
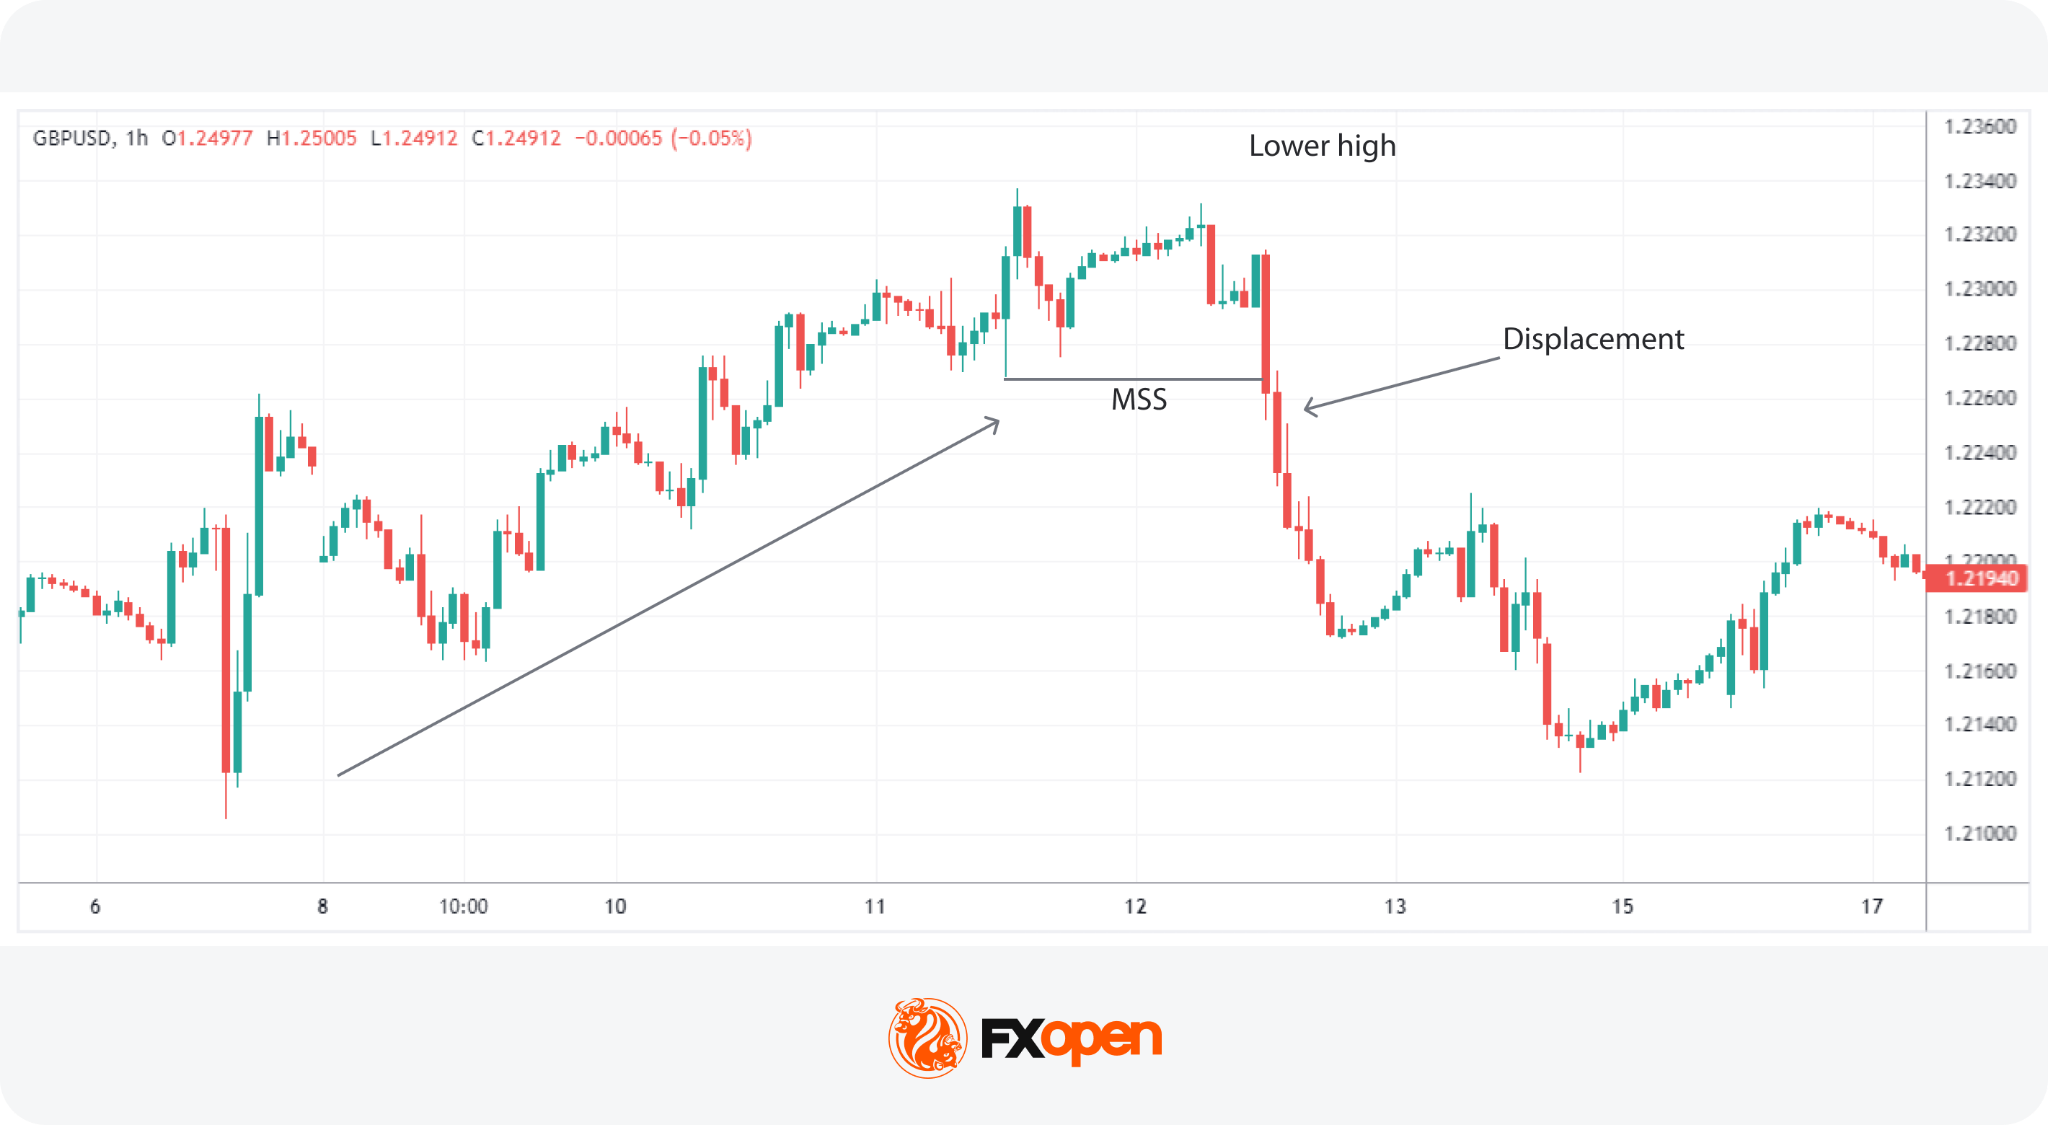
Traders also track a Market Structure Shift (MSS), which signals a potential change in trend direction. An MSS appears when price breaks an opposing swing point with displacement. Displacement here means a strong, single-direction candle that closes well beyond the broken level.
If you want to analyse higher and lower timeframe price movements, consider using FXOpen’s TickTrader platform.
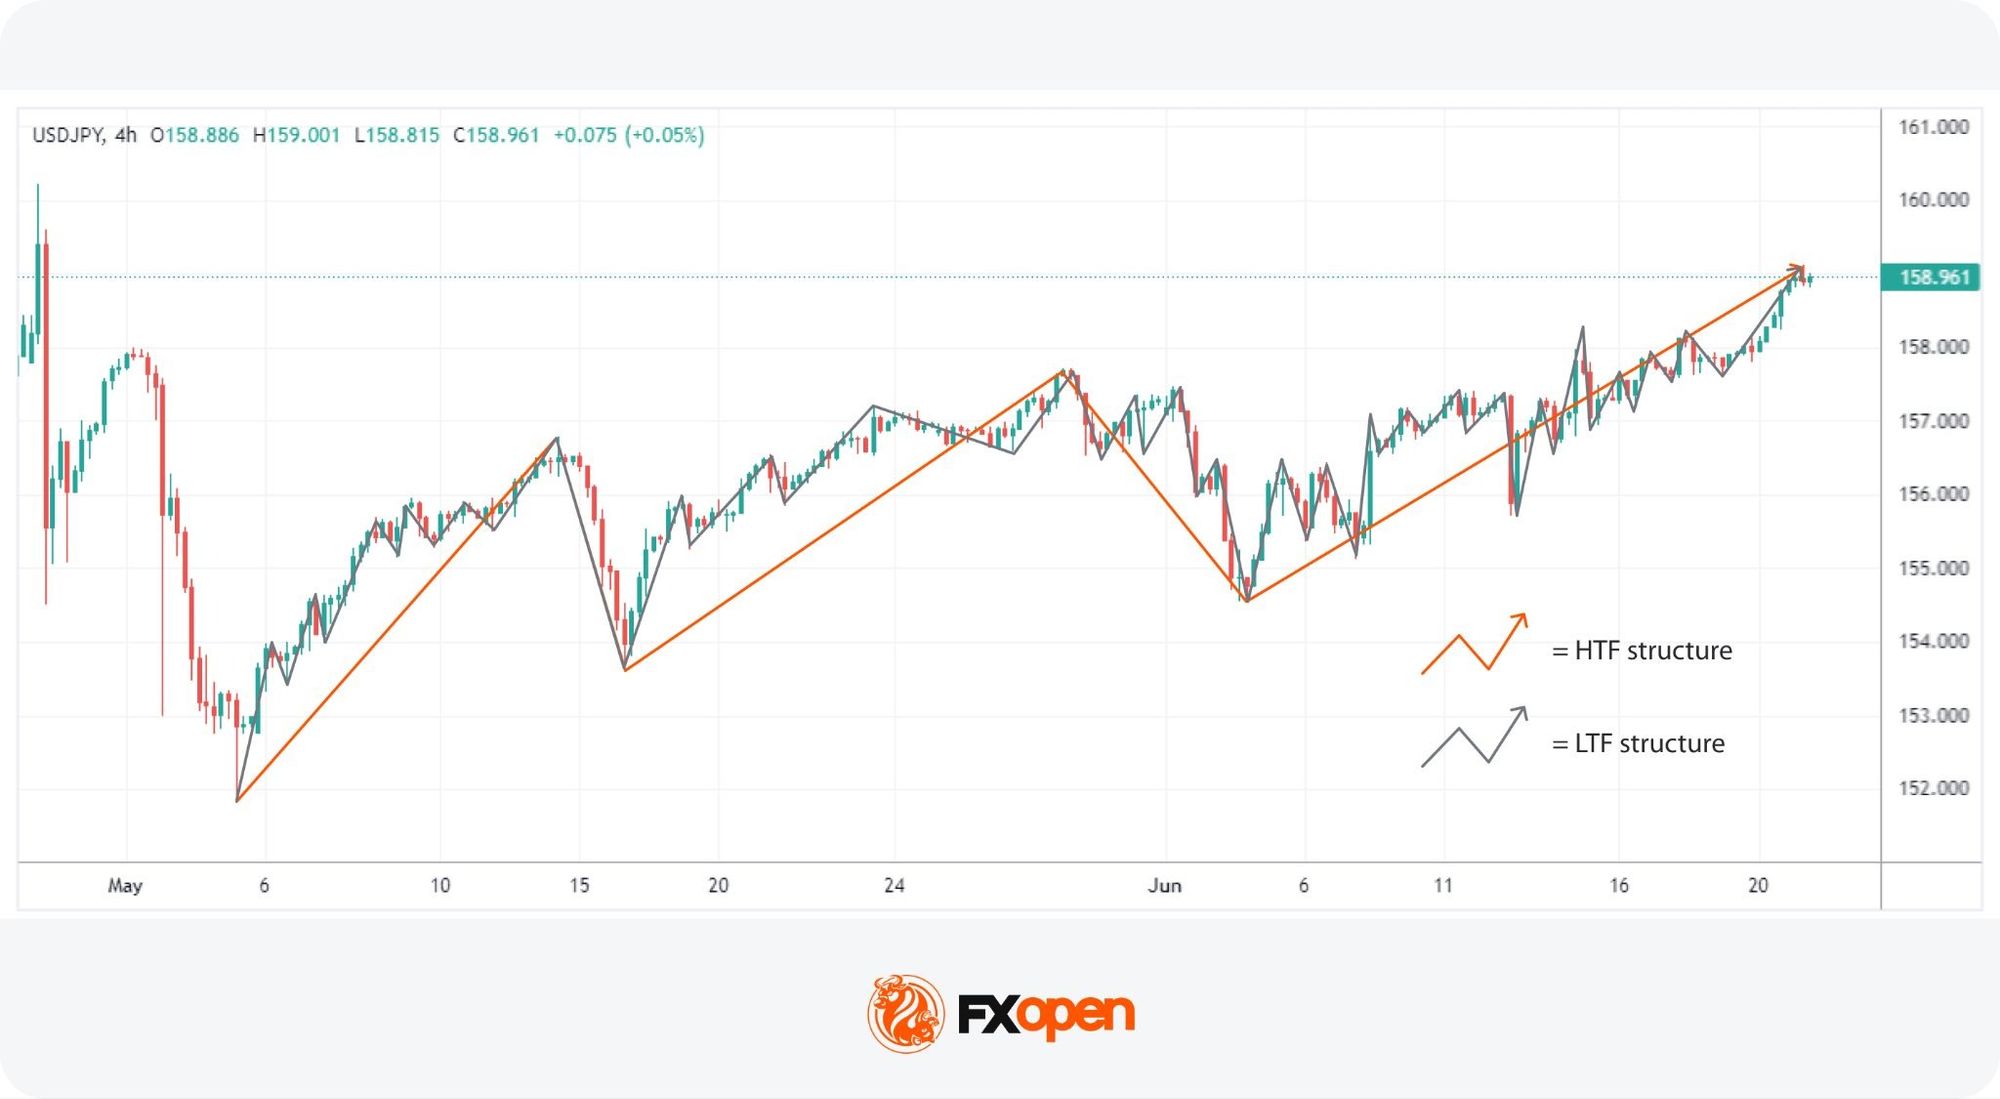
Higher Timeframe Structure
This refers to the broader trend governing the lower timeframe trend. For traders using the 15m-1h charts to trade, this might mean structure visible on 4h or 1d charts.
Higher timeframe structures may help traders identify the major support and resistance levels. These levels are important as they mark the boundaries within which the market generally oscillates. Traders use these to determine the prevailing market direction and potential areas where false breakouts (stop hunts) are likely to occur.
This higher timeframe view sets the directional bias for the Turtle Soup setup. A market making higher highs and higher lows suggests a bullish bias, where traders typically look for long-side setups after liquidity sweeps below swing lows. The reverse applies in a bearish structure of lower highs and lower lows.
Lower Timeframe Structure
Lower timeframe structures are examined on hourly or minute charts. These provide a more detailed view of price action within the higher timeframe’s range. They also account for the bullish and bearish legs that dictate a broader higher timeframe trend.
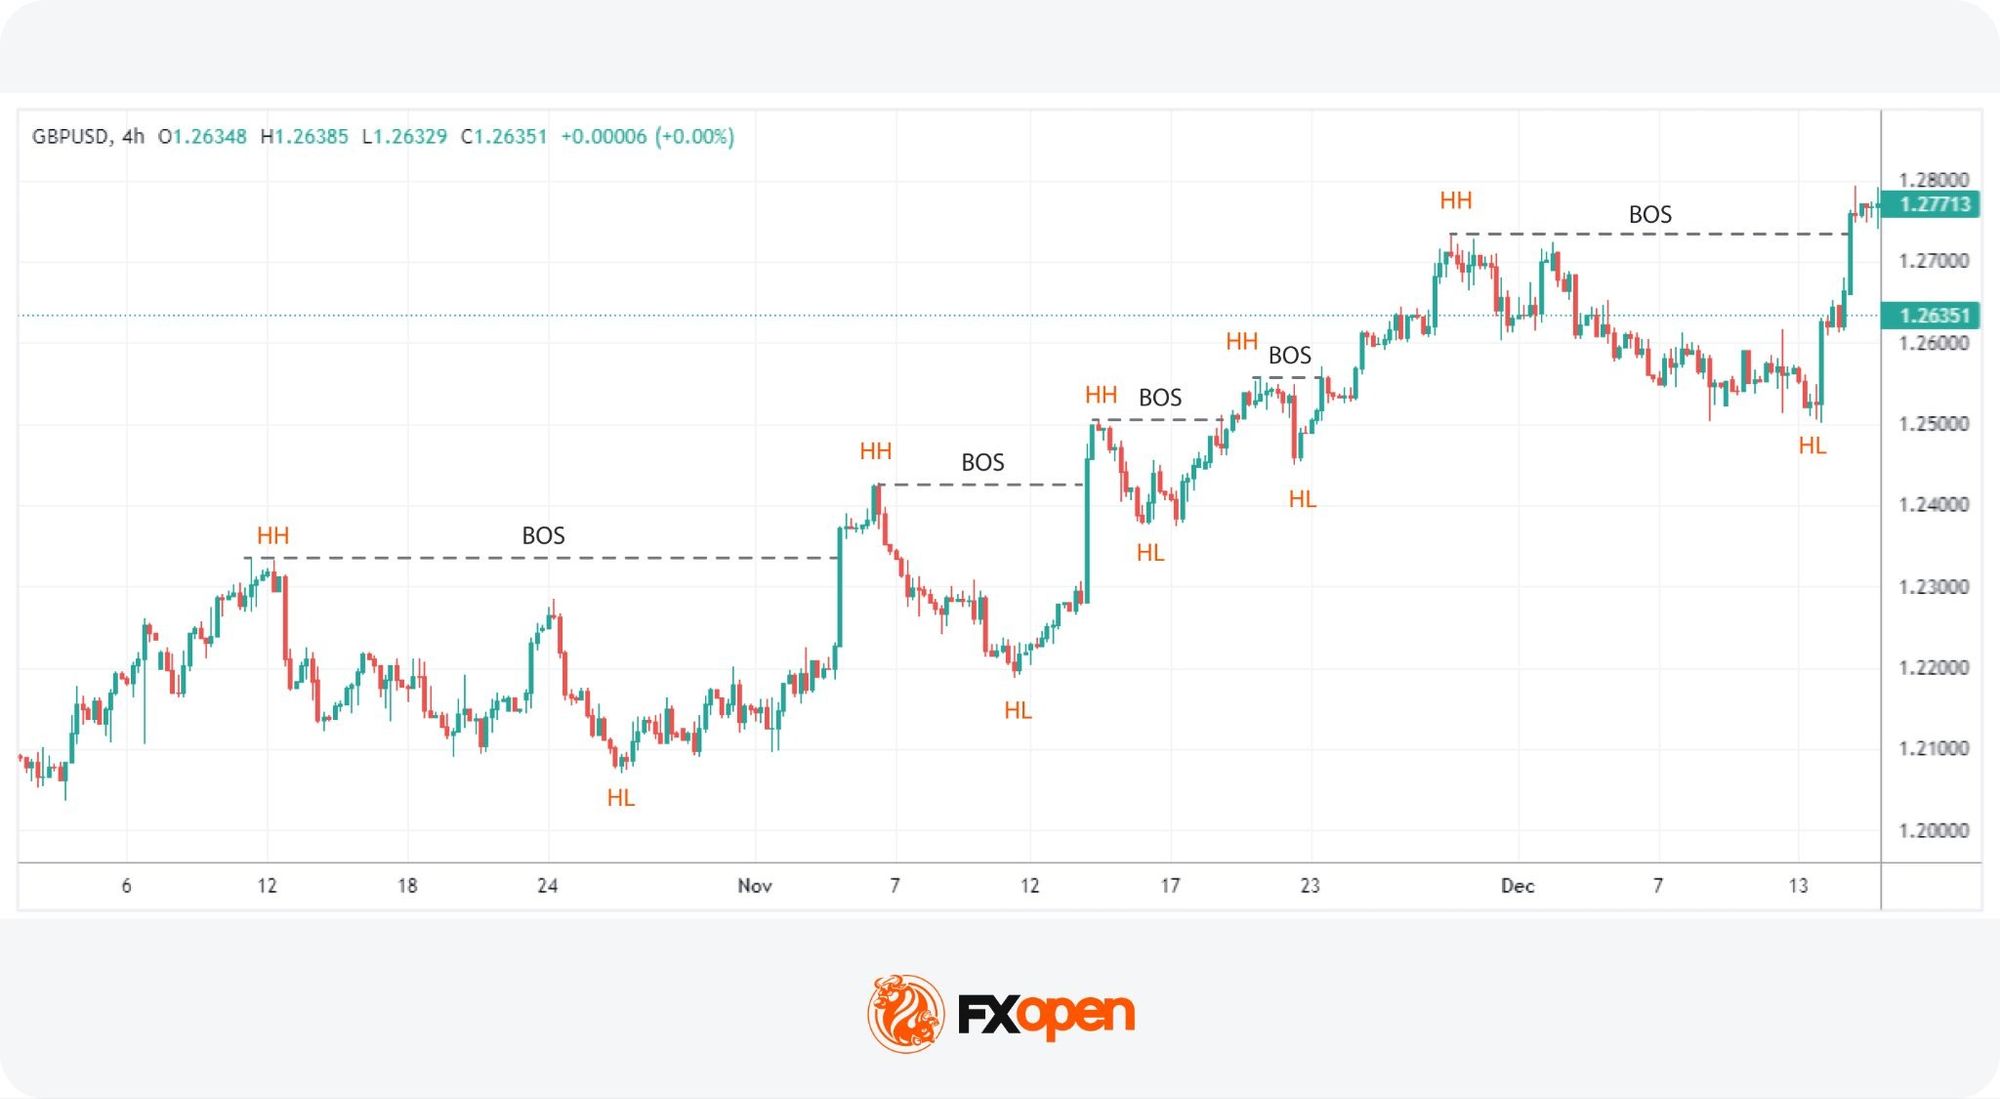
On these charts, traders watch for a Break of Structure (BOS) that aligns with the higher timeframe bias. A BOS occurs when price breaks a recent swing high or low in the trend’s direction. Displacement supports the move when a strong candle closes well beyond that swing point with limited pullback.
Together, these signals confirm the lower timeframe is aligning with the Turtle Soup setup bias.
Liquidity and Stop Hunts
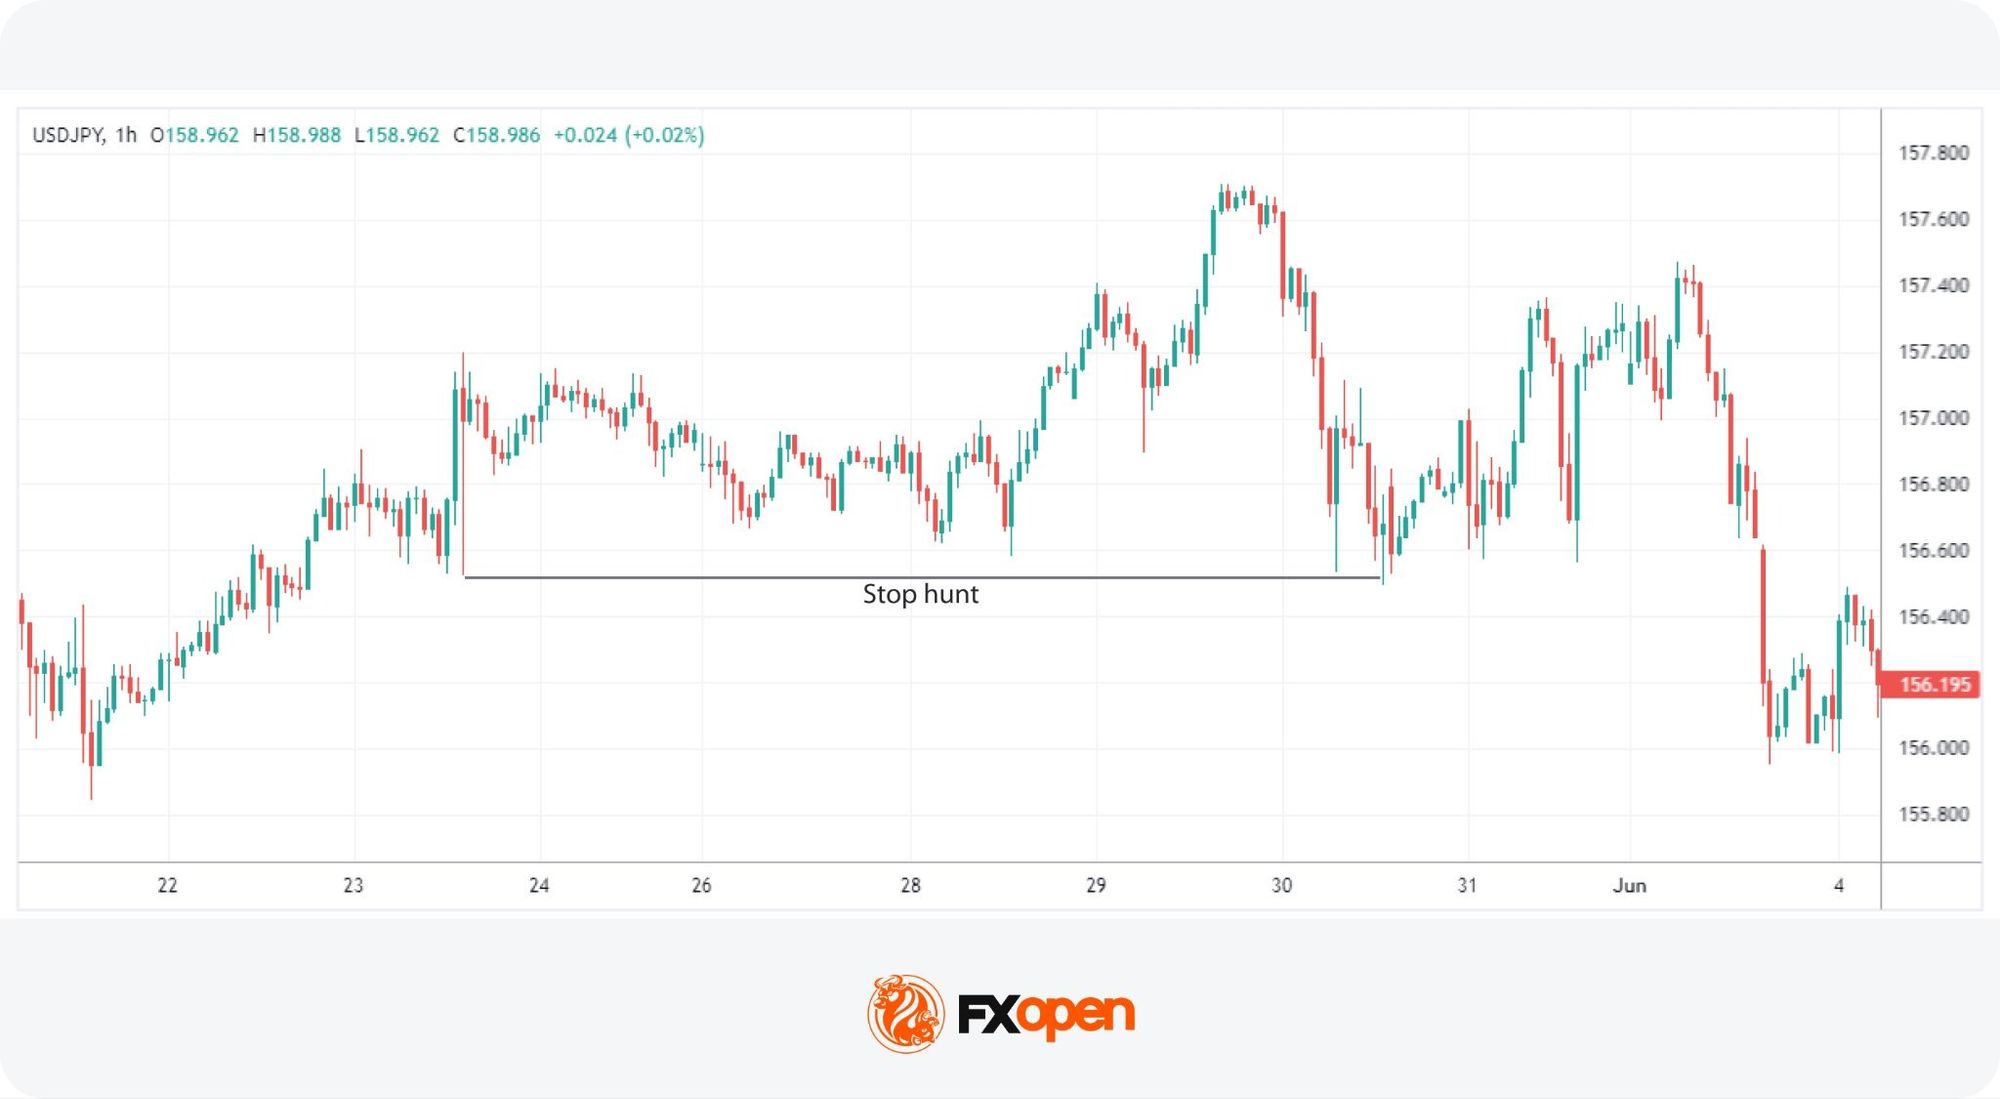
In general trading terms, liquidity represents how easy it is to enter or exit a market. However, in the context of the ICT Turtle Soup pattern, areas of liquidity can be identified beyond key swing points.
These pools of stop-loss orders sit just above swing highs and just below swing lows. These orders are ready to be triggered if price reaches the level.
Stop hunts in trading, also known as a liquidity sweep or stop run, are central to Turtle Soup setups. They occur when price moves through a resistance or support level, triggering clustered stop-loss orders that sit beyond. Triggered stops create a liquidity spike that allows price to reverse back into the range. Traders applying the ICT Turtle Soup strategy typically position against the initial breakout direction once that liquidity has been swept.
Internal and External Liquidity
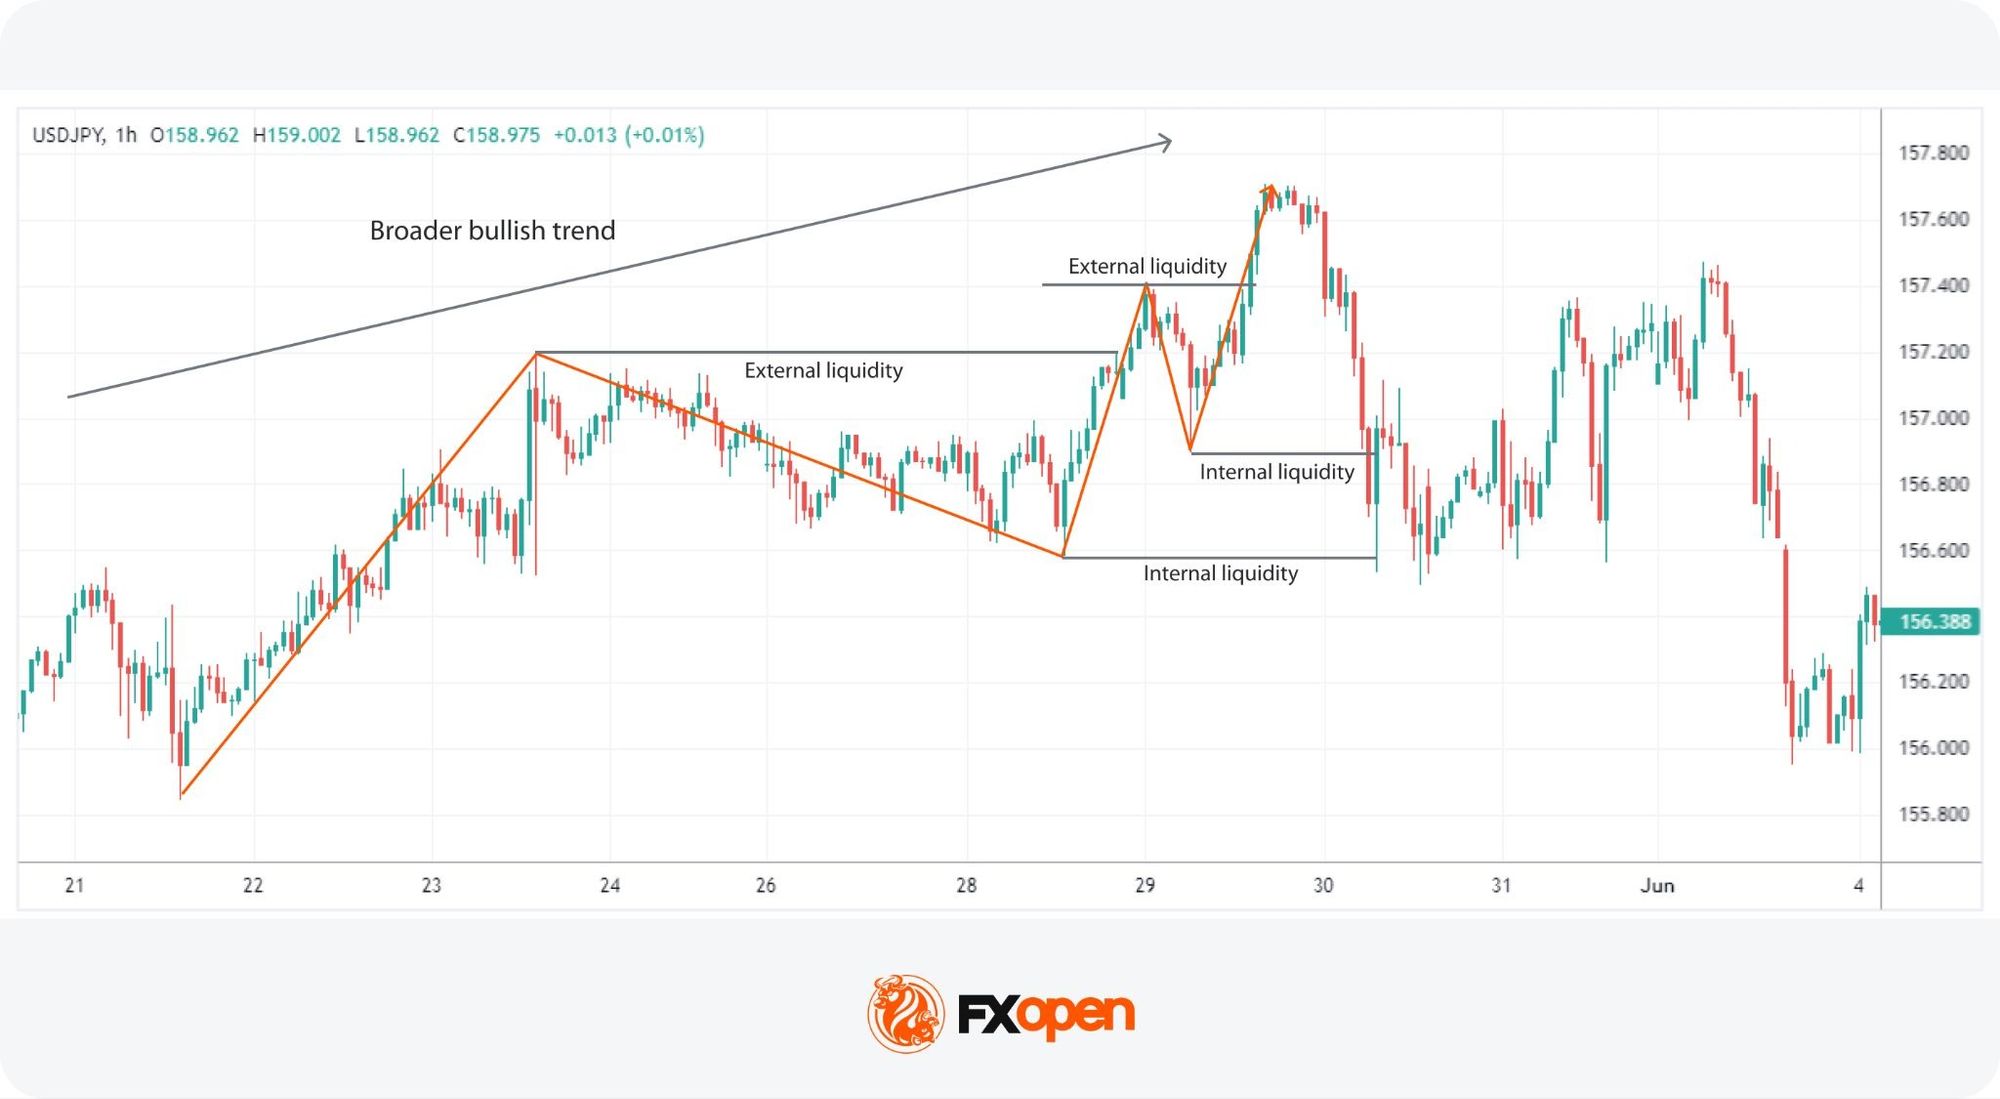
Internal and external liquidity sit on opposite sides of the higher timeframe range. Identifying both is central to Turtle Soup forex setups, since each plays a different role.
Internal liquidity refers to the liquidity available within the range of the higher timeframe structure. It involves identifying smaller support and resistance levels within the larger range. In a bullish leg, internal liquidity rests beneath each higher low. In a bearish leg, it sits above each lower high. This internal liquidity is often swept to start a counter-move within the broader trend.
External liquidity involves liquidity that exists outside the major highs and lows of the higher timeframe trend. The swing low where a bullish leg started is one external liquidity zone. The swing high where a bearish retracement began is another external liquidity zone.
Quick reference:
- Internal liquidity: inside the higher timeframe range, beneath higher lows (bullish) or above lower highs (bearish).
- External liquidity: outside the higher timeframe range, at the extremes that defined the leg.
Context Tools: Order Blocks and Imbalances
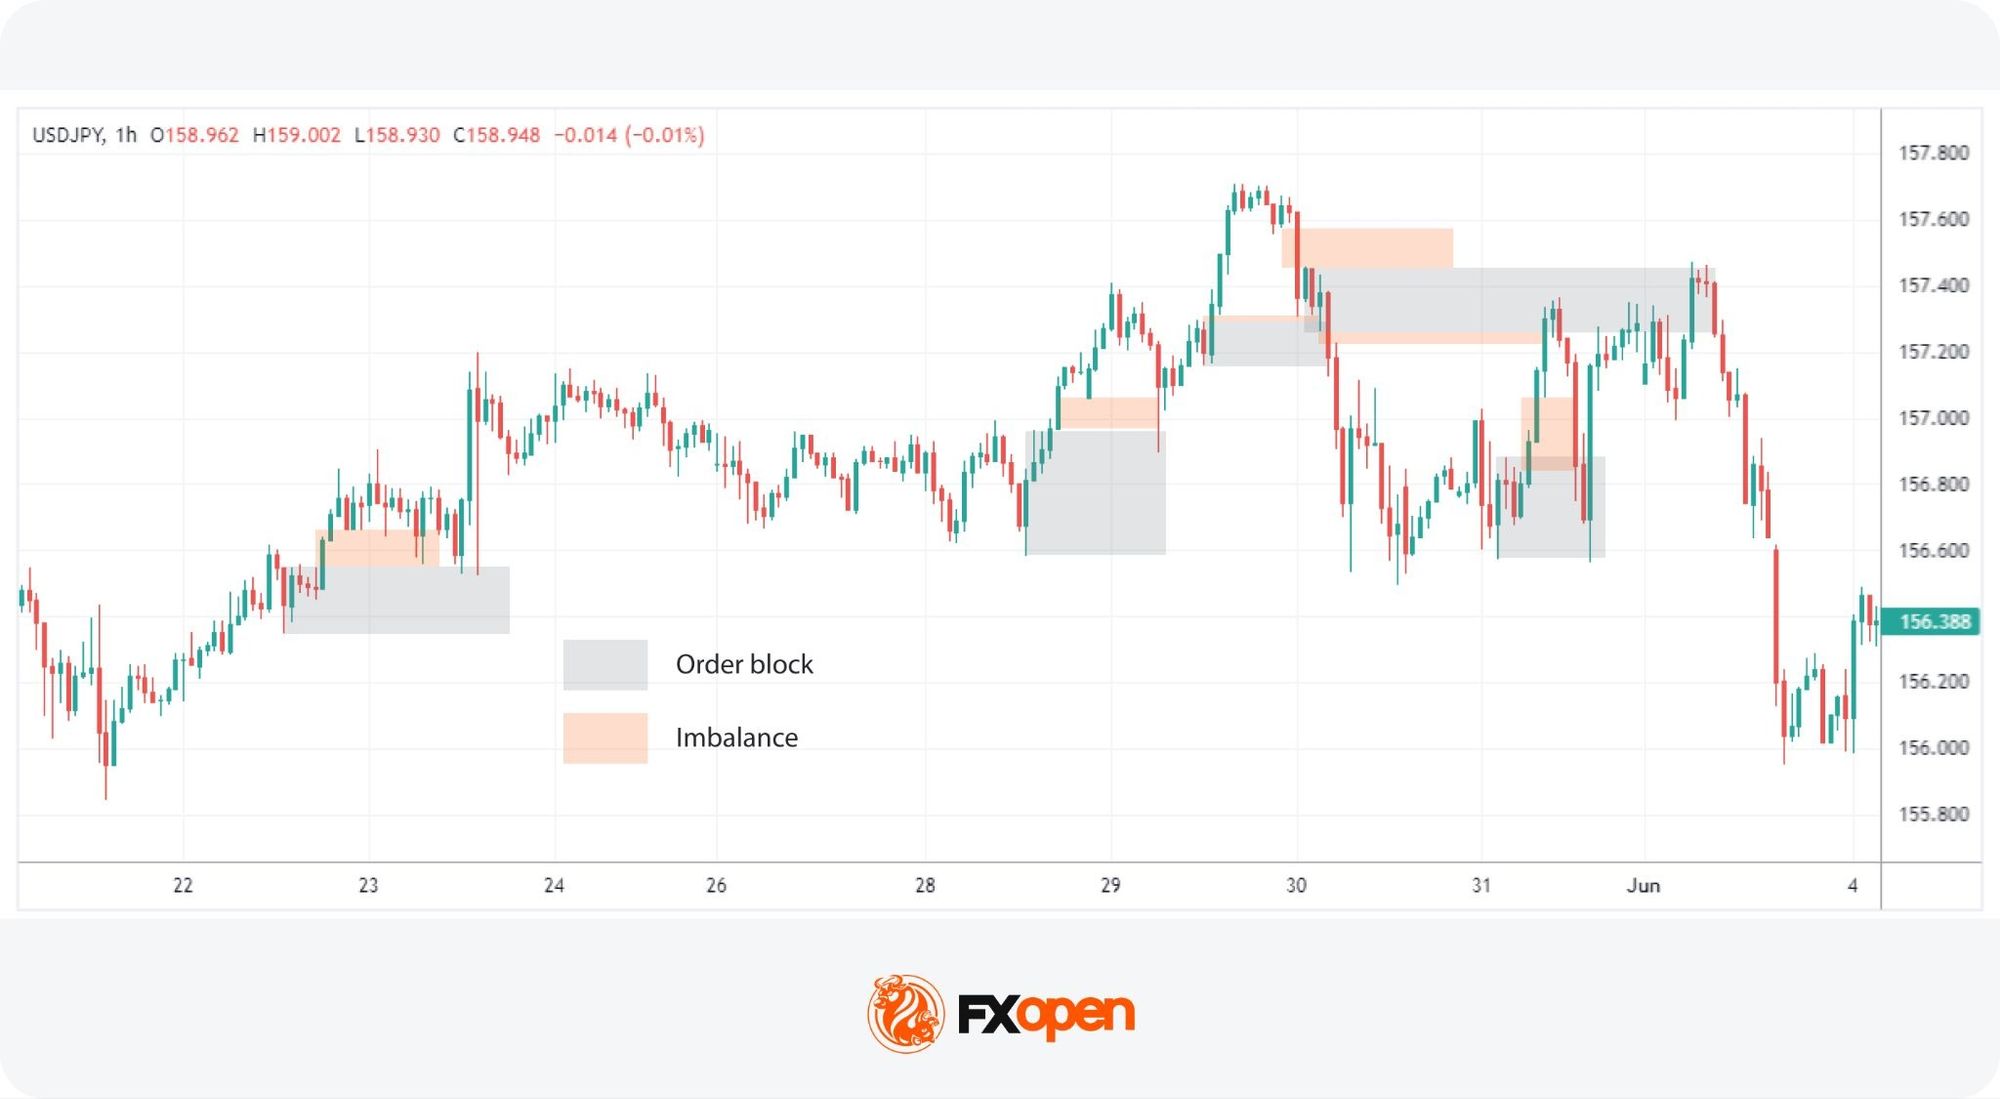
While not directly involved in the ICT Turtle Soup setup, order blocks and imbalances act as supportive context rather than required components. Understanding them can provide insight into where the price might head and the general market context.
Order blocks are areas where significant buying or selling activity has previously occurred, often due to institutional orders. These blocks represent zones of support and resistance where the price is likely to react.
- Bullish order blocks form at the base of upward moves and often act as support on a revisit.
- Bearish order blocks form at the top of downward moves and often act as resistance.
Imbalances, or more precisely fair value gaps (FVGs), are price regions where the market has moved too quickly. When price rapidly moves in one direction, it leaves behind an area with little trading activity. The market often returns to fill these gaps before continuing.
ICT Turtle Soup Setup Conditions
The ICT Turtle Soup setup forms when several conditions appear together on the chart. Each condition narrows the context until a failed breakout becomes the likely outcome.
The conditions for this liquidity grab trading strategy traders typically look for include:
- A defined higher timeframe bias
- Marked internal liquidity inside that bias
- A liquidity sweep that fails to hold
- Lower timeframe confirmation aligned with the higher timeframe direction
Establishing a Bias
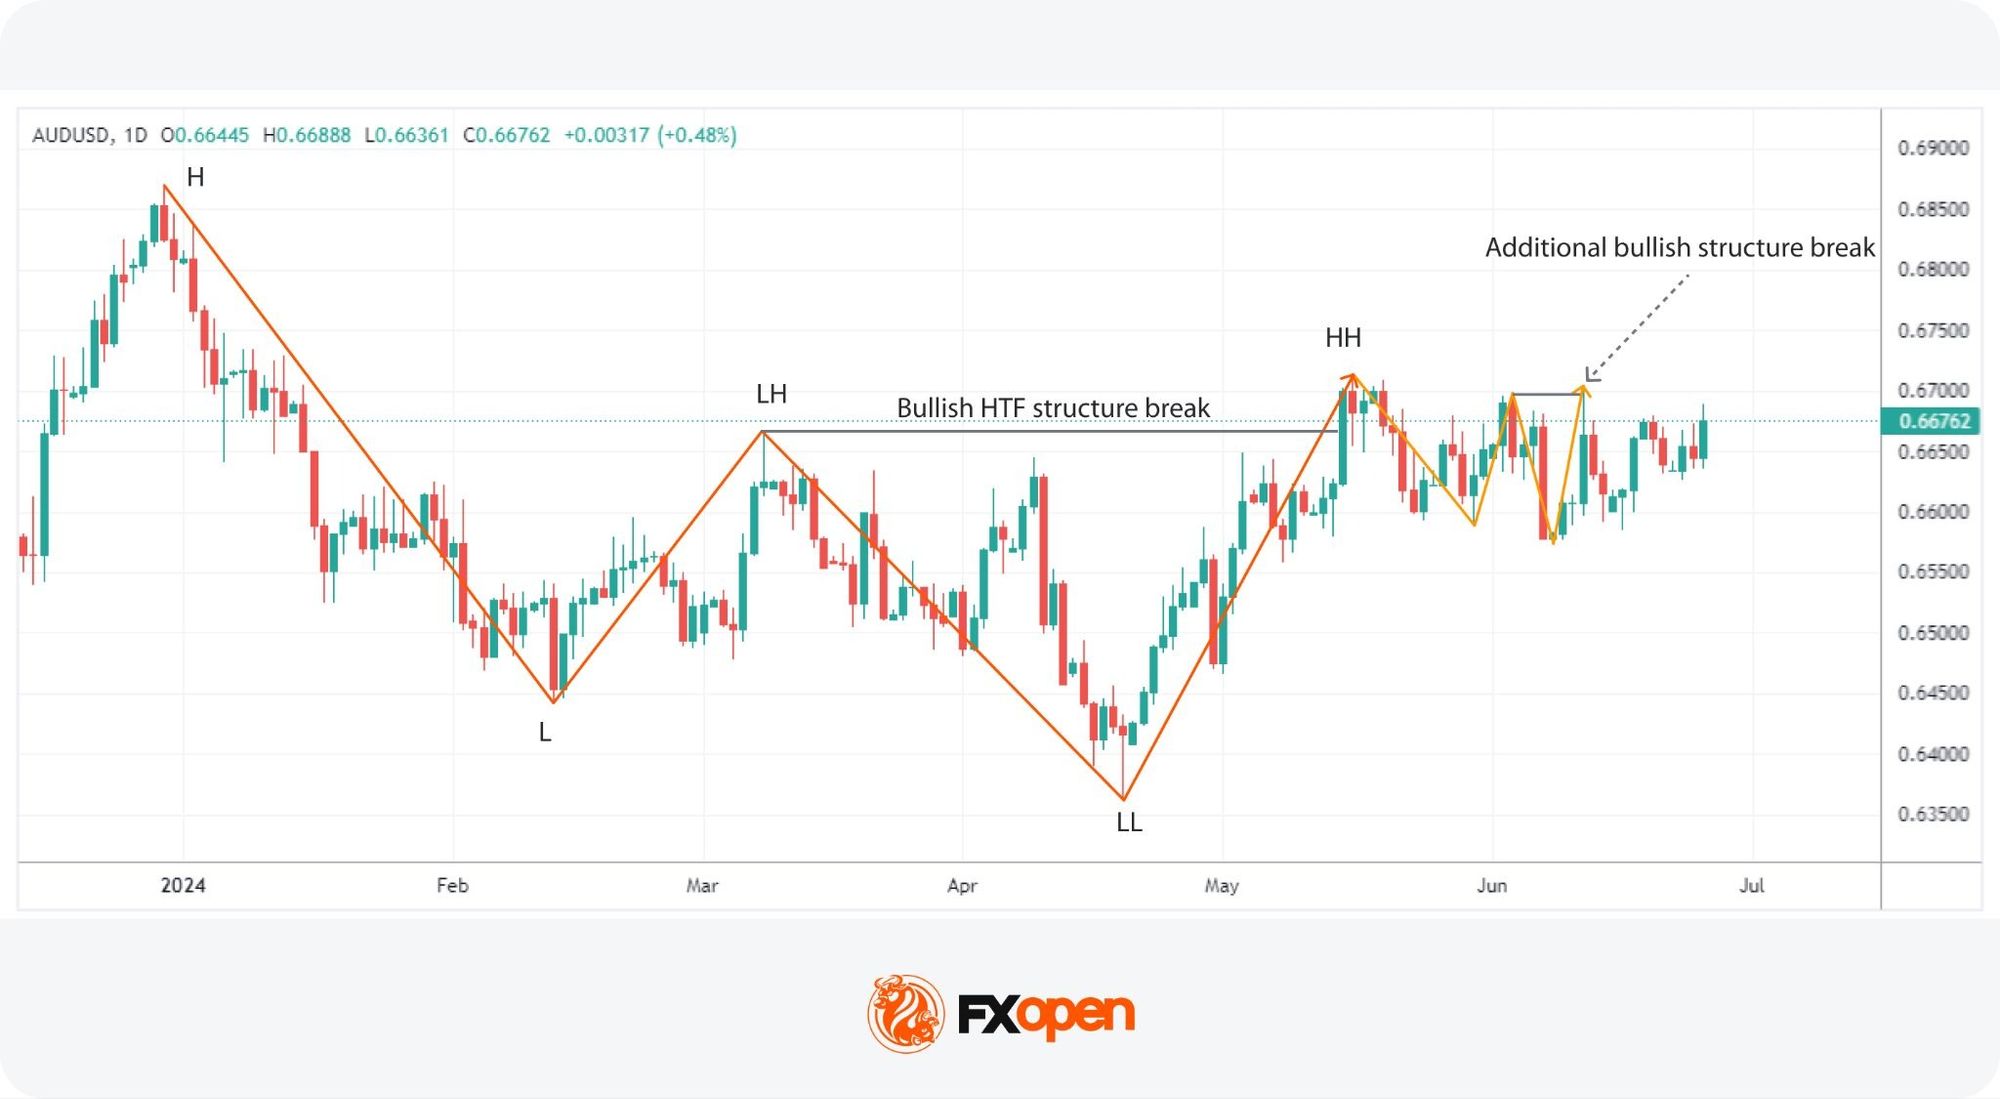
Traders begin by analysing the higher timeframe trend, such as the 4h daily charts, to establish a market bias. This analysis may help determine whether the market is predominantly bullish or bearish.
Measurable criteria for the bias typically include:
- A break of structure in one direction on the higher timeframe
- A series of higher highs and higher lows for a bullish bias
- A series of lower highs and lower lows for a bearish bias
- Price respecting key swing points without violating them in the opposite direction
Once the bias is set, traders only look for setups that align with that direction.
Identifying Internal Liquidity
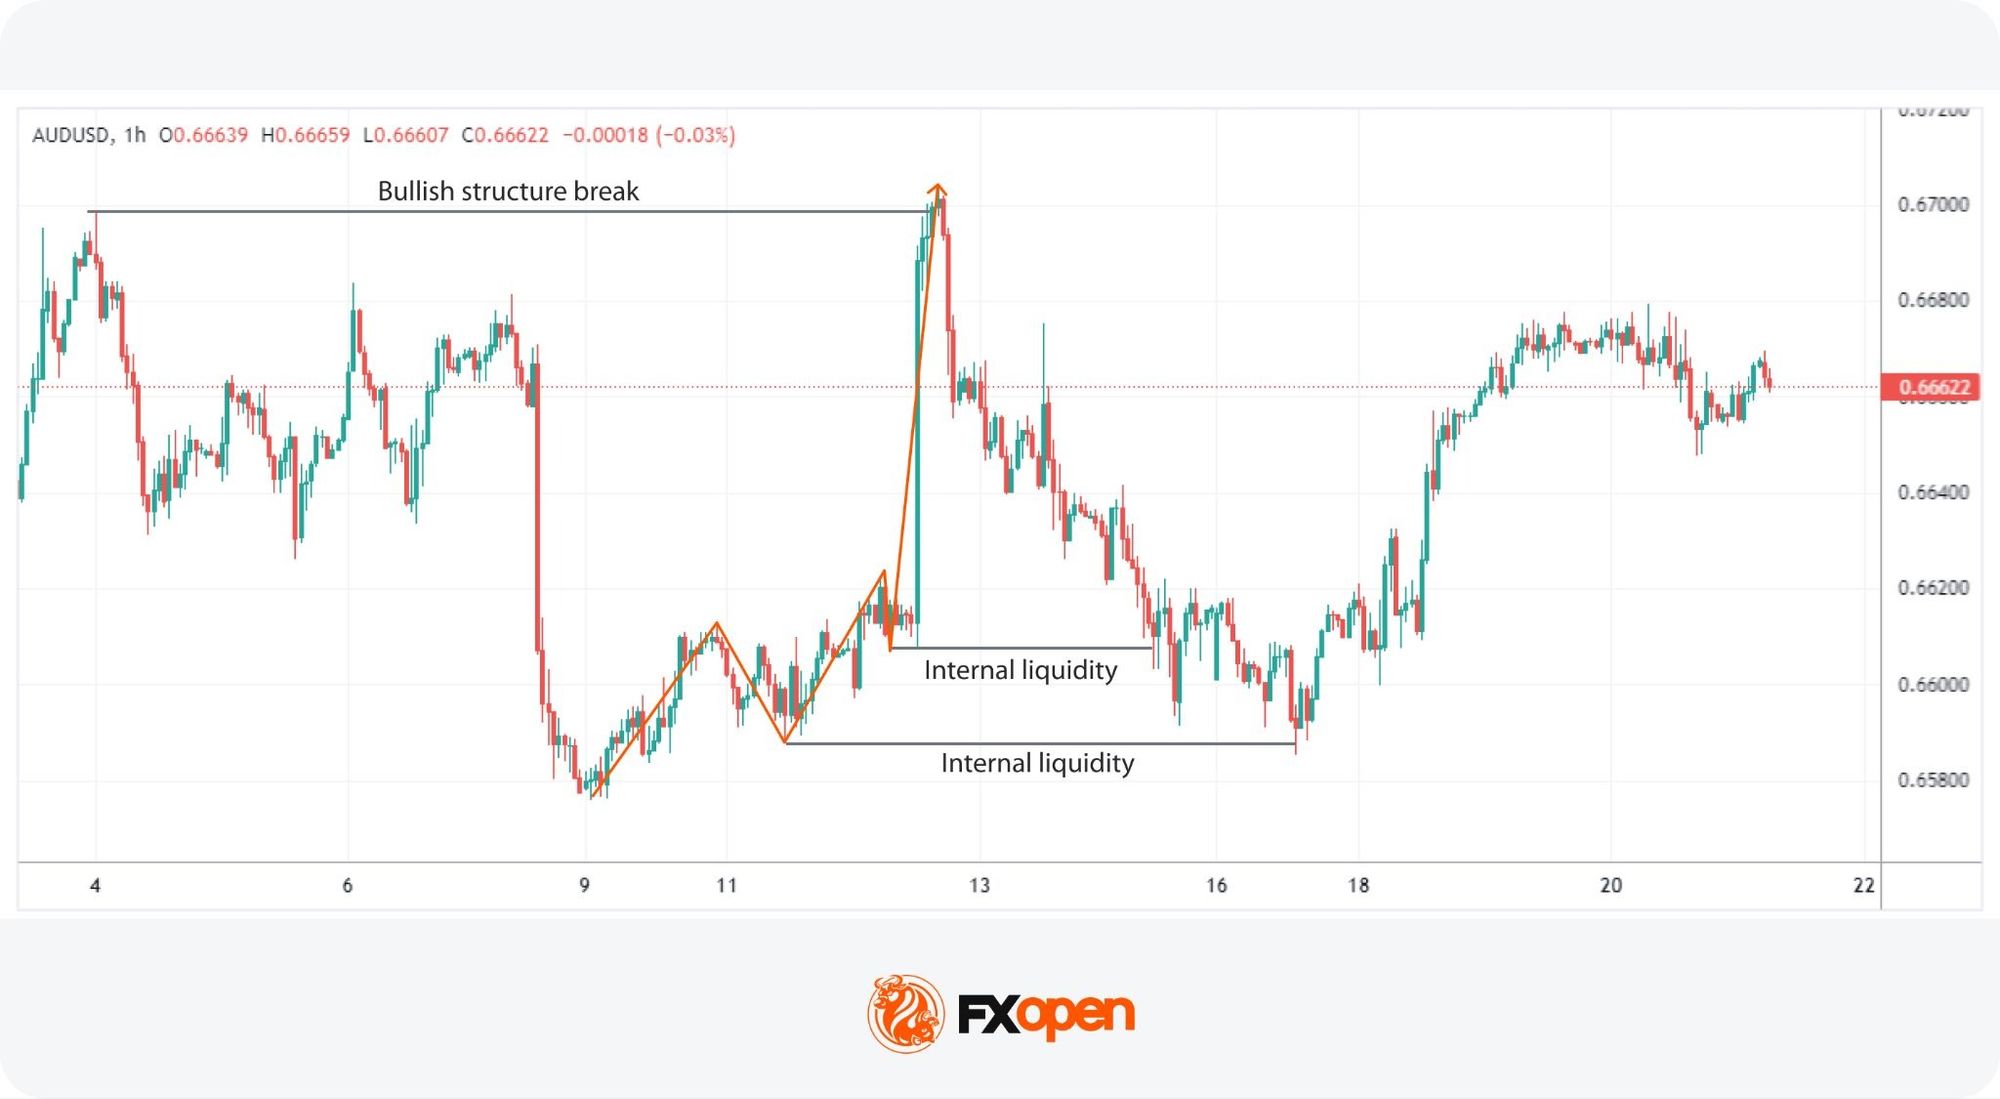
Once the higher timeframe trend is established, traders mark levels of internal liquidity inside the broader leg.
Internal liquidity typically rests in these locations:
- Below recent swing lows in a bullish leg
- Above recent swing highs in a bearish leg
- Beneath equal lows or above equal highs, where stop clusters build
- At round-number levels that attract retail stop placement
These zones are likely to attract stop-loss orders, making them probable targets for a liquidity sweep before the higher timeframe trend resumes.
Liquidity Sweep Trading Condition
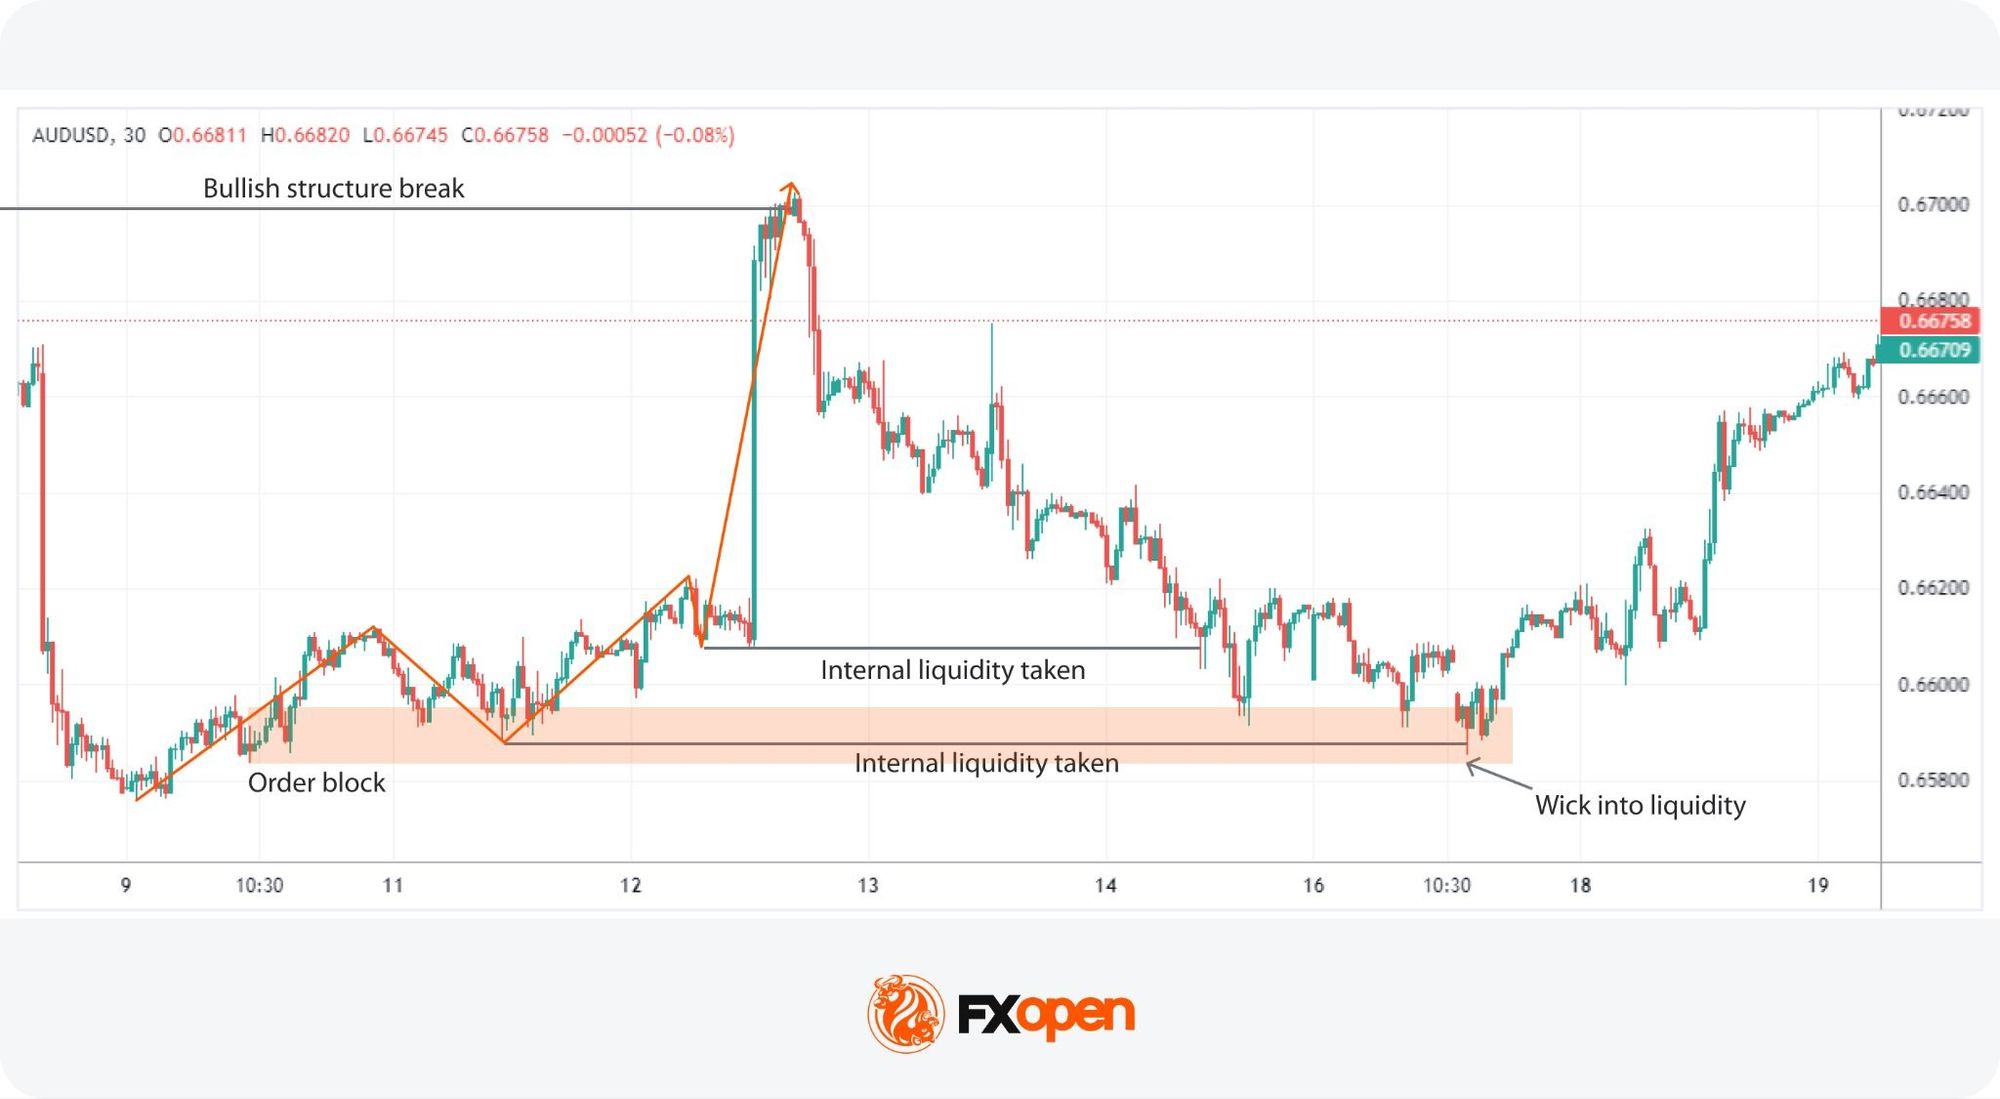
The condition is met when price briefly breaks through a marked internal liquidity level, then reverses back inside the range. This typically happens when stop-loss orders are triggered before price quickly returns.
Confirmation comes from wick and close behaviour. Price should sweep the level with a wick that extends beyond it, then close back inside the prior range on the same candle. A small wick relative to the candle body suggests the sweep absorbed liquidity efficiently.
The setup fails when price closes beyond the swept level instead of reversing. A close outside the range, especially with continuation in the next candle, signals a genuine breakout rather than a Turtle Soup condition.
Lower Timeframe Confirmation
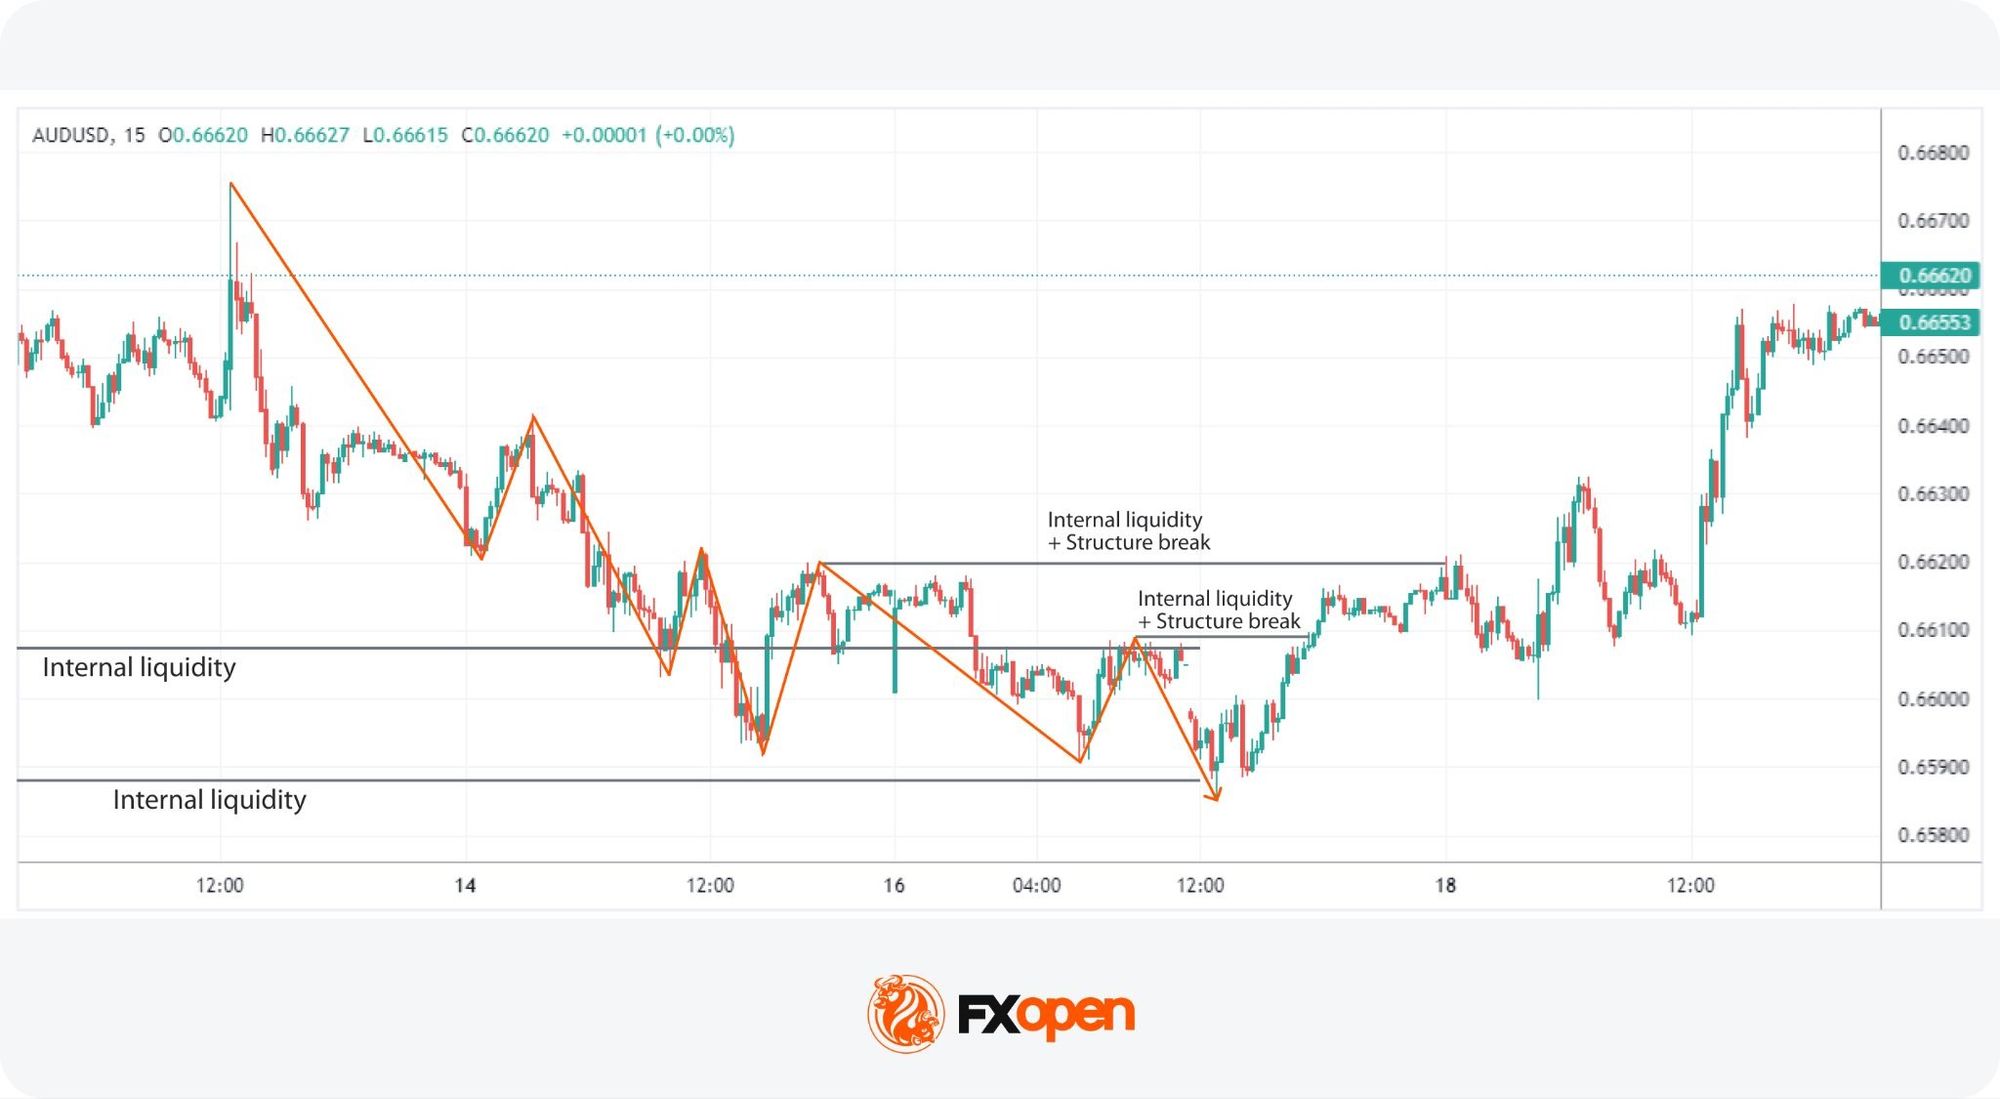
After identifying a liquidity grab beyond this internal liquidity level, traders look for an entry on a lower timeframe. They watch for a Market Structure Shift (MSS) in the direction of the higher timeframe bias. Displacement supports the shift when a strong candle closes well beyond the lower timeframe swing point.
Price often retraces back into the range to fill an imbalance before continuing. This retracement frequently meets an order block left behind by the displacement candle. The combination of MSS, displacement, and an order block retest typically gives a precise entry zone aligned with the higher timeframe direction.
Entry, Stop Loss, and Targets
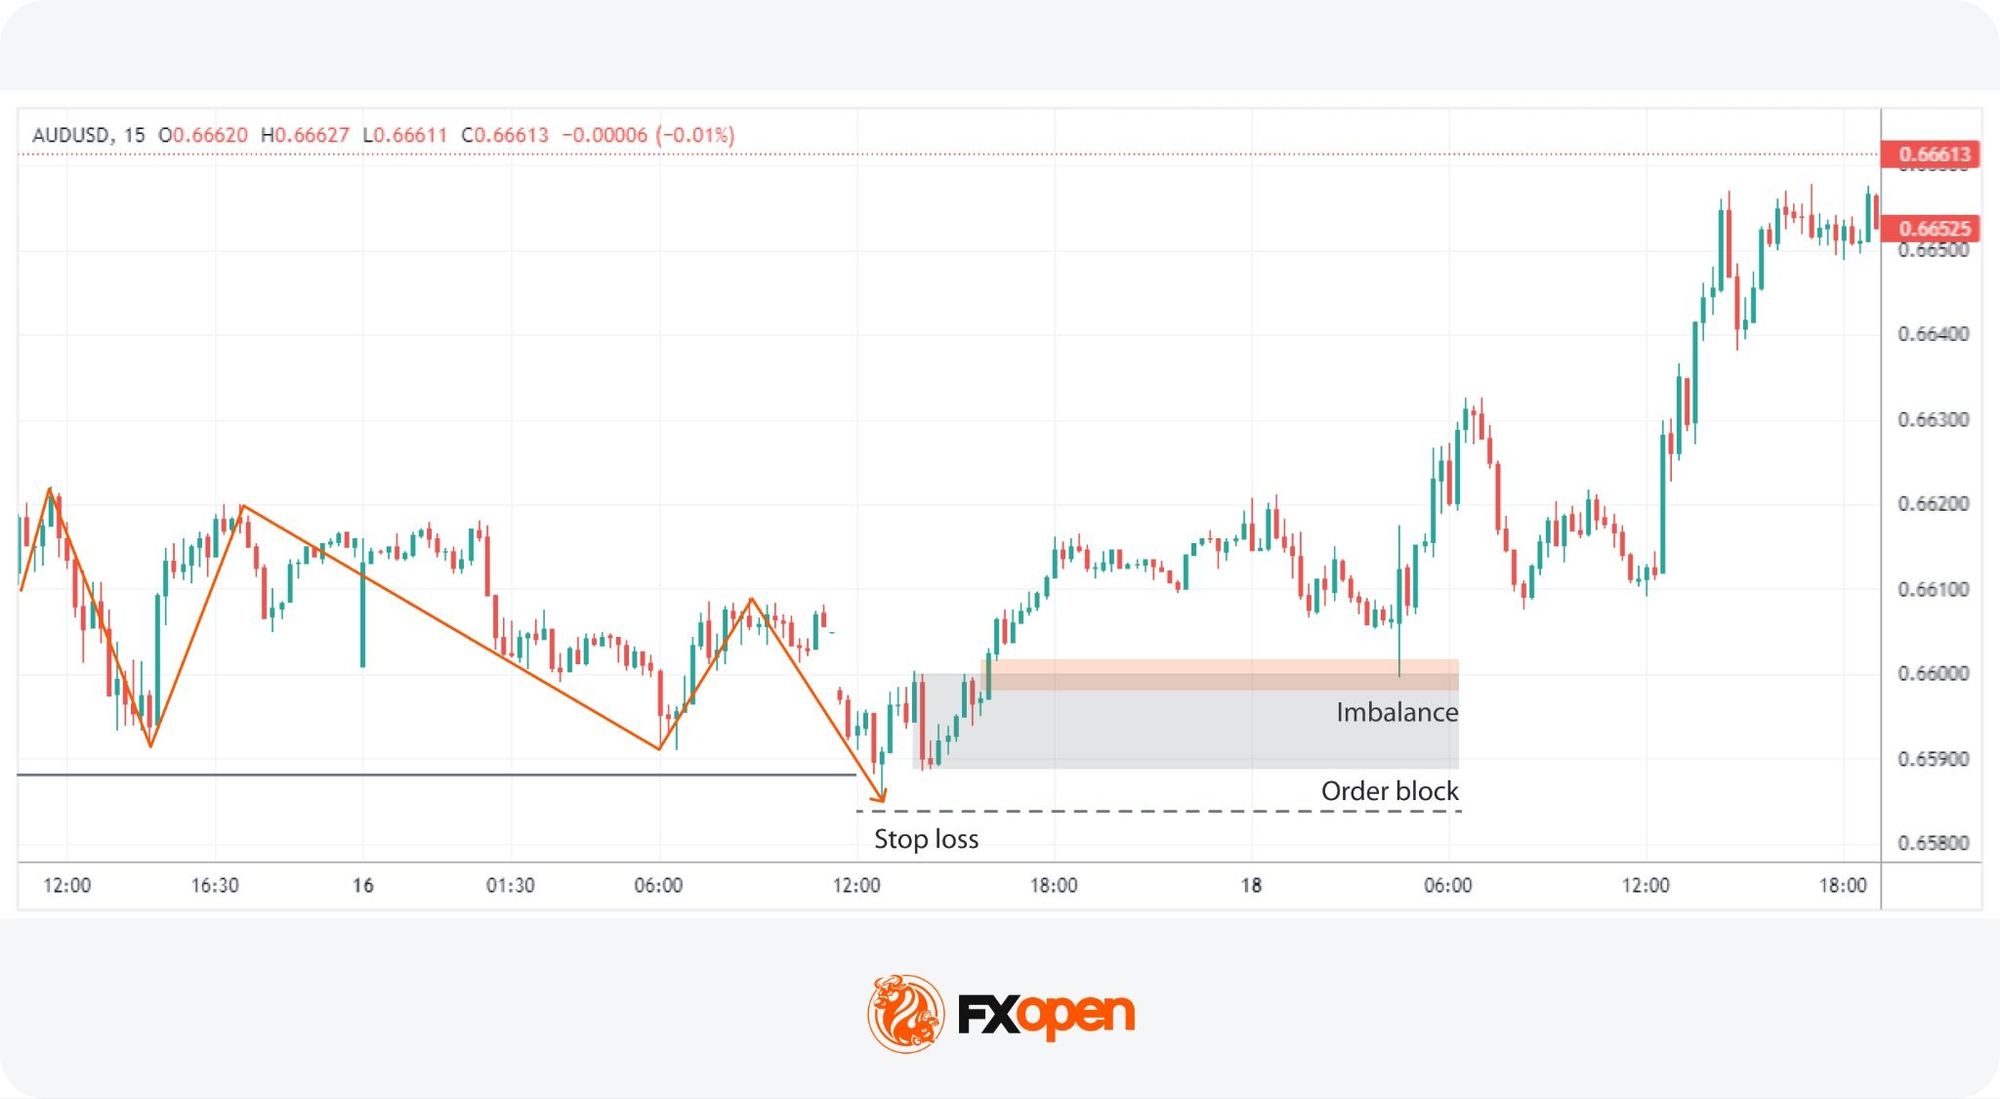
Once the conditions described above appear together, traders typically position in the direction of the higher timeframe bias. The setup gives a clear framework for entry, stop loss, and target placement.
- Entry zone: A limit order at the order block left behind by the displacement candle, in line with the higher timeframe direction.
- Stop loss: Placed just beyond the liquidity sweep wick. Above the recent high for a short trade, below the recent low for a long trade.
- Targets: Set at major liquidity levels such as previous highs or lows, where significant orders are likely to sit.
Position sizing and stop placement should align with the trader’s broader risk management approach. The framework above outlines structure, but potential risk per trade still depends on account-specific factors.
Potential Advantages and Limitations
The ICT Turtle Soup pattern is a trading strategy with several potential benefits and drawbacks.
Advantages
- Defined entry framework: The setup gives a specific entry zone, stop placement, and target structure, which removes ambiguity about where to act.
- Multi-timeframe applicability: The pattern can be applied across different timeframes and market conditions, including ranging and trending markets.
- Structured risk parameters: Stop losses sit just beyond the liquidity sweep, which produces a defined risk distance for each setup.
Limitations
- Steep learning curve: Applying the setup requires familiarity with market structure, liquidity, and order flow, which takes time to build.
- Sensitive to market conditions: Highly volatile or thin markets can produce false signals where sweeps continue rather than reverse.
- Time-intensive: The setup demands monitoring multiple timeframes to identify valid conditions, which limits how many markets a trader can cover at once.
The Bottom Line
The ICT Turtle Soup is a pattern built around failed breakouts and liquidity sweeps at key support and resistance levels. It frames a reversal setup with defined conditions for bias, liquidity sweep behaviour, lower timeframe confirmation, and entry placement.
Like any approach, its outcomes depend on context. The setup tends to work where range edges hold and breakouts fail. It tends to underperform where momentum carries through swept levels. Disciplined execution, careful risk management, and alignment with the broader market context remain the deciding factors.
Traders who want to apply the framework on live markets may open a forex trading account with FXOpen and trade with tight spreads from 0.0 pips and low commissions from $1.50.
FAQs
What Is ICT Turtle Soup in Trading?
ICT Turtle Soup is a method that exploits false breakouts in trading. It identifies potential reversals when the price briefly moves beyond a major support or resistance level, triggering stop-loss orders before reversing direction. This strategy aims to take advantage of these liquidity grabs by entering trades opposite to the initial breakout direction.
What Are the Conditions for ICT Turtle Soup?
To identify the ICT Turtle Soup pattern, traders analyse higher timeframe trends to establish market bias. They then look for counter-trend moves and mark internal liquidity areas. The pattern is identified when the price taps these liquidity zones and reverses quickly, often leaving a small wick. This signals a liquidity grab and potential trade setup in the direction of the higher timeframe trend.
How May Traders Use the ICT Turtle Soup Pattern?
According to theory, using the ICT Turtle Soup pattern involves several steps. First, traders establish a market bias based on higher timeframe analysis. Then, they look for liquidity grabs at marked internal liquidity areas, indicating false breakouts. The next step is to confirm the setup on a lower timeframe by observing a similar liquidity grab and structure break. Lastly, they are supposed to enter trades in the direction of the higher timeframe trend, placing stop losses just beyond the liquidity grab and targeting key liquidity levels for profit-taking.
What Is a Turtle Soup Setup in Forex Markets?
A turtle soup setup in forex markets is a failed breakout pattern at a key swing level. Price briefly breaks a recent high or low and sweeps clustered stop-loss orders. It then reverses back inside the prior range. Traders typically position against the initial breakout once the sweep is confirmed.
What Confirms a Liquidity Sweep in ICT Trading?
A liquidity sweep is confirmed by specific wick and close behaviour. Price should extend beyond a marked swing point, then close back inside the prior range. The wick reaches past the level while the candle body stays inside. A close beyond the level without reversal suggests a genuine breakout instead.
Is Turtle Soup a Reversal or Continuation Pattern?
Turtle soup is classified as a reversal pattern, not a continuation pattern. It targets failed breakouts where price moves through a level and then returns inside the prior range. The setup positions against the initial breakout direction rather than with it. Continuation patterns take the direction of the breakout instead.
This article represents the opinion of the Companies operating under the FXOpen brand only. It is not to be construed as an offer, solicitation, or recommendation with respect to products and services provided by the Companies operating under the FXOpen brand, nor is it to be considered financial advice.

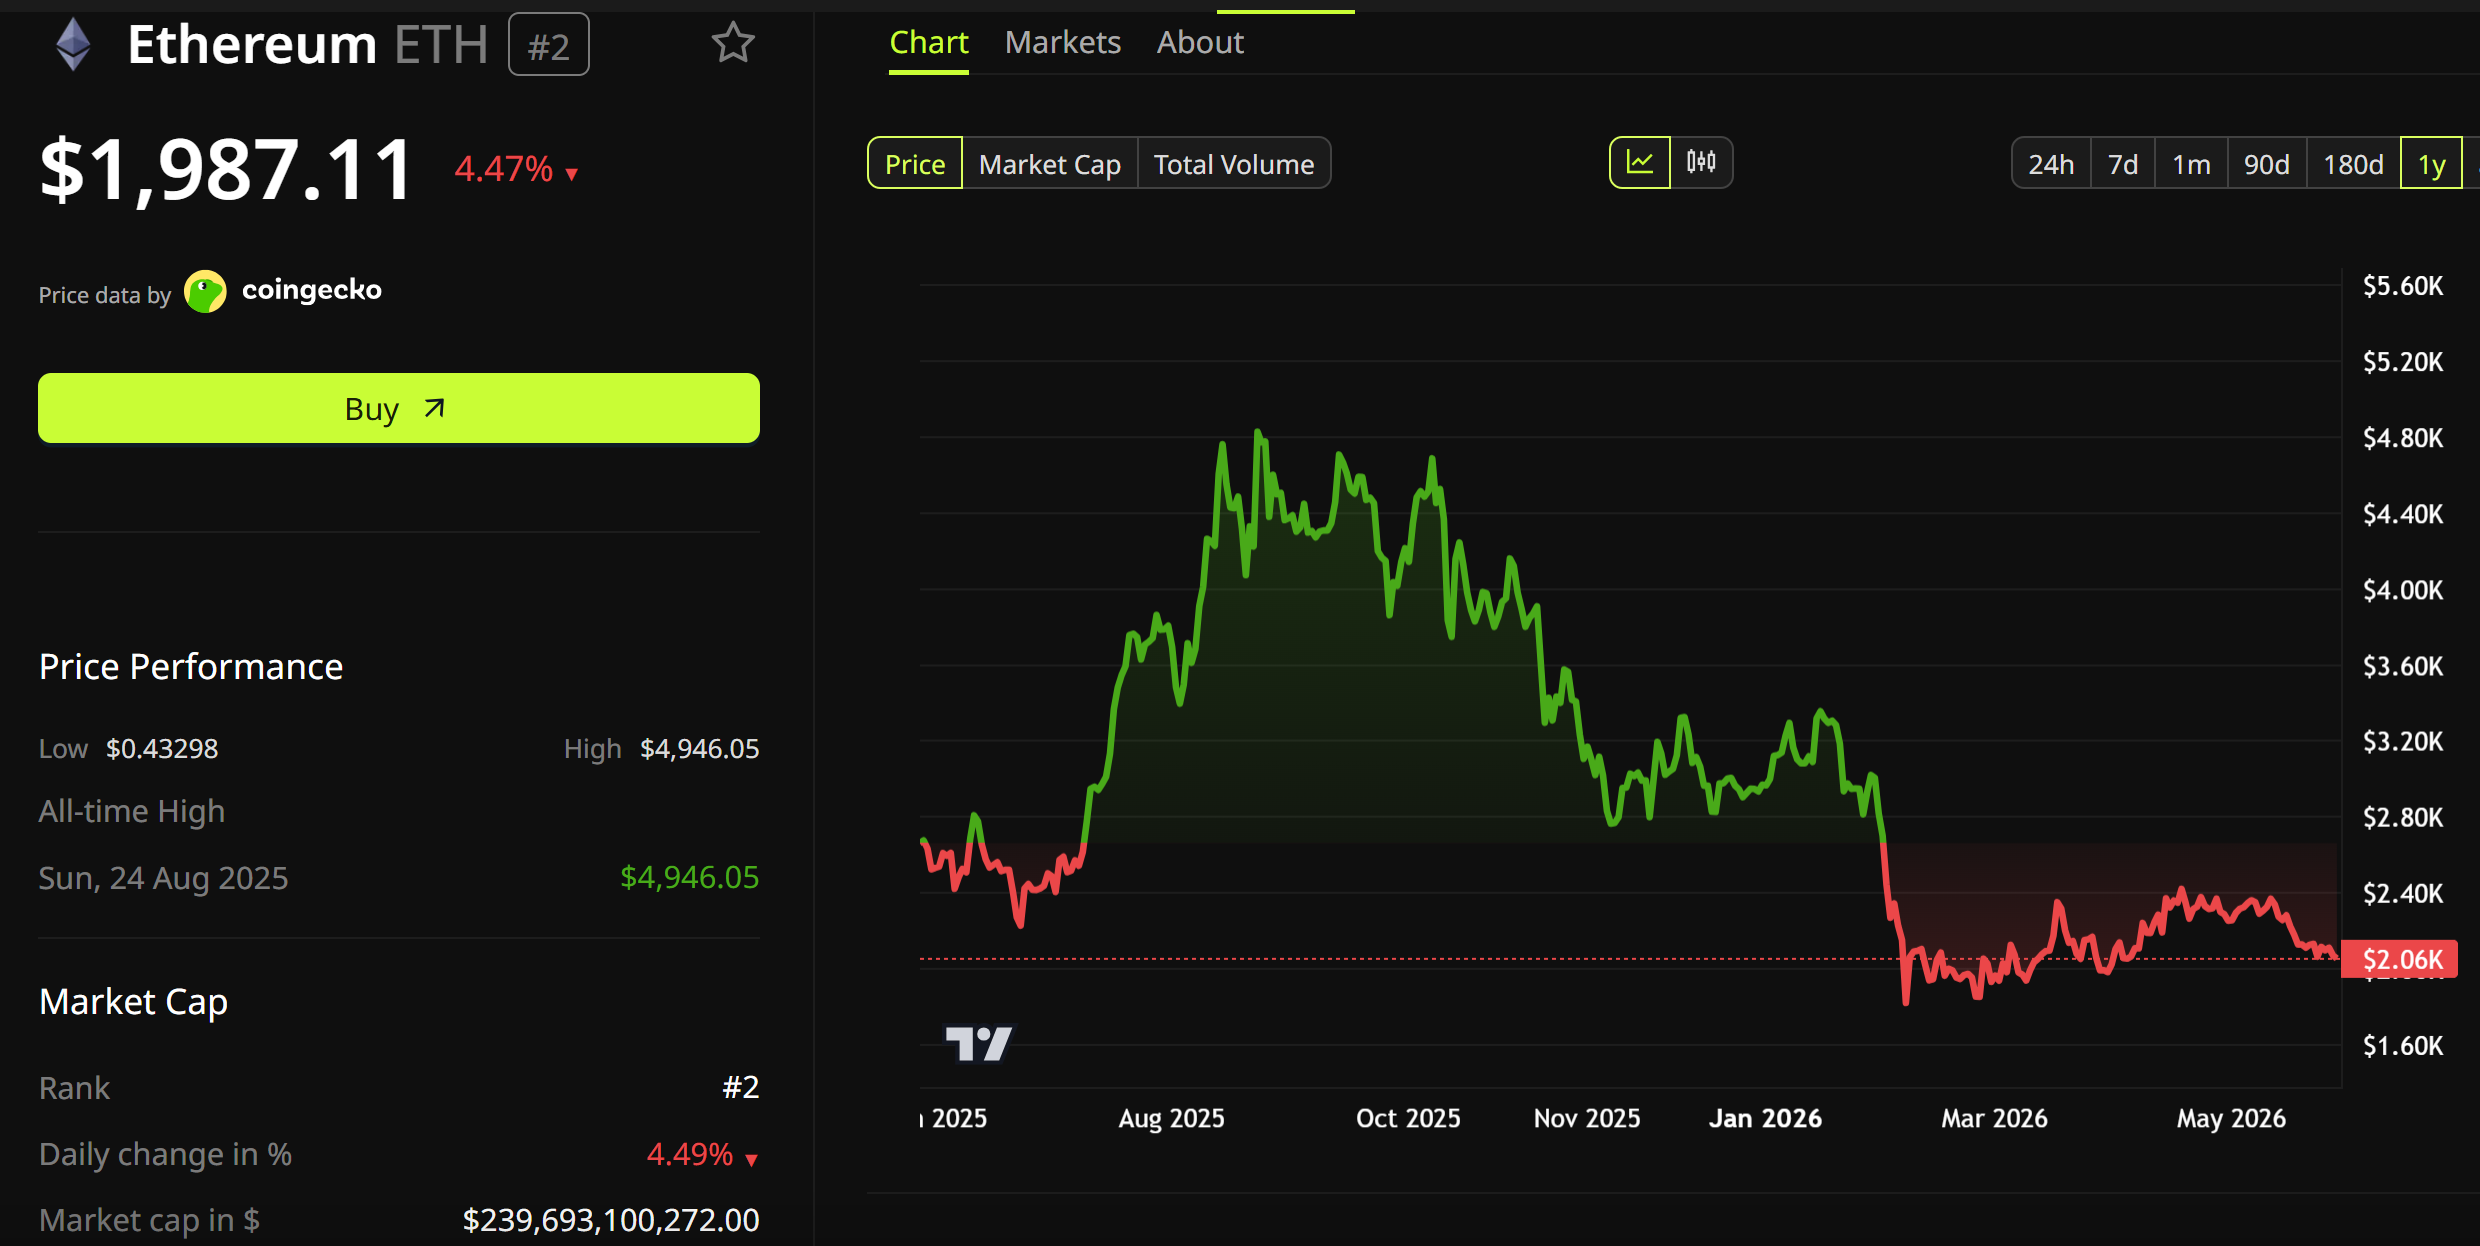
Standard Chartered reaffirmed its $40,000 Ethereum (ETH) target for end-2030, with the bank holding the call even as ETH slipped below $2,000 for the first time since late March.
Global Head of Digital Assets Research Geoff Kendrick compared Ethereum’s slump to Amazon during the 2001 dot-com bust. He argued the network’s internal metrics keep improving while its token price decouples.
Bezos Analogy and Long-Term Forecast
Kendrick reaffirmed targets of $4,000 for ETH by end-2026 and $40,000 by end-2030. He laid out the call in a research note circulated to clients.
Transaction counts and total value locked (TVL) sit near all-time highs in ETH terms, per the note. That contrasts with ETH below $2,000 today and a 57% drop from the August 2025 record of $4,946.

“I view ETH’s performance very much as Jeff Bezos described AMZN share price during the 2001 tech bubble burst,” Kendrick wrote.
The Standard Chartered executive framed the divergence with a 2018 Jeff Bezos speech about the 2001 Amazon stock crash.
The stock is not the company. And the company is not the stock. And so, as I watched the stock fall from $113 to $6, I was also watching all of our internal business metrics… every single thing about the business was getting better,” Bezos had said.
Follow us on X to get the latest news as it happens
He noted Amazon shares have multiplied roughly 1,000 times since 2001 once adjusted for splits.
Geoff Kendrick also projects stablecoin market capitalization will rise sixfold by end-2028.
Tokenized real-world assets could multiply fiftyfold over the same period, with Ethereum hosting 50% to 65% of both segments.
Retail Buys, Institutions Sell, Shorts Pile In
Even as the Ethereum price falls below $2,000, the ETH/BTC ratio dropped to a five-year low around 0.027.
Santiment data flagged a wave of retail “buy the dip” orders once the $2,000 level broke. Institutional flows moved the other way.
“Retail has erupted with “buy the dip” calls toward ETH as a result of this drop below a key psychological support level. This typically means the price may have a bit further to fall, due to the crowd (which usually gets calls wrong) being too optimistic,” Santiment analysts predicted.

The Polymarket prediction market now prices a 54% probability of ETH closing below $1,500 this year. That bet is backed by $6.4 million in trade volume.
Positioning, however, looks crowded on the short side. Rising open interest and positive funding rates create roughly $2 billion of short squeeze exposure.
That risk would mount if ETH reclaims the $2,000 level.
Whether Kendrick’s Amazon analogy holds may hinge on Ethereum’s ability to convert network usage into token-level value capture.
Longtime bulls like Bankless co-founder David Hoffman now argue value is accruing to apps and Layer 2s, not ETH itself.
The post Standard Chartered Says Ethereum Could 20X After ETH’s Brutal Crash Below $2,000 appeared first on BeInCrypto.
HYPE set a new record high, but this attracted sellers, pushing it into a pullback.
Hyperliquid (HYPE) Price Predictions: Analysis
Key support levels: $52
Key resistance levels: $63
Pullback Ongoing as Sellers Return
As soon as HYPE set a new record price just under $65, sellers returned, sending it into a pullback. At the time of this post, the price is around $57 and is likely to fall even lower, with key support at $52.
Even so, this cryptocurrency remains one of the best-performing assets of 2026, with its price doing a quick 3x since January. For that reason, a pullback here is normal and was expected. The question is if $52 will hold or not to maintain the uptrend intact.

Short Term Bearish, Long Term Bullish?
While the price may enter a correction in the short- to medium-term, the outlook on higher timeframes remains quite bullish. HYPE’s fundamentals are some of the strongest in crypto, and the recent HYPE ETFs bring additional buy volume which was not present in the past.
This is why a correction here could prove quite shallow, especially if the support at $52 holds. In that case, the uptrend remains very much intact and would open the way for the price to make new records later.

RSI Entered Danger Zone
One of the key signals that HYPE was getting overheated and overextended could be seen on the 3-day RSI where this indicator reached over 77 points, a level not seen since May 2025.
Whenever the RSI enters the overbought area (above 70 points) it’s always prudent to be careful since the price may show emotional buying which no longer offers an edge and could be a top. So far, this pullback seems to confirm that.

The post Why is the Hyperliquid (HYPE) Price Down Today? appeared first on CryptoPotato.

In the latest monthly list of new buys by the best mutual funds, top money managers did not put their chips on DraftKings (DKNG) or FanDuel parent Flutter (FLUT). But these savvy investors did scoop up shares of online betting platform Super Group (SGHC). The sports betting and online casino operator earns a spot in the IBD Live ready list…
Copyright ©2026 Investor’s Business Daily, LLC. All rights reserved. 87990cbe856818d5eddac44c7b1cdeb8


Decentralized finance (DeFi) protocols built for crypto assets are increasingly retooling themselves for Wall Street, and VanEck’s tokenized Treasury fund arriving on lending platform Euler is the latest example of that shift.
Securitize (CEPT), issuer and tokenization specialist behind VanEck’s VBILL Treasury fund, said Thursday that the product is now live on Euler lending markets.
The move allows investors to use tokenized U.S. Treasuries as collateral to borrow and deploy liquidity elsewhere onchain while maintaining compliance limits tied to the asset.
The move highlights how DeFi protocols are evolving as institutional investors push deeper into tokenized finance. Platforms that once centered around permissionless crypto assets are beginning to redesign their architecture for regulated products such as tokenized money market funds and private credit.
Tokenized U.S. Treasuries have become one of the fastest-growing sectors in crypto, topping $15 billion in assets swelling 150% in a year, according to RWA.xyz data. Global asset managers including BlackRock, Franklin Templeton and Janus Henderson have all launched blockchain-based Treasury and money-market products aimed at institutions seeking yield-bearing onchain collateral.
But that’s still a fraction of the potential how big asset tokenization could become. Standard Chartered projected $2 trillion in tokenized assets by 2028, while BCG and Ripple forecasted a $18.9 trillion market size by 2033.
Read more: Tokenization push could pull trillions of dollars into DeFi, StanChart says
“The really exciting thing is that there are protocols now that are excited to integrate permissioned assets,” Graham Ferguson, Securitize’s head of ecosystem, told CoinDesk. “This is something that previously had not been the case.”
Euler, which currently has over $320 million in assets on its platform, pivoted earlier this year toward institutional use cases after originally operating as a fully permissionless lending protocol. Rival platform Aave also launched Horizon, its real-world asset platform focused on institutional borrowers and tokenized collateral.
Euler integrated Securitize’s DS Protocol earlier this year, allowing tokenized securities to interact with lending markets while preserving investor eligibility requirements and transfer restrictions. Pricing data for VBILL is supplied through RedStone oracles.
The challenge for DeFi protocols, according to Securitize’s Ferguson, is balancing crypto’s open infrastructure with the compliance expectations of traditional finance firms.
“As more serious institutional investors are exploring the space, they need to have certain protections and permissions that they’re used to in traditional finance,” Ferguson said.
“DeFi Protocols are finally waking up to the fact that if they want to welcome in this capital, they’re going to have to change their ways,” he added.
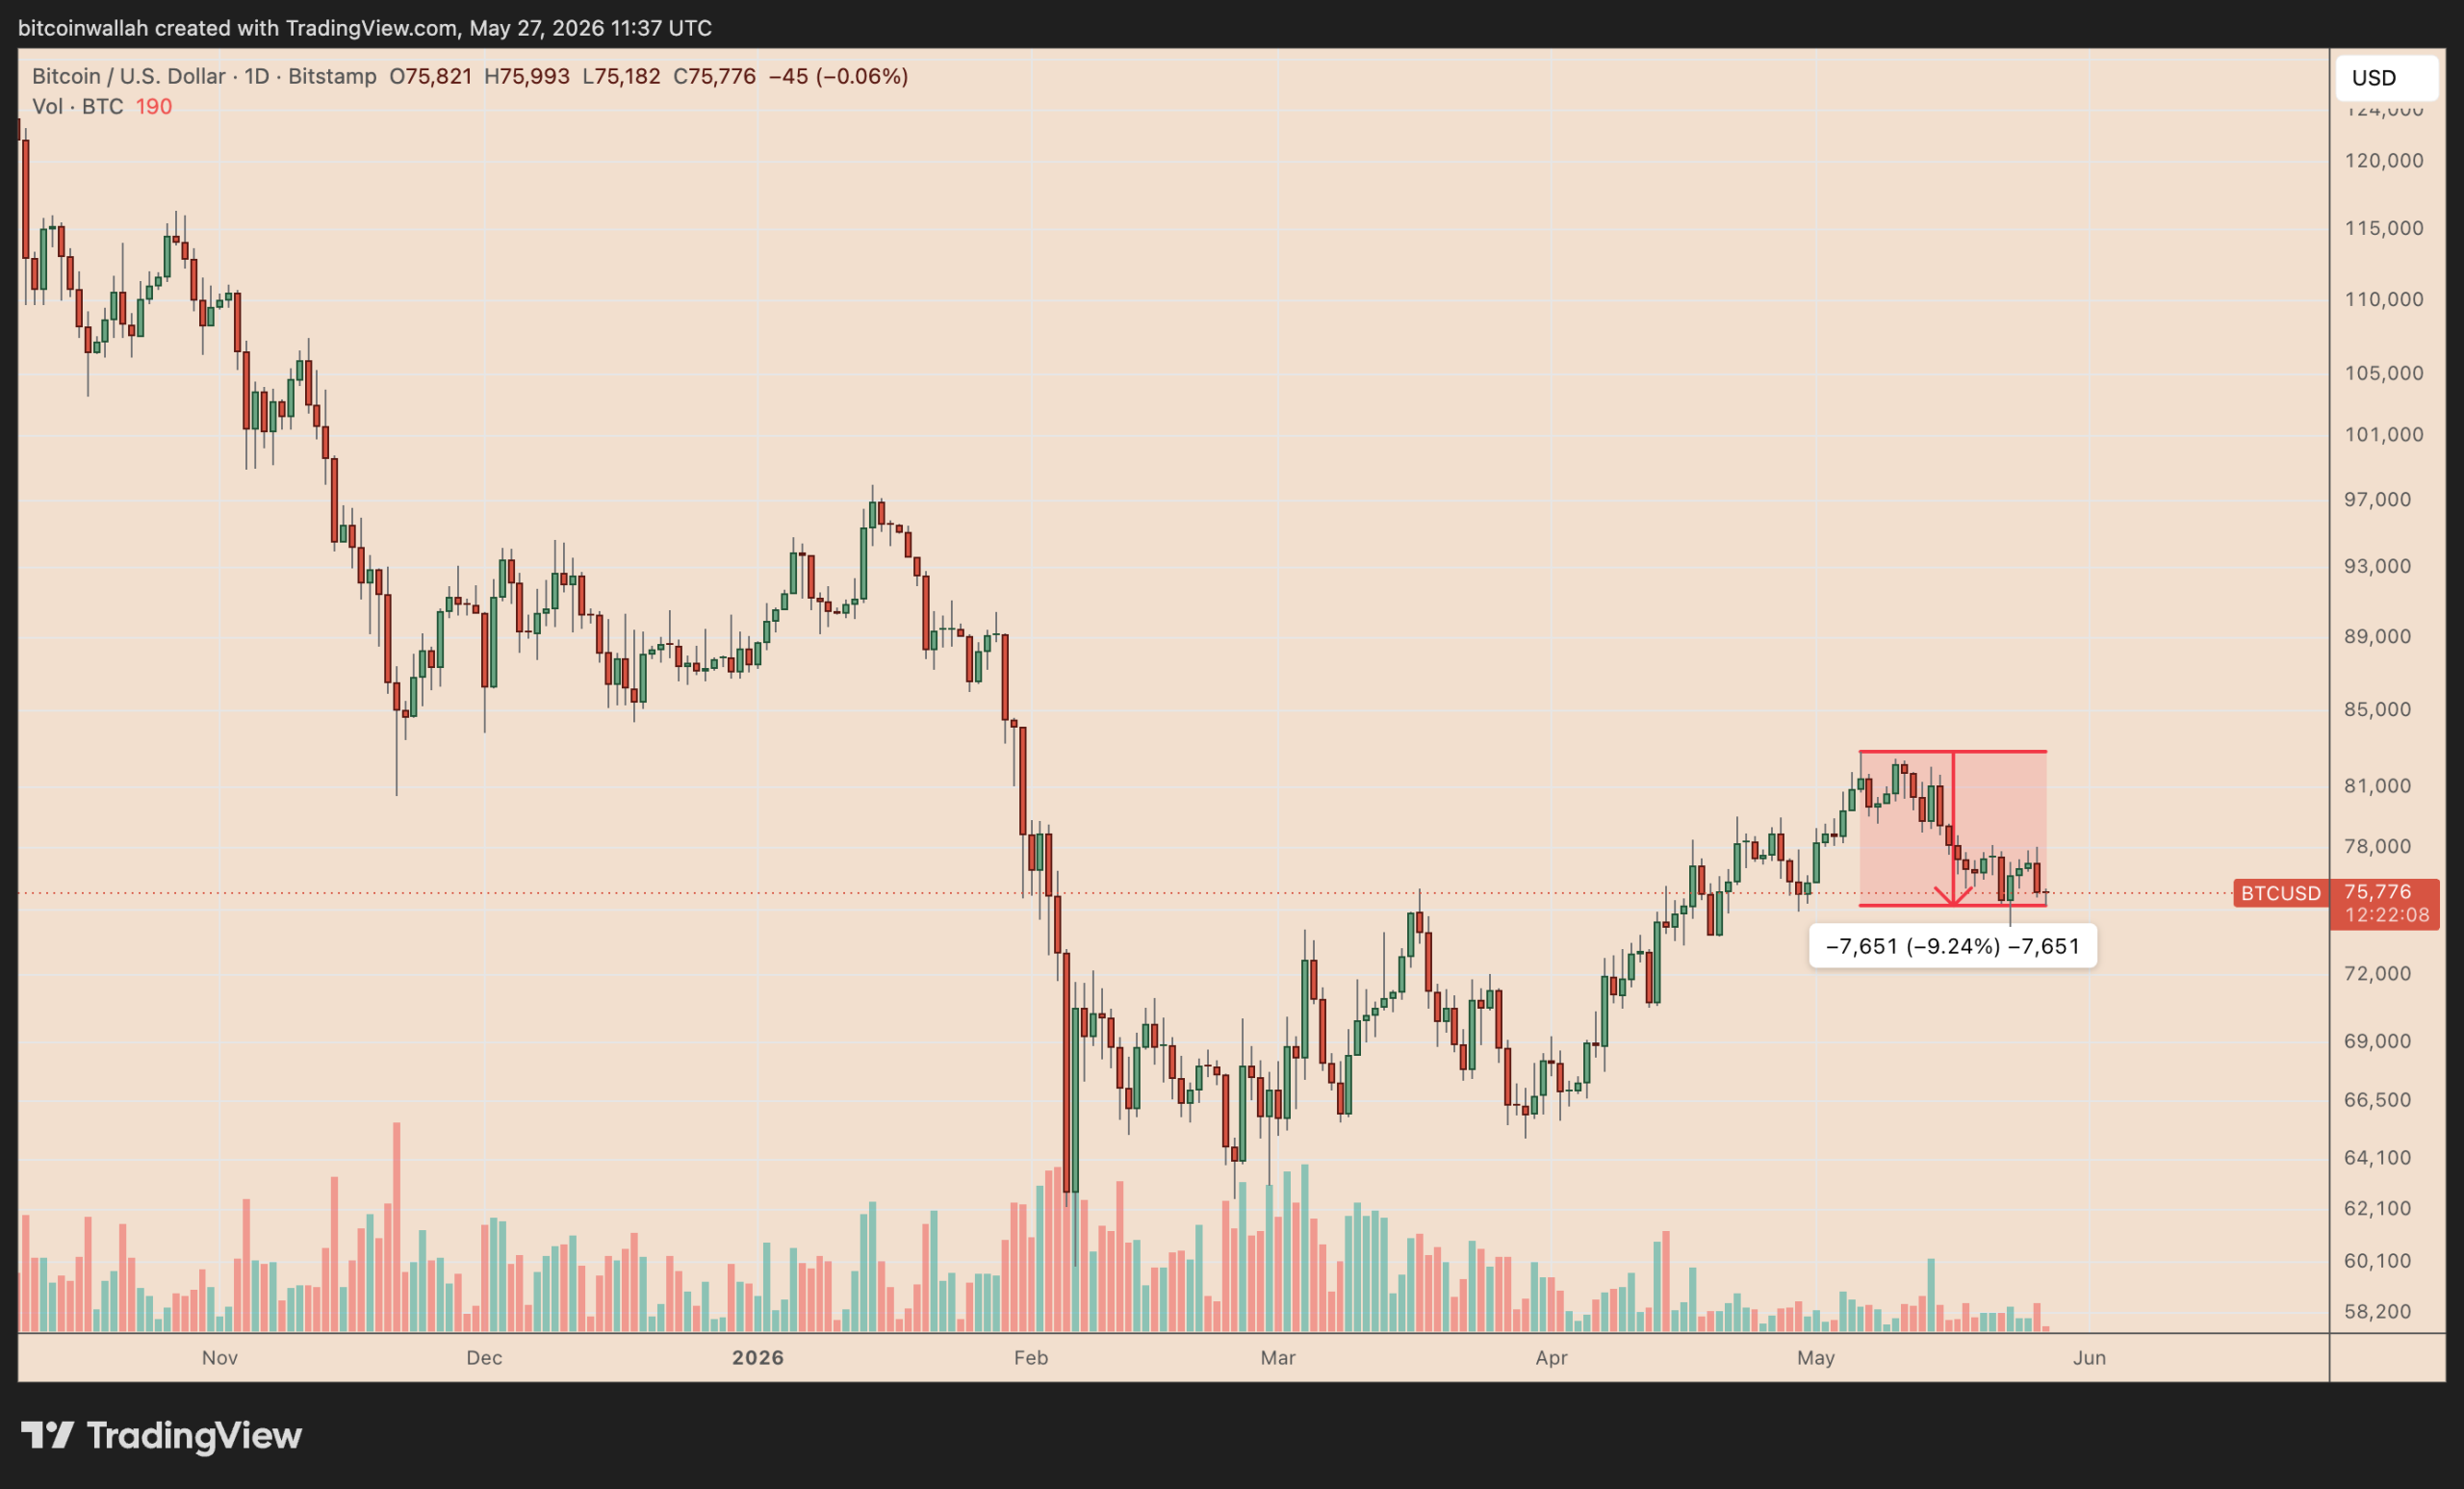
Bitcoin (BTC) may be flashing a “sell in May and go away” warning, with the price down roughly 10% after rejecting resistance near $83,000 and now on track for a negative monthly close.
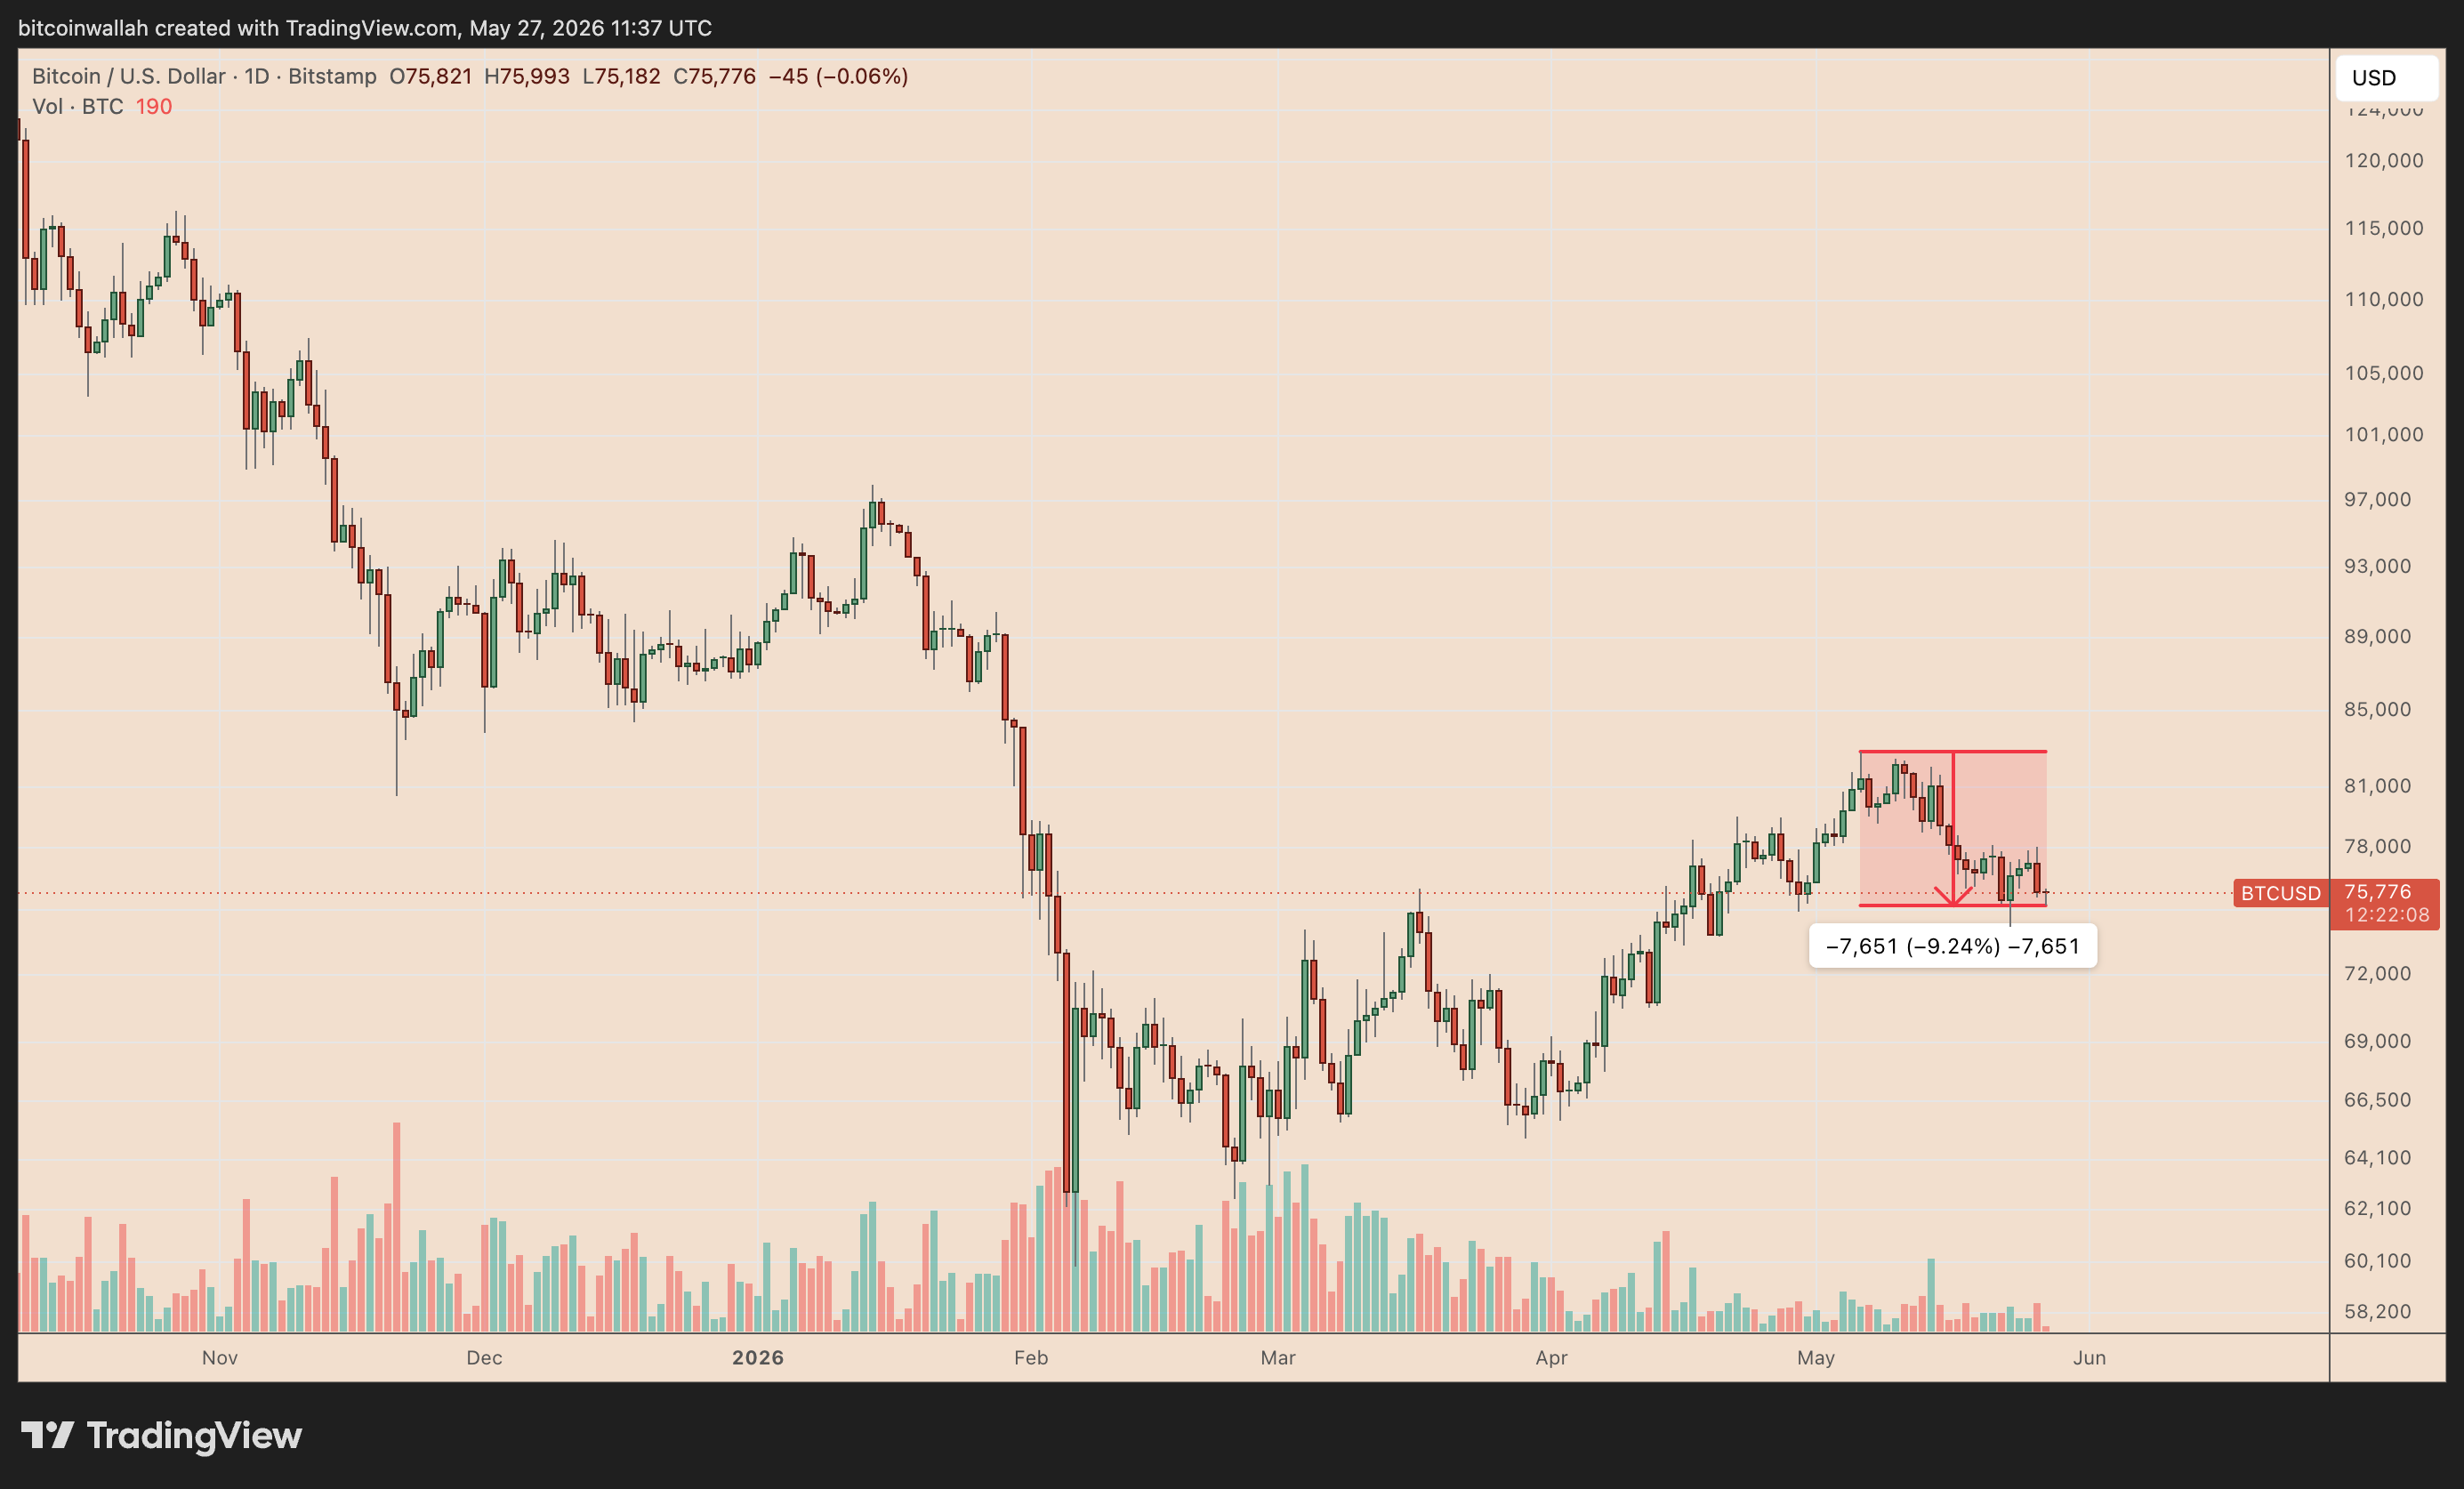
BTC/USD daily price chart. Source: TradingView
Key takeaways:
- BTC’s average returns a month after a red May are -10%
- Patient Bitcoin holders still generated positive returns over the longer term.
Bitcoin’s red May typically leads to weak summer returns
“Sell in May and go away” is a popular Wall Street saying based on the idea that stocks tend to perform better during the colder months than during the summer stretch.
For instance, the US benchmark index, S&P 500, averaged -0.24% one month and -2.25% three months after red Mays since 1990, before recovering to +1.22% after six months and +7.44% after 12 months.
Bitcoin’s own May history shows a similar short-term warning. BTC posted losses in May in 2013, 2015, 2018, 2021, 2022, and 2023. Its average returns one month later were -10.1%.
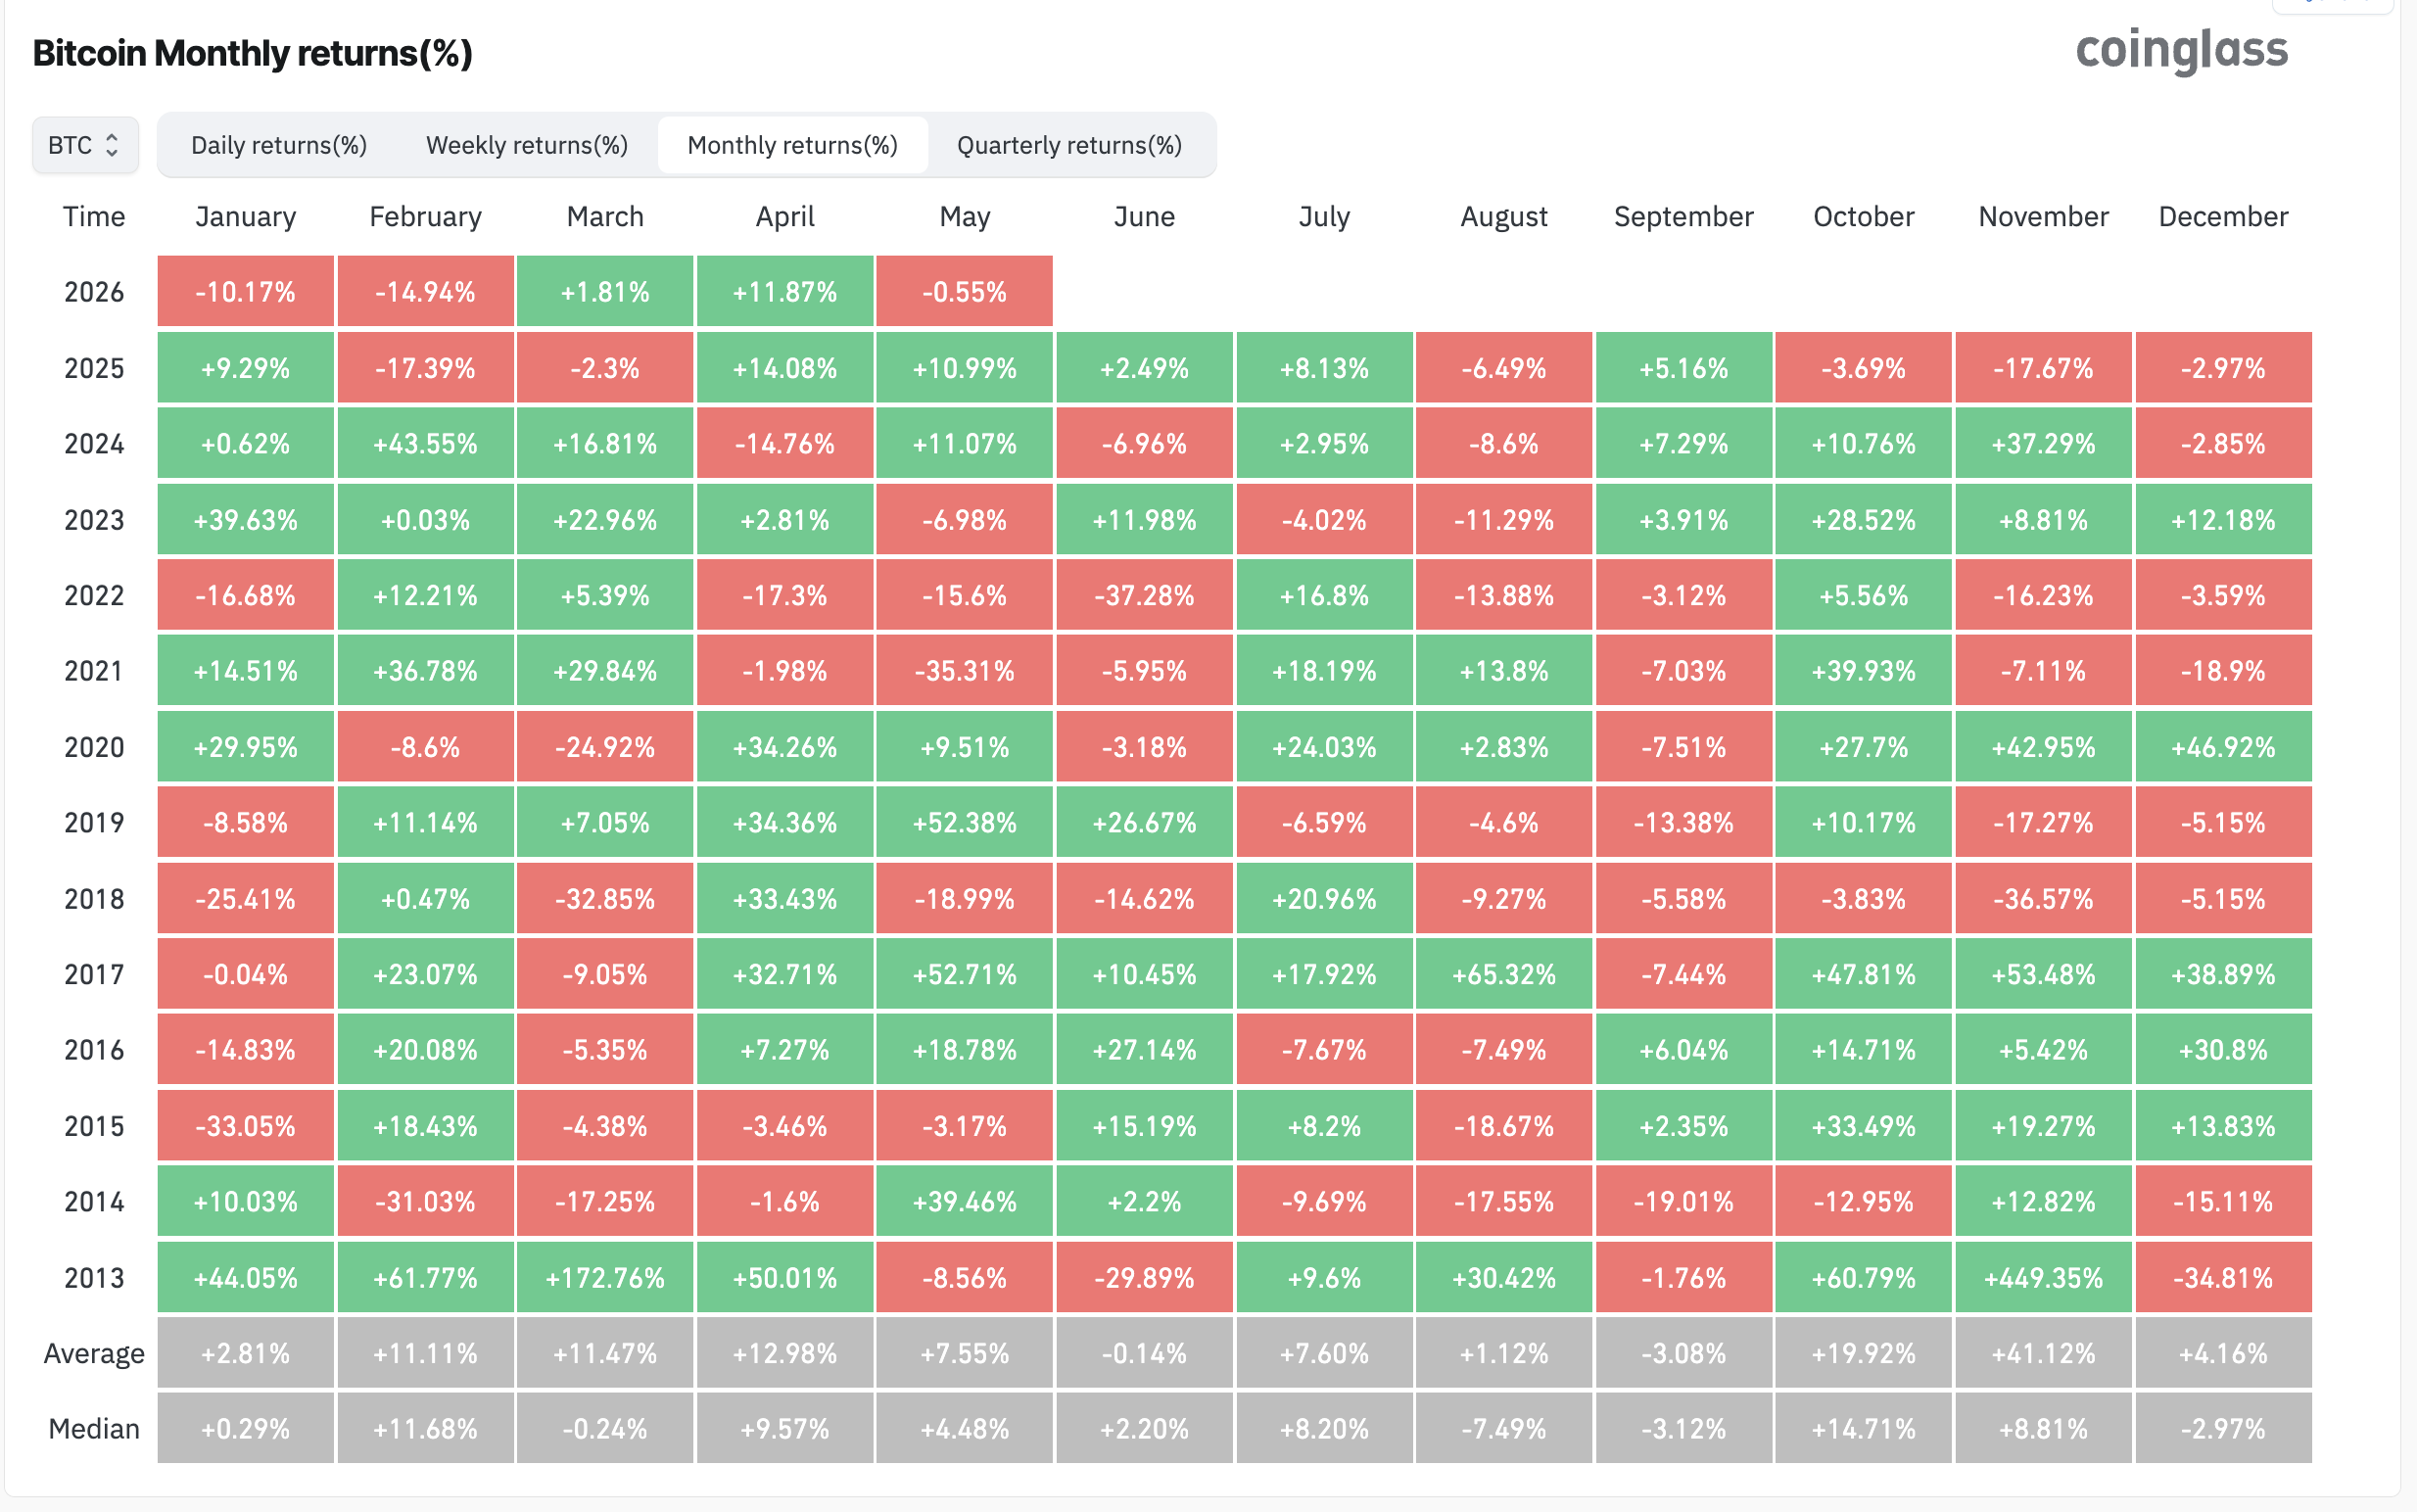
Bitcoin monthly returns. Source: CoinGlass
The three-month average return was also negative at around -3.3%. Therefore, BTC typically does not go through a significant recovery in the summer after dropping in May. That supports the idea that a red May can act as a short-term capitulation signal.
But, like US stocks, the longer-term picture is less bearish.
Six months after a negative May, BTC’s average return jumps to about +139%, largely because of 2013’s massive late-year rally. Excluding that outlier, the six-month average falls sharply to roughly +12.9%.
Based on Bitcoin’s current price near $75,850, its historical post-red-May averages imply a possible drop toward $68,200 by June and $73,350 by August.
The six-month average points to nearly $181,300 by November, though that figure is heavily distorted by 2013. Excluding that outlier, the six-month target falls to a more realistic $85,600.
Based on these historical signals alone, long-term Bitcoin investors have little reason to “sell in May and go away.”
The data points more to short-term weakness than a lasting breakdown in BTC’s broader upside trend.
Bear-market red Mays were more dangerous for Bitcoin
If Bitcoin closes the month below $76,000, the red May candle will be inside a bear-market structure.
In 2018 and 2022, May losses did not mark a quick bottom. Both years were already showing bear cycle signals, with BTC trading below major support and forming lower highs and lower lows.
After those red May closes, Bitcoin fell an average 26% one month later, 21.6% three months later, and roughly 46% six months later.
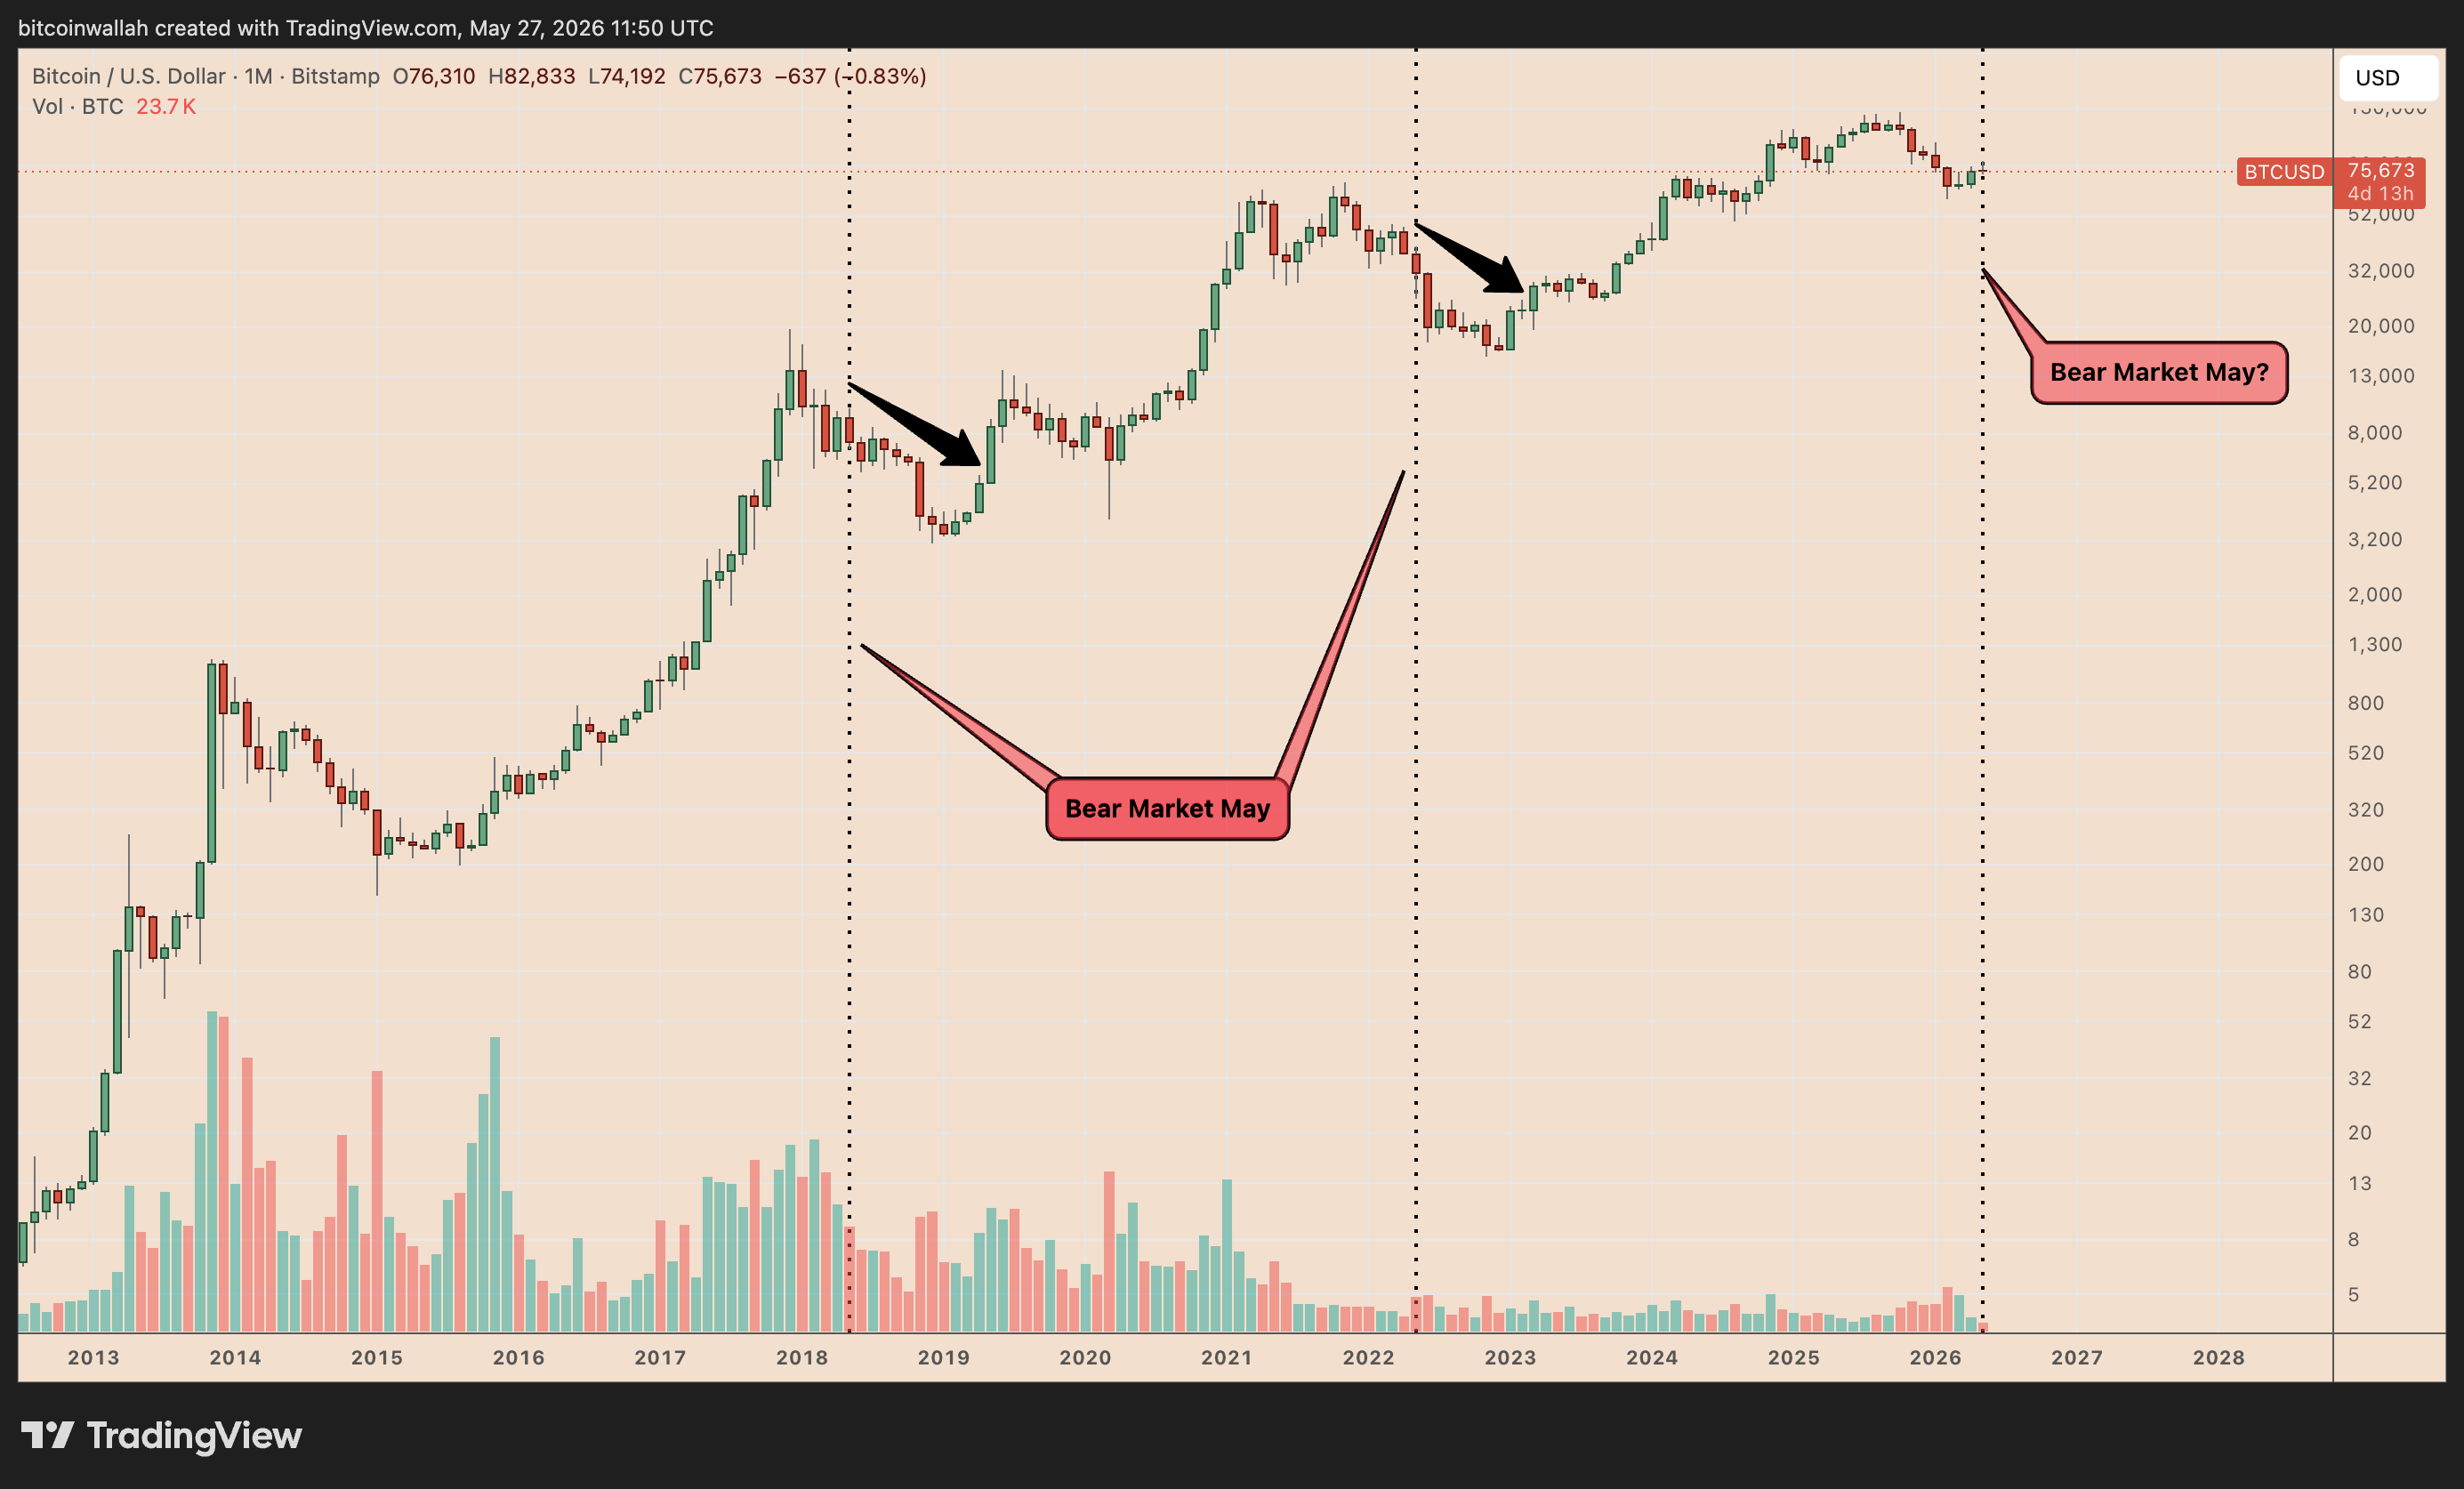
BTC/USD monthly chart. Source: TradingView
In normal or inter-cycle years, a negative May has usually pointed to short-term weakness, not a full trend breakdown. But in bear markets, the same signal has historically preceded deeper capitulation.
Related: Analyst says Bitcoin’s $60K bottom signals weaken bear-market forecast
So far, 2026 is not a fully confirmed Bitcoin bear-market year.
In prior bear markets, BTC first broke below major cycle support, around $6,000 in 2018 and $30,000–$32,000 in 2022, before capitulation deepened.
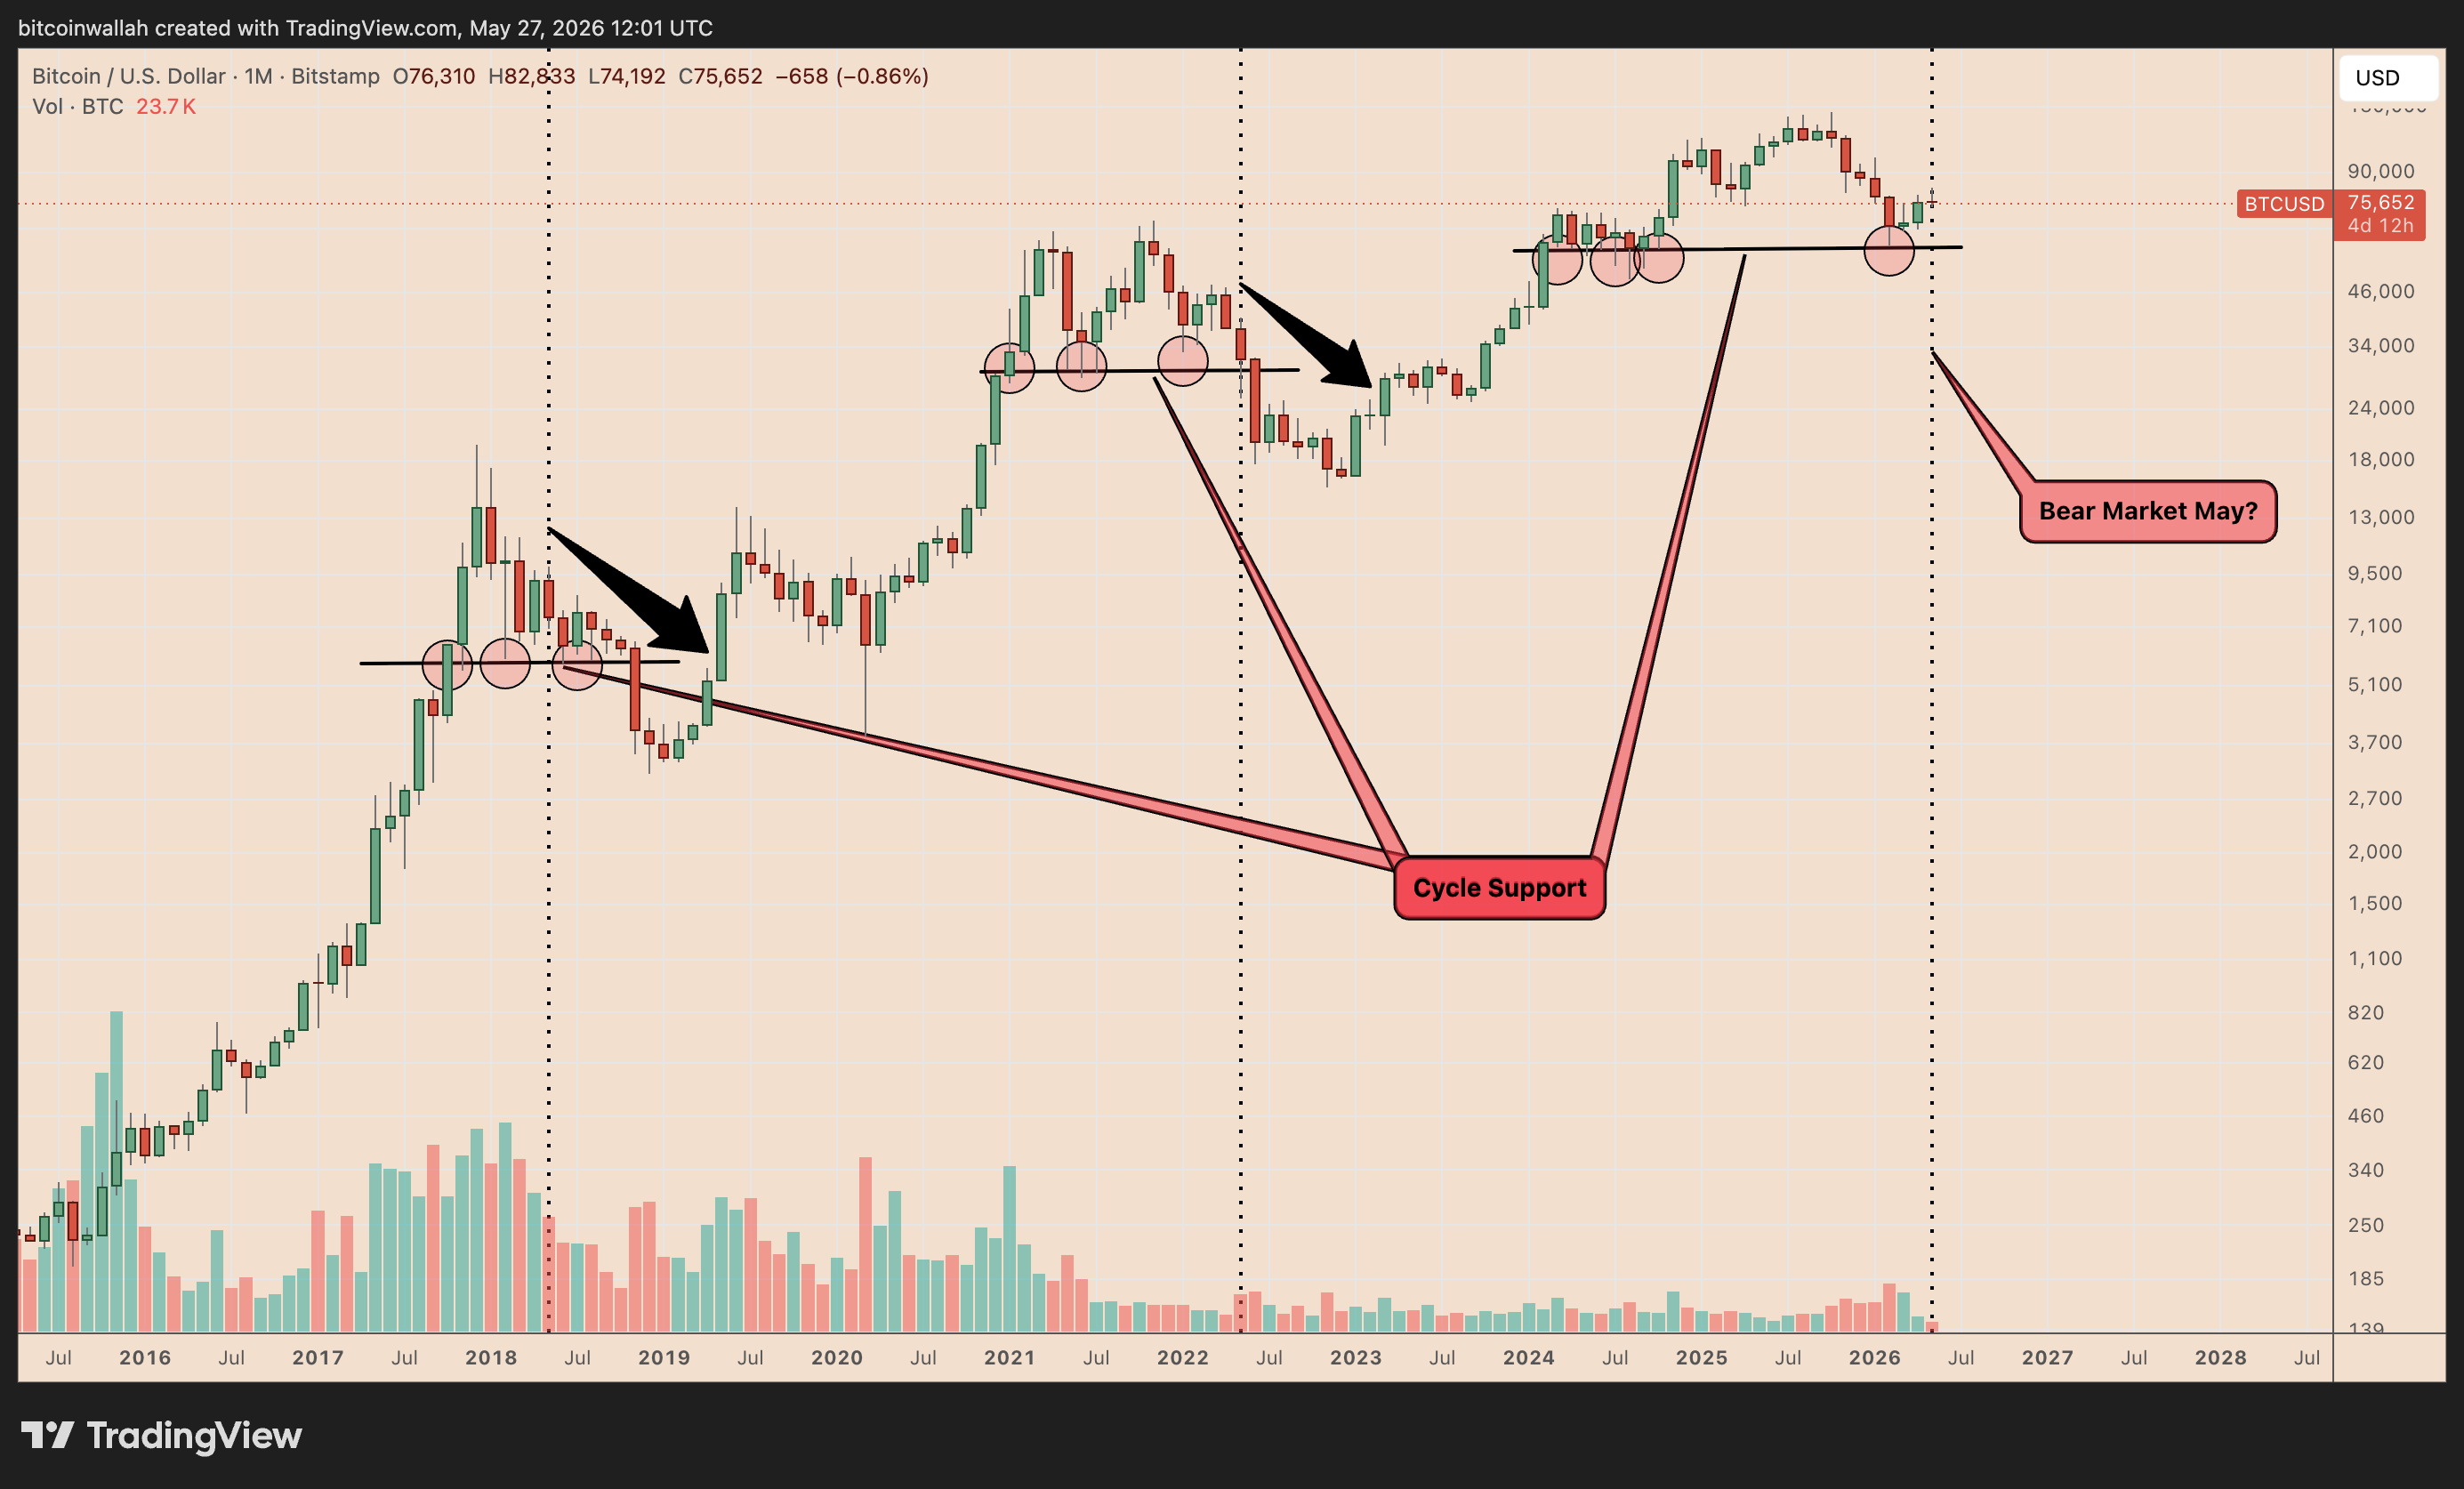
BTC/USD monthly chart. Source: TradingView
BTC still trades near $75,000, above its current cycle support near $60,000. A close below that zone would strengthen the bear-market case.
A monthly close below $70,000–$72,000 would also embolden the bears, while a deeper break below $60,000–$65,000 would make it harder to dismiss the current slump as a mere correction.

Decentralized Finance was never meant to feel polished.
Early DeFi was chaotic, experimental, anonymous, and wildly unpredictable. Traders aped into unaudited protocols at 3 AM. Governance forums looked like internet message boards. Anonymous developers launched billion-dollar ecosystems with anime profile pictures and zero formal oversight.
It was messy. It was risky. And for many, it represented the purest expression of crypto’s original ethos: open access, permissionless innovation, and financial freedom outside traditional institutions.
Fast forward to 2026, and DeFi is beginning to look very different.
Institutions are entering the space. Governments are tightening regulations. KYC requirements are appearing across protocols. Permissioned liquidity pools are becoming normalized. “Compliance-first DeFi” is no longer a contradiction — it is rapidly becoming a business model.
This raises a difficult question:
Is DeFi evolving… or is it slowly losing the culture that made it revolutionary in the first place?
The Early DeFi Era: Chaos as a Feature
The first major wave of DeFi between 2020 and 2022 was driven largely by retail users and crypto-native communities.
It was an era defined by:
- Anonymous founders
- Yield farming mania
- Meme governance
- Experimental tokenomics
- High-risk leverage
- Permissionless participation
Protocols competed aggressively for liquidity through token incentives. Users chased absurd APYs with little regard for sustainability. Rug pulls, exploits, and flash loan attacks became almost routine.
And yet, despite the chaos, early DeFi created something powerful: a financial system that anyone could access without asking permission.
No bank account.
No credit checks.
No geographic restrictions.
No institutional gatekeepers.
A trader in Manila had the same access as a hedge fund in New York.
That openness became DeFi’s cultural identity.
The “degen” culture — often mocked from the outside — represented more than speculation. It reflected a belief that financial experimentation should remain open to everyone, even if it came with risk.
The Institutional Shift
As billions flowed into DeFi, traditional financial institutions began to pay attention.
Banks, asset managers, fintech firms, and regulated exchanges realized that blockchain infrastructure could reduce settlement times, improve liquidity efficiency, and create new financial products.
But institutions brought something DeFi had long resisted: compliance requirements.
Large capital allocators cannot simply deposit funds into anonymous smart contracts operating outside legal frameworks. They require:
- Identity verification
- Risk controls
- Regulatory clarity
- Auditable counterparties
- Permissioned access environments
This institutional pressure is reshaping the ecosystem.
Today, many protocols are redesigning themselves to attract “safe” capital rather than purely crypto-native users.
The result is the rise of a new version of DeFi — one that increasingly resembles traditional finance wrapped in blockchain infrastructure.
KYC Pressure Is Growing
One of the biggest cultural shifts in DeFi is the growing normalization of KYC.
For years, permissionless access was considered sacred. The idea that anyone could interact with financial protocols anonymously was central to the movement.
Now, regulators worldwide are targeting DeFi platforms under anti-money laundering frameworks.
Some protocols are responding by introducing:
- Wallet screening
- Geo-blocking
- Identity verification layers
- Blacklists for sanctioned addresses
- Compliance middleware
Supporters argue this is necessary for mainstream adoption.
Critics argue it fundamentally changes what DeFi is supposed to be.
If users need approval to participate, many ask whether the system is still truly decentralized — or simply a blockchain-based version of traditional finance.
The philosophical divide is becoming harder to ignore.
Permissioned DeFi: The Middle Ground?
To solve this tension, a growing number of platforms are exploring “permissioned DeFi.”
Permissioned DeFi typically restricts participation to verified entities such as institutions, accredited investors, or regulated participants.
Examples include:
- Whitelisted liquidity pools
- Institutional lending markets
- Regulated tokenized assets
- Compliant stablecoin infrastructure
This model attempts to combine blockchain efficiency with traditional regulatory standards.
From a business perspective, it makes sense.
Institutions manage trillions of dollars. Even a small percentage entering on-chain markets could dramatically increase liquidity and accelerate adoption.
But culturally, permissioned DeFi represents a major departure from crypto’s original ideals.
Instead of open participation, access becomes conditional.
Instead of censorship resistance, compliance frameworks gain influence.
Instead of decentralization as a principle, decentralization becomes negotiable.
Institutional Liquidity Changes Market Behavior
Institutional participation also changes how DeFi markets behave.
Early DeFi markets were heavily community-driven. Governance was emotional, experimental, and often chaotic. Communities moved quickly, sometimes irrationally, but they shaped protocols collectively.
Institutional capital introduces different priorities:
- Stability over experimentation
- Predictable yields over explosive growth
- Risk minimization over innovation
- Regulatory compatibility with anonymity
This shift can make ecosystems more sustainable.
But it can also reduce the creativity and unpredictability that once defined crypto culture.
Some critics argue that DeFi is slowly becoming optimized for large capital instead of individual users.
The irony is difficult to ignore: a movement created to bypass financial gatekeepers is now redesigning itself to attract them.
Is Decentralization Being Softened for Adoption?
This is now one of the most important debates in crypto.
Supporters of institutional DeFi argue:
- Adoption requires compromise
- Regulations are inevitable
- Compliance attracts long-term capital
- Mature markets need accountability
- Institutional participation legitimizes the industry
Meanwhile, critics believe the industry is slowly abandoning its founding principles.
They argue that:
- KYC erodes financial privacy
- Permissioned systems recreate gatekeeping
- Compliance-heavy protocols increase centralization risks
- Institutional influence changes governance dynamics
- “Decentralization” is becoming more of a marketing term than a reality
In many ways, DeFi is facing the same challenge the internet faced decades ago.
Early internet culture valued openness, decentralization, and freedom from centralized control. Over time, convenience and scale led to the dominance of large platforms.
Some fear DeFi may be heading down a similar path.
The Reality: DeFi May Split Into Two Worlds
Rather than one side winning completely, DeFi may evolve into two parallel ecosystems.
The first will likely focus on institutional-grade compliance:
- Permissioned liquidity
- Regulated tokenization
- Enterprise blockchain infrastructure
- Identity-linked participation
The second may continue embracing crypto-native values:
- Permissionless protocols
- Privacy-preserving systems
- Anonymous participation
- Community-led experimentation
Both ecosystems could coexist.
One optimized for regulatory adoption.
The other is optimized for decentralization.
The tension between these models may ultimately define the next decade of crypto.
Conclusion
DeFi is no longer a niche playground for degens experimenting with internet money.
It is becoming part of the global financial infrastructure.
That evolution brings legitimacy, capital, and stability — but also difficult compromises.
The real question is not whether DeFi will change.
It already has.
The question is whether the industry can scale without abandoning the values that made it revolutionary in the first place.
As institutions continue entering crypto, the debate around decentralization, compliance, and cultural identity will only intensify.
And perhaps that tension itself is what defines DeFi’s next era.
REQUEST AN ARTICLE


Strategy (formerly MicroStrategy) told preferred shareholders that its so-called USD Reserve was their safety net. Half a year later, it drained most of it to retire zero-coupon debt that was costing the company nothing in interest.
Indeed, in December, Michael Saylor’s Strategy said it established a $1.44 billion USD Reserve “to support the payment of dividends on its preferred stock and interest on its outstanding indebtedness.”
It’s now used most of it for purposes other than paying interest and dividends.
USD Reserve is a fancy term for cash used by the company to distinguish cash from its bitcoin (BTC) reserve, which it considers more “pristine.”
It also wanted to earmark the cash as a meaningful reserve for a particular obligation, namely, dividend and interest obligations.
Strategy’s management diluted common shareholders through at-the-market (ATM) sales of MSTR to create the USD Reserve.
As common shareholders suffered dilution and no commensurate gain in BTC, preferred holders enjoyed a safety net for a few months, thinking the company would actually use its USD Reserve as promised.
At inception, President and CEO Phong Le framed the cash buffer as a trust signal, claiming it “currently covers 21 months of dividends.”
By late December, additional ATM sales had pushed the reserve to roughly $2.19 billion, covering more than 2.5 years of dividend payments.
The pitch to STRC, STRK, STRF, and STRD investors was straightforward. Your monthly dividends are safe. A wall of cash stands in support of your dividends.
USD reserve built for dividends, spent on something else
Fast-forward to May 2026, and instead of keeping that USD in reserve for dividends and interest payments, $1.38 billion disappeared within two weeks for something else.
Specifically, between May 11 and May 25, 2026, Strategy repurchased $1.5 billion in aggregate principal of its non-interest-bearing, 0% coupon Convertible Senior Notes due 2029.
Because the bonds were trading at a discount to par, Strategy paid $120 million less than the $1.5 billion principal.
Those convertible bonds were generating $0 ongoing interest expense for the company and were nowhere close to converting into MSTR.
Indeed, Strategy issued the original $3 billion tranche in November 2024 at a conversion price of $672.40 per share of MSTR. MSTR has not traded anywhere near that level in months.
The company confirmed that the USD Reserve was the funding source for retiring these bonds.
As a result of this action that did nothing “to support the payment of dividends on its preferred stock and interest on its outstanding indebtedness,” despite the company’s December 1 promise, the company’s USD Reserve has declined 63% from $2.188 billion at the start of the year to $871 million today.
Read more: Strategy’s BTC binge has cost it $1 billion in expenses
Replenishing USD by diluting Strategy shareholders, again
CFO Andrew Kang called the 0% bond buyback “both equity and credit positive for our investors and demonstrates our continued focus on liability management.”
The numbers tell a less flattering story.
Obligations across Strategy’s four series of dividend-paying preferreds now exceed $1.7 billion annually. At the start of 2026, Strategy’s USD Reserve could cover more than 2.5 years worth of dividends. Today, it can cover six months.
Kang also said the company “remains committed to maintaining a robust cash reserve to support the credit quality of our Digital Credit securities.” The plan is to rebuild the buffer through more sales of MSTR common stock and STRC preferred.
The same dilution mechanism that built the cash buffer will now refill it.
MSTR closed Wednesday at $154.20, down 58% over the trailing 12 months. These are the shareholders alongside STRC investors who will have to stomach even more dilution soon.
Got a tip? Send us an email securely via Protos Leaks. For more informed news and investigations, follow us on X, Bluesky, and Google News, or subscribe to our YouTube channel.

Key Takeaways
- XPeng’s Q1 2026 net loss reached 1.78 billion yuan ($262.6 million), substantially exceeding analyst projections of 811.9 million yuan.
- First-quarter revenue declined 18% to 13.03 billion yuan amid vehicle deliveries falling approximately one-third year-over-year.
- Gross margin expanded to 20.6% from 15.6% in the prior-year period, representing a significant operational improvement.
- Despite the earnings shortfall, XPeng shares advanced 3.8% to $17.07 in premarket sessions.
- Second-quarter projections indicate 100,000–106,000 vehicle deliveries with revenue expectations of 19.60–20.80 billion yuan.
XPeng (XPEV) kicked off 2026 with challenging first-quarter results that included a wider loss and significant revenue contraction, yet investors gravitated toward strengthening profitability metrics and forward-looking projections — pushing shares higher before the opening bell.
The Chinese electric vehicle manufacturer headquartered in Guangzhou recorded a net loss of 1.78 billion yuan ($262.6 million) during the first quarter, expanding from a 664 million yuan deficit in the same period last year. First-quarter revenue contracted 18% to 13.03 billion yuan. These results fell short of Street consensus — market watchers had anticipated a loss of 811.9 million yuan against revenue of 13.55 billion yuan.
Shares of XPEV climbed 3.8% to $17.07 during Thursday’s premarket session, defying the earnings disappointment.
The automaker delivered 62,682 vehicles during the quarter, representing a decline from 94,008 units in Q1 2025 — marking roughly a 33% year-over-year decrease. This downturn ended a string of record-setting quarters and mirrored broader headwinds affecting China’s electric vehicle market, where aggregate new vehicle sales declined approximately 7% in Q1 2026.
Profitability Metrics Show Promise
Despite headline numbers falling short of expectations, gross margin expanded to 20.6%, advancing from 15.6% in the year-ago quarter. Vehicle-specific margins improved to 12.1%, benefiting from operational efficiencies and an enhanced product portfolio.
This profitability enhancement likely explains why shares avoided a selloff following the report. The data demonstrates that while unit volume contracted, XPeng is extracting greater profitability from each vehicle transaction.
Li Auto, which released earnings on the same day, experienced a 3.4% decline to $15.25 after similarly underperforming forecasts. Li reported a per-share deficit of 15 cents against revenue of $3.3 billion, compared to analyst estimates calling for a 13 cent loss on $3.2 billion in sales. Deliveries increased marginally to 95,142 vehicles, though revenue decreased year-over-year.
Second-Quarter Projections Signal Rebound
Looking toward Q2, XPeng forecasts deliveries between 100,000 and 106,000 vehicles — essentially unchanged from the prior year — alongside revenue projections of 19.60 to 20.80 billion yuan. This outlook represents substantial sequential momentum compared to Q1’s softer performance.
Li’s second-quarter delivery forecast proved less optimistic, targeting approximately 97,500 vehicles, representing a roughly 12% year-over-year decline.
Considering results from NIO, which reported earnings independently, the trio of Chinese EV manufacturers collectively anticipates approximately 313,000 vehicle deliveries in Q2 — reflecting 9% year-over-year growth and an acceleration from the 5% expansion observed in Q1. This provides a cautiously encouraging indicator for the sector overall.
Heading into Thursday’s earnings release, XPEV had declined 19% year-to-date, which may have contributed to the market’s measured response to the quarterly shortfall.
Through the end of April, Tesla recorded approximately 139,000 vehicle sales in China, declining 15% year-over-year, with TSLA shares down 1.6% in premarket trading at $433.51.


Senator Cynthia Lummis posted a stark warning on X this week: if the CLARITY Act fails to clear Congress in this session, American software developers will face prosecution simply for publishing code.
She called the scenario a descent into ‘regulatory dark ages’, a direct indictment of the SEC’s regulation-by-enforcement posture that has defined U.S. crypto policy for the past three years.
The stakes, in Lummis’s framing, are not abstract: this is the last realistic legislative window until at least 2030.
The Senate Banking Committee passed the CLARITY Act last week, but floor passage is a different calculation entirely.
Crypto advocacy groups have been running an all-out lobbying campaign to sustain momentum, arguing that the bill represents the industry’s only near-term path to a defined market structure framework. Without it, the SEC’s case-by-case Howey Test application to digital assets continues unchallenged.
Discover: The Best Crypto to Diversify Your Portfolio
What the CLARITY Act Would Actually Change, and Why the SEC’s Current Approach Is the Baseline Risk
The CLARITY Act’s core function is jurisdictional clarity. It would formally define ancillary assets, the category covering most altcoins, and establish which digital tokens linked to investment contracts are not securities, resolving the ambiguity the SEC has exploited to pursue enforcement actions without formal rulemaking.
The bill would require the SEC to create Regulation DA, exempting certain ancillary-asset offerings from full registration if they raise $75 million or less over 4 years.
Beyond registration thresholds, the legislation would direct the SEC to modernize its investment contract definitions and set examination standards targeting illicit finance, replacing informal supervisory pressure and guidance letters with binding rulemaking.

That shift matters because the current framework gives the SEC discretion to threaten enforcement without triggering the procedural protections that formal rules would require.
It also addresses stablecoins through 1:1 reserve mandates, a provision Lummis frames as critical to preserving the digital dollar’s credibility internationally.
The CLARITY Act’s market structure provisions would split oversight between the SEC and CFTC based on asset classification, the same architecture that traditional finance already operates under.
Lummis has argued that the absence of this framework is directly accelerating capital flight to offshore hubs in the UAE and Hong Kong, where institutional players can operate under defined rules.
The SEC’s continued reliance on enforcement as policy is not a neutral holding position. It is actively reshaping where crypto infrastructure gets built.
Discover: The Best Token Presales
The post Lummis Warns of ‘Regulatory Dark Ages’ if CLARITY Act Stalls This Session appeared first on Cryptonews.
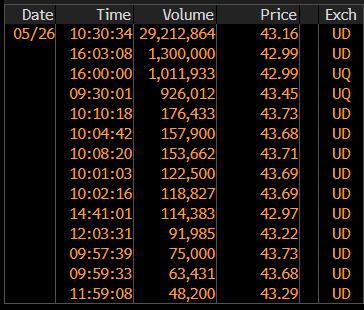
A roughly $1.3 billion block trade in BlackRock’s iShares Bitcoin Trust (IBIT) tested liquidity in the largest spot Bitcoin exchange-traded fund (ETF) as Bitcoin products faced a fresh stretch of outflows.
Bloomberg’s ETF analyst, Eric Balchunas, confirmed the transaction, adding that the market “absorbed it well” as IBIT’s price remained largely unchanged, he wrote in a Tuesday X post.
Bitcoin’s (BTC) price fell 2% during the past 24 hours, but managed to remain above the $75,600 level at the time of writing, despite the significant block sale from the mysterious ETF holder, data from TradingView shows.
The price action shows that there is sufficient Bitcoin liquidity and buyer demand to absorb large institutional sales worth over a billion.
However, the block sale may add to the mounting ETF outflows, as the US spot Bitcoin ETFs recorded $1.79 billion worth of net negative outflows in the seven trading days leading up to Tuesday, Farside Investors data shows.
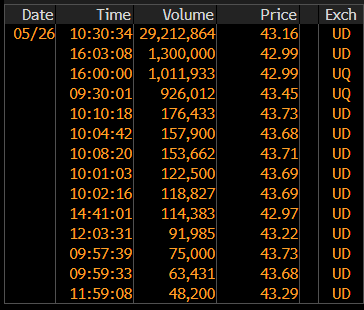
Source: Eric Balchunas
Block sale may signal institutional de-risking
While the exact reason behind the massive block sale is unknown, CryptoQuant analyst Axel Adler saw it as a signal of “large-scale institutional de-risking,” according to a Tuesday X post.
The sales follow renewed geopolitical concerns surrounding the conflict in the Middle East, after the US said it launched new strikes on southern Iran on Monday, targeting Iranian missile sites and boats attempting to place mines, reported news outlet BBC.
In retaliation, Iran’s Islamic Revolutionary Guard Corps said it downed a US drone that entered its airspace on Tuesday.
Related: Strategy buys back $1.5B of debt at discount, cuts outstanding notes to $6.7B
Other large entities have also shown signs of de-risking.
On Monday, a Satoshi-era Bitcoin miner transferred 2,650 Bitcoin worth about $203 million to FalconX and Cumberland over-the-counter (OTC) trading desks, in an onchain move that may signal a planned sale or liquidity transaction from the long-dormant whale, Cointelegraph reported.
Michael Saylor’s Strategy, the largest corporate Bitcoin holder, also skipped its weekly Bitcoin acquisition, but bought back $1.5 billion worth of outstanding notes at a discount, reducing its outstanding debt via notes to $6.7 billion, Cointelegraph reported on Tuesday.
Still, four smaller treasury companies stepped in and bought a cumulative 602.6 BTC worth about $46 million, signaling more sustained demand for the world’s largest cryptocurrency.
Magazine: Bitcoin ETFs bleed $1B, Aave’s $71M ETH unfreeze bid delayed: Hodler’s Digest, May 10 – 16

Standard Chartered Says Ethereum Could 20X After ETH’s Brutal Crash Below $2,000

Stellenbosch FC Part Ways With Super Eagles Defender Olisa Ndah

Menschen verstecken Geld in Babyprodukten


-

 Crypto World7 days ago
Blockchain.com files with SEC for U.S. IPO
-

 Fashion6 days ago
Holiday Weekend Open Thread – Corporette.com
-

 Politics3 days ago
Bridgerton Season 5: Cast, Release Date And Everything We Know So Far
-
 Crypto World6 days ago
Bitcoin Accumulation Weakens as BTC Realized Losses Hit $600M
-

 Tech3 days ago
Microsoft’s quiet Claude Code retreat and the real cost of enterprise AI
-

 Business6 days ago
Dell Technologies DELL Stock Surges 15% on AI Server Momentum and Analyst Upgrades in 2026
-

 Crypto World5 days ago
Robinhood crypto COO Tanya Denisova exits
-

 Business4 days ago
NYT Strands Answers May 24 2026 Revealed for Puzzle No. 812 Theme Summer Essentials
-

 Business6 days ago
Trump Invests $1M-$5M in Kura Sushi USA Chain With 27 California Locations
-

 Politics6 days ago
Makerfield: a tale of two social-media histories
-
 Crypto World6 days ago
Space X IPO Is ‘Bad News’ for Tech Stocks: But What About Bitcoin?
-

 Business1 day ago
Selena Gomez Reportedly Upset Over Benny Blanco’s Comments on Her ‘Terrible’ Diet
-
 Crypto World6 days ago
MicroStrategy’s Saylor Says Miners No Longer Set Bitcoin Price, Another Force Has Taken Over
-

 Tech7 days ago
WhatsApp ads could make Irish debut after discussions with DPC
-

 Business3 days ago
BTS Sells Out Four Las Vegas Shows at Allegiant Stadium for ARIRANG World Tour
-
Tech1 day ago
The Samsung pay deal is the moment Korean unions changed register
-
 Tech6 days ago
A 0.12% parameter add-on gives AI agents the working memory RAG can’t
-

 Crypto World6 days ago
AI infrastructure race heats up as IREN pitches full-stack strategy, WhiteFiber lands $160M deal
-

 Tech3 days ago
Westone Audio and Etymotic Acquired by Fidelity Collective in Major IEM Market Move
-
 Crypto World3 days ago
Nvidia (NVDA) CEO Calls on Super Micro to Strengthen Export Controls Amid Smuggling Probe
You must be logged in to post a comment Login