

Crypto World
Intel (INTC) Stock Surges 11% on Reports of Major AI Chip Deals with Google and Nvidia

Key Takeaways
- Intel shares rallied approximately 11% on Monday, topping S&P 500 performers following a 13.5% decline the previous week
- Reports suggest Google could place an order for 3 million AI chips with Intel for delivery in 2028
- Nvidia and Tesla are reportedly considering Intel as a potential chip manufacturing partner
- Morgan Stanley notes robust server CPU demand and expects Intel to beat near-term estimates
- Intel shares have climbed 422% over the trailing twelve months; analyst consensus remains Hold with $98.15 average target
Intel shares staged a dramatic recovery Monday, surging approximately 11% to near $110 after shedding 13.5% the prior week during a session that wiped out $1 trillion from semiconductor valuations.
The rally positioned Intel atop the S&P 500 gainers list for the trading day. The benchmark index advanced 0.8%, with the Nasdaq climbing 1.4%. Intel’s performance significantly outpaced both.
What sparked the move? The Information published a report suggesting Alphabet’s Google might have contracted Intel to produce 3 million tensor processing units — specialized TPU AI chips — by 2028. The alleged order remains unverified, with Google and Nvidia offering no comment. Intel similarly declined to address the speculation.
Investors bought in anyway.
The speculation extended beyond Google. Street Insider indicated that Nvidia could potentially engage Intel as a contract manufacturer for a new processor design that integrates four Nvidia GPUs into one package. Tesla also surfaced in reports as possibly partnering with Intel or licensing its upcoming 14A manufacturing technology for proprietary chips at a planned facility called Terafab.
Three heavyweight prospects. None confirmed. All driving momentum.
Strong Server CPU Trends Provide Foundation
Setting aside unverified reports, fundamental factors also support a bullish case. Morgan Stanley’s Joseph Moore noted on June 1 that Intel maintains healthy server CPU momentum.
Moore emphasized that the server roadmap — rather than foundry contracts — represents the core Intel investment thesis. He highlighted Intel’s “clear ability to beat-and-raise near term given server CPU shortages.”
Intel CEO Lip-Bu Tan reinforced this narrative during Computex in Taiwan last week, revealing that multiple CEOs have reached out over recent weeks requesting additional CPUs to satisfy demand.
Intel additionally announced a collaboration with Apple’s manufacturing partner Foxconn last week focused on AI infrastructure development, further expanding its manufacturing strategy.
Rally Details and Market Context
The semiconductor sector experienced broad gains Monday. Broadcom advanced 2.7%, AMD climbed 4%, and Nvidia increased 1.6% following Friday’s worst single-session decline for the PHLX Semiconductor Index since 2020.
Yet Intel’s advance was exceptional. The stock has jumped 190% in 2026 year-to-date and has skyrocketed 422% over the past year.
Despite this impressive performance, Wall Street remains cautious. Among 51 firms monitored by FactSet, the consensus rating stands at Hold, with an average price objective of $98.15 — substantially below current trading levels.
Valuation concerns persist. Intel operates at a loss currently and trades at over 120 times forward earnings estimates for next year.
Intel’s market capitalization now stands at roughly $498 billion. Monday’s session saw the stock fluctuate between $106.66 and $112.36, with average daily turnover around 122.9 million shares — volume that underscores intense investor attention.


The European Securities and Markets Authority has added 15 crypto-asset service providers to its interim Markets in Crypto-Assets register.
Summary
- ESMA added 15 authorised CASPs, lifting the register to 309 distinct providers across European markets.
- BNY’s Belgian subsidiary gained approval for crypto custody and transfer services under the MiCA framework.
- Germany contributed four new entries, while Denmark added three as post-deadline licensing activity continued steadily.
The additions lifted the list to 309 distinct authorised providers, based on the latest register file dated July 23 and published through ESMA’s MiCA page on July 24.
The new entries include BNY SA/NV, the Belgian banking subsidiary of U.S. financial services group BNY. The National Bank of Belgium authorised the unit on July 20 for crypto-asset custody and transfer services.
BNY joins banks and payment firms on the register
BNY SA/NV joins the MiCA register as traditional banks expand their regulated digital-asset operations in Europe. BNY describes itself as a global financial services platform. It reported $62.6 trillion in assets under custody or administration as of June 30. Its Belgian subsidiary already serves as a major European custody bank.
Three German cooperative banks also appeared among the new entries. They were Raiffeisenbank Falkenstein-Wörth, Spar- und Kreditbank Rheinstetten and VR-Bank Augsburg-Ostallgäu. Germany also added JT Technologies, taking the country’s total for this update to four rather than three.
The register also added BitPay B.V. in the Netherlands and Coinify ApS in Denmark. Both companies provide digital payment services. Denmark’s other additions were SafeLynx Technologies and Januar, which provides payment and banking infrastructure for digital-asset companies.
ESMA adds providers from eight European jurisdictions
The 15 additions came from eight jurisdictions. Germany led with four entries, followed by Denmark with three. Bulgaria and Latvia each added two providers. Belgium, Cyprus, Liechtenstein and the Netherlands each contributed one.
Bulgaria’s entries were Altcoins BG and Digital Assist. Latvia added Bleap and Nodu Digital. The remaining providers were Damoon Technology Europe in Liechtenstein and SG Digital Assets in Cyprus. ESMA’s register lists each firm with its national regulator, approval date and permitted services.
The published CSV contains 312 rows, but some firms appear more than once. A register comparison by NorthPoint counted 309 distinct entity-and-regulator pairs. This explains why some trackers may show a higher total when they count authorisation records instead of separate providers.
MiCA register expands after July transition deadline
The update followed the end of the European Union’s MiCA transition period on July 1. Companies that previously operated through national registrations must now hold a CASP authorisation for covered services or take steps to stop those activities. ESMA says national regulators supply the register data and that it republishes the files weekly.
A MiCA authorisation granted by one national authority can support cross-border services after the required passporting process. However, approval only covers the services listed for that provider. BNY’s entry covers custody and administration of crypto-assets and transfer services on behalf of clients. It does not list exchange or trading-platform operations.
As crypto.news previously reported, ESMA added 14 providers in the prior update, taking the register to 294. That group included Ripple Payments Europe, Portugal’s Bison Bank and Hrvatska poštanska banka in Croatia. Ripple said its Luxembourg authorisation supported regulated payment services across Europe.
Related coverage also reported that MiCA’s July deadline changed market access for firms that had not completed licensing. Some providers restricted new accounts or adjusted European services, while authorised companies began competing for customers moving to regulated platforms.
Compliance costs remain a concern for licensed firms
The rising CASP count shows that national authorities continue processing applications after the transition deadline. It does not show how quickly each provider will launch services or whether every authorised business can support the long-term cost of compliance.
Gate Europe chief executive Giovanni Cunti recently warned that some licensed firms may “not be capable to sustain the cost and the resources” needed over time. He said the framework creates a smaller regulated market, while ongoing staffing, reporting, security and capital requirements may remain difficult for some operators.
ESMA’s register serves as a public record of authorisation, not a rating of a company’s financial strength or service quality. The regulator also notes that register information may not appear immediately because national authorities first send the data to ESMA.
The addition of BNY and three German banks adds more traditional finance names to the MiCA system. At the same time, the new group includes payment companies, infrastructure providers and smaller crypto businesses. Future weekly files will show whether the number of authorised providers continues rising after the July 1 deadline.


Every legal event contract in America is listed by a designated contract market, a federal exchange license created for grain futures and now the most sought-after permission slip in crypto. Here is what a DCM actually is, what its holder must do, why the licenses have been changing hands, and what the status does and does not protect.
Summary
- A designated contract market is an exchange registered with the Commodity Futures Trading Commission under Section 5 of the Commodity Exchange Act, permitted to list futures, options, and event contracts and to serve retail customers directly.
- DCMs must comply continuously with 23 statutory core principles covering manipulation prevention, surveillance, rule enforcement, financial integrity, and recordkeeping, verified through periodic rule enforcement reviews.
- A DCM cannot function alone: contracts must clear through a registered derivatives clearing organization, and customer-facing brokerage generally involves a futures commission merchant, making the framework a three-license structure.
- The license became strategically valuable when prediction markets scaled: Kalshi obtained DCM status in 2021, Crypto.com assembled the full set of registrations, Gemini’s entity was certified, and Robinhood and Susquehanna acquired an existing licensed exchange and clearinghouse and rebranded it.
- Core Principle 3 makes the exchange the frontline regulator of its own market, an obligation the CFTC underlined in a 2026 advisory telling venues to vet event contract design and monitor trading as volumes grow.
The single most consequential fact about prediction markets in the United States is one almost nobody outside compliance departments can name: the specific federal registration that makes them legal. It is called a designated contract market, abbreviated DCM, and it was designed for exchanges trading futures on physical commodities. Nothing about grain or crude oil anticipated a contract on which party controls the Senate, yet the same registration category now underpins the entire American event-contract industry, from Kalshi’s political markets to the World Cup contracts routed through a Robinhood-affiliated venue. Understanding what a DCM is explains a great deal that otherwise looks arbitrary: why some platforms can serve US retail customers and others cannot, why exchanges have been bought rather than built, why the CFTC keeps addressing exchanges instead of traders, and what protection the license actually confers on someone with money at risk.
What the license is
A designated contract market is a board of trade, in the statute’s antique phrasing, that operates under CFTC oversight pursuant to Section 5 of the Commodity Exchange Act, with the detailed requirements set out in Part 38 of the Commission’s regulations.
Two features define it. First, breadth of product: a DCM may list futures and options contracts on all types of commodities, a category federal law defines expansively enough to include interest rates, indices, digital assets, and the occurrence of events. Second, breadth of access: a DCM may admit all types of traders, including retail customers, which is the property that matters most for this industry. Certain instruments, notably swaps, are generally off-limits to non-professional participants unless executed on a DCM, so the license is the mechanism by which ordinary people gain lawful access to products otherwise restricted to institutions.
Registration is not a one-time approval. A DCM must comply at all times with 23 core principles written into the statute, covering prevention of market manipulation, trade surveillance, position limits, financial integrity of transactions, protection of market participants, recordkeeping, and the operation of a credible self-regulatory program. The Commission’s Division of Market Oversight examines compliance through periodic rule enforcement reviews, which are exactly what the name suggests: audits of whether the exchange is enforcing its own rulebook.
The three-license structure
A DCM registration on its own does not produce a functioning market, and the reason clarifies most of the corporate activity in this sector.
Three categories divide the regulated derivatives stack. Futures commission merchants act as brokers, soliciting and accepting customer orders and holding customer margin in segregated accounts. Designated contract markets are the exchanges where contracts are listed and matched. Derivatives clearing organizations are the clearinghouses that guarantee trades, manage margin, and stand between counterparties to absorb default risk. Every contract a DCM lists must clear through a registered DCO, which means an exchange without clearing access is an exchange that cannot operate.
The separation is deliberate, designed to limit conflicts of interest by keeping the party that brokers orders, the party that matches them, and the party that guarantees them distinct. In practice the largest operators assemble more than one registration, which is why announcements of a firm obtaining its full set of licenses represent genuine capability expansion and not paperwork. It also explains why the assets changing hands in this sector tend to be exchange-and-clearinghouse pairs: buying only half the stack leaves the buyer dependent on someone else for the other half.
Why the license became valuable
For most of its history the DCM category was unglamorous infrastructure. Prediction markets changed that, and the sequence is worth following.
Kalshi obtained DCM designation in 2021, the first purpose-built prediction market to do so, and registered an affiliated clearinghouse in 2024, giving it the complete stack. That combination is what allowed a startup to offer federally regulated event contracts to American retail customers, and it converted regulatory status into the company’s primary competitive asset. As the category grew, the CFTC saw a marked increase in DCM applications from firms focused on prediction markets, enough that the Commission issued an advance notice of proposed rulemaking in March 2026 partly in response. A crypto-native exchange entity affiliated with Gemini was certified as a DCM, a notable expansion of the Commission’s willingness to license firms originating in digital assets, though the entity operates as a centralized venue with conventional clearing, fiat collateral, and standard identity checks. Crypto.com’s derivatives arm assembled the full complement of registrations. Interactive Brokers built ForecastEx.
And then came the transaction that revealed the license’s true nature as an asset: Robinhood, alongside Susquehanna International Group, acquired an existing CFTC-licensed exchange and clearinghouse, previously operating under other names, and rebranded it. That is the license changing hands. The regulatory standing that Kalshi spent years and litigation securing was, for a well-capitalized buyer, available for purchase. The Commission’s own rules even contemplate this pathway, with procedures for reinstating dormant contract markets that have stopped listing products. A license is a durable, transferable good, and the industry learned that lesson in public.
The frontline regulator burden
The obligation that shapes daily practice most is Core Principle 3, which requires a DCM to ensure the contracts it lists are not readily susceptible to manipulation and to conduct surveillance of trading in them.
The Commission spelled out what that means for event contracts in a March 2026 advisory addressed to DCMs, reminding them that these products sit fully under the Commodity Exchange Act and Part 38, pointing to Appendix C as the guide for listing and surveillance, and stating plainly that exchanges are the frontline regulators of their own markets. The advisory flagged sports and similar real-world contracts as higher risk, signaling that venues listing them face a higher bar to show the products are not gambling in substance, and it told exchanges to reassess compliance continuously as volumes and product complexity grow.
The practical translation is that a DCM is not merely a permission to list. It is an obligation to police: to vet whether each contract’s resolution criteria and underlying market can be manipulated, to monitor trading for abuse including by participants with non-public information, to enforce its rulebook against its own customers, and to document all of it for examination. The surveillance and enforcement programs that prediction market venues have been publicizing, screening tools blocking candidates from trading their own races, integrity vendors flagging athletes and officials, in-app reporting for suspicious activity, are core-principle compliance made visible, undertaken by exchanges that answer for their markets’ integrity in a way no offshore venue does.
How a firm actually gets one
The pathway matters, because the choice between applying and acquiring has shaped the competitive landscape more than any product decision.
The application route runs through Part 38 of the Commission’s regulations, with the criteria and procedures set out in the Commodity Exchange Act and elaborated in appendices providing guidance to applicants. A prospective DCM must show, in detail and in advance, how it will satisfy each core principle: the design of its contracts and why they resist manipulation, its trade surveillance systems and the staff running them, its rulebook and disciplinary procedures, its financial resources, its technology and system safeguards, its recordkeeping, its emergency authority, and its governance including conflict-of-interest arrangements. The submission is a description of an operating exchange written before the exchange operates, and the Commission reviews it against a statutory clock while asking questions. Firms in this space have described the process as measured in quarters, not weeks, and it consumes senior legal and compliance capacity throughout.
The acquisition route is faster and increasingly common. Licenses attach to entities, so buying the entity conveys the standing, subject to the Commission’s review of the change in control and continued compliance. The Commission’s rules also address contract markets that have gone dormant, meaning they hold designation but have stopped listing products: a dormant DCM must apply for reinstatement before listing or relisting, though the application may rely on previously submitted materials that still accurately describe conditions. That provision is the formal basis for what the market saw this year, when a licensed exchange and clearinghouse that had passed through multiple owners and business models was acquired and relaunched under a new name and a new strategy. The regulatory achievement of one era becomes the acquisition target of the next.
The strategic consequence deserves to be stated plainly, because it cuts against the intuition that regulation protects incumbents. In this category, the license is a purchasable input with a market price, and the durable advantages sit elsewhere: in distribution, in liquidity relationships, in brand, and in the compliance organization that keeps a venue in good standing once it has one. A startup that treats its DCM registration as its moat has misidentified its asset, and the events of this year in prediction markets are the demonstration.
What the license does and does not protect
For a participant deciding where to trade, the honest accounting has two columns.
What DCM status provides: a federally supervised venue subject to examination; contracts cleared through a registered clearinghouse that guarantees performance and manages default risk; customer funds held under the segregation rules applying to regulated derivatives intermediaries; exchange rules the venue is obliged to enforce; a surveillance program with a regulator checking that it functions; and a defined complaint and enforcement path when something goes wrong. Against an unlicensed offshore book, that is a substantial difference in kind.
What it does not provide: any guarantee that a contract is a good trade, any protection against losing the amount staked, any assurance that a market will resolve the way an ordinary reading of events suggests, or any immunity from the legal turbulence around the category. A DCM’s contracts remain subject to the Commission’s authority to review and prohibit products involving certain enumerated activities, state gaming regulators continue to contest sports contracts regardless of federal registration, and pending federal legislation could remove entire product categories from licensed venues. Registration answers the question of whether the venue is lawful. It does not answer whether the product will still be listed next year, which is the live question in this category and the reason product availability should be treated as provisional.
A closing note on the category’s odd historical shape, because it explains why the license fits prediction markets so imperfectly. The designated contract market framework was built for exchanges trading standardized futures on physical commodities, where the underlying is a bushel or a barrel, the participants are producers and processors hedging real inventory, and speculation exists to give those hedgers someone to trade with. Every core principle assumes that world: contract design that resists manipulation of a physical market, position limits protecting a deliverable supply, surveillance aimed at cornering. Event contracts arrive with no deliverable supply, no producers, and an underlying that is an occurrence rather than a commodity, and the framework has been asked to stretch across that gap by analogy.
It has stretched further than most observers expected, which is a testament to how broadly federal law defines a commodity, and the strain is visible in exactly the places the industry fights: whether a contract on a game “involves gaming,” whether an exchange can meaningfully surveil manipulation of an election, whether position limits mean anything on a binary payout. The pending rulemaking on public-interest determinations is the Commission’s attempt to fit the old frame to the new object, and the parallel legislative proposals are attempts to decide the question in one move instead. Either way, the underlying reality is worth carrying: the entire American prediction market industry operates on a permission structure designed for grain, and the fit is the argument.
A final orientation point for readers tracking the sector. Because the license is the gate, most of the important news in prediction markets is license news, and it is usually reported in language that obscures the stakes. An exchange “receiving CFTC approval” may mean a full designation, an amendment expanding an existing registration, a clearinghouse registration completing a stack, or a change-of-control approval following an acquisition, and those are very different events with very different competitive consequences. A firm “self-certifying” a contract is not receiving approval at all. And an entity described as “CFTC-regulated” may hold any one of the three registrations, only one of which permits listing contracts for retail trading.
Reading these announcements precisely is the difference between understanding the competitive map and repeating a press release. The questions worth asking of any such story are simple: which registration, held by which legal entity, permitting what activity, and does the group also control clearing. Answer those four and the strategic meaning of almost any development in this sector becomes legible, including the ones the participants would prefer to leave vague. Crypto.news has also explained the product these venues list,what a DCM may do without asking,the industry these licenses built, and the wider regulatory structure.
Frequently asked questions
What does DCM stand for and what is it?
Designated contract market: an exchange registered with the Commodity Futures Trading Commission under Section 5 of the Commodity Exchange Act and Part 38 of the Commission’s regulations. DCMs may list futures, options, and event contracts on all types of commodities, and may admit retail customers directly, which is what makes lawful retail access to these products possible in the United States.
Why do prediction markets need this specific license?
Because event contracts are derivatives under federal law, and only a registered exchange may list them for trading by US customers. Without DCM status a venue cannot lawfully offer these products to American retail participants, which is why every domestic prediction market operates through one, either obtained directly or acquired.
What are the core principles?
Twenty-three statutory requirements a DCM must satisfy continuously, covering prevention of manipulation, contract design, trade surveillance, position limits, financial integrity, participant protection, recordkeeping, and self-regulation. The CFTC’s Division of Market Oversight verifies compliance through periodic rule enforcement reviews, which examine whether the exchange actually enforces its own rulebook.
Can an exchange operate with a DCM license alone?
No. Every contract listed on a DCM must clear through a registered derivatives clearing organization, and customer brokerage generally involves a futures commission merchant. The three registrations serve different functions, brokering, listing, and clearing, and are deliberately separated to limit conflicts of interest, which is why major operators assemble more than one.
Why have companies been buying DCMs rather than applying?
Because the license is a transferable asset and applications take time. Robinhood and Susquehanna acquired an existing licensed exchange and clearinghouse and rebranded it, obtaining in a transaction the standing that a startup builds over years. The Commission’s rules even provide for reinstating dormant contract markets, making acquisition a recognized pathway.
What is Core Principle 3 and why does it matter for event contracts?
It requires a DCM to list only contracts not readily susceptible to manipulation and to conduct surveillance of trading in them. The CFTC’s March 2026 advisory applied this directly to prediction markets, describing exchanges as the frontline regulators of their own venues, pointing to Appendix C for listing and surveillance guidance, and flagging sports contracts as higher risk requiring a stronger showing that they are not gambling in substance.
Does trading on a DCM make me safe?
Safer in specific, limited ways. You get a supervised venue, clearinghouse-guaranteed performance, customer fund segregation, enforceable exchange rules, and a regulator with examination authority. You do not get protection from losing your stake, assurance that a market resolves as you expect, or immunity from the legal uncertainty around the category, including the possibility that specific contract types are prohibited.
Can the CFTC stop a DCM from listing a contract?
Yes, under a special provision of the Commodity Exchange Act permitting the Commission to prohibit event contracts that involve certain enumerated activities, including gaming and activity unlawful under state law, when it determines they are contrary to the public interest. The Commission has used that authority against political contracts and proposed a rulemaking in June 2026 to define the process and terms more clearly. This is educational information, not investment or legal advice.
Disclaimer: This article is for information and educational purposes only and does not constitute financial, investment, or legal advice. Regulatory requirements, license holdings, and product availability change, and the legal treatment of event contracts is subject to active litigation, rulemaking, and pending legislation. Always do your own research. Information is accurate as of July 27, 2026.


U.S. District Judge Analisa Torres denied KalshiEX’s request for an emergency injunction pending appeal on July 27 in KalshiEX LLC v. Williams.
Summary
- Judge Analisa Torres denied Kalshi emergency relief while its Second Circuit appeal remains pending separately.
- Kalshi failed to show strong appellate prospects, irreparable harm, favourable equities, or public interest support.
- The court independently read federal law and declined to defer to the CFTC’s proposed interpretation.
The Southern District of New York also rejected Kalshi’s alternative request for short-term administrative relief. The three-page order does not dismiss Kalshi’s appeal or resolve the underlying lawsuit. It only denies protection from New York enforcement while the appellate dispute continues.
Kalshi appealed after Torres denied its preliminary-injunction motion on July 7. That earlier ruling found that the Commodity Exchange Act likely does not preempt New York gambling laws as applied to Kalshi’s sports-event contracts. The appeal was filed with the Second Circuit as case number 26-1835.
Kalshi emergency injunction failed a higher legal test
An injunction pending appeal requires a stronger showing of likely success than an ordinary preliminary injunction. Torres said Kalshi had not met any of the four factors in the earlier proceeding and had not identified unusual circumstances that justified reversing that result.
Kalshi argued that it faced a choice between violating New York law or complying with the state and risking its federal registration. Torres found the alleged registration risk speculative. She also said the expected compliance costs were largely monetary and generally did not qualify as irreparable harm.
The CFTC proposal did not bind the court
Kalshi pointed to the CFTC’s June proposed rule, which states that the Commodity Exchange Act expressly preempts state laws regulating transactions on CFTC-registered exchanges. The Commission also proposed standards for reviewing event contracts involving gaming, unlawful conduct, war, terrorism and assassination.
Torres did not invalidate or formally reject the proposed rule. Instead, she said courts must independently interpret statutes under the Supreme Court’s Loper Bright decision. She maintained her earlier view that the Commodity Exchange Act does not displace every state gambling law governing transactions involving swaps. The proposal’s public-comment period closed on July 27, but it is not a final rule.
A separate Second Circuit request remains unresolved
The district-court denial is separate from Kalshi’s emergency request at the Second Circuit. New York regulators urged the appeals court on July 27 to deny that request. As of the latest available reporting, no Second Circuit order resolving the emergency motion had been published.
The appellate court can now decide whether to grant temporary relief and later review Torres’s July 7 preemption analysis. The underlying lawsuit has not been finally decided. As previously reported, the July 7 ruling left New York free to apply its gambling laws unless an appellate court intervenes.
Conflicting rulings leave prediction-market law unsettled
Federal courts have reached different conclusions on the jurisdiction question. In April, the Third Circuit ruled 2-1 that New Jersey could not regulate Kalshi’s sports-event contracts because they fell within the CFTC’s exclusive jurisdiction. Courts in New York and several other states have taken a narrower view of federal preemption.
The split widened on July 27 when a Minnesota federal judge temporarily blocked that state’s direct prediction-market ban. The judge found that several Kalshi and Polymarket contracts likely met the federal definition of swaps, while warning that later relief could cover fewer products. In related coverage, crypto.news examined the platforms’ widening state-by-state legal battle.
Kalshi has also faced restrictions elsewhere. Washington judge blocked its sports contracts under state gambling law. The CFTC, meanwhile, has sued multiple states and continues to argue that federally registered exchanges should operate under one national derivatives framework.
The next immediate event is the Second Circuit’s decision on Kalshi’s emergency motion. After that, the court will consider the merits of the appeal, including whether New York’s laws are preempted. The CFTC may also revise or finalise its prediction-market proposal after reviewing comments, but it has announced no deadline for a final rule.


The stablecoin market contracted in June 2026 even as transaction activity reached a record.
Summary
- $7.7 billion left stablecoins in June, cutting total market capitalization to approximately $312 billion overall.
- $1.79 trillion in adjusted June transfers marked a record, rising 63% from May levels overall.
- USDC processed about $1.21 trillion, while USDT handled roughly $576 billion in June’s adjusted dataset.
CoinDesk Data reported on July 6 that market capitalization fell 2.39%, or about $7.7 billion, to $312 billion. It was the first month-end decline in five months and the largest monthly dollar reduction since the Terra-Luna collapse in May 2022.
The supply decline did not produce a matching fall in on-chain activity. Visa’s Allium-powered dashboard recorded $1.79 trillion in adjusted transaction volume for June, up 63% from May and 125% from June 2025. USDC accounted for about $1.21 trillion, compared with roughly $576 billion for USDT.
As previously reported, the market had fallen roughly $10 billion below its May peak by mid-July. DefiLlama’s stablecoin dashboard placed total capitalization at about $309.9 billion on July 28, down 0.79% over 30 days. USDT remained the largest token at roughly $183.9 billion, while USDC stood near $73.7 billion.
The stablecoin market decline was modest, not Terra-like
The phrase “biggest drop since Terra” describes the dollar amount of the June decline, not the severity of the event. A 2.39% monthly contraction was far smaller than the 2022 collapse. CoinGecko found that the leading stablecoins lost $33.9 billion, or almost one-fifth of their value, during the second quarter of 2022 as UST failed and wider crypto credit markets broke down.
June 2026 also lacked the defining feature of the Terra crisis: a major market-wide depeg. DefiLlama showed both USDT and USDC trading close to $1 on July 28. The contraction occurred through lower circulating supply rather than a comparable collapse in token prices.
Data providers report different totals because they track different assets and apply different classification rules. CoinDesk Data measured the market at $312 billion at the end of June. CoinGecko’s Q2 industry report put the quarter-end total at $305.1 billion and reported a $4.8 billion, or 1.6%, quarterly decline. CoinGecko described it as the first quarterly contraction since Q3 2023.
That distinction makes the claim that the market shrank “for the first time in four years” too broad. CoinDesk Data recorded the first monthly decline in five months, while CoinGecko recorded the first quarterly decline since Q3 2023. Both datasets show a pullback, but neither supports treating June as the first contraction of any kind since Terra.
Record volume shows faster turnover, not only payments
Visa’s adjusted transaction figure is more useful than raw blockchain volume, but it is not a pure payments measure. The dashboard removes known bot activity, intra-exchange transfers, redundant smart-contract movements and wallets that cross high-frequency or high-volume thresholds. It also counts only the largest stablecoin amount transferred within a complex transaction.
However, Visa’s adjusted categories still include exchange deposits and withdrawals, decentralized exchange trades, lending, investment funds, minting and burning, and on- and off-ramp activity. The $1.79 trillion total therefore measures filtered economic movement. It should not be described as $1.79 trillion of purchases, remittances or merchant settlement.
The June data still show a clear divergence between supply and usage. USDC moved about $1.21 trillion despite having less than half USDT’s circulating supply. USDT handled roughly $576 billion while remaining the larger token by market capitalization. As previously reported, USDC has built a sustained lead over USDT in adjusted transfer value.
A smaller float can support greater volume when each token changes hands more often. June’s record, combined with lower supply, is consistent with rising turnover. It does not identify who sent the money, why it moved or whether the activity generated payment revenue.
A separate McKinsey and Artemis analysis shows the measurement gap. The firms estimated identifiable stablecoin payments at about $390 billion during 2025, or roughly 0.02% of global payment volume. B2B payments accounted for about $226 billion, while much of the wider on-chain total came from trading, internal transfers and automated activity. Stablecoin usage is growing, but filtered blockchain movement and real-world payments remain different datasets.
Yield products may explain only part of the shift
The expansion of tokenized Treasury products offers a plausible destination for some capital leaving non-yielding stablecoins. RWA.xyz placed tokenized U.S. Treasury value at about $16.2 billion in late July. DefiLlama listed Circle’s USYC near $3 billion and BlackRock’s BUIDL near $2.64 billion on July 28.
The rotation argument has an economic basis. Payment stablecoins aim to maintain a fixed value and generally do not pass reserve income directly to holders. Tokenized Treasury funds can provide exposure to short-term government debt while remaining on-chain. Treasurers may therefore hold idle balances in yield products and convert into stablecoins nearer to settlement.
Still, public data do not prove that the full $7.7 billion decline moved into tokenized funds. Aggregate growth cannot trace every subscription. Capital may also have returned to bank deposits, funded crypto sales, moved between excluded categories or left digital-asset markets.
CoinDesk Data found that total tokenized asset capitalization rose 1.75% to $30.1 billion in June while stablecoin supply fell. That supports a broader shift toward tokenized financial products, but it does not establish a direct one-for-one transfer.
CoinGecko also found that some yield-linked crypto dollars contracted during Q2. USDS fell 16.4%, while USDe declined 24.4%. CoinGecko attributed the reductions partly to yields falling below the risk-free rate and users unstaking related products. The evidence points to selective rotation rather than a uniform move into yield.
U.S. rules and July issuance will shape the next move
The regulatory backdrop remains unfinished. The GENIUS Act was enacted on July 18, 2025 and created a federal framework for payment stablecoin issuers. The Office of the Comptroller of the Currency’s proposed rules cover reserves, redemption, risk management, reporting, custody and supervision.
The law is scheduled to take effect on January 18, 2027, or 120 days after federal regulators issue final implementing rules, whichever comes first. Regulators had not completed the full rulebook by July 28. As crypto.news reported, the one-year rulemaking deadline passed with multiple proposals awaiting final action.
One live deadline concerns customer identification. A joint federal proposal would require permitted payment stablecoin issuers to establish risk-based procedures for identifying and verifying customers. Comments are due by August 21, 2026.
The FDIC also issued proposed reporting forms on July 17, with comments due 60 days after publication in the Federal Register. These filings would establish regular financial and operational reporting for payment stablecoin issuers under FDIC supervision.
These rules may change where stablecoins are issued and held. They can also affect competition between U.S.-oriented products such as USDC and offshore-focused products such as USDT. In related coverage, industry groups disputed whether proposed rules extend yield restrictions too far toward third-party reward programmes.
The next evidence will come from issuer mint-and-burn data, month-end supply, peg stability and adjusted transaction volume. A return to net issuance would support the view that June was temporary. Continued redemptions would point to a longer contraction in on-chain dollar liquidity.
June supports two conclusions at once. Stablecoin supply weakened, but the remaining tokens moved at a record adjusted rate. Market capitalization measures the size of the float, while adjusted volume measures how actively it circulates. Neither metric can replace the other.


Kraken parent Payward entered a definitive agreement on July 27 to acquire Magic Labs’ wallet-as-a-service business through an asset purchase.
Summary
- Payward will acquire Magic Labs’ wallet business, adding infrastructure that has powered 60 million wallets.
- The wallet platform processed over $10 billion in stablecoin volume for more than 200,000 developers.
- Newton Labs will focus on pre-settlement policy checks after the transaction closes in coming weeks.
The financial terms were not disclosed, and the companies expect the transaction to close within several weeks, subject to customary closing conditions.
The deal covers Magic’s embedded, non-custodial wallet infrastructure rather than the entire company. Magic Labs has rebranded as Newton Labs and will remain independent while concentrating on Newton Protocol, its policy and authorisation system for onchain transactions.
Payward adds embedded wallets to its B2B platform
Payward plans to integrate Magic’s technology into Payward Services, its infrastructure platform for banks, fintech companies, exchanges and onchain applications. The existing platform provides trading, custody, tokenised assets, derivatives and fiat-to-crypto payment services through one integration.
Magic adds a wallet layer to that product range. Its stack combines a trusted execution environment-based signing system, an embedded integration layer and a developer software development kit. Payward said partners will be able to add self-custody wallets without managing several separate infrastructure providers.
The companies describe the wallets as non-custodial, meaning users retain control of their assets rather than placing them directly under Payward’s custody. However, the exact user experience and supported networks may vary between businesses using the infrastructure.
Magic wallet customers will move to Payward Services
Magic’s wallet infrastructure has powered more than 60 million wallets and over $10 billion in stablecoin volume. It has also served more than 200,000 developers since the company began operating in 2018, according to the acquisition announcement.
Newton Labs CEO Sean Li said existing wallet customers would begin receiving service from Payward on August 1. He said current integrations would continue without interruption and customers would not need to take action. The legal completion of the acquisition, however, remains subject to the stated closing conditions.
Magic had previously raised more than $80 million. That total included a $52 million strategic round led by PayPal Ventures in May 2023, with participation from Cherubic, Synchrony, KX, Northzone and Volt Capital.
Newton Labs will concentrate on transaction policies
Newton Labs will now focus on Newton Protocol, which entered mainnet beta on June 23. The protocol checks whether transactions comply with predefined security, identity, compliance and risk rules before they settle onchain. It then generates a cryptographic record of the policy decision.
Its first product, VaultKit, allows decentralised finance vault operators to apply policy checks to management actions. Newton said the software currently supports Ethereum and Base, with integrations involving risk, price and security providers including RedStone, Credora, Webacy and Chainalysis Hexagate.
Newton intends to expand the system beyond vaults to stablecoins, tokenised real-world assets and automated financial agents. Those plans remain company targets rather than completed product launches.
The acquisition extends Payward’s infrastructure push
The Magic agreement follows several acquisitions intended to broaden Payward beyond Kraken’s spot exchange business. As previously reported, Payward completed its purchase of CFTC-regulated derivatives firm Bitnomial in May after announcing a deal worth up to $550 million.
Payward also completed its acquisition of Hong Kong stablecoin payments company Reap in July. In related coverage, the transaction was initially valued at $600 million and added card issuance, cross-border settlement and stablecoin payment infrastructure to Payward Services.
The company previously bought retail futures platform NinjaTrader for $1.5 billion in 2025 and tokenised securities provider Backed Finance for an undisclosed amount. Together, the deals expand Payward’s coverage across trading, wallets, payments, custody, derivatives and tokenised assets.
No verified market reaction accompanied the Magic announcement because Payward and Newton Labs are privately held, while the acquisition does not involve a publicly traded token. The next confirmed steps are completion of the asset purchase, customer migration and integration of Magic’s wallet technology into Payward Services.
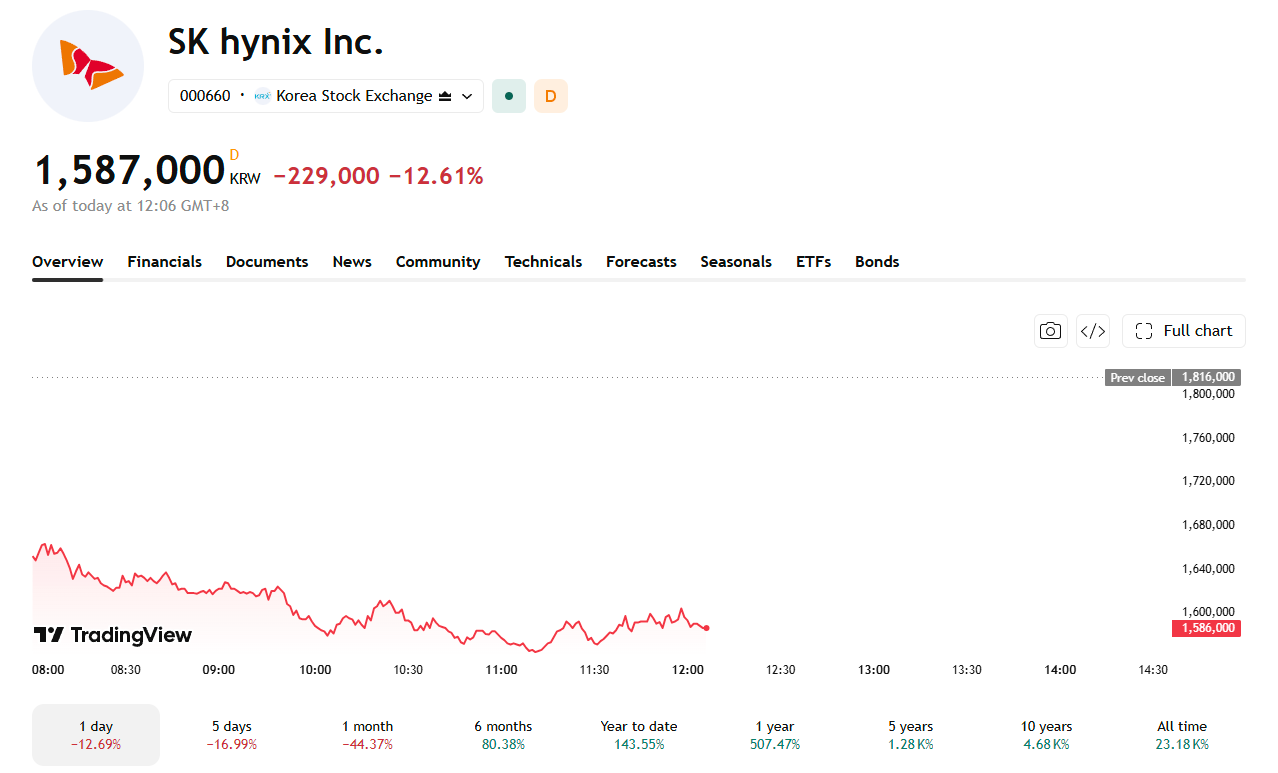
SK Hynix fell near 13% on Tuesday, July 28, in early trading. Samsung Electronics also dropped over 12% as the sell-off swept across Asian markets.
The sell-off erased billions in market value across Korea, Japan, and Taiwan in a single session. It extended a broader pullback in AI-linked chipmakers that began after Wall Street’s own chip stocks weakened.
Wall Street Contagion and Nvidia’s OpenAI Bet Spook Investors
U.S. chip stocks weakened again overnight, adding losses at AMD, Teradyne, and Micron. That weakness followed a a Wall Street Journal story on Nvidia’s financing plans.
Nvidia is reportedly negotiating a $250 billion guarantee to help OpenAI lease a 10-gigawatt data center campus in Ohio. OpenAI lacks an investment-grade credit rating. The project could cost more than $500 billion in total.
Nvidia is also discussing financing for OpenAI’s chip purchases, worth up to $350 billion more. Meanwhile, investors have questioned whether Nvidia’s financial backstop role signals fragility in AI-linked demand, not strength.
China’s CXMT Listing Sharpens the Competitive Threat
Chinese memory maker CXMT added to the pressure. Its shares rose as much as 500% from their IPO price during Monday’s Shanghai trading debut. That rally valued CXMT near $515 billion.
Separately, a state-backed Chinese firm has begun mass-producing homegrown deep ultraviolet lithography machines for SMIC, Hua Hong, and CXMT. The move reduces Beijing’s reliance on Dutch equipment maker ASML for advanced chipmaking tools.
Analysts at Seoul Economic Daily estimate the high-bandwidth memory gap between CXMT and Korean leaders has narrowed to three years. That gap exceeded five years in earlier estimates. Therefore, the narrowing threatens the AI chip deals SK Hynix and Samsung have signed with U.S. hyperscalers.

No One Knows How AI Spending Pays Off
Owen Lamont, senior vice president at Acadian Asset Management, said the uncertainty runs deeper than any single headline.
“Right now we’re facing an incredible uncertainty. No one has any idea how this AI process is going to affect our economy, and so I think it’s going to be rocky no matter what.”
Owen Lamont, CNBC
Lamont added that leveraged exchange-traded products may be magnifying the swings. He named Korea, Hong Kong, and the United States as key markets for this activity.
However, not every analyst is as bearish. Sundeep Gantori, chief investment officer for equities at Standard Chartered, argued the long-term opportunity remains intact for memory makers. He pointed to broker forecasts of a 2027 price peak.
Investors now turn to SK Hynix’s quarterly earnings later this week. The results could show whether AI-linked demand still justifies the volatility.
The post AI Memory Stocks on Rocky Ground: 3 Reasons SK Hynix Fell 13% appeared first on BeInCrypto.


Microsoft CEO Satya Nadella says any firm that gives up control of its AI data will not remain a firm.
The remarks extend a July 12 blog post where Nadella described what he calls the reverse information paradox. Companies, he argued, pay for intelligence twice: first with money, then with proprietary knowledge.
Why Microsoft CEO Says AI Buyers Give Away Their Knowledge
In the interview with Fareed Zakaria, Nadella limited his warning to businesses. Consumers, he said, trade data for free services under the advertising model.
Firms face a different decision, he said. A company that creates knowledge needs that knowledge to stay inside the firm
He told CNN that companies now hold token capital alongside human capital. The term describes the AI capability and models a firm builds and owns. Nadella outlined the concept in June.
The July 12 post spells out the mechanism behind the warning. Providers, Nadella wrote, learn from customer prompts, corrections, and agent activity. That learning flows in one direction.
“AI creates the reverse problem. In the AI age, the buyer risks giving away knowledge, just in order to use what they bought,” the executive noted.
Follow us on X to get the latest news as it happens
The Fix Nadella Prescribes for AI-Reliant Companies
Nadella told Zakaria that firms should retain the metadata from every model interaction. That data could later train a company’s own weights or model, he said.
He also called for legal change. Patents, copyrights, and trademarks all protect sellers, he noted. AI, in his view, marks the first time buyers need protective rights of their own.
Short of a new law, he offered a technical route. Companies should keep the harness, context, and memory separate from any single model. That structure lets firms use several models and stay in control if one disappears.
For companies lacking that control, Nadella framed the stakes as existential.
“(A) firm that doesn’t have this control, I will claim, will not remain a firm because you’ve essentially outsourced your thinking,” he said.
Zakaria noted the argument benefits Microsoft, whose business model relies on commoditizing the model space. Nadella responded that the issue is not firm-specific, since any company lacking that control faces the same outcome.
Subscribe to our YouTube channel to watch leaders and journalists provide expert insights
The post Microsoft CEO Says Firms That Skip This Step Stop Being Firms appeared first on BeInCrypto.


Zimbabwe’s securities regulator listed seven fintech projects as approved regulatory sandbox participants on July 24, with tokenization accounting for four of the projects.
Summary
- Seven fintech projects received SECZ approval for supervised testing, with four focused directly on tokenization.
- Sandbox admission allows live trials but does not guarantee commercial registration after testing concludes successfully.
- Approved projects span blockchain fundraising, crowdfunding, synthetic trading, asset tokenization, securities, and infrastructure markets locally.
The Securities and Exchange Commission of Zimbabwe named Zimbabwe Entrepreneurship Exchange, Ndarama Standard, Questview Brokers, Crowdaxe Capital, Procode Platforms, Financial Securities Exchange and Colmin Resources Zimbabwe.
The projects will test products under SECZ supervision rather than immediately begin unrestricted commercial operations. The regulator’s framework defines a sandbox as a controlled environment for testing eligible financial technology with live users and set operating limits.
Zimbabwe’s sandbox places tokenization at the centre
Zimbabwe Entrepreneurship Exchange will test a blockchain-based capital-raising platform. Ndarama Standard focuses on asset tokenization, while Questview Brokers will test synthetic trading. Crowdaxe Capital operates a web-based crowdfunding platform intended to connect businesses seeking capital with investors.
The remaining projects deepen the tokenization focus. Procode Platforms is testing securities tokenization, FINSEC is working on an asset-tokenization market, and Colmin Resources Zimbabwe is developing an infrastructure-tokenization project. Industry disclosures show that FINSEC and Zimbabwe Entrepreneurship Exchange had received project-specific regulatory approvals before SECZ published the consolidated participant notice.
Sandbox approval is not a commercial licence
SECZ’s Regulatory Sandbox Guidelines allow licensed securities intermediaries, prospective licensees and partnerships between the two to apply. Eligible categories include crowdfunding, alternative investment platforms, automated advice, artificial intelligence and other products accepted by the commission.
Participants must operate within an approved testing plan covering customer limits, transaction exposure, risk controls, disclosures and procedures for handling losses or complaints. SECZ can relax selected requirements during a test, but it can also revoke admission following a failed test, unresolved regulatory gaps, liquidation or breaches of sandbox conditions.
The rules state that testing must last at least 12 months. SECZ may approve an extension, although the additional period cannot exceed another 12 months. Successful testing does not automatically authorise a nationwide launch.
Tokenized projects still face separate regulatory duties
At the end of testing, SECZ may issue an existing licence, provide a conditional no-objection letter, create new product-specific requirements or deny permission to operate. Participants must also prepare an exit plan protecting customers if a trial ends without approval.
Tokenization approval under the securities sandbox should not be treated as general cryptocurrency or virtual asset service provider registration. Zimbabwe introduced separate anti-money laundering requirements for businesses that exchange, transfer, store or control virtual assets. As previously reported, crypto firms must register under Zimbabwe’s new VASP framework, which places covered activities under Reserve Bank of Zimbabwe oversight.
The distinction will matter when projects choose their underlying technology and operating model. A platform could fall under both securities supervision and virtual-asset rules if it tokenizes investments while also providing custody, exchange or transfer services.
SECZ will determine which projects can launch
SECZ says the sandbox is intended to generate evidence for future policy while supporting investor protection, financial stability and market integrity. The commission can monitor participants, impose further operational requirements and use testing results when updating securities rules.
No full commercial launch date or verified market reaction accompanied the July notice. The next formal steps will be the start of controlled trials, regulatory reporting and SECZ’s assessment of whether each project meets licensing requirements.
In related coverage, Zimbabwe sought public input on a broader crypto framework in 2024. The country has also experimented with state-backed digital finance, including its gold-backed digital token and ZiG currency. The latest sandbox programme is narrower because it concentrates on capital-market products rather than monetary policy.
A U.S. federal judge on July 27 granted Kalshi, Polymarket US and the Commodity Futures Trading Commission preliminary relief from Minnesota’s prediction market ban.
Summary
- Judge Katherine Menendez blocked Minnesota’s prediction market law before its August 1 effective date statewide.
- The injunction protects CFTC-registered contract markets while three lawsuits continue toward final decisions on merits.
- Minnesota may seek narrower enforcement because the judge questioned whether every event contract qualifies legally.
Judge Katherine Menendez barred officials from enforcing Minnesota Statute 609.7615 against entities registered with the CFTC as designated contract markets. The July 27 order arrived five days before the law’s August 1 start date and remains effective until the court reaches a final decision.
Minnesota’s measure would make creating, operating or facilitating a covered prediction market a felony. It would also criminalize certain support, data and payment services, as well as advertising products that promote prohibited transactions. The state statute covers markets tied to sports, elections, government action, legal cases, popular culture and several other events. It was the first state measure designed to prohibit prediction markets directly, rather than applying an existing gaming law to selected contracts.
Kalshi and Polymarket won on federal preemption
Menendez found that the plaintiffs were likely to succeed, at least partly, on their express-preemption claims. The Commodity Exchange Act gives the CFTC “exclusive jurisdiction” over swaps traded on federally registered contract markets. The judge concluded that Minnesota’s across-the-board prohibition would probably reach many transactions reserved for federal oversight.
The court also found that the plaintiffs faced irreparable harm and that the balance of harms supported temporary relief. However, the ruling is not a final judgment that Minnesota’s law is invalid. Menendez described it as a preliminary assessment intended to preserve the existing position while the cases proceed. She did not decide the companies’ implied-preemption or First Amendment claims.
The temporary injunction could become narrower
The injunction protects CFTC-registered designated contract markets rather than every prediction market or event contract provider. Kalshi and QCX LLC, which operates as Polymarket US, are parties in separate cases considered alongside the federal government’s challenge during the preliminary-injunction process.
Menendez also rejected the idea that registration alone resolves every contract’s legal status. She said the plaintiffs had not shown that every event contract on the two platforms meets the federal definition of a swap. A weather or crop contract may have an economic consequence, while some sports propositions may not. Permanent relief could therefore cover fewer products than the current injunction.
Minnesota will continue defending its ban
Minnesota Attorney General Keith Ellison said he disagreed with the decision and would continue defending the law. He described prediction markets as gambling and argued that Minnesota may protect residents from unlicensed activity. Kalshi said the ruling confirmed that states cannot ban products outside their jurisdiction, while Polymarket also welcomed the order.
The Minnesota result does not settle the wider state-federal dispute. Massachusetts, Michigan, Nevada and Washington have obtained orders restricting parts of Kalshi’s activity. In related coverage, Kalshi and Polymarket lost bids to halt proceedings in Nevada and Washington, while a separate Michigan order temporarily restricted Kalshi’s sports contracts.
CFTC rules could shape what happens next
The three Minnesota lawsuits now move toward final decisions on the merits. The injunction keeps the challenged criminal provisions from applying to CFTC-registered contract markets during that process. The court may later examine specific contract categories and decide whether federal preemption protects all, some or none of them.
A parallel CFTC rulemaking may also define the boundary. The regulator’s June proposal would create a contract-by-contract process for reviewing event contracts involving gaming, war, terrorism, assassination or unlawful conduct. Its public-comment period closed on July 27. As previously reported, the proposed framework could directly affect Kalshi and Polymarket by establishing formal public-interest tests for listed contracts.
Earlier on July 27, the CFTC had asked the court to rule before the August 1 deadline and indicated that it could seek emergency appellate relief if no decision arrived. Kalshi and Polymarket joined that request. The injunction removed that immediate deadline, but Minnesota’s attorney general has made clear that the underlying jurisdiction dispute will continue.


The preliminary injunction allows Kalshi and Polymarket US to continue operating in Minnesota while the court considers their challenge to the state law.

From Financial Stress to Financial Stability
Emmerdale star confirms Charity and Dr Todd showdown – and teases Sadie King return

Regis Aged Care submits $50m Shenton Park plan


-

 Fashion4 days ago
Weekend Open Thread: Brooks Brothers
-

 Crypto World7 days ago
Grayscale Files For Worldcoin ETF, WLD Registers Sharp Rise
-

 NewsBeat7 days ago
How a former Blue Peter presenter stunned America’s Got Talent judges
-

 Tech1 day ago
Intel is reversing course and bringing hyper-threading back to its server chips
-
 Business6 days ago
New Jersey voter registration controversy explained: How 6,600 noncitizens got on the rolls, and what happens next
-
 Entertainment6 days ago
Johnny Depp’s R-Rated Gothic Cult Classic Gets New Release Ahead of Sydney Sweeney Remake
-

 Crypto World5 days ago
Ethics, other provisions in crypto Clarity Act to be further discussed
-

 Politics19 hours ago
Luke Littler dismantles Gerwyn Price to retain title in Blackpool
-
 Sports1 day ago
Commonwealth Games boxing: Jadumani Singh seals dominant 5-0 win over Pakistan’s Sumama Rehman to enter quarter-finals | Commonwealth Games News
-

 Sports4 days ago
2026 3M Open leaderboard: Scottie Scheffler finds putter in Round 1, sits three back
-

 Fashion4 days ago
16 Dresses for the High Summer Event
-

 News Videos4 days ago
The Peugeot Family: How 200 Years of an “Old Money” Dynasty Died in A Boardroom
-

 Politics2 days ago
Spain sweeps the board at 2026 World Cup with individual awards
-
 Entertainment4 days ago
A New Post-Apocalyptic Gundam Anime Series Blasts Into SDCC
-

 News Videos1 day ago
BITCOIN JUST ENTERED THIS CRITICAL ZONE…
-

 Crypto World2 days ago
XRP Ledger adds $2.6B as RWA inflows rank second
-

 Crypto World5 days ago
Uniswap (UNI) pushes deeper into tokenized RWAs with permissioned trading pools
-

 Crypto World6 days ago
Sablier Labs Enters Maintenance Mode, Halts Development
-
Crypto World5 days ago
SEC Agrees to Overhaul Recordkeeping After Settling Coinbase Lawsuit Over Gensler’s Lost Texts
-

 Business4 days ago
Alliance Entertainment Holding Corporation (AENT) Discusses Evolution Into Omnichannel Distribution and Fulfillment Platform for Media and Collectibles Transcript
You must be logged in to post a comment Login