
Crypto World
Is $1,500 Next for ETH After the ‘Aggressive Deleveraging’?
Ethereum has entered an aggressive deleveraging phase, breaking decisively lower after weeks of distribution near the upper boundary of its medium-term range. A key macro driver behind this move appears to be the recent escalation of geopolitical tensions in the Middle East, which has pushed broader risk assets into de-risking mode and amplified existing technical fragilities in the ETH market.
The combination of macro uncertainty, elevated leverage, and vulnerable chart structure has produced a sharp unwind rather than a controlled pullback.
Ethereum Price Analysis: The Daily Chart
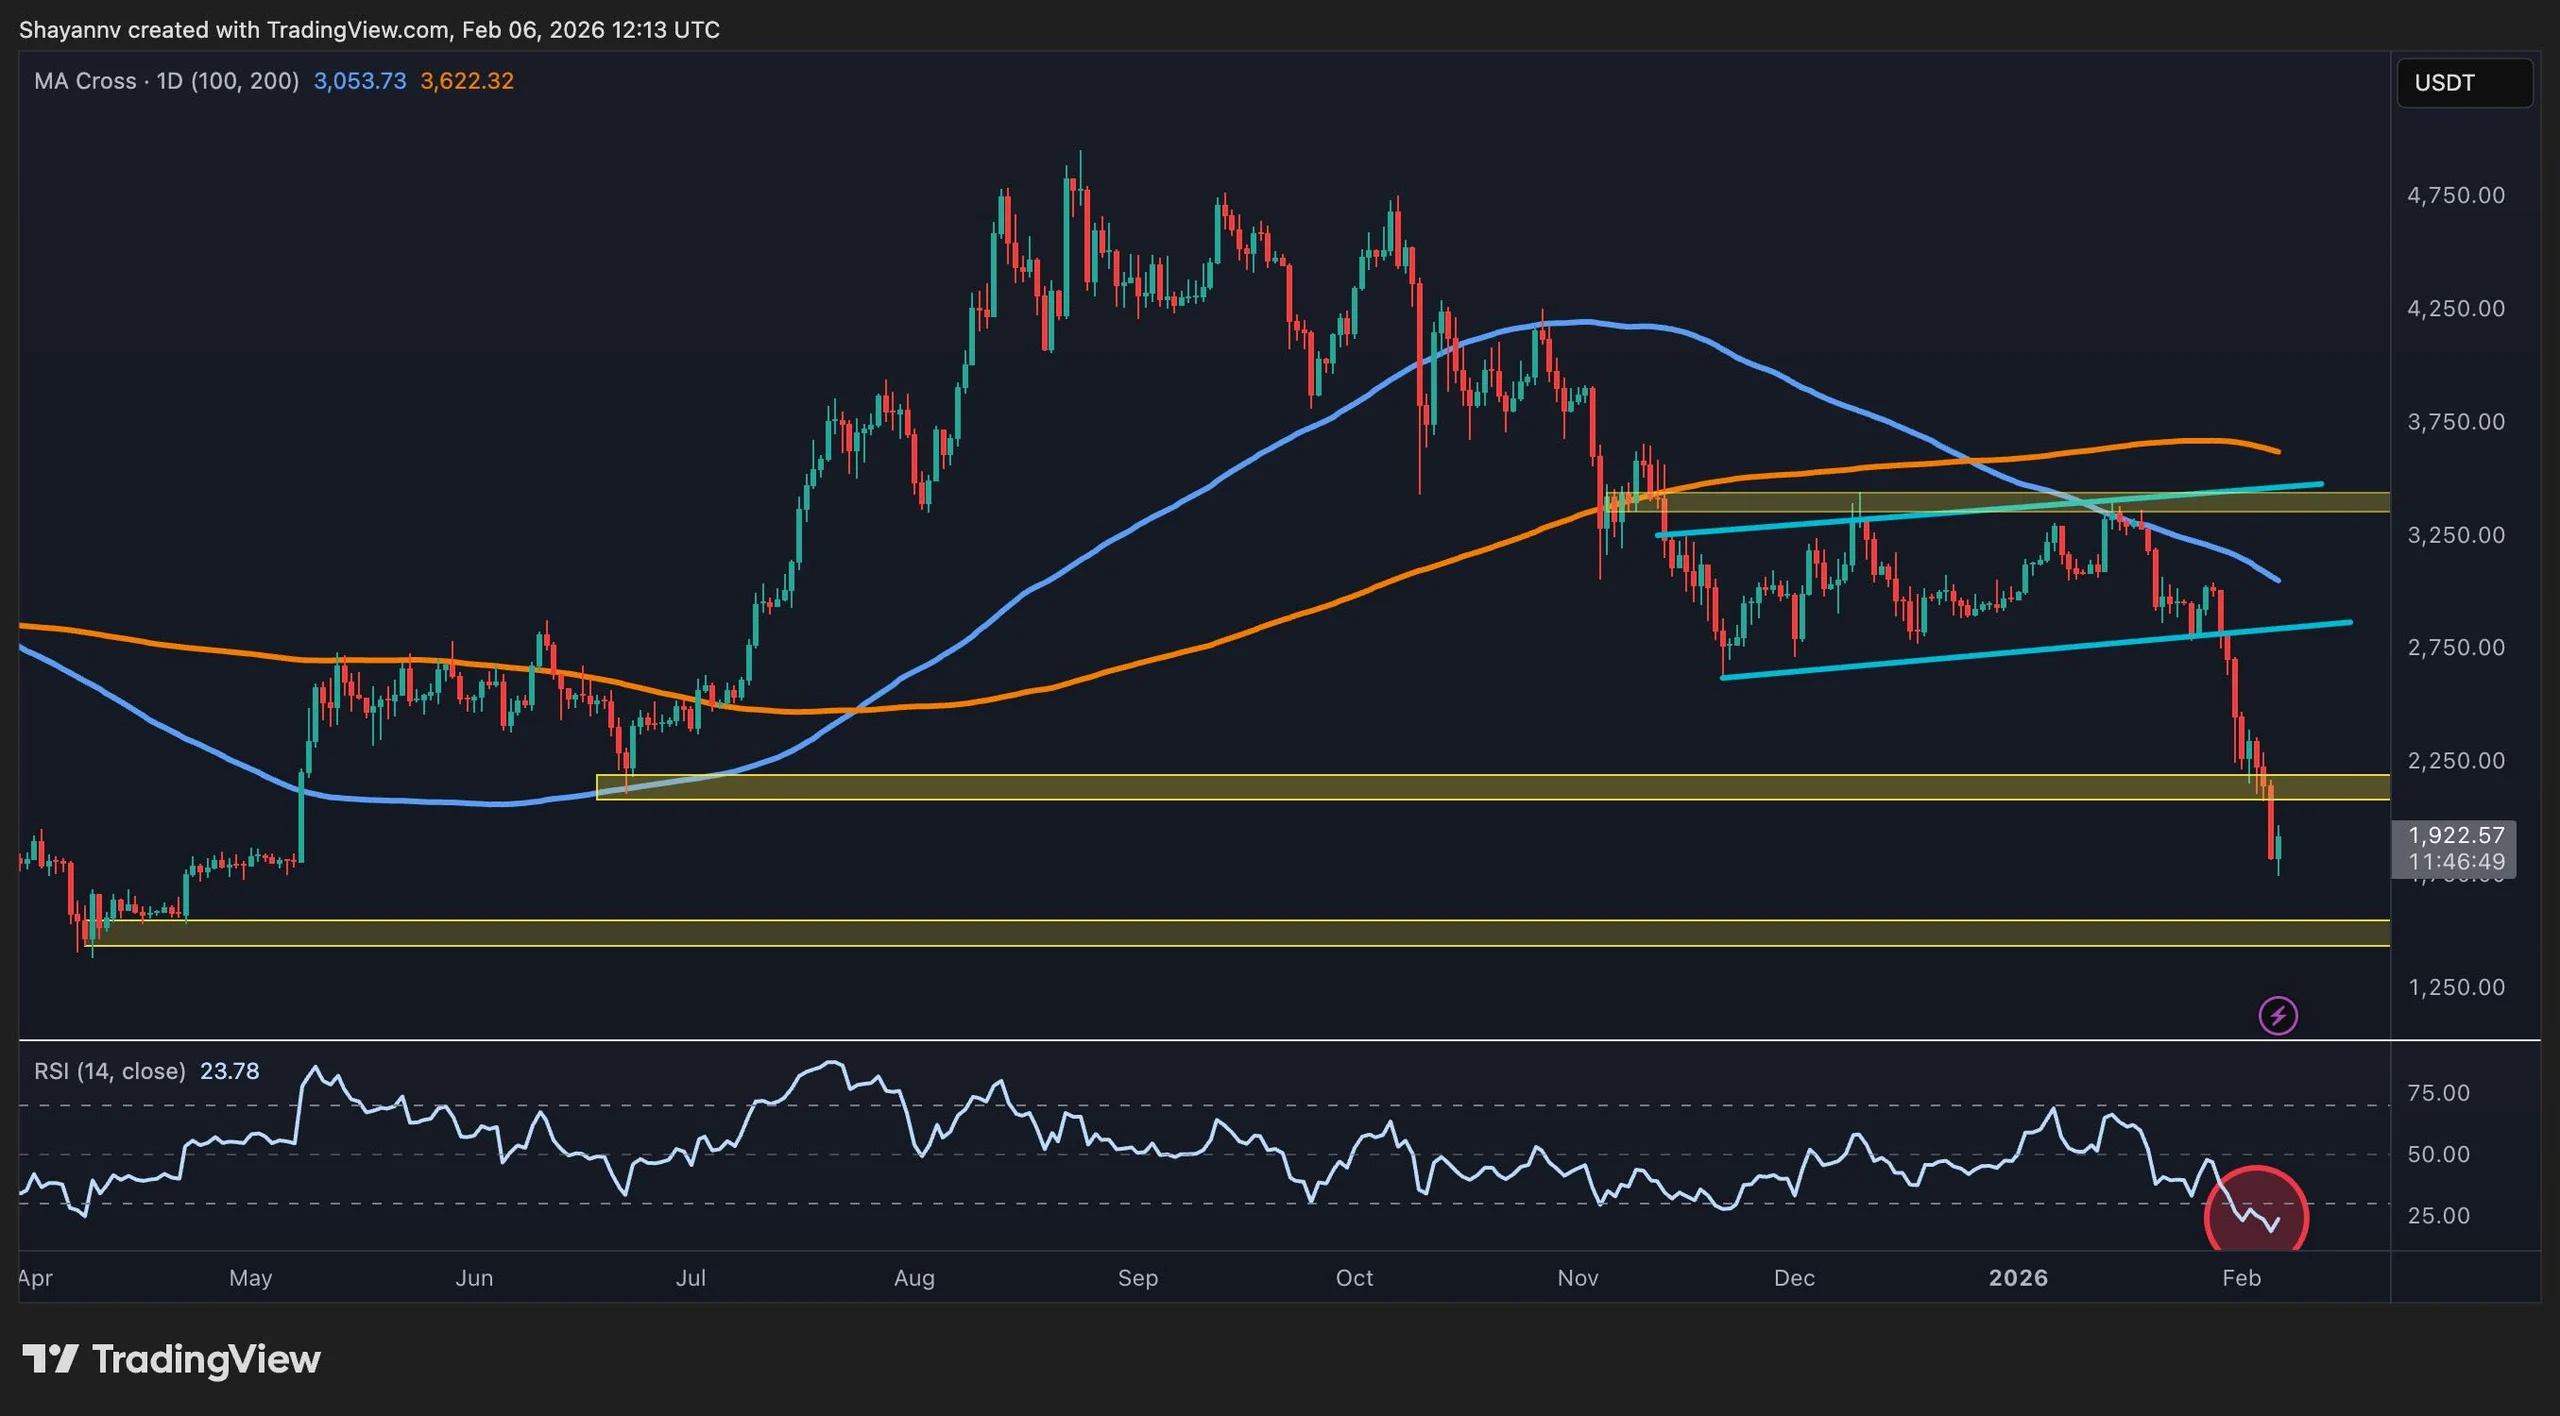
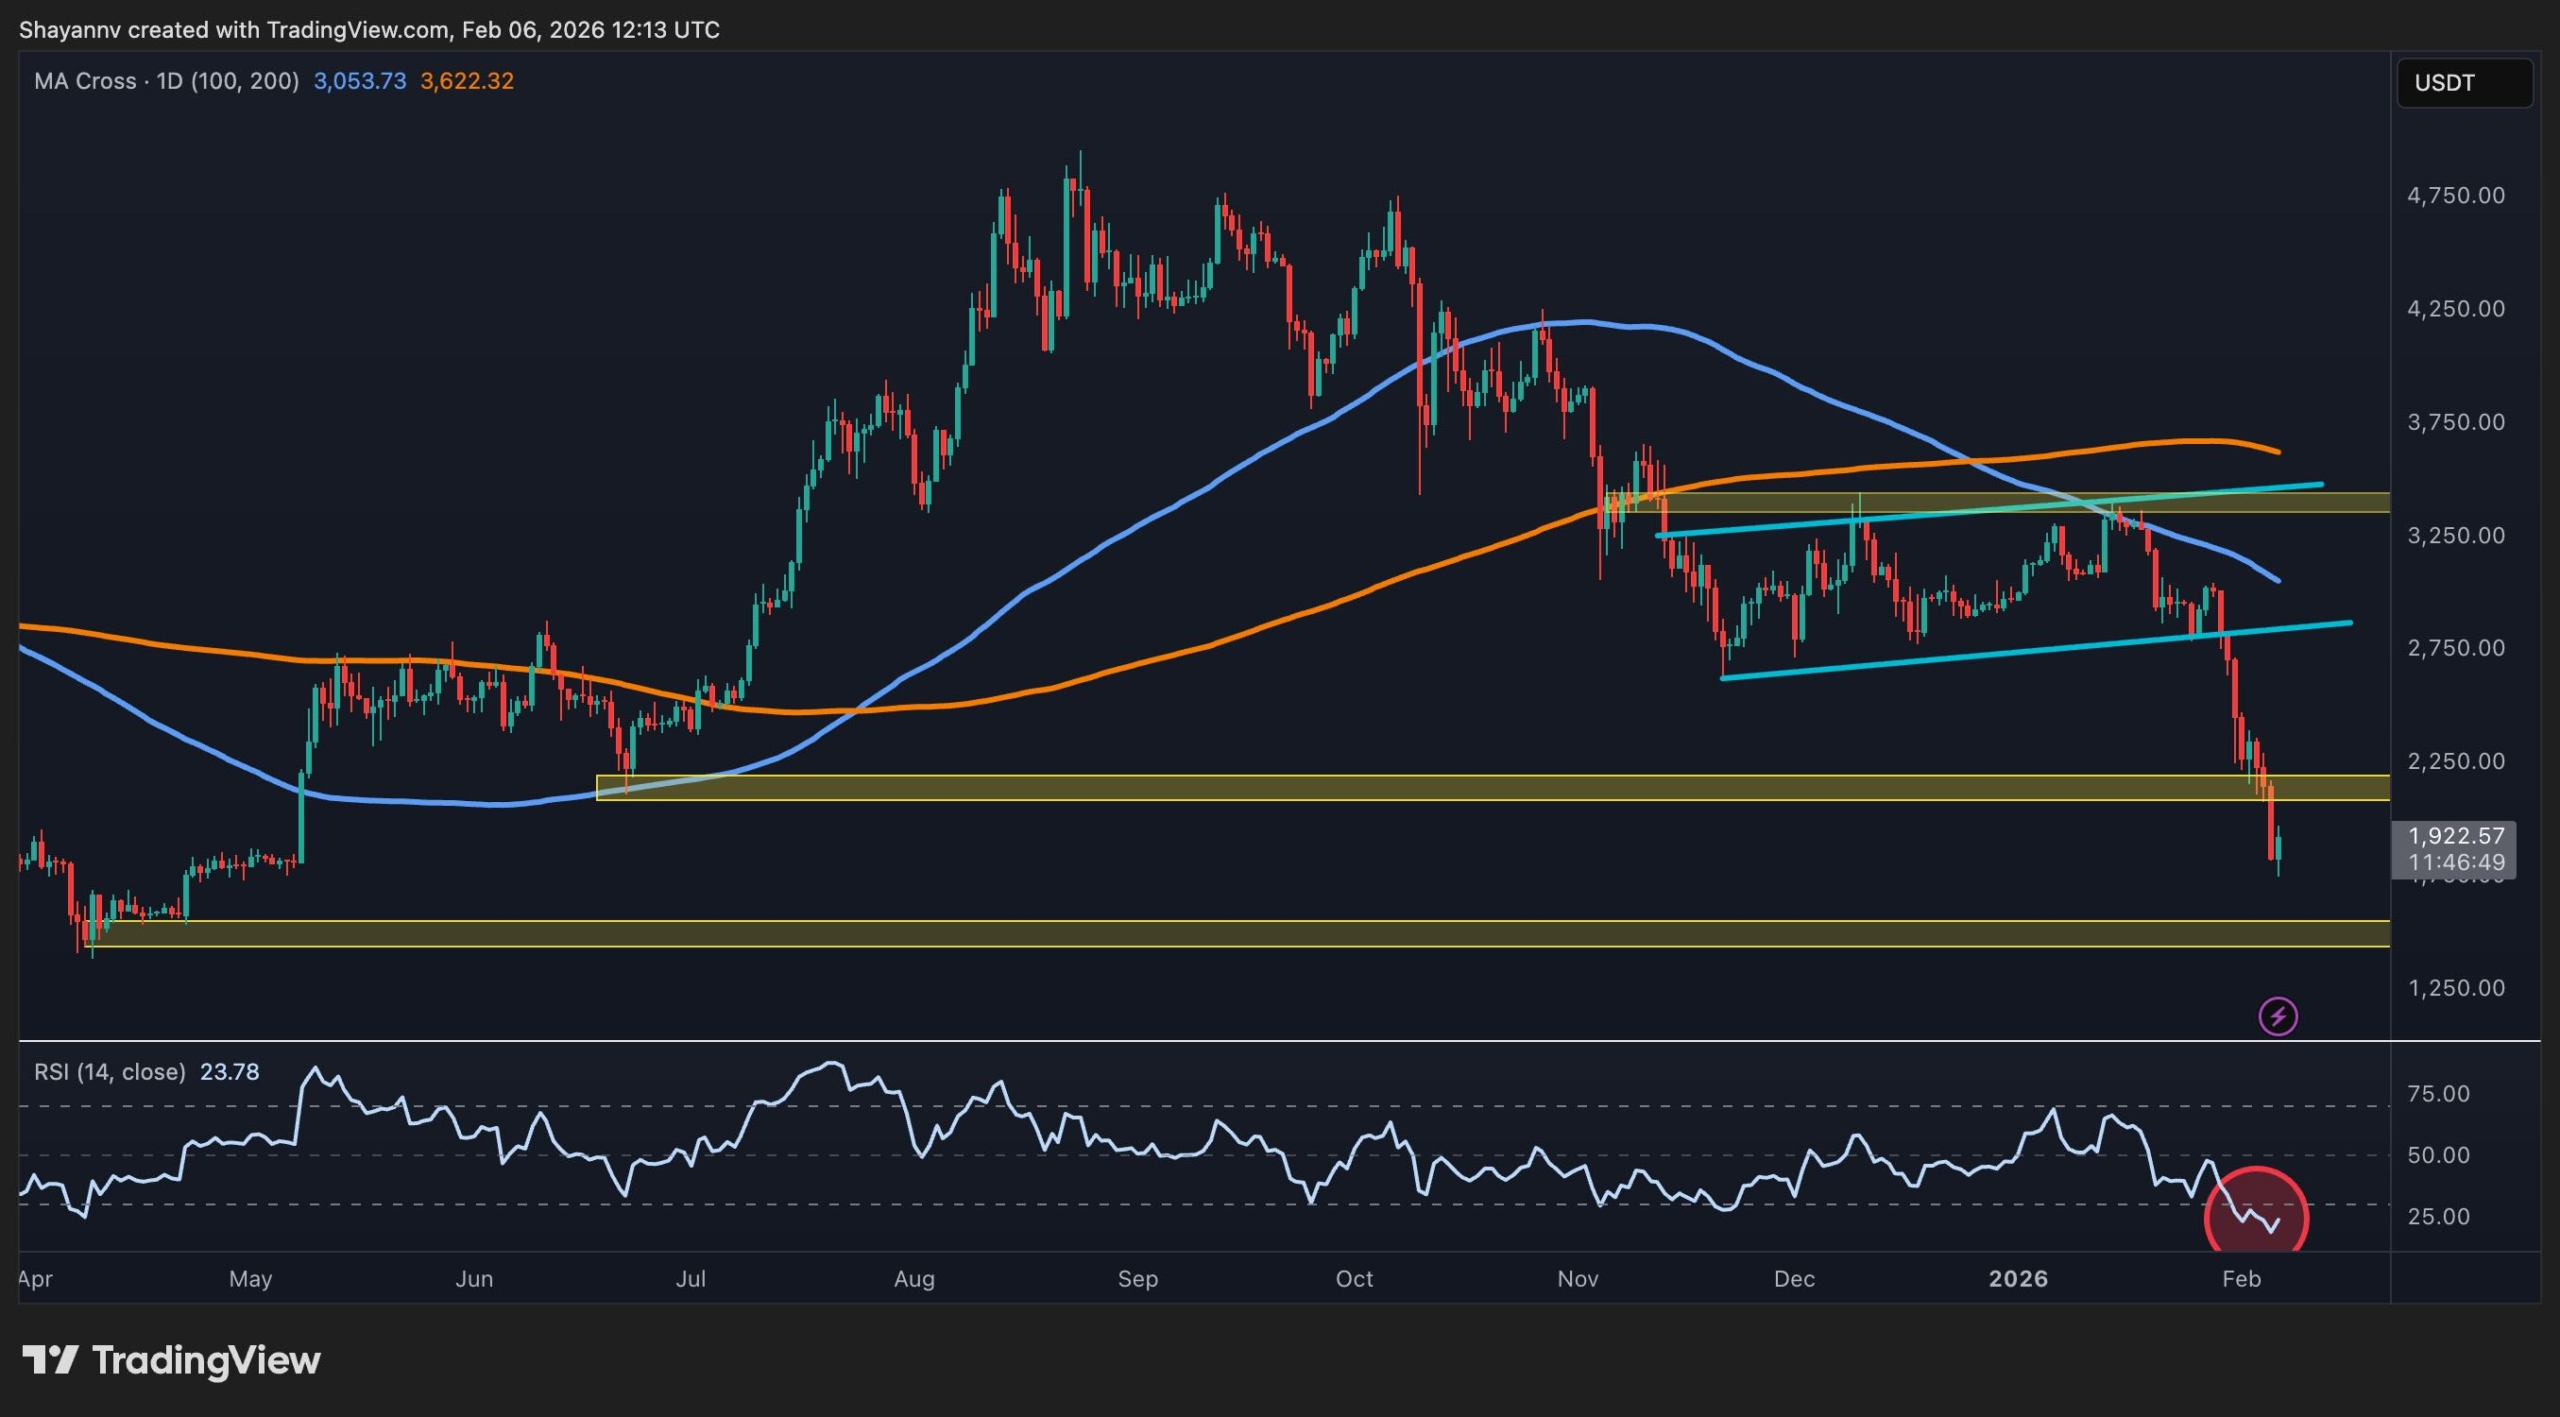
On the daily chart, ETH has broken down from the prior ascending structure that extended from the late-2025 lows and has failed to break above the 100-day and 200-day moving averages, which are now both located above the $3,000 mark. This price behavior has confirmed a transition from corrective sideways action into a clear downside trend.
The price has also broken below the first major demand band around the $2,200-$2,000 area, which coincides with a prior consolidation base and the origin of the last strong impulsive advance. Daily RSI has also fallen into deeply oversold territory in the low 20s, indicating stretched short-term conditions.
However, as long as the market remains capped below the broken moving averages and former support around $2,200, the broader structure continues to point toward a bear-market rally at best rather than a confirmed reversal.
ETH/USDT 4-Hour Chart
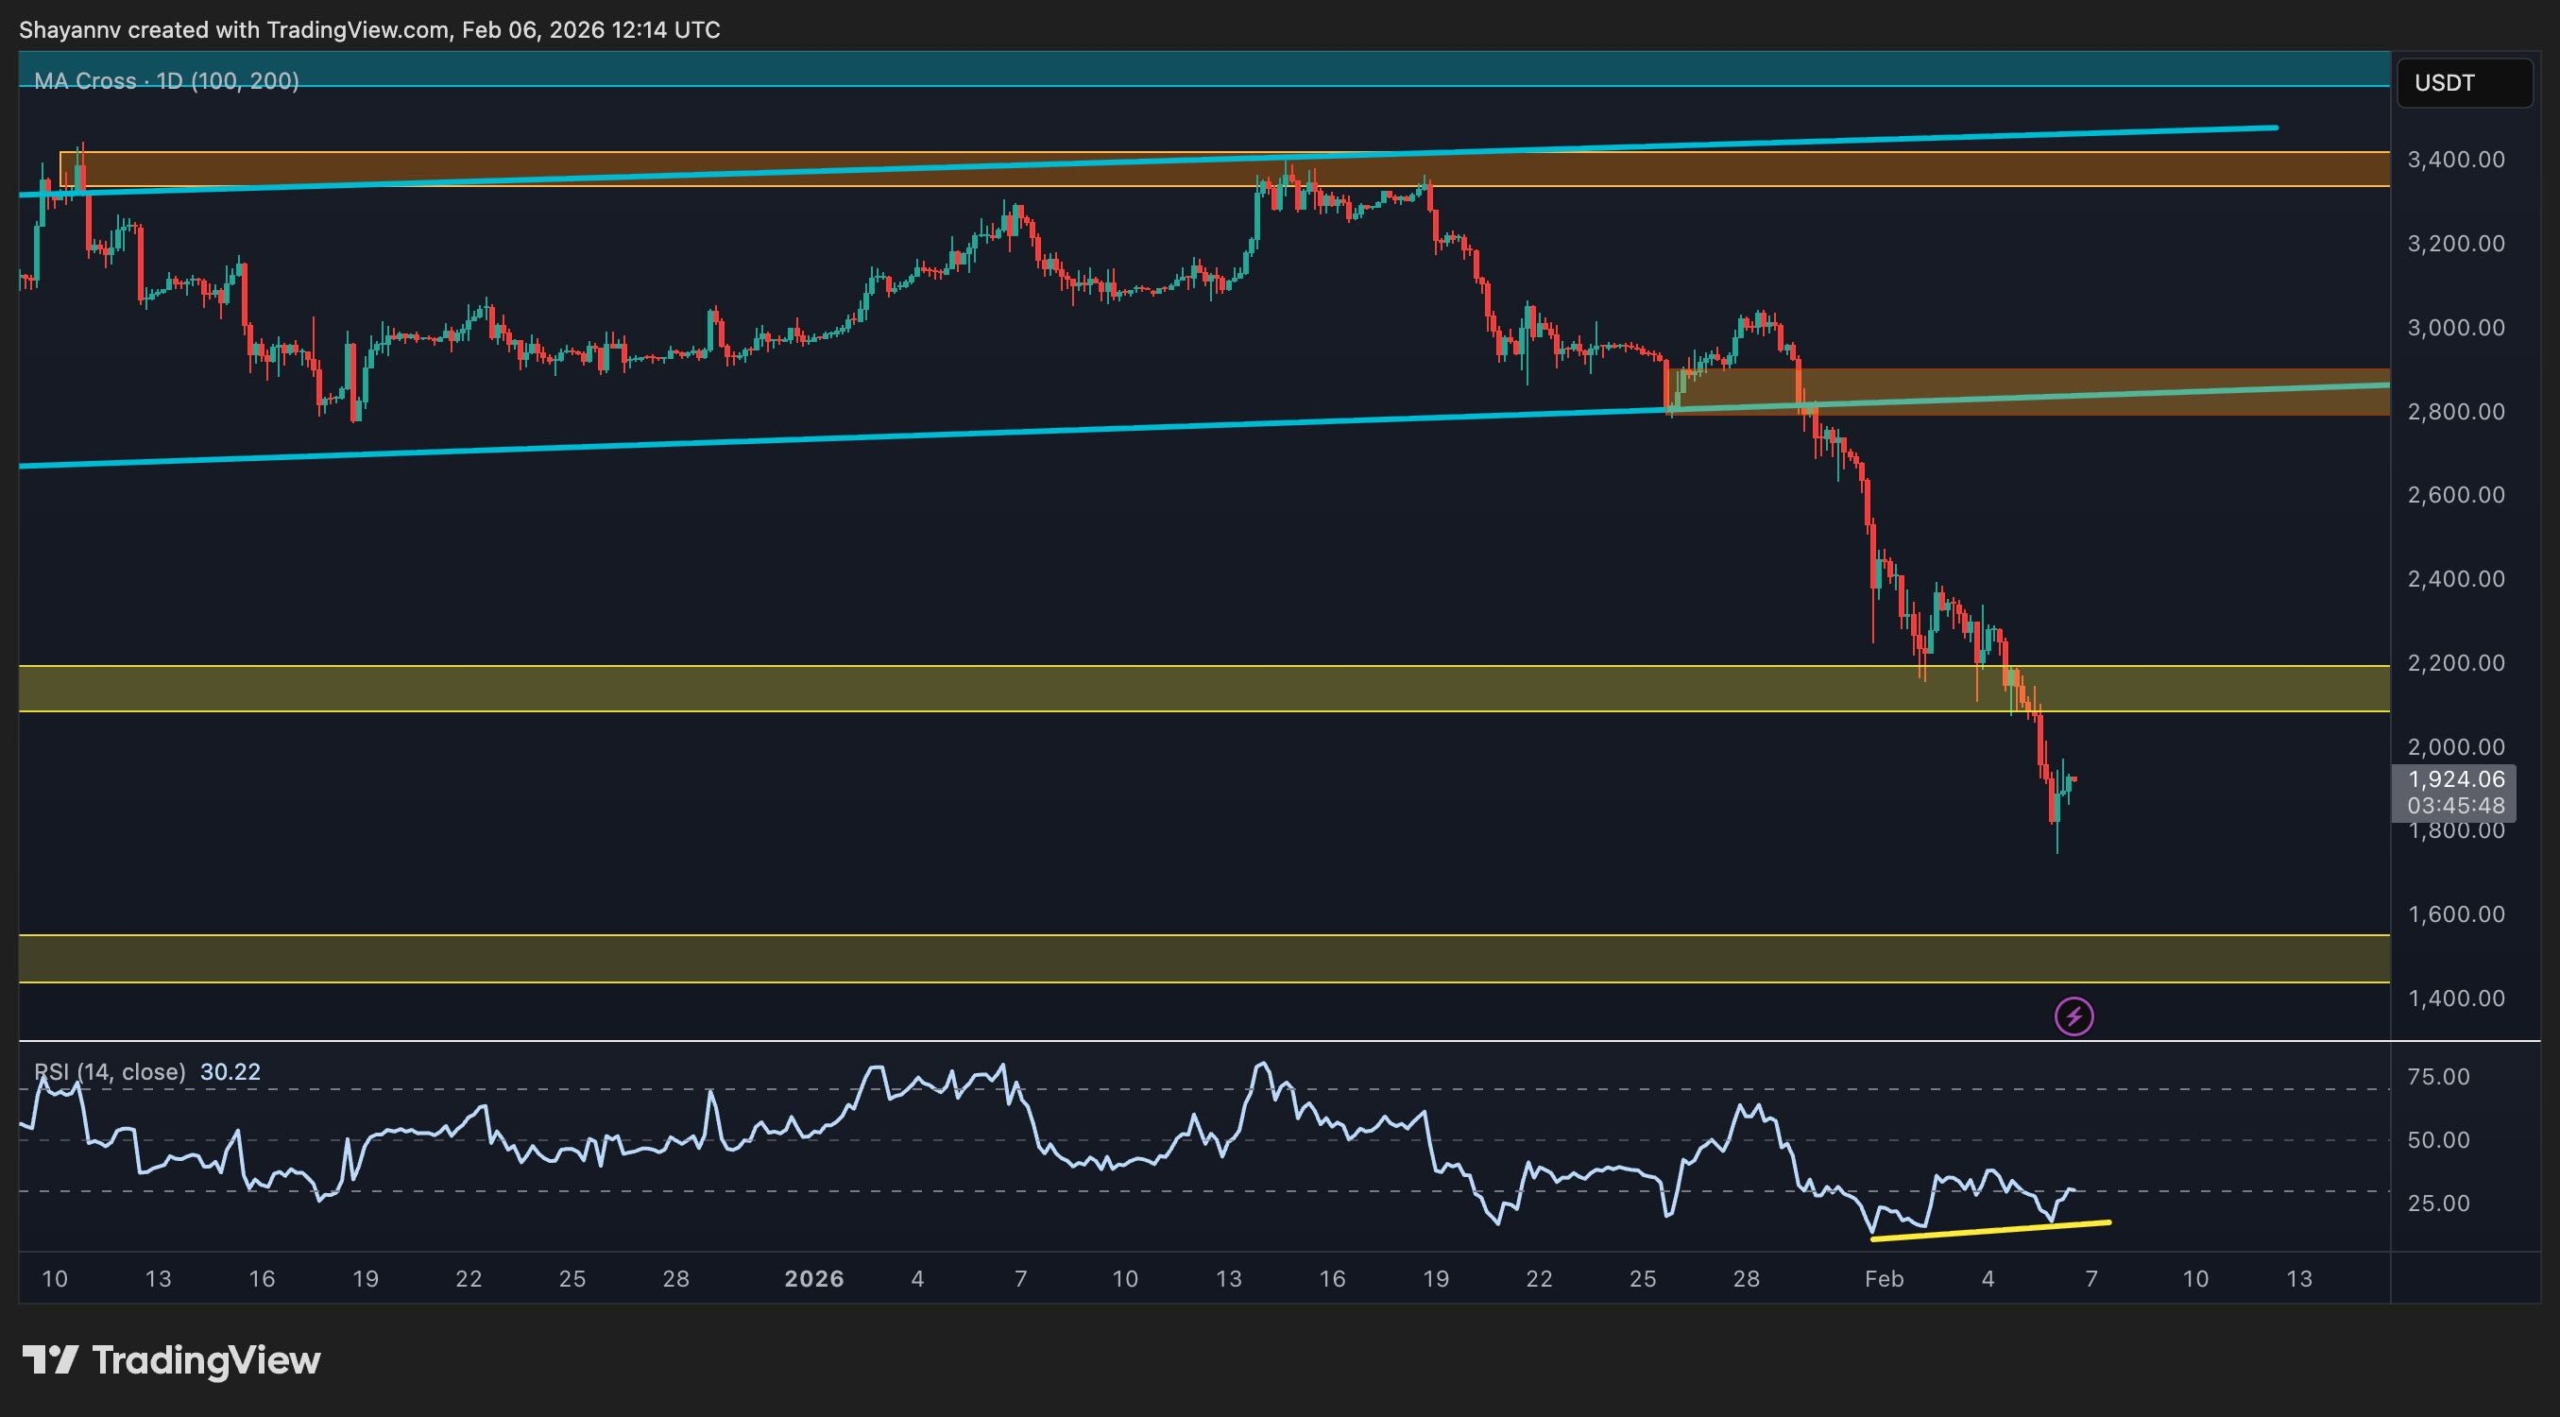
The 4-hour chart highlights the velocity of the current sell-off, with ETH cascading lower from the previously defended $2,800–$2,900 support and barely pausing on intermediate levels. The market is now trying to stabilize around the $1,850–$1,900 range, and a mild bullish divergence is emerging on the 4-hour RSI, where momentum has begun to print higher lows despite marginally lower price lows.
This configuration often signals that forced selling pressure is easing and that a short-term relief bounce or sideways consolidation may follow.
Immediate resistance now sits in the $2,100–$2,200 area, with a stronger supply zone at $2,800. Any rebound that stalls below these bands would keep the intraday trend firmly bearish, while a clean breakdown below the recent $1,800 low would pave the way toward the deeper demand zone at $1,500.
Sentiment Analysis
On the derivatives side, open interest across Ethereum futures has collapsed from elevated levels above 30 billion USD to nearly a third that size, tracking the price decline and signaling a large-scale liquidation cascade rather than an orderly reduction in positioning. This sharp contraction in open interest indicates that a significant portion of leveraged longs has been forced out of the market, with margin calls and auto-deleveraging accelerating the downside once key support levels failed.
While such events are painful in the short term, they also tend to cleanse excess leverage from the system, leaving a lighter positioning backdrop where spot flows and fresh capital, rather than crowded derivatives exposure, can play a larger role in setting the next directional move.

SECRET PARTNERSHIP BONUS for CryptoPotato readers: Use this link to register and unlock $1,500 in exclusive BingX Exchange rewards (limited time offer).
Disclaimer: Information found on CryptoPotato is those of writers quoted. It does not represent the opinions of CryptoPotato on whether to buy, sell, or hold any investments. You are advised to conduct your own research before making any investment decisions. Use provided information at your own risk. See Disclaimer for more information.


More than half of cryptocurrency investors don’t understand the fundamental concept of taxability when it comes to their digital asset holdings, according to a survey by the U.S.-listed crypto exchange Coinbase (COIN) and Cointracker, a crypto tax and portfolio tracking platform.
The 2026 Crypto Tax Readiness Report found that only 49% correctly understand that crypto is taxable anytime it is sold, while almost a quarter mistakenly believe simple transfers trigger tax events.
Despite the majority of users having good intentions when it comes to crypto tax compliance, the multi-platform reality of crypto ownership exacerbates the so-called cost basis problem, deducting the original purchase price of an asset to report capital gains.
The survey found users averaged 2.5 platforms/wallets with 83% using self-custodial wallets, and only 35% reporting that they’d adjusted their cost basis in the past. The survey, conducted in late 2025, surveyed 3,000 U.S. crypto users.
The confusion around cost basis in the new 1099-DA forms is made worse thanks to a degree of overreporting built into the new regime, Coinbase says. This is because everyday activities like stablecoin payments and Ethereum gas fees trigger taxable events, while generating little meaningful tax revenue.
Coinbase said it expects to issue over four million 1099-DAs Forms to customers with under $600 of proceeds – added to the fact that over 60 percent of its customers have incomplete cost basis data due to the way digital assets move across wallets and platforms.
“Today, that means every stablecoin payment, every small DeFi [decentralized finance] transaction, every gas fee is technically a taxable event,” Coinbase said. “The compliance burden this imposes on ordinary Americans isn’t just inconvenient – it’s a direct threat to the adoption and innovation the GENIUS Act was designed to unlock.”
Despite the wrinkles, the move to standardized reporting of crypto taxes will help adoption in the long run, said Matt Price, director of investigations at blockchain analytics firm Elliptic. Price, a former IRS special agent focused on criminal investigations, sees this as a shift toward targeted enforcement rather than the broad, manual investigations of the past.
Also a former head of investigations at Binance, Price understands the complexity of doing crypto taxes, having been paid partly in crypto by Binance and having to account for a volatile asset in the form of a payment.
“How do you even report it?” Price said in an interview. “I didn’t even have a 1099 to report that, so I had to essentially do all of my own accounting to file accurate taxes to account for that information.”
As such, the arrival of 1099-DA forms means welcome standardization that simply brings crypto in line with what other financial products have had for years and mirrors the approach of the 1099-B for brokerages.
“There’s certainly nuance and it’s a fair point that the basis is harder to calculate given the high frequency of trading,” Price said. “But there are some parallels to that in traditional investments as well; I don’t know how many retail traders are running algo trades on Schwab, for example, but that is also a very similar type of trade. If they can figure it out, I think the industry can probably figure it out.”

- XRP rises to $1.36 on institutional optimism and CEO remarks.
- Technical relief bounce supported by oversold conditions and volume surge.
- Key levels to watch are the support at $1.33 and the resistance at $1.40.
XRP has seen a notable lift in the past 24 hours, climbing to $1.36 and outperforming much of the broader market.
The rally appears to be driven by a combination of technical relief and renewed confidence from institutional investors.
Over the past 24 hours, trading volume surged nearly 50%, signalling that buyers are stepping in after the recent oversold conditions.
Ripple CEO commentary sparks optimism
A major factor behind this price movement is the recent commentary from Ripple’s CEO, Brad Garlinghouse.
In a March 27 Fox interview, Garlinghouse highlighted a growing demand for digital assets and stablecoins from traditional financial institutions.
He emphasised that the crypto landscape is maturing, with more banks and investment firms considering digital assets as part of their portfolios.
Garlinghouse also underscored progress on regulatory fronts, particularly regarding the anticipated CLARITY Act.
The CEO indicated that the act could provide clearer guidelines for crypto operations, fostering confidence among institutional participants.
The combination of regulatory clarity and increased interest from financial firms has sent a strong signal to traders.
Market participants appear to be reacting positively, interpreting the remarks as validation that XRP is positioned for broader adoption in the traditional finance sector.
Reports of large institutional XRP holdings, such as Goldman Sachs’ exposure through XRP ETFs, have further reinforced the bullish narrative.
Technical relief supports the bounce
Alongside these fundamental drivers, XRP’s technical indicators also support the recent surge.
The 14-day Relative Strength Index (RSI) had dipped to around 44, indicating that the asset is approaching oversold territory, which has created conditions for the bounce as selling pressure eases and buyers re-enter the market.

Moreover, XRP’s price gained modest tailwinds from a slight recovery across the broader crypto market.
While the overall market movement was subdued, it contributed to the momentum that carried XRP higher.
The short-term XRP price forecast
For traders watching the immediate market, $1.33 remains a critical support level.
Remaining above this support will be crucial for any attempt to test higher levels.
In case of a continued bullish trend and XRP breaks above $1.40, analysts believe the altcoin could see additional buying pressure and extend the current relief rally.
Other notable resistance levels that traders should watch include $1.45, which has acted as a ceiling over the past week.
Sustaining momentum beyond this level could open the door to a more meaningful uptrend.
However, failure to hold $1.33 could result in a pullback toward $1.30, where buyers may re-enter.
Notably, regulatory developments, particularly progress on the CLARITY Act, will be the key catalyst in the coming weeks.
Positive news could encourage further institutional participation, while delays might keep XRP trading within the $1.30–$1.40 range.

Key Takeaways
- ARTL shares skyrocketed 618% following the company’s announcement about developing ART27.13 as a complementary treatment for GLP-1 obesity medications.
- Shares plummeted over 23% Monday when Artelo disclosed a $31.4 million fundraising initiative involving share and warrant issuance.
- The company plans to issue roughly 3.18 million shares priced at $3.45 each, generating approximately $11 million in gross revenue.
- Warrant agreements for up to 6.37 million additional shares could yield another $20.4 million if fully exercised by investors.
- The financing arrangement was structured at-the-market under Nasdaq compliance guidelines and was scheduled to finalize on March 30.
Shares of Artelo Biosciences experienced a significant downturn exceeding 23% during early trading Monday following the biotechnology firm’s announcement of a financing plan targeting up to $31.4 million through combined share and warrant issuance.
Artelo Biosciences, Inc., ARTL
This sharp decline occurred after an impressive 230.41% rally the preceding Friday, which followed by two days the company’s revelation that it was investigating ART27.13, its experimental compound, as a complementary therapeutic option for GLP-1-based obesity medications.
The strategic decision to pursue capital raising immediately following such substantial share price appreciation seems to have triggered investor apprehension regarding potential ownership dilution.
Artelo revealed it executed binding agreements for the sale of roughly 3.18 million common shares at a combined offering price of $3.45 per unit. This transaction is projected to yield gross revenues of approximately $11 million prior to deducting placement fees and related costs.
Additionally, the biotechnology company intends to issue warrants providing purchasers with rights to acquire up to 6.37 million supplementary shares. Should these warrants be fully exercised through cash payment, Artelo could secure an additional $20.4 million in funding.
The company explicitly cautioned investors that warrant exercise remains uncertain. “No assurance can be given that any of the warrants will be exercised, or that the Company will receive cash proceeds from the exercise of the warrants,” Artelo stated in its official announcement.
H.C. Wainwright & Co. serves as the sole placement agent facilitating this financing transaction.
The private offering is being executed pursuant to Section 4(a)(2) of the Securities Act alongside Regulation D requirements. The offered securities remain unregistered under federal and state securities regulations. Artelo has committed to submitting a resale registration statement encompassing the newly issued securities.
Capital generated from this financing will be allocated toward operational expenses, settlement of specific bridge financing obligations, and broader corporate initiatives.
ART27.13’s Role in the GLP-1 Treatment Landscape
The initial dramatic price increase stemmed from Artelo’s Wednesday disclosure regarding its exploration of ART27.13 — an investigational therapeutic targeting the endocannabinoid system — as a possible adjunct therapy to GLP-1 medications.
GLP-1 therapeutics, which regulate glucose metabolism and appetite control, represent the cornerstone of the rapidly expanding obesity pharmaceutical market. This sector is currently led by Eli Lilly (LLY) and Novo Nordisk (NVO).
According to Artelo, previous clinical observations in oncology patients indicated that ART27.13 might help maintain lean muscle tissue in individuals receiving GLP-1 treatments. The company has subsequently submitted a provisional patent application addressing this therapeutic indication.
“With new non-clinical research commencing and the recent filing of a patent application covering the use of CB2 agonists with GLP-1 drugs, we are aiming to build a scientific and strategic foundation with ART27.13 in an area of potentially significant commercial relevance,” stated Andrew Yates, Artelo’s chief scientific officer.


TLDR:
- February 2026 funding rates landed in the bottom 3–15% of all historical monthly readings across major tokens.
- Every bottom-15% funding rate streak on record has recovered, with a median timeline of two to five weeks.
- SOL on Hyperliquid posted -18.33% annualized in February, the lowest reading ever recorded across all tracked pairs.
- Boros allows traders to long ETH funding rate markets and lock in fixed rates ahead of an expected mean reversion.
Funding rates across major crypto perpetual markets are raising a critical question: has the market finally bottomed?
After Bitcoin shed over 50% from its October 2025 all-time highs, perpetual funding rates collapsed to historic lows in February 2026.
Most major tokens recorded readings in the bottom 5% of all-time monthly data. Now, with crypto prices rallying despite US-Iran war escalations, traders are watching funding rates closely for early reversal signals.
February 2026 Funding Rates Dropped to Levels Never Seen Before
Funding rates in February 2026 were not just low — they were structurally outside the normal range of market history.
BTC on Binance recorded an annualized rate of -0.68%, placing it in the bottom 4.5% of all 66 months on record. That reading alone sat 12 percentage points below BTC’s historical mean of 11.8%.
ETH told an even sharper story. Binance recorded ETH at -4.03% annualized, landing in the bottom 3% of all historical monthly readings.
Hyperliquid and Lighter posted similarly depressed figures, with ETH sitting in the bottom 15% and bottom 20% respectively across those platforms.
XRP and SOL absorbed the worst damage of the month. XRP on Hyperliquid posted -12.77%, the single worst month in that market’s entire recorded history.
SOL on Hyperliquid came in at -18.33%, the lowest absolute reading among all tracked pairs across every platform.
The deviation from historical medians reinforces just how extreme the period was. SOL on Hyperliquid deviated 29.2 percentage points from its median.
BTC on Binance, the least extreme major, still deviated 7.0 percentage points. For most tokens, February was not simply a bad month — it was an anomaly by every measurable standard.
Historical Patterns Suggest These Lows Have Always Preceded a Recovery
The most telling data point in this analysis is also the simplest: every bottom-15% funding rate streak in the historical record has recovered.
That pattern holds across multiple assets, exchanges, and market cycles, including the FTX collapse of November 2022.
The median recovery time back to the bottom 55% of funding rates runs roughly two to five weeks after the streak ends.
BTC provides the clearest evidence. Its longest Binance bottom-15% streak lasted 11 weeks, beginning in March 2025.
Most other BTC streaks recovered within one to five weeks. An extended eight-week streak on Hyperliquid in mid-2023 resolved fully within five weeks of ending.
ETH’s most severe historical episode in late August 2022 averaged -18.6% over five weeks. That took 12 weeks to recover to the bottom 55%, the longest recovery on record for ETH.
More recent episodes, however, including early 2025 streaks, resolved in one to five weeks, suggesting the recovery window is compressing as the market matures.
SOL’s November 2022 streak, driven by the FTX collapse, averaged an extraordinary -468.9% annualized. Despite that severity, Binance SOL recovered to the bottom 20% within seven weeks.
Each of these cases points toward the same conclusion: deeply negative funding rates have historically acted as a contrarian signal for a coming recovery, not a permanent new baseline.
Funding Rate Markets on Boros Allow Traders to Position for the Rebound
If funding rates are indeed at a cyclical bottom, the question becomes how traders can express that view efficiently.
Boros, a funding rate derivatives platform, offers two structured approaches for traders looking to capitalize on a mean reversion in funding rates.
The first strategy targets traders who believe ETH prices will recover over the next three months. By longing ETH on any of the three platforms with June maturities — OKX, Binance, or Hyperliquid — and simultaneously longing the ETH funding rate market on Boros with the same notional amount, traders lock in a fixed funding rate. This protects against funding spikes while maintaining full upside exposure to ETH price recovery.
The second strategy is for traders focused purely on funding rate normalization, regardless of price direction. Longing ETH funding rate markets on Boros directly captures any upward move in implied or underlying APR.
The recommended approach is selecting the maturity with the lowest current implied APR to maximize the distance of a potential recovery move.
Implied APR across June ETH maturities currently sits between 2% and 5% annualized, reflecting cautious market expectations for a gradual recovery.
If underlying APR breaks its downtrend and flips positive, traders long on Boros benefit both from rising implied APR and from positive settlement payouts once underlying APR exceeds their entry point.
The Data Points to an Asymmetric Opportunity, But Margin Management Is Critical
Taken together, the February 2026 funding rate data builds a case for an asymmetric setup. Rates have reached historic lows across virtually every major token and exchange.
Historical recovery patterns are consistent. And crypto prices have already begun recovering despite ongoing geopolitical pressure, a divergence that traders are noting carefully.
Extended periods of negative funding have historically reflected consolidating or ranging markets. As Boros observed, those periods of extended low funding have always eventually ended. The question is not whether rates recover, but when — and whether traders are positioned to benefit when they do.
For those looking to long mean reversion, timing the exact bottom is not necessary. The historical data suggests the recovery window after a streak breaks is two to five weeks, giving traders a defined timeframe to manage positions. The risk is sustaining negative funding payouts during the remaining period of the streak before it turns.
Adequate margin is therefore the most important operational variable for this trade. A trader who enters too early with insufficient runway may be forced out before the recovery materializes.
The setup, however, remains compelling: deeply negative historical funding rates, a consistent track record of recovery, and structured tools through Boros that allow both fixed-rate locking and directional funding rate speculation.
TLDR:
-
- Gnosis is a founding contributor to the Ethereum Economic Zone alongside Jordi Baylina and the Ethereum Foundation.
- EEZ rollups allow smart contracts to call Ethereum mainnet contracts atomically within a single transaction.
- Protocols on EEZ rollups access Ethereum’s native liquidity directly without wrapping, bridging, or extra delays.
- Gnosis plans to define the role of GNO token and its validator set in any future EEZ implementation with its DAO.
- Gnosis is a founding contributor to the Ethereum Economic Zone alongside Jordi Baylina and the Ethereum Foundation.
Ethereum Economic Zone is the framework Gnosis is co-building to address Layer 2 fragmentation on Ethereum. Gnosis, active as a Layer 1 blockchain for seven years, is a founding contributor to this initiative.
Jordi Baylina, founder of ZisK and creator of Circom, also joins as a founding contributor. The Ethereum Foundation is also co-funding the entire development effort.
The framework centers on synchronous composability, enabling rollups to interact with Ethereum mainnet without bridges.
A Framework Built Around Composability
Ethereum scaling delivered on its core promise in recent years. Transactions became cheaper and network throughput increased steadily. However, the process fractured the ecosystem into disconnected chains rather than one unified economy.
Each rollup operates with its own liquidity, bridges, and tooling. Builders must redeploy the same products across multiple chains to reach all users. Users also face expensive bridging costs and assets scattered across chains they barely track.
Gnosis noted on X that Ethereum had scaled into fragmented islands rather than a unified economy. The Ethereum Economic Zone is designed to resolve that at the infrastructure layer. The framework allows rollup smart contracts to call Ethereum mainnet contracts within one transaction.
Calls between different rollups within the same execution are also supported. This is what developers call synchronous composability. It removes the need for bridges, wrapping, or waiting on finality.
Protocols on EEZ rollups access Ethereum’s existing liquidity directly without bridging or wrapping. A protocol can use a Uniswap mainnet pool atomically, with the same L1 guarantees. These rollups also inherit Ethereum’s full validator security with no new trust assumptions added.
What the Ethereum Economic Zone Means for Gnosis Chain
Gnosis acknowledged that its neutral blockspace thesis did not develop as expected. Blockspace became largely commoditized across the industry over time. Running a standalone Layer 1 requires constant rebuilding of DeFi infrastructure and liquidity bootstrapping.
Synchronous interoperability changes the competitive dynamic for chains like Gnosis. Projects inside a composable Ethereum domain no longer need to replicate an entire ecosystem. They can rely on shared liquidity and canonical infrastructure instead.
That shift frees up capital and engineering bandwidth for differentiation. Gnosis plans to invest more in user experiences and products like Gnosis Pay and the Gnosis App. Real-world financial integrations also become more practical under a unified model.
The Ethereum Economic Zone also connects to Gnosis’s mission of giving every person financial access. A stablecoin can now compose with a lending protocol on another chain without a bridge. A consumer app can also access the best rates across the ecosystem without workarounds.
Gnosis noted that the GNO token and validator set may have a role in a future EEZ implementation. Those details will be worked out with the Gnosis DAO community over the coming months. Technical architecture, developer tooling, and integration guides are also planned for release soon.

Solana is trading at $84, the price is down 71% from its January 2025 peak of $293, as weekly DEX volume collapses to levels not seen since early 2025, even with bullish prediction and hope. The memecoin engine that once powered Solana’s on-chain dominance is stalling.
For Solana, the next 72 hours around the Federal Reserve’s March 17–18 meeting could determine whether $80 holds or gives way entirely. One technical pattern already has a $59 target in view.
Weekly DEX volume across all networks registers at just $1.2B, way down from its $41B peak. Broader crypto market weakness in Q1 2026 hammered token speculation, with DEXs now capturing just 14.1% of centralized exchange volume, down sharply from a 21%+ peak in summer 2025.
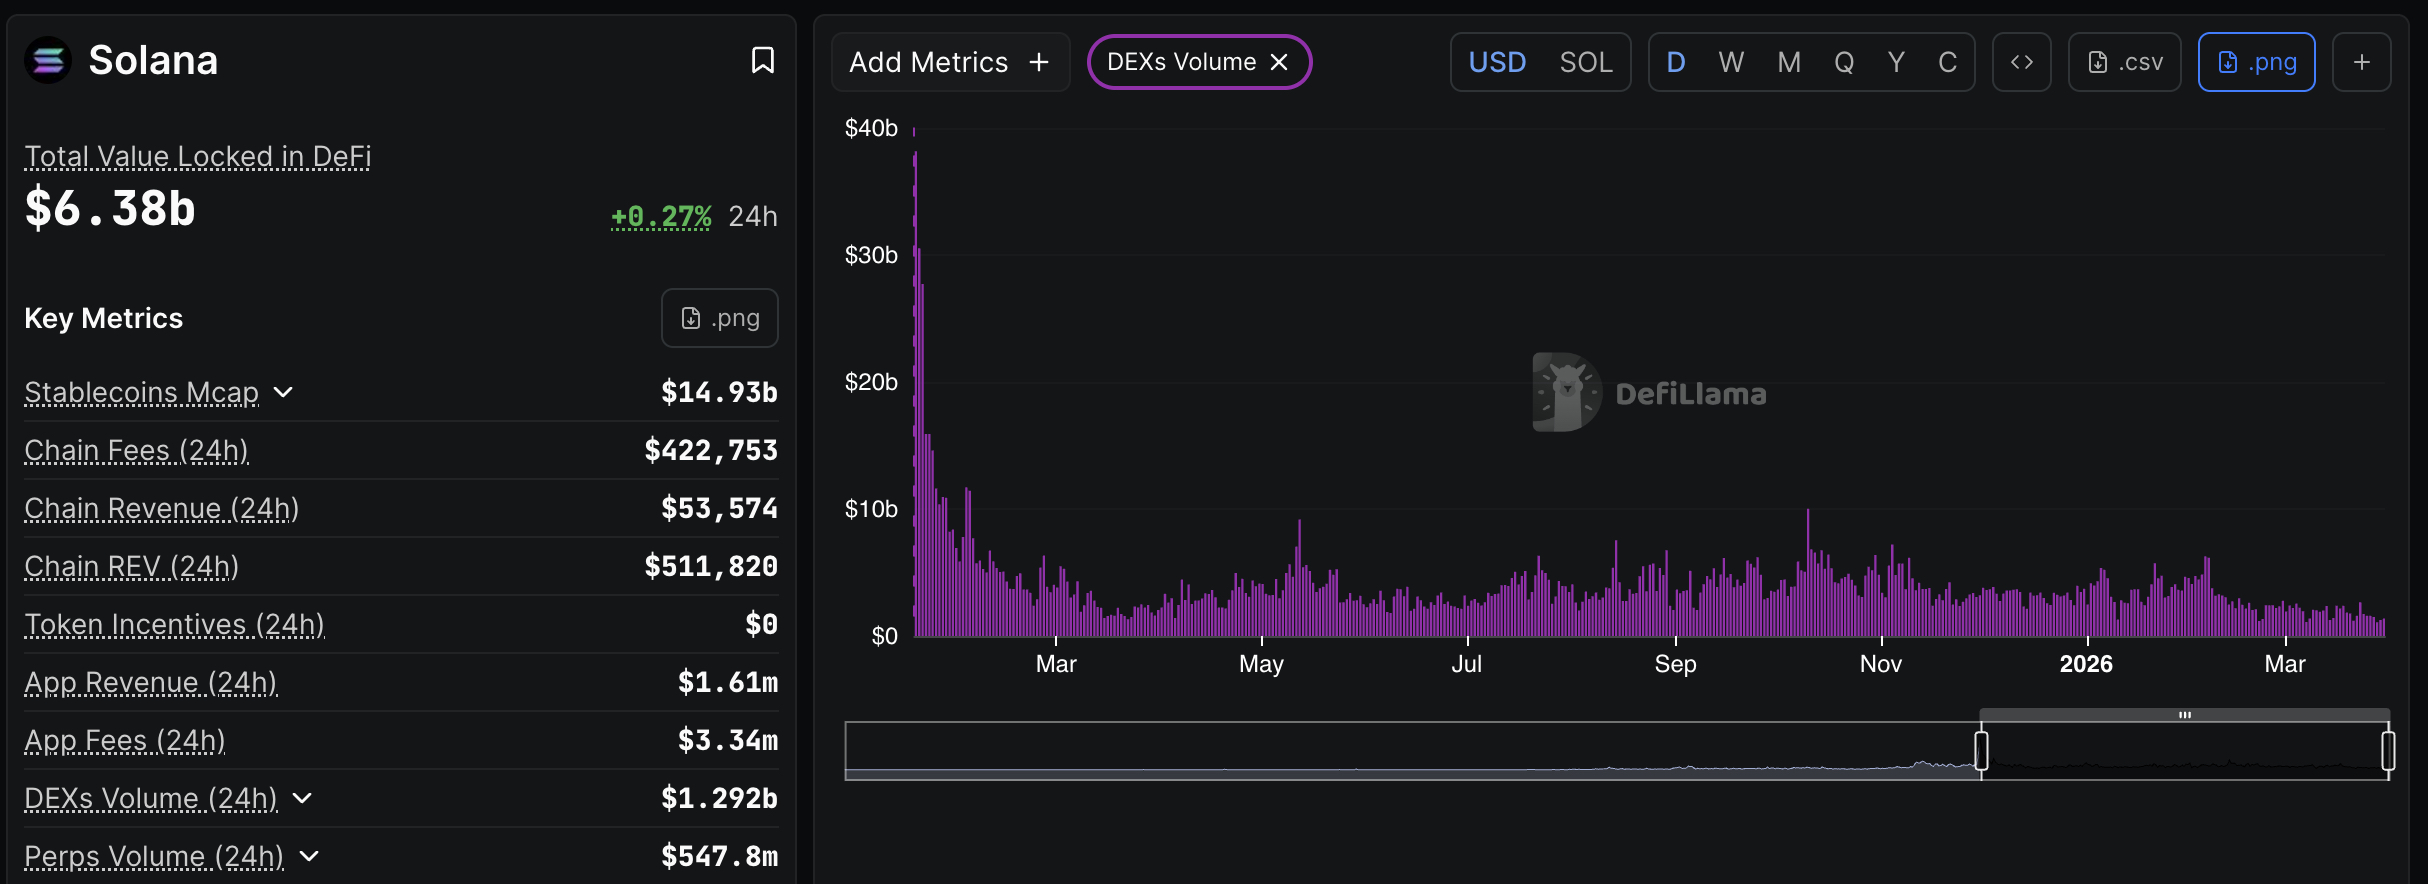
Solana still commands the largest individual network share at $11.42B, its 30th consecutive month leading peers, propped up by persistent PumpSwap and Pump.fun activity, but even that moat is narrowing as “star token” launches dry up.
The macro and technical backdrops are converging at a critical juncture. Here’s what the data suggests about SOL’s near-term path, and where traders are repositioning capital while waiting for clarity. Deep dive into our Solana Price Prediction
Discover: The best pre-launch token sales
Solana Price Prediction: Can Solana Reclaim $96 Support?
SOL sits at $84, pinned below the $86 pivot that separates consolidation from any credible recovery attempt. Volume metrics have been deteriorating alongside price, a combination that technically confirms distribution rather than accumulation.
RSI sits at a neutral 50 area, not oversold enough to trigger mean-reversion buying on its own, while the 50-, 100-, and 200-day SMAs all signal sell. The 200-day MA has been rising since March 9, which is the one structural bright spot bulls can point to.
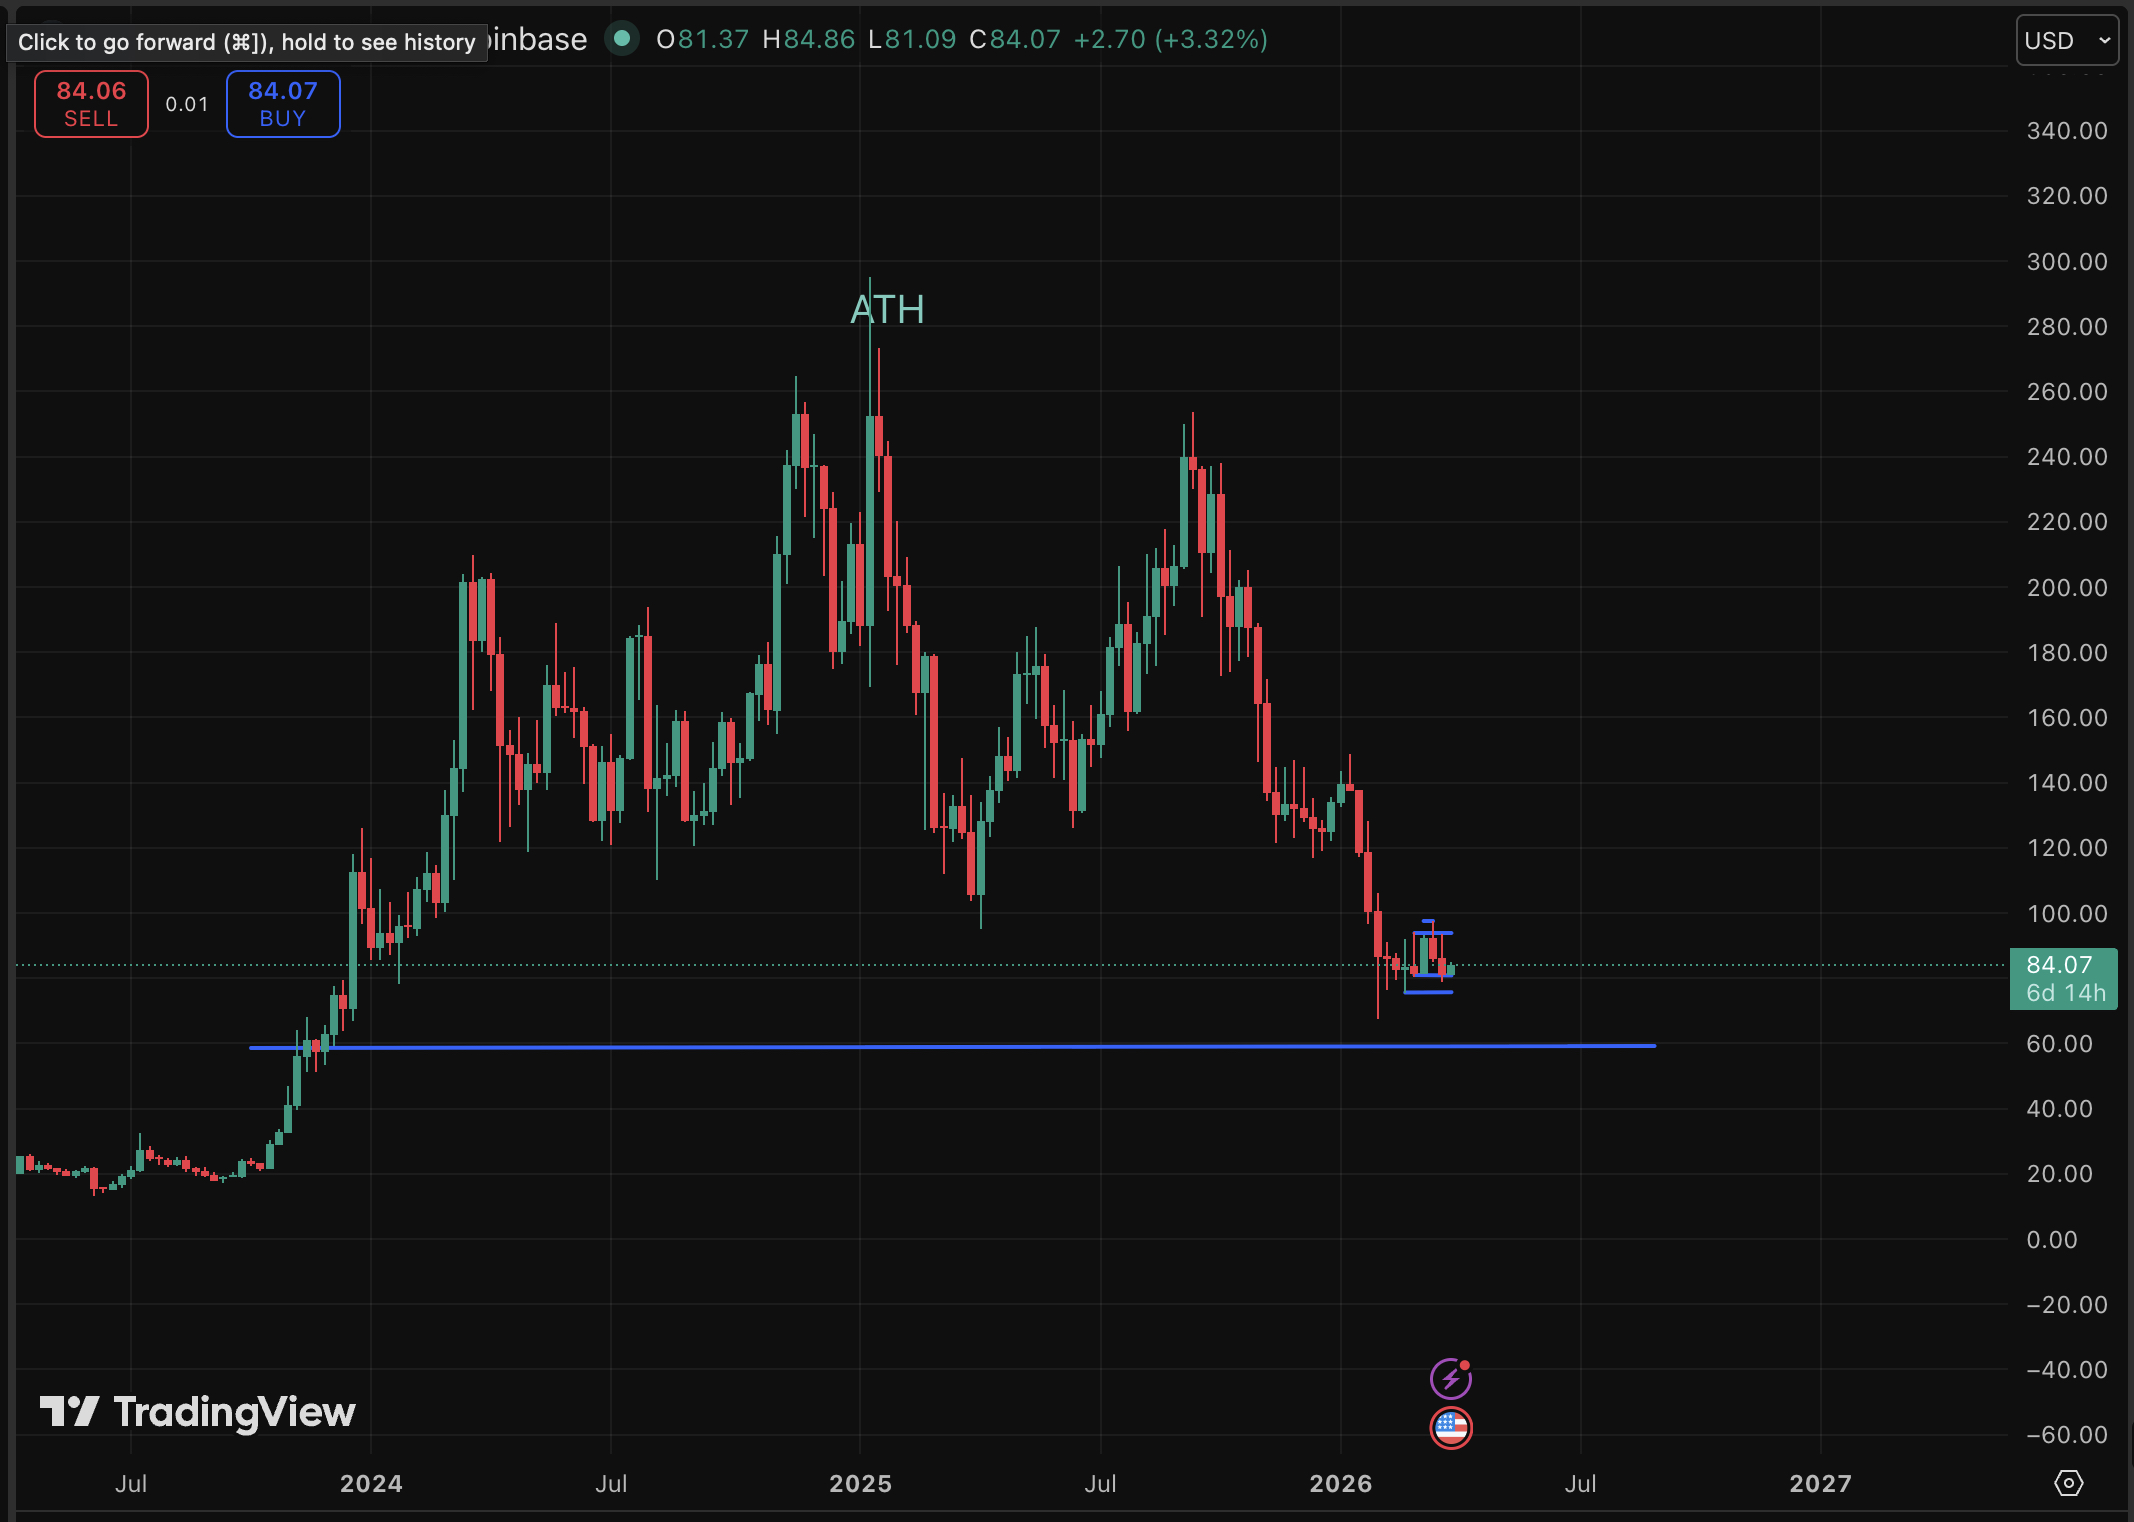
The head-and-shoulders pattern on the three-day chart is the dominant concern. A confirmed break below $80, assigned a 38.5% probability by current market structure, triggers the measured move toward $59. That would represent a further 28% decline from current levels. Resistance to reclaim sits at $96 first, then $105.
Discover: The best crypto to diversify your portfolio with
Maxi Doge Is an Early Mover With Upside Potential
When a leading L1 trades 70% off its highs, and DEX volumes hit annual lows, the rotation question becomes unavoidable: where does speculative capital go while waiting for the cycle to reset? Memecoin sentiment hasn’t disappeared; it has compressed, historically a precursor to violent repositioning once fear fades.
Maxi Doge ($MAXI) is a meme token built on Ethereum’s ERC-20 standard, positioning itself around what it calls “1000x leverage trading mentality,” with a canine mascot embodying the grind-and-hold bull market ethos.
The project has raised $4,7 million at a current presale price of just $0.000281, with 60% staking APY available to holders. Standout mechanics include holder-only trading competitions with leaderboard rewards and a Maxi Fund treasury allocated toward liquidity and partnerships.
Research MAXI DOGE here, and join the army.
This article is for informational purposes only and does not constitute financial advice. Crypto assets are highly volatile. Always conduct your own research before investing.
The post Solana Price Prediction: DEX Activity Slumps to 1 Year Low as Memecoin Frenzy Fades appeared first on Cryptonews.

The Ethereum Foundation is stepping up its efforts to put treasury assets to work, with data from Arkham showing it staked more than 20,000 ETH on Monday, expanding its validator footprint even as yields hover below 3% and ether trades near $2,045.
Arkham data shows the transfers were split into uniform chunks of roughly 2,047 ETH.
THE ETHEREUM FOUNDATION IS STAKING ETH
The Ethereum Foundation just staked $46.2M of ETH. This is more ETH than they have EVER staked before. pic.twitter.com/gCCc0qK6VN
— Arkham (@arkham) March 30, 2026
The deposits extend a strategy first outlined in February, when the foundation said it would stake 70,000 ETH to generate yield for operations. That initial roll-out began with a 2,016 ETH deposit and positioned staking rewards as a funding source for research, ecosystem development and grants, turning long-held reserves into a steady income stream.
Based on the CoinDesk Composite Ether Staking Rate (CESR), the foundation will get a 2.7% yield from its staked ETH. This is down from 3.4% earlier in the year.
Onchain data shows that the Ethereum Foundation has another 147,400 ETH ($303 million) in its treasury.
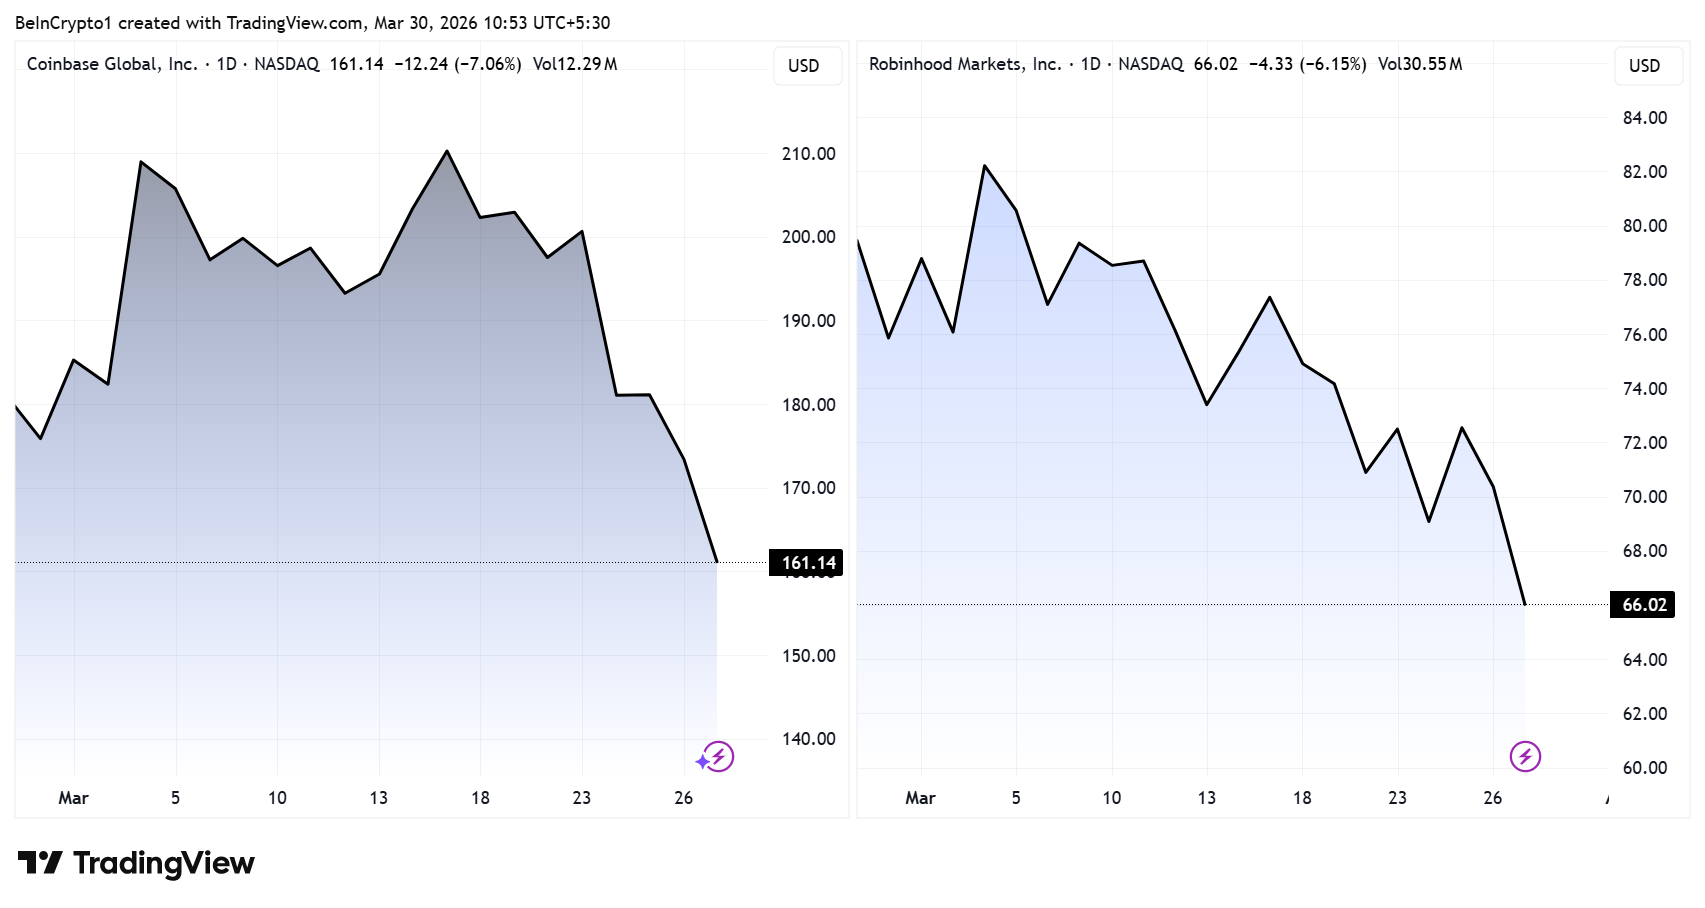
Goldman Sachs analyst James Yaro told clients that crypto-linked equities look selectively attractive after falling 46% from their October 2025 peak.
The research note maintained Buy ratings on three names. Robinhood Markets (HOOD), Figure Technologies (FIGR), and Coinbase Global (COIN) each offer distinct upside.
Valuations Near Historical Trough Levels
Yaro noted that the current drawdown has roughly matched the average peak-to-trough decline seen in previous crypto cycles. Prices have shown volatile but stabilizing behavior over recent weeks, suggesting forced selling pressure may be easing.
“All in, we see an increasingly attractive entry point to our digital-asset sensitive coverage, albeit selectively, across the group,” a TradFi media reported, citing Yaro.
Among the three picks, Goldman cut its HOOD price target to $91 from $102 and lowered its COIN price target to $235 from $270.
However, it raised FIGR’s target to $42 from $39, implying roughly 35% upside. HOOD closed at $66.02 and COIN at $161.14 on March 28, both down sharply year to date.
Subscribe to our YouTube channel to watch leaders and journalists provide expert insights
Robinhood recently approved a $1.5 billion share buyback, signaling management confidence at current levels.
Figure Technologies, a blockchain-native lender that originated over $16 billion in on-chain home equity loans, continues to expand its capital marketplace.
Volume Risk Remains
Goldman warned that trading volumes may still dip before recovering. Yaro estimated a further slump would trim 2026 revenue by 2% and profits by 4% for these companies. Historically, trough volumes last about three months before a meaningful rebound.
The note positions the sector as oversold but not risk-free. Investors face a window where prices may have stabilized, yet volumes and volatility could still deliver sharp swings before any sustained recovery takes hold.
The post Goldman Sachs Flags 2 Crypto Stocks Worth Buying After 46% Sector Crash appeared first on BeInCrypto.
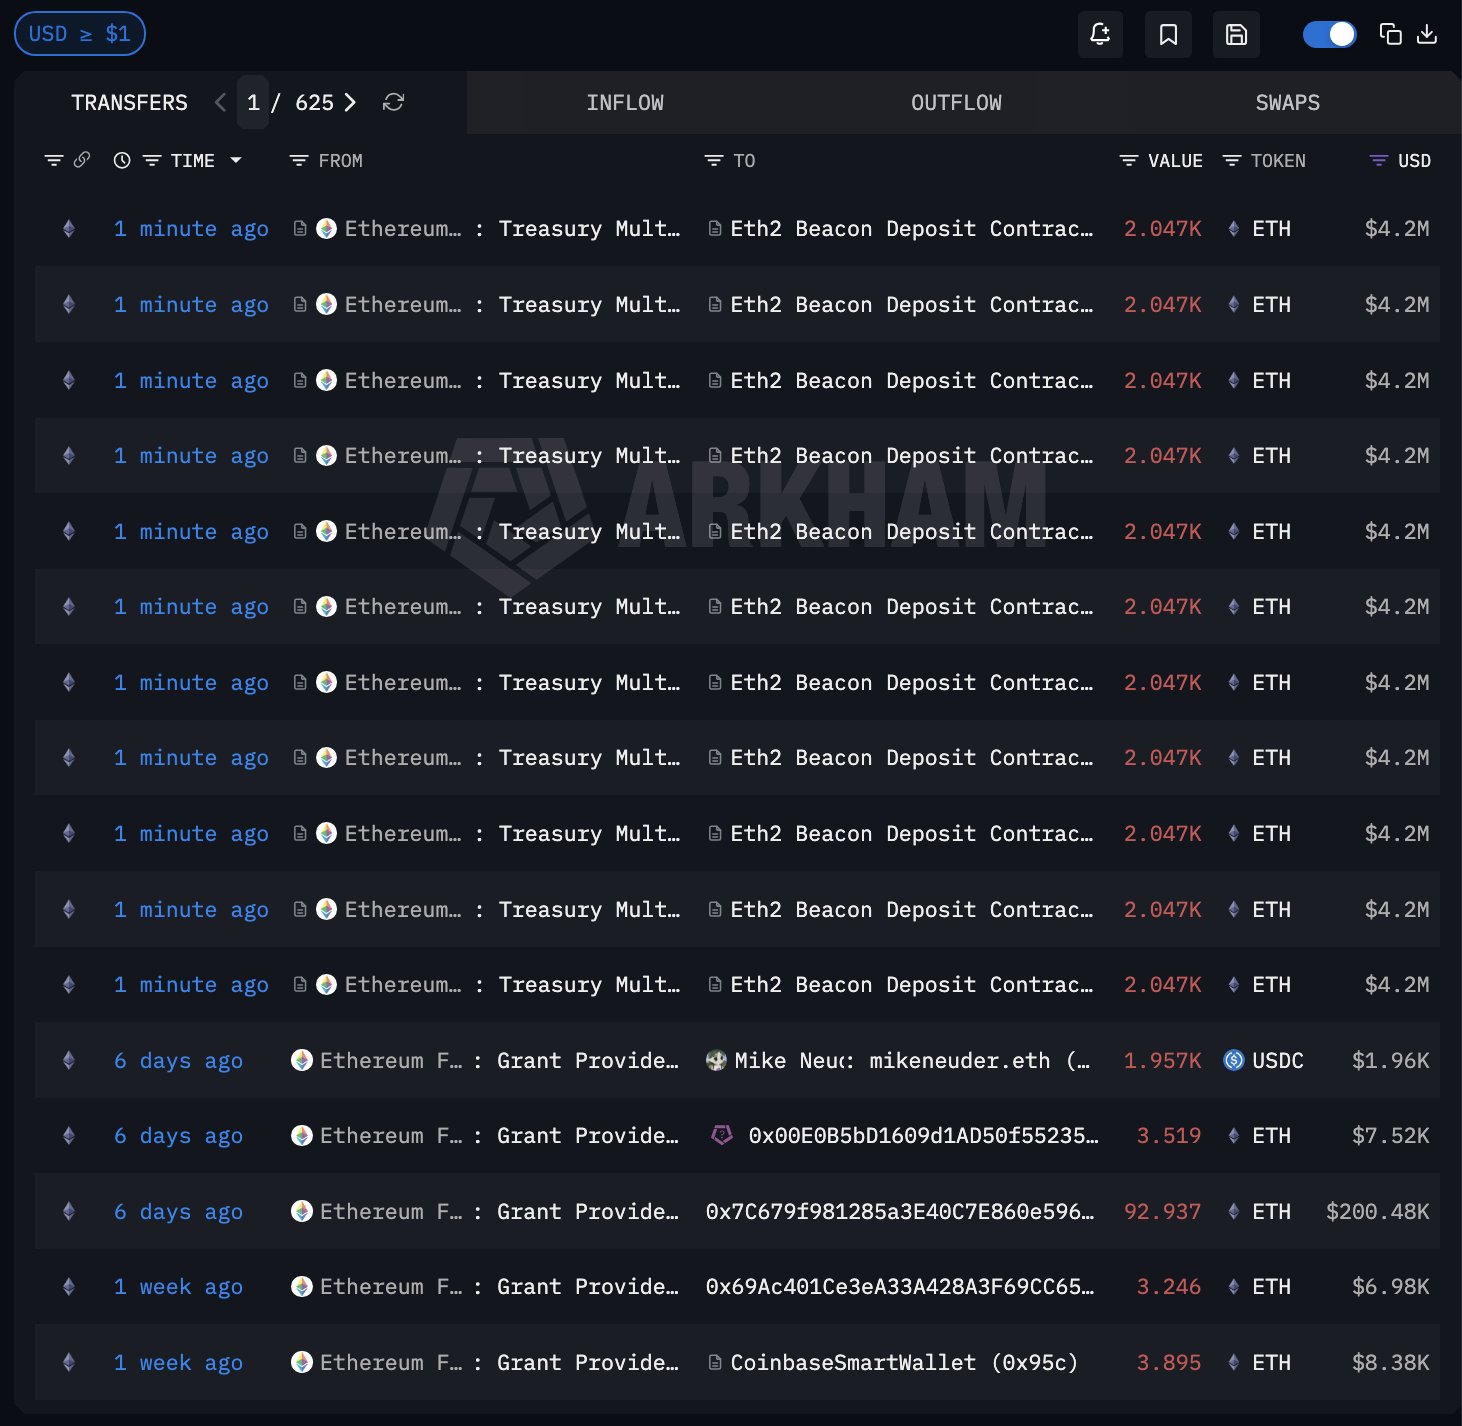
The Ethereum Foundation has accelerated its treasury staking push, deploying $46.2 million in Ether in its largest move to date after the recent BitMine sale.
On Monday, the foundation’s treasury multisignature wallet made 11 deposits into the Ethereum Beacon Deposit Contract, each of roughly 2,047 Ether (ETH), totaling 22,517 tokens worth roughly $46.2 million, according to data from Arkham Intelligence.
The Ethereum Foundation started staking ETH in February, depositing 2,016 ETH and outlining plans to stake up to 70,000 ETH, with rewards reinvested into research, ecosystem development and grants.

The foundation also deposited a smaller 31 ETH tranche earlier this month, bringing the total staked holdings to roughly 24,564 ETH as it shifts to staking to generate yield, rather than relying on periodic ETH sales, which have historically drawn criticism.
Related: Ethereum builders propose ‘economic zone’ to tackle L2 fragmentation
EF sells 5,000 ETH to BitMine in OTC deal
The new staking move comes after the EF completed an over-the-counter (OTC) sale of 5,000 Ether to BitMine Immersion Technologies, valued at about $10.2 million. The foundation said proceeds would support core operations, including protocol research, ecosystem growth and community grants.
The transaction marked the foundation’s second direct OTC sale to a corporate buyer, following a 10,000 ETH sale to SharpLink Gaming in July 2025.
The EF currently holds about $361 million in onchain assets, with the vast majority, roughly $360.8 million, held in Ether on the Ethereum network, alongside small balances across networks like Arbitrum, Optimism and Bitcoin, according to Arkham.
Related: Ethereum risks losing No. 2 spot as stablecoins gain ground
Ether price risks further decline
Ether fell below the $2,000 level over the weekend, raising the risk of a deeper correction. Analysts, including Onur, CryptoWZRD and Ted Pillows, pointed to repeated failures at $2,200 and weakening momentum, with some warning ETH could fall toward the $1,750–$1,850 range.
Demand for Ether has also turned negative, hitting its lowest level in 16 months, according to Capriole Investments.
Magazine: Ethereum’s Fusaka fork explained for dummies — What the hell is PeerDAS?

A trader pulled off a nearly 100x return on decentralized betting platform Polymarket in less than a minute, thanks to a blunder by a UFC announcer.
In Sunday’s UFC heavyweight bout, Tyrell Fortune beat Marcin Tybura to secure his first UFC victory. But the event was not without drama. Cage announcer Bruce Buffer initially read the result in favor of Tybura, a result that stood for less than a minute before Buffer corrected the mistake.
LlamaEnjoyer, a Polymarket trader, also known as Verrissimus on X, capitalized on the error, turning roughly $676 into $67,000.
When Tybura was named victor, his shares spiked toward 99 cents and Fortune’s collapsed to about 1 cent. LlamaEnjoyer said they almost placed a $100,000 bet on Tybura at 99 cents, but stopped when they realized something was awry. Instead, the trader bought $676 worth of Fortune shares at 1 cent. Seconds later, when the UFC corrected the announcement and the shares immediately jumped to $1.
“I almost bought Tybura at 99¢ with $100k. Stopped, realized something was off. Cancelled my order, scooped up 1¢ shares instead. The UFC corrected the winner seconds later. Easiest 100x ever,” Verrissimus said on X.
LlamaEnjoyer’s quick thinking illustrates how fast prediction market prices can swing during live events, especially when big announcements are misread or misreported.
The incident also raises questions about how payouts are handled when there’s an error at the “source of truth” — the reference that contracts rely on to settle outcomes. Since the error originated from the UFC announcer, there could be a dispute over payouts or contract resolution, even though the trader’s actions remain fully legitimate.
Florida family holidays: spaceships, surfing and treetop adventures

National cabinet agrees to four levels of fuel action

Coinbase survey finds over half of customers don’t understand crypto tax


-
 NewsBeat5 days ago
Manchester United reach agreement with Casemiro over contract clause amid transfer speculation
-

 News Videos4 days ago
Parliament publishes latest register of MPs’ financial interests
-

 Sports7 days ago
Gary Kirsten Accuses Pakistan Cricket Board Of ‘Interference’, Mohsin Naqvi Responds
-

 NewsBeat3 days ago
The Story hosts event on Durham’s historic registers
-

 Business4 days ago
Instagram, YouTube Found Responsible for Teen’s Mental Health Struggle in Historic Ruling
-

 News Videos7 days ago
Ch 9 Financial Management Part 1 | Detailed One Shot | Class 12 Business Studies Boards 2026
-
 NewsBeat5 days ago
Tesco is selling new Cadbury Dairy Milk bar and people can’t wait to try it
-
 Entertainment7 days ago
Cynthia Bailey Dishes on ‘RHOA’ Season 17, Discusses Kandi
-

 Tech7 days ago
Samsung will soon let you control smart home devices from your car’s dashboard
-
 Entertainment2 days ago
Lana Del Rey Celebrates Her Husband’s 51st Birthday In New Post
-

 Fashion6 days ago
Does It Matter What You Wear When You’re Laid Off and Looking?
-
 NewsBeat7 days ago
Colombian military plane with 110 soldiers onboard crashes following takeoff
-

 Business6 days ago
More women enter wealth management, but few in advisory roles: study
-

 Fashion7 days ago
Fringe Bags for the Season
-

 NewsBeat6 days ago
Entrepreneurs Forum survey reveals optimism in North East
-
 NewsBeat6 days ago
NASA Artemis II Astronauts enter 14-Day quarantine as moon rocket reaches launchpad
-

 Business6 days ago
Late-paying firms face multimillion-pound fines under new crackdown
-

 Politics7 days ago
How Media Platforms Balance Performance and Accessibility in Image Delivery
-
 Crypto World6 days ago
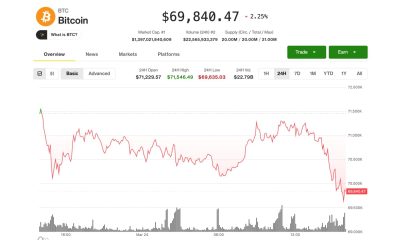
BTC gives up $70,000 level as markets mull higher interest rates
-

 Sports5 days ago
Fantasy Baseball Week 1 Preview: Top sleeper hitters for both five- and 12-day period led by Munetaka Murakami
You must be logged in to post a comment Login