
Crypto World
Is BTC Heading for $60K After Rejection at $70K?
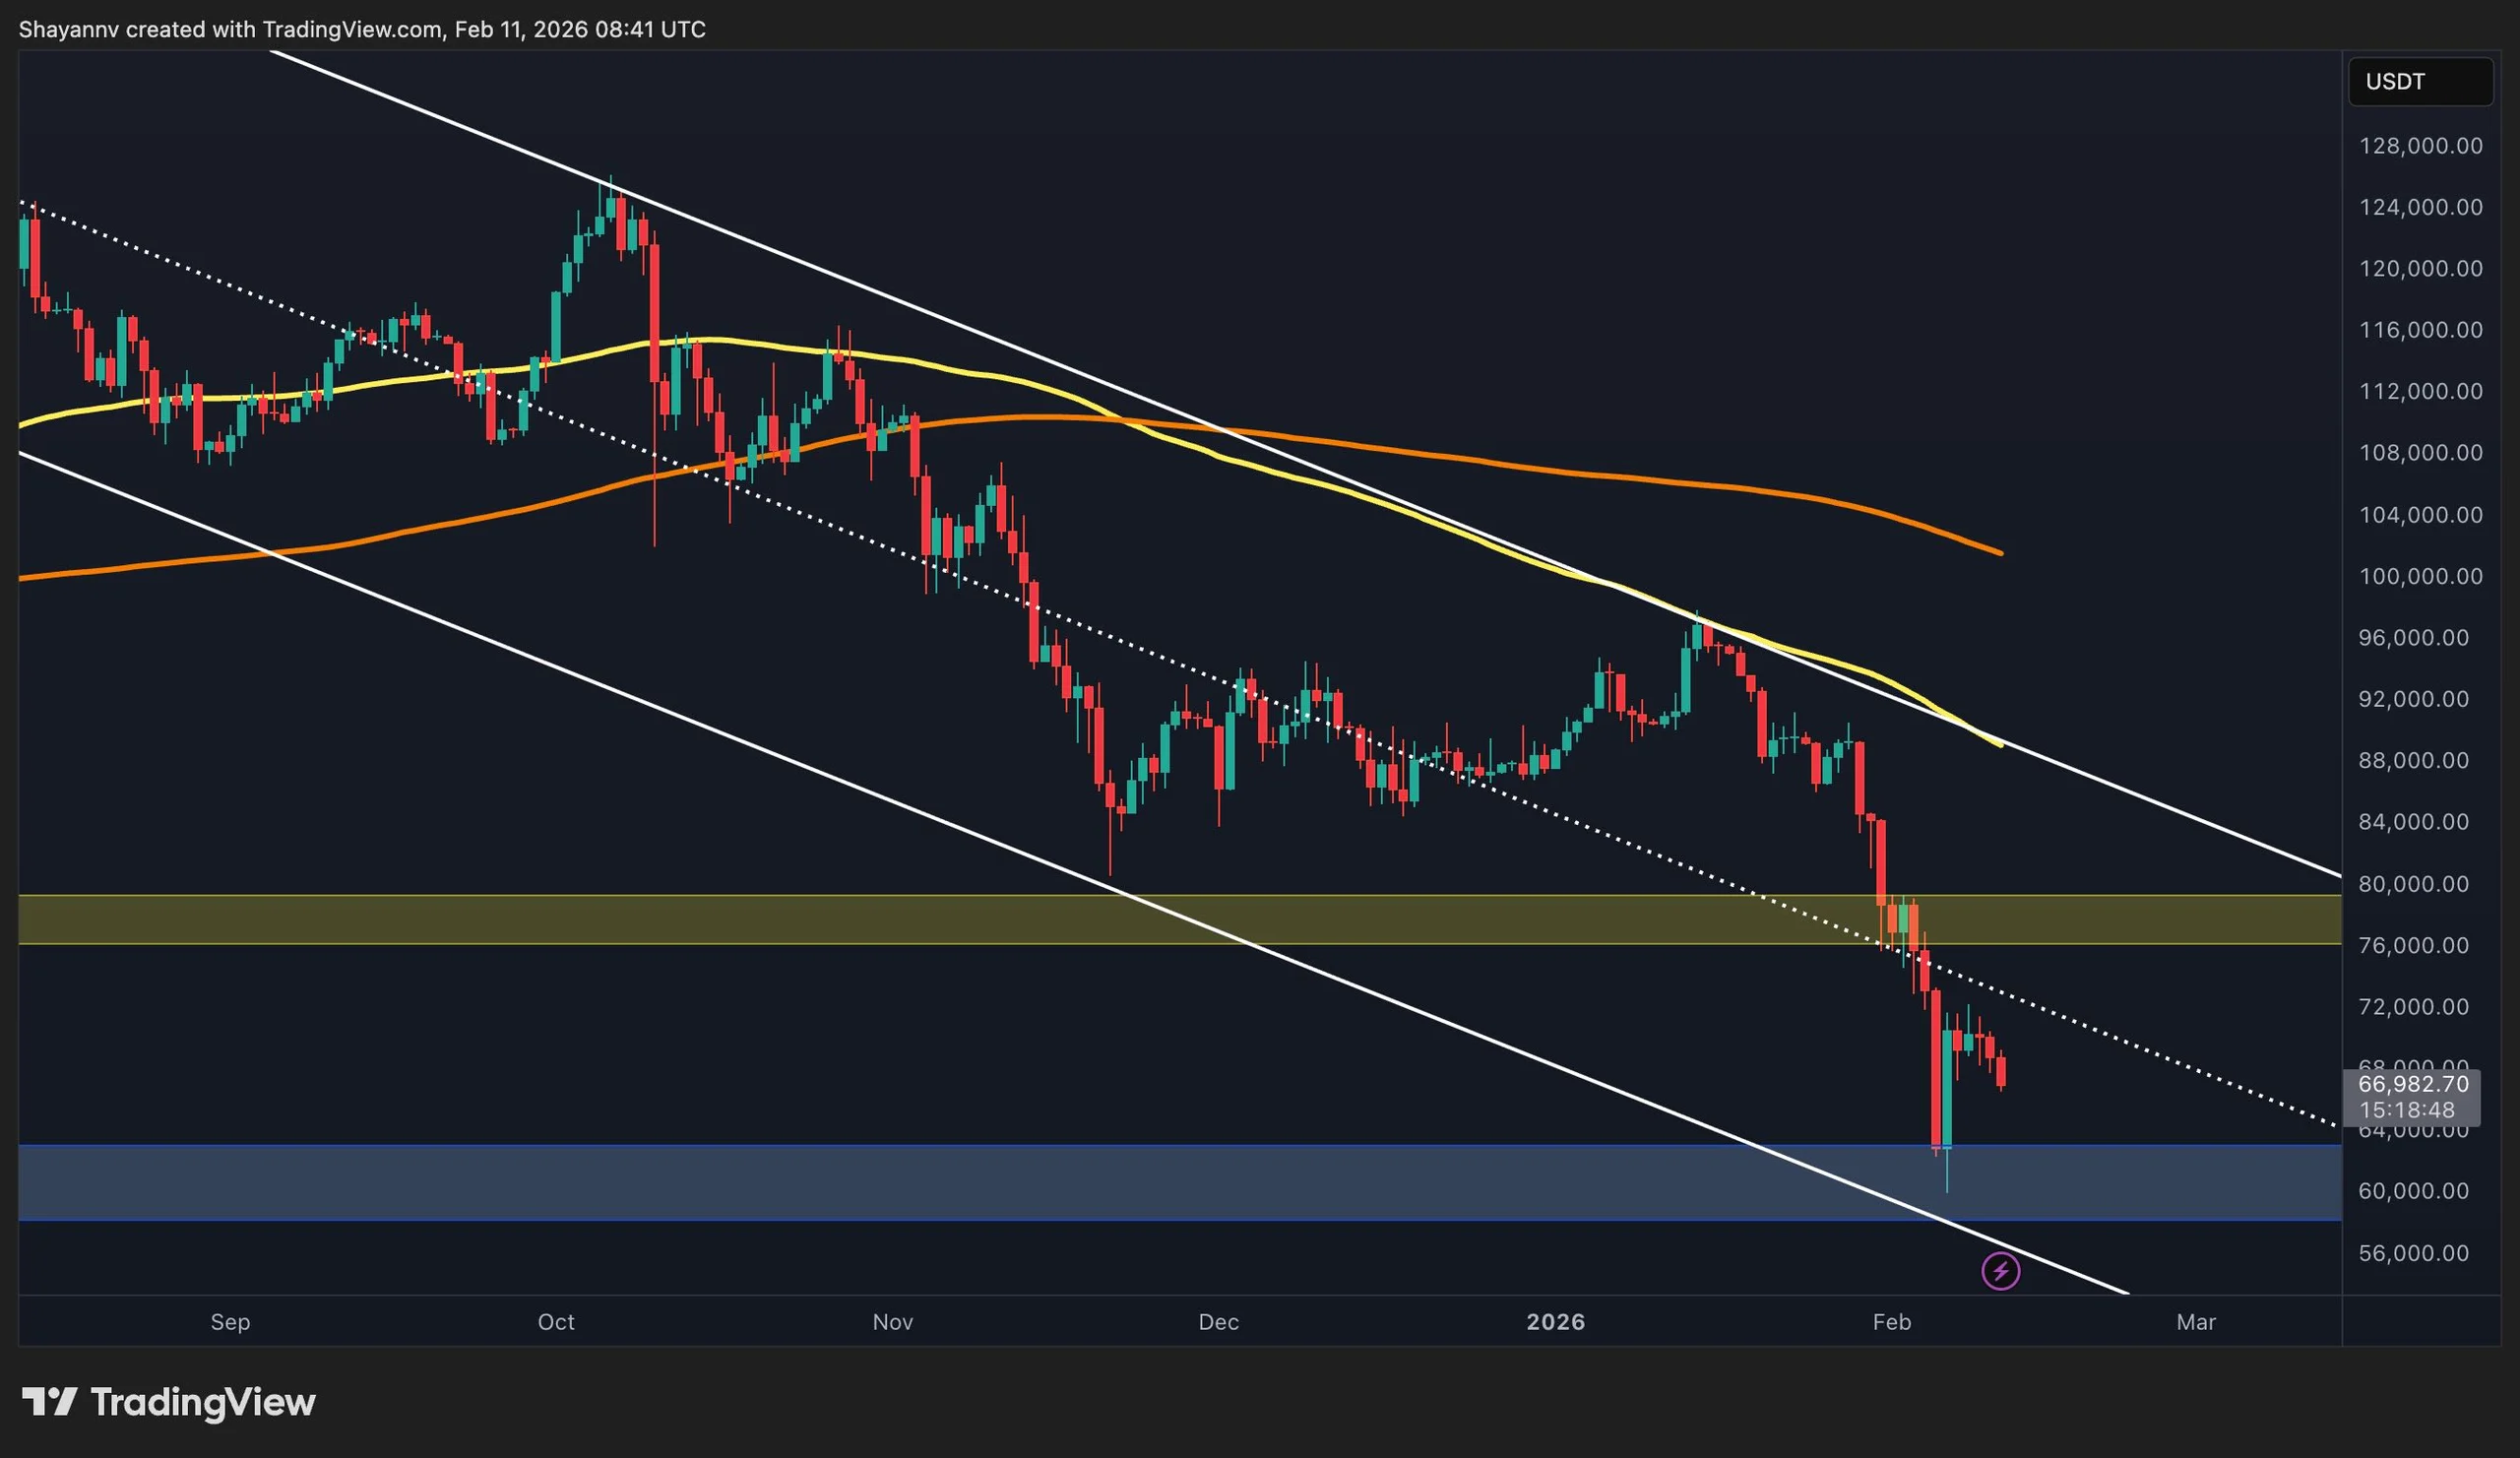
Bitcoin encountered renewed selling pressure at the key $70K resistance level, resulting in a clear rejection. As a result, the price action has transitioned into a consolidation phase above the critical $60K support zone, with further fluctuations likely in the near term.
Bitcoin Price Analysis: The Daily Chart
On the daily timeframe, BTC’s rebound from the $60K demand region stalled at the $70K resistance, where sellers regained control. This level closely aligns with the midline of the descending channel, reinforcing its technical significance. A decisive break above this dynamic boundary would be required to restore bullish momentum.
For now, Bitcoin remains confined within a defined range, bounded by the static $60K support and the channel’s dynamic mid-boundary near $70K. Consolidation appears to be the dominant scenario, with a breakout on either side likely to trigger a more substantial directional move.
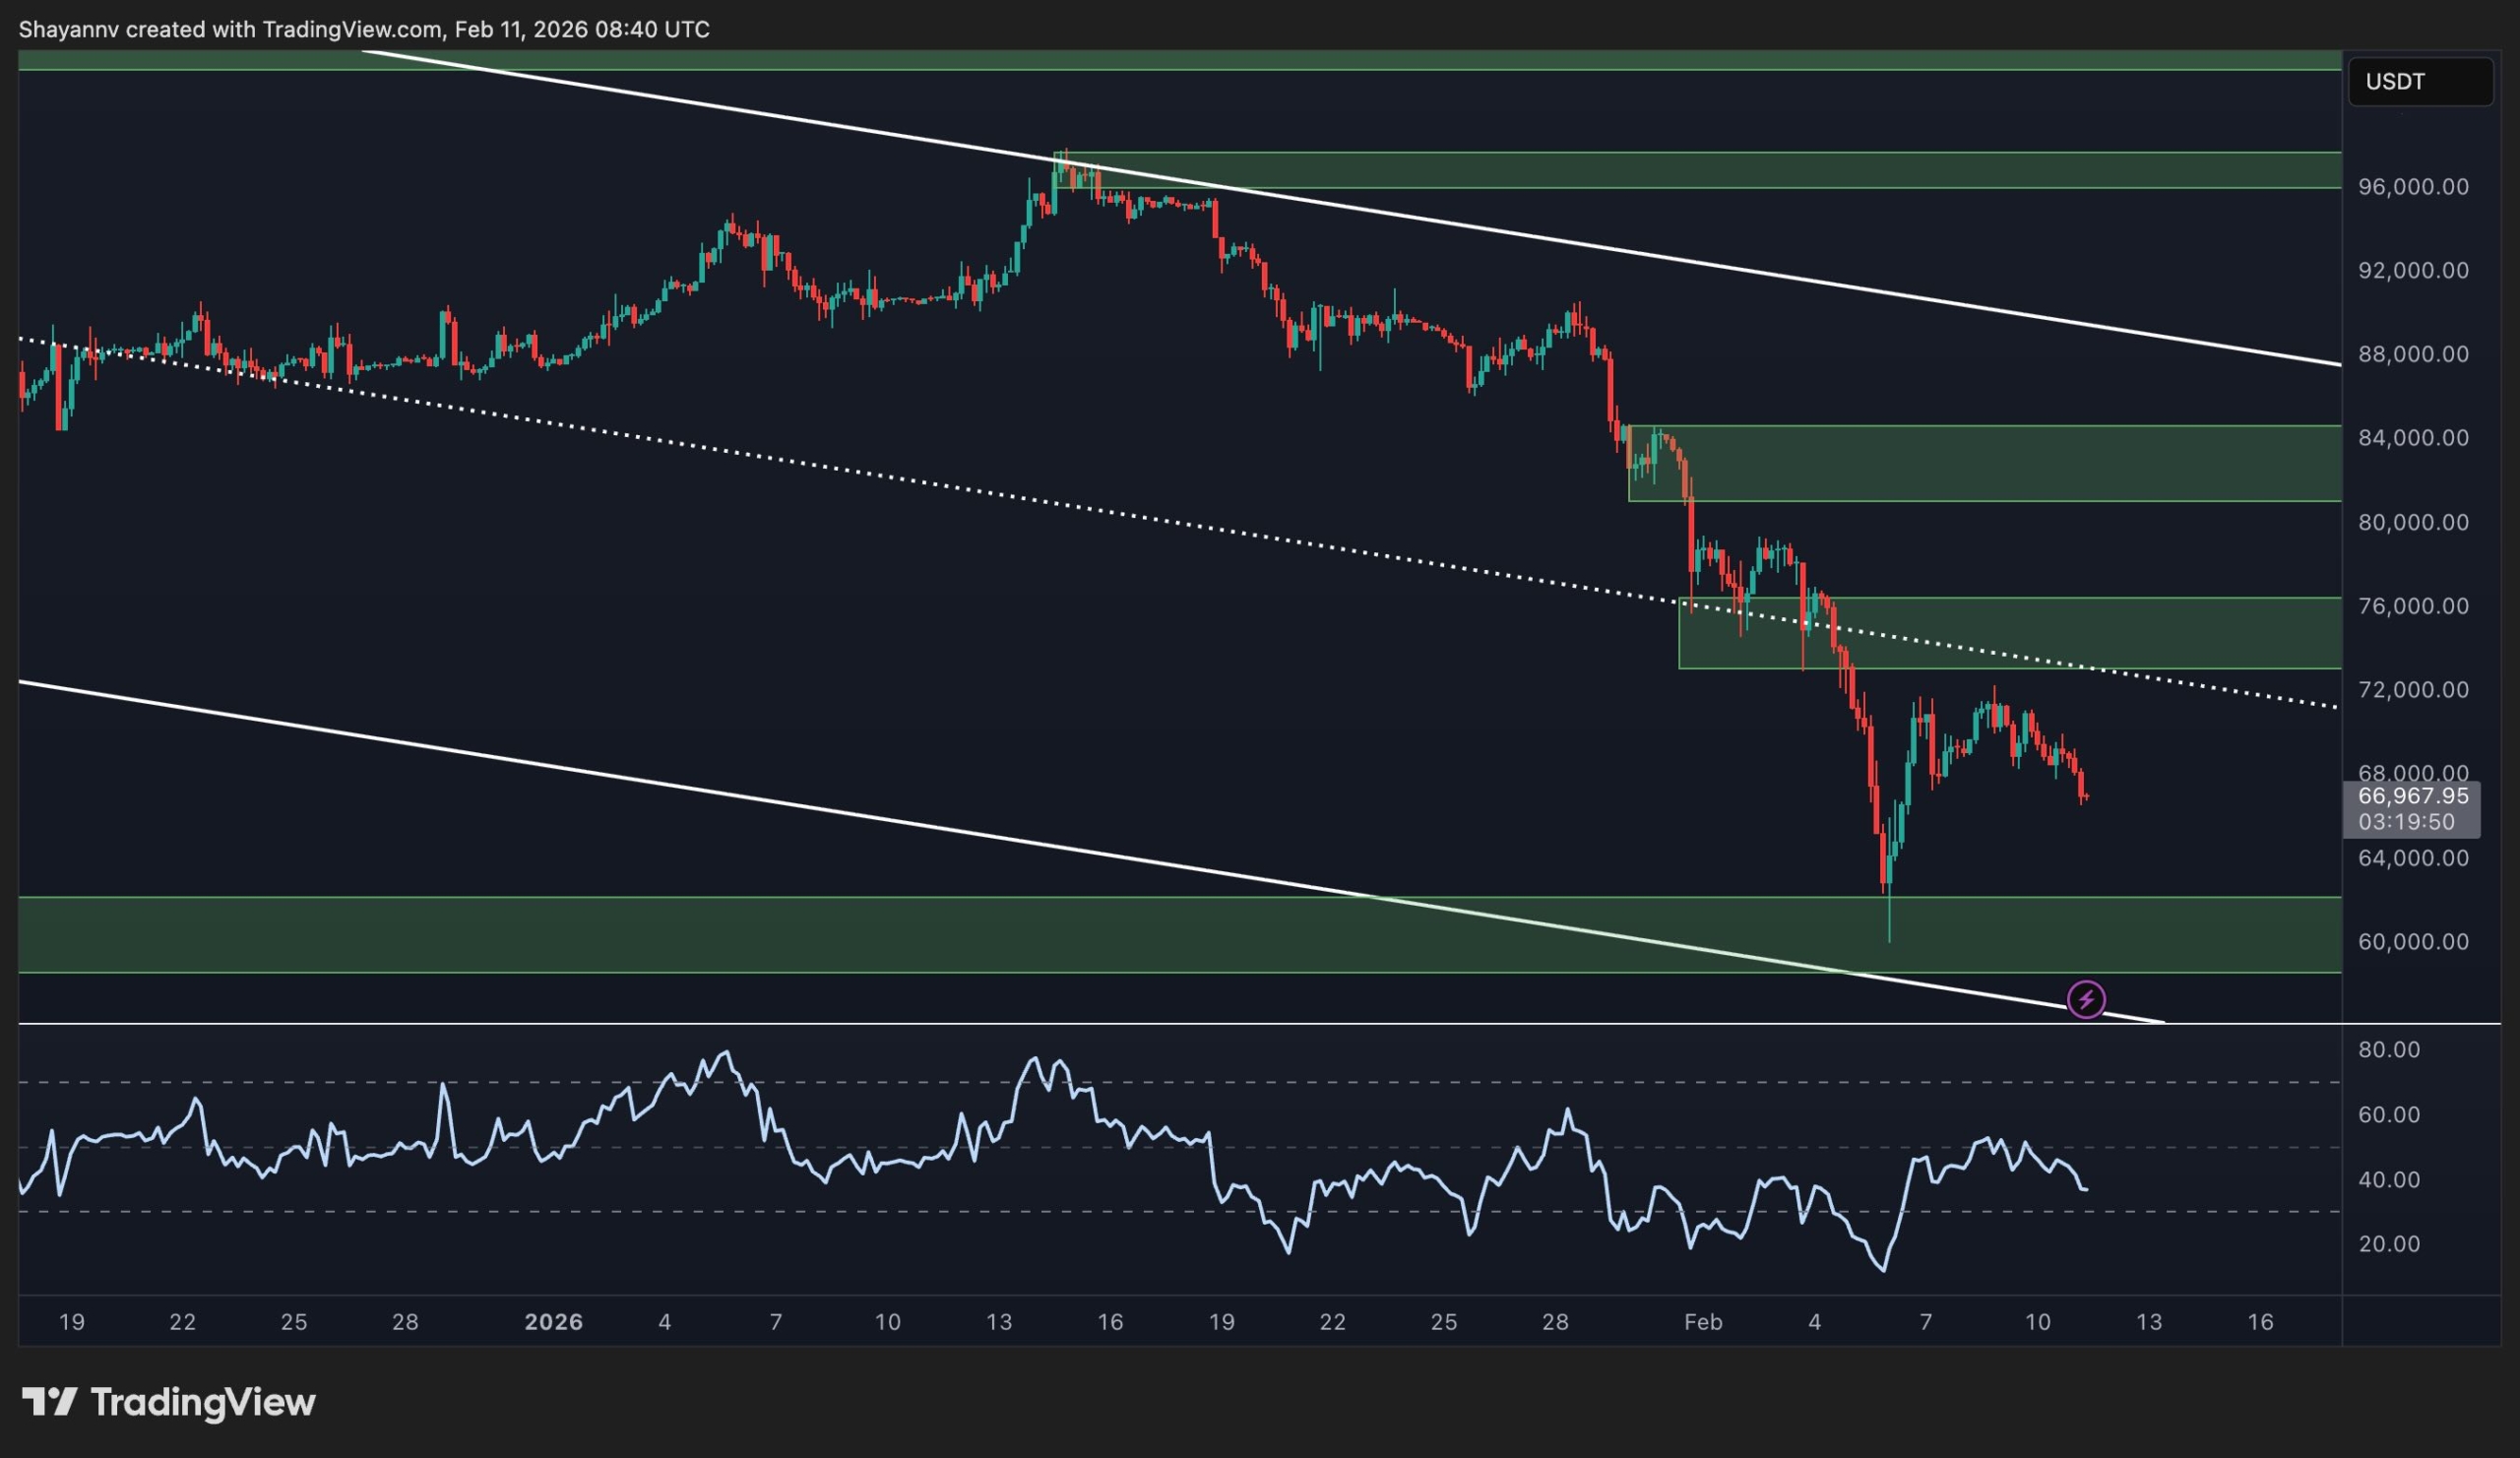
BTC/USDT 4-Hour Chart
On the 4-hour chart, the rejection at $70K is more pronounced, with the asset retracing toward the $66K area. A notable bullish divergence between price action and the RSI suggests weakening downside momentum, increasing the probability of a short-term range-bound structure between the $60K and $75K levels.
However, the internal resistance at the channel’s midline continues to cap upside attempts, limiting bullish follow-through and keeping the broader structure neutral-to-bearish until a clear breakout materializes.
Sentiment Analysis
Bitcoin funding rates across all exchanges have recently flipped deeply negative, reaching extreme levels around -0.014 while the price dropped toward the $66.9K region. This sharp shift into negative territory signals aggressive short positioning, as traders are now paying a premium to hold bearish bets.
Historically, such extreme negative funding prints tend to appear during panic-driven sell-offs, when the market becomes crowded on the short side. The current structure suggests that derivatives traders are heavily positioned for further downside following the breakdown below the $70K area.
From a positioning standpoint, this creates conditions for a potential short squeeze if spot demand steps in. When funding remains deeply negative while price stabilizes, it often reflects exhaustion in selling pressure. However, if price continues to trend lower while funding stays negative, it confirms sustained bearish dominance rather than a temporary flush.
At this stage, the funding data highlights elevated fear and aggressive short exposure, placing the market in a sensitive zone where volatility expansion, either through continuation or a squeeze, becomes increasingly likely.

SECRET PARTNERSHIP BONUS for CryptoPotato readers: Use this link to register and unlock $1,500 in exclusive BingX Exchange rewards (limited time offer).
Disclaimer: Information found on CryptoPotato is those of writers quoted. It does not represent the opinions of CryptoPotato on whether to buy, sell, or hold any investments. You are advised to conduct your own research before making any investment decisions. Use provided information at your own risk. See Disclaimer for more information.

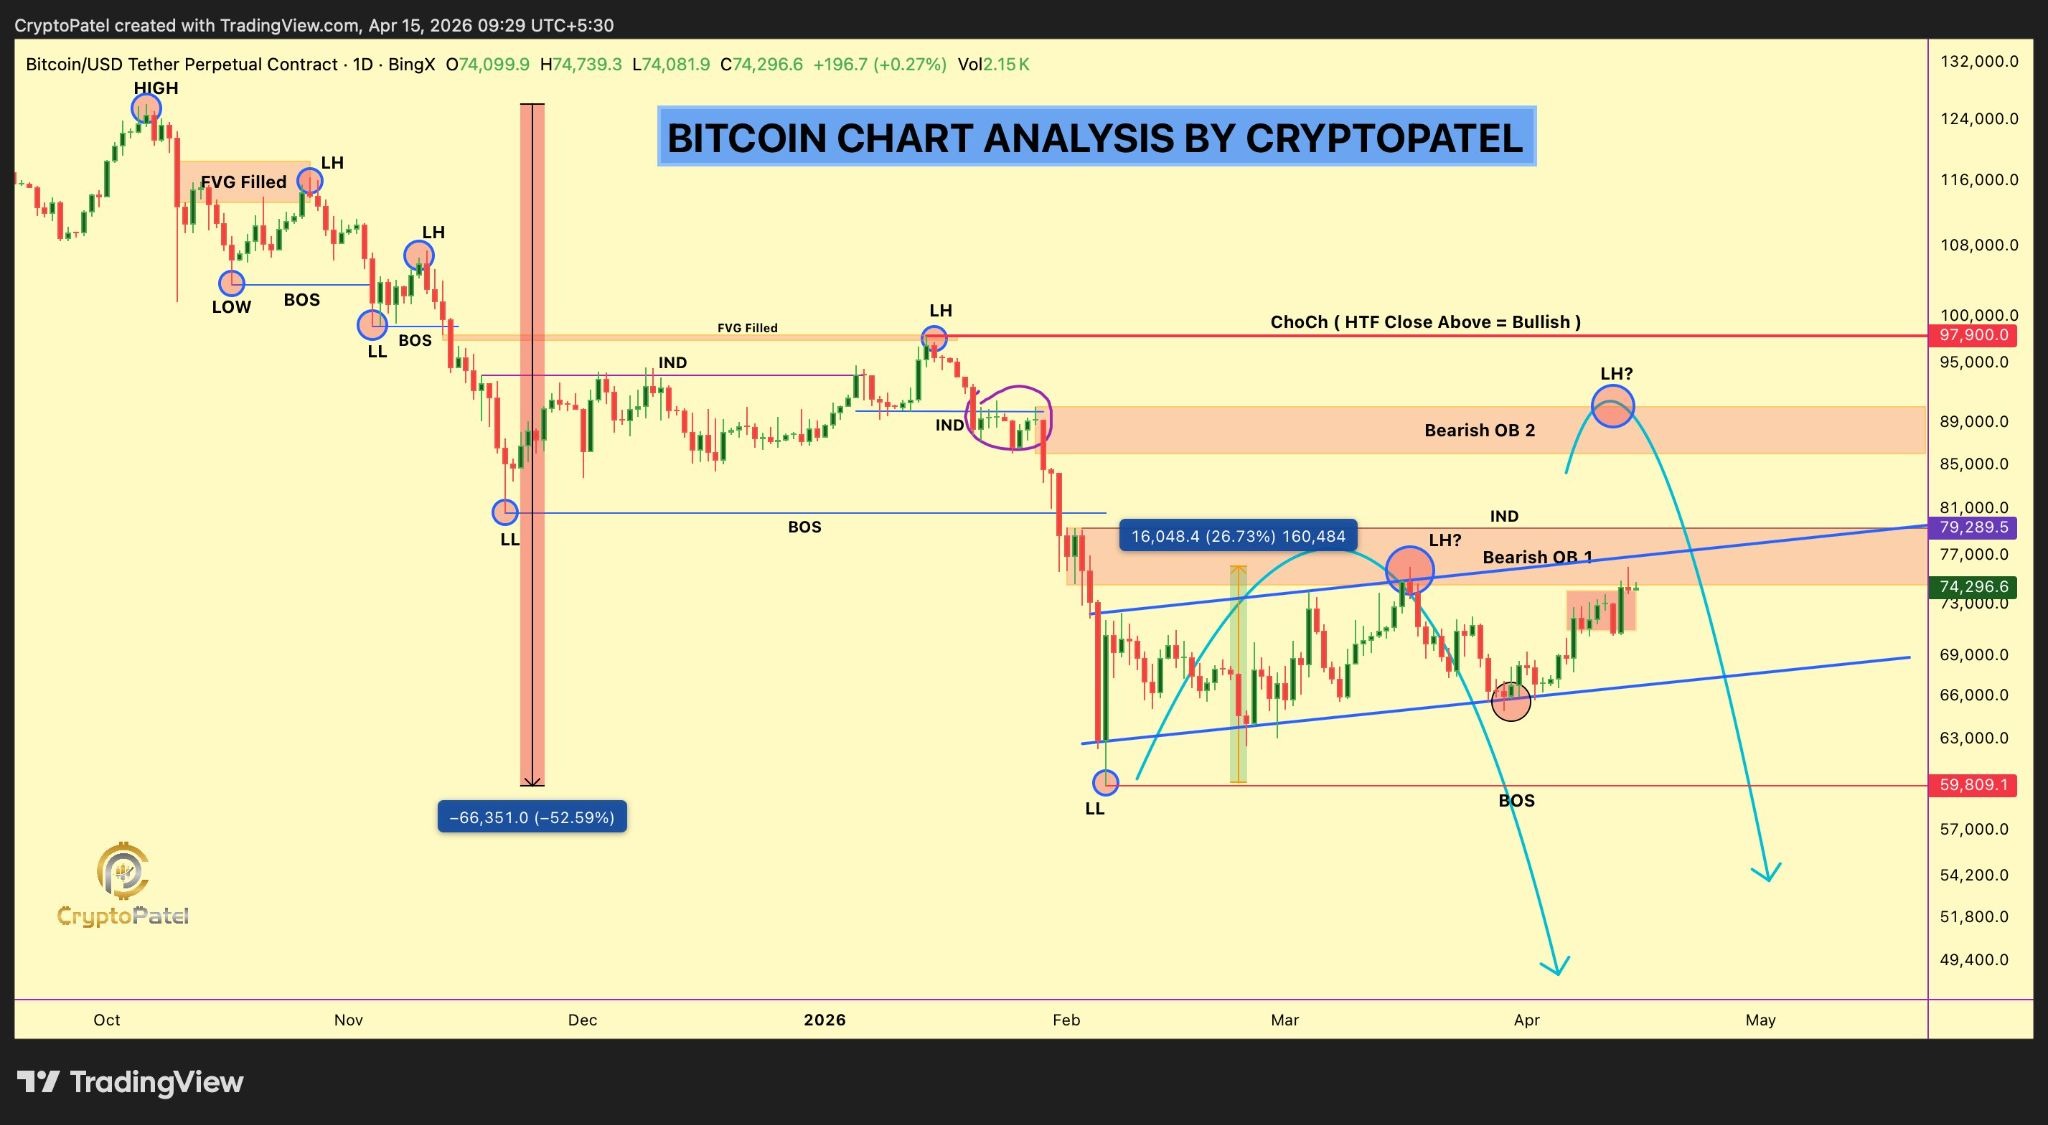
Bitcoin (BTC) struggles to reclaim price highs above $76,000, but analysts say that the uptrend may continue if key conditions are met.
Bitcoin’s 8% climb over the last three days saw it reclaim key levels, including the 50-day exponential moving average (EMA) at $71,000.
“$76K is the level that decides everything,” analyst Crypto Patel said in a Wednesday post on X, adding:
“We need a proper HTF candle close above this zone to trust the move.”
Related: Bitcoin falls to lower support as analysts say markets are ignoring key Iran issue
The analyst further explained that a high-time frame close above $76,000 would open the path toward the $84,000-$96,000 zone, where investors acquired more than 2 million BTC over the last six months, according to Glassnode’s cost basis distribution heatmap.

Echoing this view, trading resource Material Indicators said that “there are multiple levels of technical resistance stacked” between the spot price and a “bonafide $BTC bull market breakout.”
These include the yearly open at $87,500 and the 50-week moving average at $97,000, which must be reclaimed to confirm that the “$BTC bull market has returned,” Material Indicators said in a follow-up post.

The trading resource further pointed out that the relative strength index must close and hold above the 41 level in the weekly time frame.
Previous occurrences in 2023, 2020 and 2019 have led to 660%, 1,600% and 316% BTC price rallies, respectively.
“Obviously, we are not there yet,” Materials indicators said in a video posted on X, adding:
“Those are the macro things that need to happen to say a validated bull market is on.”
For analyst Rekt Capital, the BTC/USD pair needs to achieve a weekly close above $72,800 to “confirm a breakout.”

As Cointelegraph reported, the bulls must decisively break above the $76,000-$80,000 range to confirm a trend change.
Optimism needs to return to the BTC market
The bull score index, a measure of Bitcoin’s overall market health that combines fundamental and technical metrics, indicates a significant improvement in market conditions following BTC’s latest move to $76,000.
The metric increased to 40 on April 15, the highest since late October 2025. This reading remains within neutral territory, reflecting a gradual recovery after a period of relatively weak momentum.
While the bull score index improvement to 40 “reflects relative stability in the market,” it must rise to an area of “strong optimism (above 60), which typically indicates strong bullish conditions,” CryptoQuant analyst Arab Chain said in a Quicktake post, adding:
“If the indicator continues to improve gradually, it may signal a potential return of upward momentum, especially if higher levels are reclaimed in the coming period.”

Meanwhile, demand for spot Bitcoin ETFs remains intermittent, with these investment products recording alternating inflows and outflows after every few days.
Although the $451 million in net inflows recorded on Tuesday pointed to a return in demand from US investors, persistent positive flows are required to propel BTC price higher.

As Cointelegraph reported, onchain activity is showing “bull market behavior,” with Bitcoin’s daily transaction count reaching 17-month highs, further reinforcing BTC’s upside potential.
This article is produced in accordance with Cointelegraph’s Editorial Policy and is intended for informational purposes only. It does not constitute investment advice or recommendations. All investments and trades carry risk; readers are encouraged to conduct independent research before making any decisions. Cointelegraph makes no guarantees regarding the accuracy or completeness of the information presented, including forward-looking statements, and will not be liable for any loss or damage arising from reliance on this content.


France has logged 41 crypto-linked kidnappings in 2026, prompting Interior Ministry plans for tougher measures after the country became Europe’s hotspot for “wrench attacks.”
Summary
- France’s Interior Ministry will roll out new measures to protect crypto holders after 41 kidnappings so far in 2026.
- Officials say France now accounts for about 40% of Europe’s crypto “ransom attacks,” after a 75% global jump in 2025.
- A new prevention platform has drawn thousands of sign‑ups as authorities move to treat crypto crime as a physical security threat.
French Interior Ministry representative Jean‑Didier Berger says France will introduce new measures “in the coming weeks” to deal with a wave of crypto‑linked kidnappings that has made the country an epicenter of what police now call “wrench attacks.” Speaking at Paris Blockchain Week, Berger said authorities have already launched a prevention platform aimed at digital asset holders and attracted thousands of registrations, framing the next step as a tighter, more coordinated law‑enforcement response.
So far in 2026, officials have counted 41 kidnapping cases tied to cryptocurrency in France, an average of roughly one every 2.5 days, according to figures cited by Berger and local media. In 2025, global incidents of such ransom attacks rose 75% year‑on‑year, with France the worst‑hit country worldwide and accounting for about 40% of all cases recorded in Europe.
Berger said he is working with Interior Minister Laurent Nuñez on a “more stringent response plan” that will be deployed shortly, following internal warnings that the threat has evolved from insider disputes to systematic targeting of wealthy individuals and their families. A January memo from France’s organized crime agency SIRASCO, reported by Le Parisien, described roughly 40 crypto kidnappings and hostage‑takings between mid‑2023 and end‑2025, mostly in urban areas around Paris.
Recent cases underline the escalation. In April, GIGN commandos rescued a mother and 10‑year‑old son held for about 20 hours as kidnappers tried to extort “several hundreds of thousands” of euros from the father, a crypto entrepreneur. Earlier this year, a magistrate linked to a Lyon‑based crypto executive and her elderly mother were held for 30 hours in a ransom plot before six suspects were arrested, including a minor.
Industry and security researchers say self‑custody has become a physical risk factor in France’s crypto scene, pushing some executives toward bodyguards and home security checks. TRM Labs and CertiK data cited by outlets such as Forbes show France logged 19 of 72 verified wrench attacks globally in a recent period, more than twice the tally in the United States, with at least 30 documented cases since 2017 and over 20 in 2025 alone.
For a government that has marketed Paris as a crypto and fintech hub under clear rules and MiCA‑aligned licensing, the surge in kidnappings now threatens to become a reputational and capital‑flight problem. As one CryptoSlate report put it, France is “where crypto wealth looks hardest to hold safely in public,” a perception Berger and Nuñez will now have to fight through prevention, rapid‑response policing and closer cooperation with an industry suddenly focused as much on physical safety as on private keys.


Summary
- Blockstream CEO Adam Back backs “optional” quantum-resistant upgrades and rejects freezing quantum‑vulnerable wallets.
- His stance clashes with BIP‑361, a three‑phase plan that would eventually invalidate legacy signatures and freeze unmigrated coins, including Satoshi’s stash.
- The debate highlights how Bitcoin must balance intergenerational security against hard limits on property rights and censorship resistance.
Bitcoin’s (BTC) long‑running debate over the quantum computing threat has flared again after Blockstream CEO Adam Back used Paris Blockchain Week to argue for optional, opt‑in upgrades instead of forcibly freezing old wallets. “Preparation is much safer than hasty responses in a crisis,” Back said, insisting that the network should build quantum‑resistant paths now while preserving user choice and property rights.
Back described today’s quantum computers as “essentially lab experiments” and noted he has followed the field for more than 25 years, during which progress has been “incremental,” but warned that Bitcoin cannot afford to wait until a real‑world break occurs. He also pushed back on calls to lock down coins by protocol fiat, arguing that the Bitcoin community has shown it can coordinate under pressure and that “bugs have been identified and fixed within hours” in past emergencies.
Back’s comments directly contrast with BIP‑361, “Post‑Quantum Migration and Legacy Signature Sunset,” a proposal from Jameson Lopp and five co‑authors that would gradually phase out quantum‑vulnerable outputs and ultimately freeze unmigrated coins. The draft, which builds on BIP‑360’s soft‑fork framework, introduces a quantum‑resistant output type and targets early formats such as pay‑to‑public‑key (P2PK) addresses that expose public keys on‑chain.
Estimates cited by CoinMarketCap and other publications say roughly 1.7 million BTC — about 34% of total supply, including Satoshi Nakamoto’s early holdings valued around $70–$80 billion at current prices — still sit in quantum‑exposed address types. Under BIP‑361’s three‑phase schedule, Phase A would begin three years after activation and ban new payments to legacy addresses, while still allowing spending from them.
Five years after activation, Phase B would go further by rendering old ECDSA and Schnorr signatures invalid, meaning any coins that had not been migrated to quantum‑resistant outputs would be effectively frozen on the network. Lopp and co‑authors frame this as necessary to prevent “intergenerational theft” by a future quantum adversary and to avoid a scenario where an attacker can seize dormant wallets and crash trust in Bitcoin’s fixed‑supply narrative.
Back and other critics counter that deliberately freezing coins crosses a red line for decentralization and censorship resistance, amounting to protocol‑level expropriation even if done in the name of security. They argue that Bitcoin has historically relied on social consensus and voluntary upgrades, and that the community should instead focus on offering robust quantum‑safe options, education and incentives so users migrate out of genuine self‑interest rather than under threat of losing control over their funds.
In previous crypto.news coverage of protocol‑level governance battles and hard‑fork debates, similar tensions have surfaced between risk‑mitigation schemes and the movement’s founding principles, from block‑size wars to taproot activation. The quantum fight, now centered on BIP‑361 and Back’s rival vision of optional defenses, is shaping up as the next major test of how far Bitcoiners are willing to go to “save” the network without breaking what made it attractive in the first place.
Crypto World
BlockDAG goes live on BingX as $0.000000726 window tightens while BTC and DOT signal shifting market trends

Disclosure: This article does not represent investment advice. The content and materials featured on this page are for educational purposes only.
Bitcoin Cash and Polkadot show mixed trends, driving interest in early-stage projects like BlockDAG amid shifting market sentiment.
Summary
- Bitcoin Cash and Polkadot stay range-bound as traders shift focus to early-stage plays like BlockDAG.
- Market uncertainty around Bitcoin Cash and Polkadot drives attention to BlockDAG ahead of listings.
- BlockDAG gains traction as its entry window narrows, with BingX listing boosting visibility and momentum.
Price action across major crypto names is starting to feel uneven again as traders reassess Bitcoin Cash price prediction and where range-bound assets may move next.
Bitcoin Cash continues to react within broader cycle bands where upside attempts often fade into consolidation rather than sustained trends. Interest around Polkadot is also shaped by its interoperability model, keeping Polkadot price prediction tied closely to how quickly cross-chain demand actually materializes.

That uncertainty is pushing attention toward earlier positioning opportunities. The question of what crypto to buy now is becoming more frequent as liquidity searches for asymmetric setups. BlockDAG (BDAG) is drawing focus with its $0.000000726 entry window tightening ahead of its BingX listing. Exchange expansion and staged rollout plans are building momentum around a phase that is still open, but narrowing fast.
Bitcoin Cash $350–$700 range drives cyclical movement
Bitcoin Cash price prediction is often based on long-term market behavior rather than rapid structural change. Bitcoin Cash has historically traded within broad zones that reflect its cycle-driven nature. Recent ranges have generally stayed between about $350 and $500. Stronger market phases have pushed it toward $600 to $700 before cooling back into consolidation.
The Bitcoin Cash price prediction outlook is shaped by liquidity conditions and overall crypto sentiment. Trading activity tends to slow during risk-off periods and expand when market demand increases. Price movement is also influenced by transaction usage trends and broader Bitcoin-related cycles. Market participants often watch these ranges to understand whether the asset is stabilizing or preparing for another directional move within its established structure over time.
Polkadot price prediction signals low range stability
Polkadot price prediction is largely shaped by how its interoperability framework evolves under real network usage. Polkadot has recently shown price movement clustered in lower single-digit ranges, generally fluctuating between about $1.10 and $1.80 in current market conditions. These levels reflect ongoing consolidation after broader cycle declines rather than directional expansion.
The Polkadot price prediction outlook depends on parachain activity, validator participation, and cross-chain demand across connected networks. Price behavior often remains compressed during periods of lower ecosystem activity. Movement tends to expand when network usage increases or when broader crypto liquidity improves.
Forecast models for 2026 continue to place expectations within similar low-range structures, suggesting gradual shifts rather than sharp breakouts under current conditions. Market direction remains closely linked to adoption pace and overall sentiment across interoperability-focused assets in the sector.
BlockDAG $0.000000726 window tightens as BingX listing goes live
BlockDAG is entering a decisive phase where attention is tightening around its current pricing window and upcoming exchange expansion. The $0.000000726 level is being positioned as a final fixed entry zone before broader market pricing takes over. This stage is increasingly defined by timing rather than speculation, as participants assess how quickly access may shift once listings expand further.
The live BingX listing marks the first major catalyst in this sequence, with additional Tier 1 exchange integrations expected to follow in quick succession. Each new listing adds visibility and reduces friction for entry, which naturally compresses the available accumulation window. That compression is becoming the central focus for those tracking momentum shifts across early-stage assets.
BlockDAG is also being discussed through the lens of asymmetric upside potential, with projections referencing a 195x scenario tied to early positioning. This framing is driving heightened attention around allocation timing rather than long-term waiting strategies. The narrative is no longer about discovery. It is about how much of the remaining supply is accessible before broader demand discovery begins.
The phrase what crypto to buy now is increasingly being shaped by this environment, where early access windows are narrowing while exchange coverage expands. BlockDAG sits directly in that intersection, where timing and availability are beginning to separate early participants from later entrants.
As additional exchanges go live and ecosystem phases progress through late April and beyond, the current pricing structure continues to tighten. Once supply transitions fully into open market conditions, price discovery is expected to shift rapidly.
In summary
The market outlook remains divided as traders reassess Bitcoin Cash price prediction and its continued reliance on cyclical range behavior. Bitcoin Cash continues to reflect liquidity-driven movement within broader market conditions. At the same time, Polkadot price prediction highlights ongoing uncertainty around interoperability adoption and network activity. Polkadot remains influenced by ecosystem participation and overall sentiment shifts.
BlockDAG is increasingly dominating attention as its $0.000000726 entry window tightens ahead of expanding exchange listings. The new BingX launch signals the beginning of wider Tier 1 exposure, with more listings expected to follow soon. Supply remains fixed while access continues to narrow, intensifying focus on early positioning. In this environment, what crypto to buy now becomes a timing question, and BlockDAG’s accelerating listing cycle and shrinking entry window continue to define urgency as market access moves toward open trading conditions.
For more information, visit the presale website, official website, Telegram, and Discord.
Disclosure: This content is provided by a third party. Neither crypto.news nor the author of this article endorses any product mentioned on this page. Users should conduct their own research before taking any action related to the company.
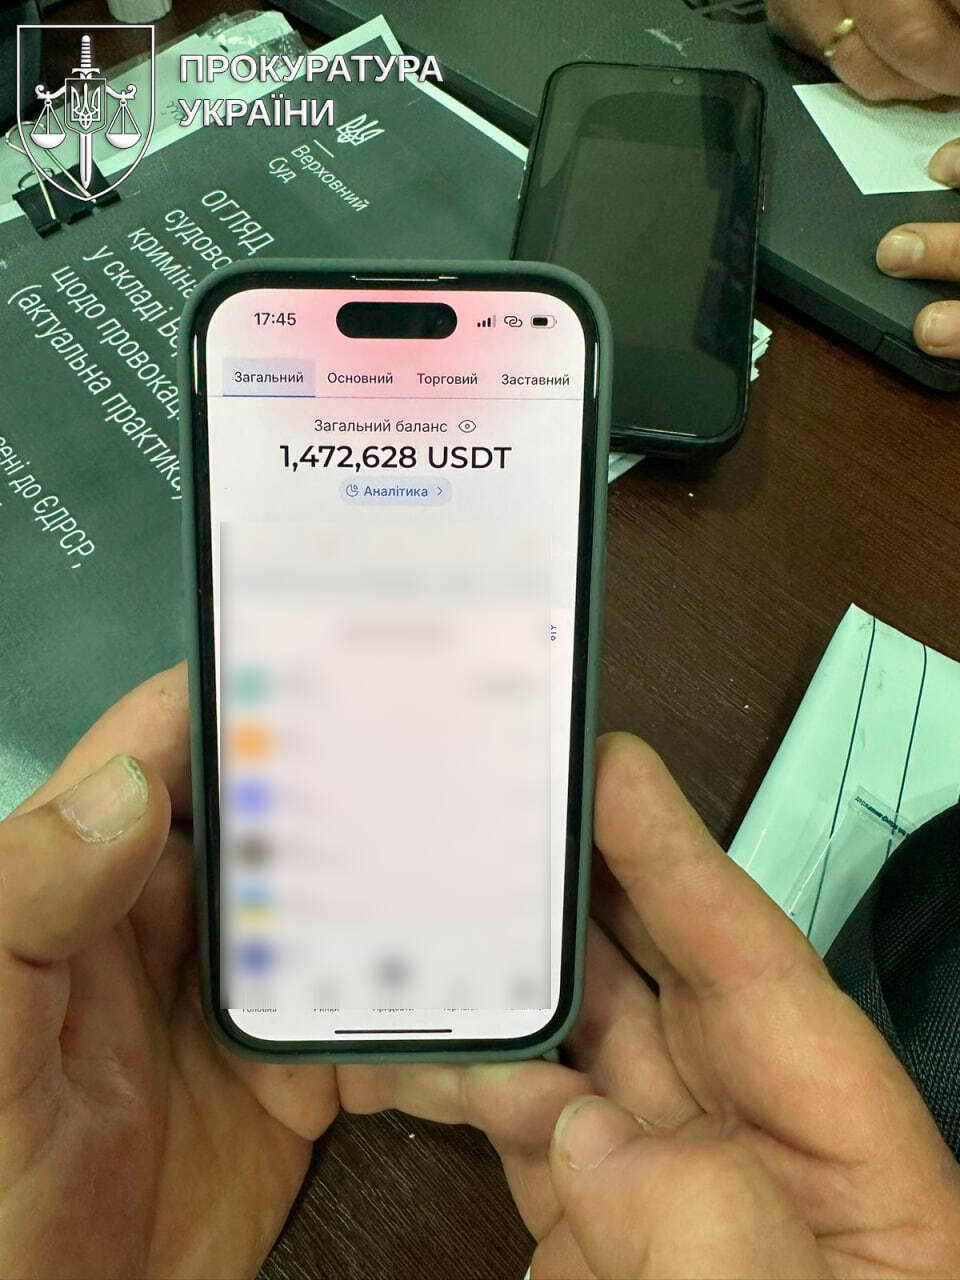
Ukrainian authorities have arrested a member of an international cybercrime network wanted by the FBI over allegations of fraud and money laundering tied to losses exceeding $100 million across the United States and Europe.
The suspect was arrested in the Transcarpathia region during a joint operation involving the National Police of Ukraine and other internal security units, Ukraine police said on Thursday. Officials said the man had been wanted internationally for some time and was eventually found in Uzhhorod, where he was living under a fake identity using forged documents.
“He issued fictitious documents about his own death and continued to live in Ukraine as a “new” person, using false documents,” prosecutors said, adding that he laundered illicit proceeds through property acquisitions, often using relatives as intermediaries to disguise ownership and financial flows.
The suspect was part of a wider cyber syndicate that deployed malicious software to harvest personal data and corporate records, later using that information to extort victims by demanding payments in exchange for silence or the return of stolen material, per the announcement. The scheme targeted individuals and institutions in both the US and Europe.
Related: Paying Iran in crypto could put shippers at sanctions risk: Chainalysis
Ukraine seizes $3 million in crypto
During the investigation, authorities seized assets worth approximately $11 million, including cash, real estate, vehicles and cryptocurrency valued at around $3 million.

Officials also flagged discrepancies between declared income and assets held by the suspect associates, pointing to tens of millions of Ukrainian hryvnias in unexplained wealth accumulation. Investigators say the financial trail helped reconstruct parts of the laundering network and confirm the scale of the operation. They also identified two additional accomplices linked to the laundering operation.
The suspect faces charges under Ukrainian criminal code provisions covering document forgery and money laundering. His alleged accomplices have also been charged and remain in custody.
Related: Ukraine blocks Polymarket, classifies prediction markets as gambling
Ukraine uncovers more hacker groups
Earlier this year, Ukraine, the United States and Germany uncovered another transnational hacking group responsible for blocking the systems of at least 11 American corporations and demanding ransom payments in cryptocurrency. Prosecutor General Ruslan Kravchenko said the attacks caused an estimated $1.5 million in damage, with the group consisting of more than 20 members, including seven based in Ukraine.
Authorities carried out searches at the homes of two Ukrainian suspects, seizing computers, phones, cash and documents. One suspect was also linked to the spread of BlackBasta malware.
Magazine: Bitcoin’s ‘biggest bull catalyst’ would be Saylor’s liquidation — Santiment founder


South Korean tech company Naver and Upbit operator Dunamu said in a corrected filing that their planned share swap includes forming an initial public offering (IPO) committee for Naver Financial within one year of closing, outlining a path toward a future listing.
The disclosure, outlined in the corrected filing on Wednesday, said the companies would pursue a listing within five years, with a possible two-year extension. Naver said it plans to secure voting rights in Naver Financial so the fintech unit remains a consolidated subsidiary after the deal.
The filing suggests the deal goes beyond a simple ownership change, outlining a structure that could eventually bring Upbit’s parent under a listed fintech group. The move indicates Naver and Dunamu are positioning any future South Korea listing at the fintech-parent level rather than through a standalone listing of Upbit’s parent.
However, Dunamu said no specific decisions have been made on whether to proceed with the IPO or on its timing or structure. It added that the deal remains subject to regulatory approvals that could still delay or derail the transaction.
Naver Financial’s plans to acquire Dunamu were first reported in September 2025 by local outlets including Yonhap and Chosun, which said the company was preparing a share swap to bring the Upbit operator under its umbrella. Naver later confirmed the transaction in a November regulatory filing, outlining a roughly $10.3 billion all-stock deal.
Investor agreement sets IPO framework, control terms
The filing said Naver, Dunamu and related parties entered into an investor agreement tied to the share swap, under which they agreed to use their “best efforts” to pursue a future listing of Naver Financial after the transaction closes.
The agreement forms the basis for post-deal restructuring, including preparations for a potential IPO.
Related: South Korea orders crypto exchanges to verify holdings every 5 minutes
The filing described the listing plan as conditional, noting that key elements, including timing, structure and execution, will depend on market conditions and regulatory developments. It added that more detailed plans would be disclosed if and when formal decisions are made.
The updated disclosure follows a roughly three-month delay to the Naver and Dunamu share swap deal timeline.
It also comes as Dunamu reported weaker operating performance in 2025, with revenue falling about 10% year-on-year to 1.56 trillion won ($1.2 billion) and operating profit dropping 26.7% to 869.3 billion won, which the company attributed to reduced crypto trading volumes during a broader market slowdown.
Magazine: Singapore isn’t a ‘crypto hub’ — it’s something better: StraitsX CEO

TLDR:
- Tether will contribute up to $127.5M, including a $100M revenue-linked credit line, to fund Drift’s recovery pool.
- Drift Protocol will issue a transferable recovery token to affected users, separate from the DRIFT governance token.
- After relaunch, Drift will settle transactions in USDT instead of USDC, aligning with Tether’s direct involvement.
- The $147.5M recovery package targets full coverage of $295M in outstanding user losses from the April 1 exploit.
Drift Protocol has secured a $147.5 million recovery package following an exploit that occurred on April 1. Tether will contribute up to $127.5 million, while additional partners will provide $20 million.
The funds will go toward covering $295 million in outstanding user losses. A dedicated recovery pool will be established using exchange revenue and committed support funds. The relaunch will also shift settlement from USDC to USDT.
Tether Leads Major Funding Effort to Address User Losses
Tether’s commitment forms the backbone of Drift Protocol’s recovery plan. The stablecoin issuer will provide a $100 million revenue-linked credit line as part of its contribution. Ecosystem grants and loans for market makers are also included in the package.
The recovery pool will draw from most of Drift’s exchange revenue going forward. Combined with the committed funds from Tether and partners, the pool targets full coverage of the $295 million owed to users. This structured approach ensures a steady flow of resources into the recovery effort.
Tether will also provide market-making support through designated market makers after the relaunch. This move ties the stablecoin issuer more closely to Drift’s ongoing operations. It also reflects a broader interest in stabilizing the protocol for long-term use.
Partners beyond Tether have pledged an additional $20 million to strengthen the package. This collective backing shows coordinated support from across the ecosystem. Together, the contributors form a unified front to restore user confidence in the protocol.
Recovery Token and Settlement Shift Mark Structural Changes for Drift
Drift will issue a dedicated recovery token to users affected by the April 1 exploit. This token is separate from the existing DRIFT governance token and carries a distinct function. It represents a direct claim on the recovery pool established through the funding package.
The recovery token is transferable, giving affected users flexibility in how they manage their claims. Users can hold or trade the token depending on their preference. This design allows market participants to price and move recovery claims as needed.
After relaunch, Drift will settle transactions in USDT instead of USDC. The switch aligns with Tether’s involvement and removes reliance on a competing stablecoin. It also streamlines operations by using the currency backed by the primary funder.
The structural shift to USDT settlement, paired with the recovery token issuance, reshapes how Drift will function going forward. These changes reflect decisions made in direct response to the exploit. They also establish a clearer operational framework as the protocol prepares to resume services.

TLDR:
- South Korea’s Ministry of Finance will pilot blockchain deposit tokens for government expenses in Q4 2026.
- Deposit tokens allow preset spending rules, removing the need for after-the-fact transaction reviews by officials.
- Direct payments via deposit tokens eliminate third-party processors, cutting transaction fees for small businesses.
- Sejong City serves as the launch point, with a step-by-step national expansion planned based on pilot results.
South Korea’s Ministry of Finance and Economy is set to replace government purchase cards with deposit tokens. These blockchain-based digital currency tools will be tested through a pilot launching in the fourth quarter of 2026.
Sejong City will serve as the starting point for the initiative. Deposit tokens carry built-in spending rules and represent actual currency on a blockchain. This is the second government use of digital currency for treasury fund execution in South Korea.
How Deposit Tokens Will Change Government Spending Controls
The existing framework reviews spending only after transactions have already occurred. Officials must then justify any payments made outside approved guidelines.
Deposit tokens change this by setting conditions in advance of any transaction. This prevents improper use and ensures automatic tracking across all payments.
Business promotion expenses are the first category the ministry targets with this change. Under current law, these expenses must be executed through government purchase cards.
A regulatory sandbox exemption now allows deposit tokens to replace this card-based method. No changes to existing legislation are required for the pilot to proceed.
The Ministry of Finance and Economy stated, “This project is the first case of a planned regulatory sandbox directly promoted by the Ministry of Finance and Economy from the review of the system.”
Officials added that it “is meaningful in that it can systematically verify the digital currency-based fiscal execution model.”
These remarks reflect the government’s confidence in the program’s broader potential. The ministry views this not just as a test but as a foundation for future fiscal reform.
Removing intermediaries is another feature the ministry expects to benefit small businesses. Direct payments through deposit tokens bypass third-party processors entirely.
This is expected to lower transaction fees for vendors receiving government payments. The cost savings could be meaningful for smaller businesses operating within the public procurement space.
Sejong City Pilot to Guide Expansion of the Blockchain Program
The pilot project will begin in Sejong City in the fourth quarter of 2026. The ministry will finalize the scope of the demonstration and select participating businesses beforehand.
Results from the Sejong City phase will determine how the program expands further. A step-by-step rollout is planned based on what the pilot data shows.
The ministry noted that “the transparency of execution will increase by being able to preset and manage the time and industry that can be executed.”
Currently, business promotion expenses used during late nights or weekends require after-the-fact explanations. With deposit tokens, those restrictions are programmed directly into the payment system. This removes the need for manual reviews of time-sensitive transactions.
Deposit tokens differ from standard crypto assets in key ways. They are stable in value and carry programmed rules that restrict how they are spent.
These features make them more suitable for controlled public finance applications. The South Korean government sees them as a practical tool for modernizing how it manages public funds.
The regulatory sandbox framework remains central to the legal structure of this pilot. Since current regulations require purchase cards, the sandbox grants a temporary exemption for testing purposes.
The ministry will use findings from the pilot to assess whether permanent regulatory reform is needed. A positive outcome could support a broader shift toward blockchain-based government payments across South Korea.


Ripple tokenized bond pilot with Kyobo Life Insurance, one of South Korea’s largest insurers, targets near real-time government bond settlement using Ripple Custody, replacing a process that currently takes two days to settle.
Summary
- Ripple and Kyobo Life Insurance announced on April 15 Korea’s first blockchain-based government bond settlement pilot, compressing the standard T+2 cycle to near real-time using Ripple Custody.
- Kyobo Life, with over $92 billion in assets, becomes the first Tier-1 Korean insurer to adopt on-chain bond infrastructure, with plans to also explore RLUSD stablecoin payment rails.
- The deal does not create direct XRP demand today as it uses Ripple Custody rather than ODL, but XRP still rallied 6% to $1.42 on Thursday, emerging as the top gainer among the top-10 assets.
Ripple tokenized bond pilot with Kyobo Life Insurance, announced April 15, marks Korea’s first institutional attempt to settle government bonds on blockchain infrastructure. The deal targets the standard two-day settlement window that has long defined fixed-income markets, compressing it to near real-time through Ripple Custody, the company’s bank-grade digital asset custody platform.
Kyobo Life, a Tier-1 Korean insurer managing over $92 billion in assets, is the first major insurance institution in the country to adopt this model.
Ripple Custody acts as the infrastructure layer, handling the holding, transfer, and settlement of tokenized Korean government bonds on-chain. Both the bond and the payment leg settle simultaneously on a single ledger, eliminating the counterparty risk that accumulates during a standard multi-day settlement cycle and freeing up capital that would otherwise sit idle.
Kyobo Life will also explore stablecoin-based payment rails through Ripple’s RLUSD stablecoin, which is already listed on Korean exchange Coinone, enabling 24-hour transaction capability outside normal banking hours.
The partnership is explicitly structured as a pilot and feasibility study. No transaction sizes, go-live dates, or specific bond series have been disclosed. Korean regulators have not yet developed a complete legal framework for tokenized securities, and both companies describe the arrangement as a foundation to assess technical and regulatory feasibility before moving to production.
Why Korea, Why Now
Korea has licensed payment providers for remittance since 2017 and is one of Asia’s most active markets for regulated crypto adoption. Ripple has been building its Korean presence for 14 months, partnering with custodian BDACS in February 2025 and achieving exchange listings across Upbit, Coinone, and Korbit by August 2025.
SBI Holdings, Ripple’s long-term Japanese institutional partner, is also an investor in Kyobo Life, connecting Ripple’s Japan and Korea strategies through the same financial network. The deal also plugs into Ripple’s broader Asia-Pacific push that includes participation in Singapore’s Monetary Authority BLOOM initiative and a move to acquire BC Payments in Australia.
Fiona Murray, Managing Director for Asia Pacific at Ripple, said “Korea’s institutional financial market is at an inflection point” and described the Kyobo deal as “the beginning of a broad and enduring partnership, not only with Kyobo, but with the Korean institutional financial market as a whole.”
Jin Ho Park, Senior Executive Vice President at Kyobo Life, said the partnership is “not simply about digital assets — it’s about validating how traditional financial instruments can operate securely and efficiently on blockchain.”
What It Means for XRP Price
The Kyobo deal uses Ripple Custody rather than On-Demand Liquidity, meaning it does not create direct XRP purchase demand today. Despite this, XRP rallied 6% to $1.42 on Thursday, reclaiming fourth place by market cap with its market capitalization moving back above $87 billion.
Analysts say the deal adds institutional credibility to Ripple’s real-world settlement thesis, which becomes more valuable once the CLARITY Act passes and banks gain legal cover to use XRP in cross-border payment networks. Until then, the XRP price connection to Kyobo is narrative rather than structural.
Ripple and Kyobo Life partnered to modernize Korea’s bond markets at a moment when Ripple’s global institutional footprint is expanding faster than at any point since its SEC lawsuit ended in 2024.
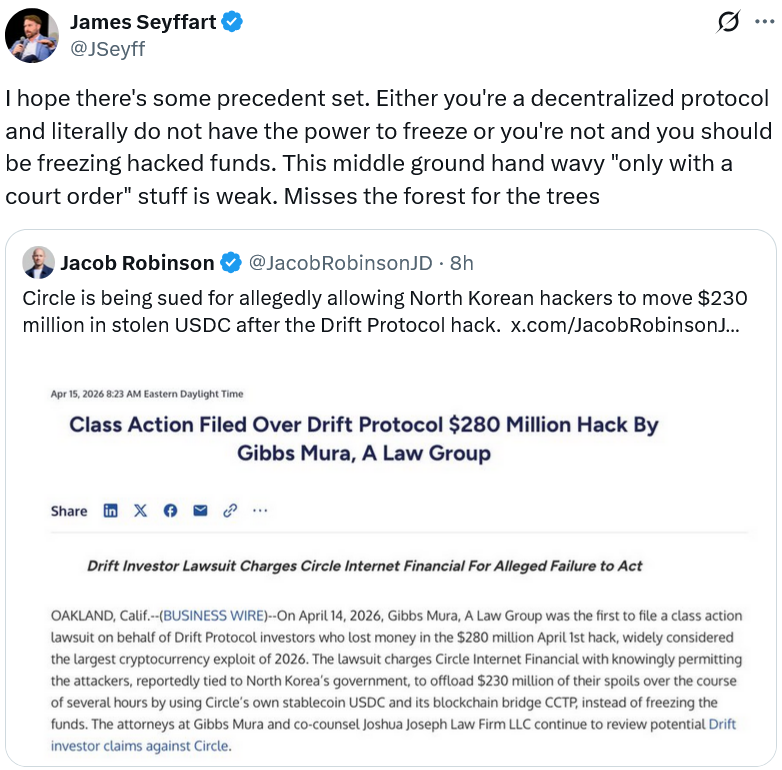
Circle Internet Group is facing a class action lawsuit led by a Drift Protocol investor claiming it failed to freeze funds stolen in a $280 million exploit of the protocol on April 1.
The lawsuit was filed by Drift investor Joshua McCollum on behalf of over 100 members in a US district court in Massachusetts on Wednesday, which accused Circle of allowing the attackers to transfer about $230 million worth of USDC (USDC) from Solana to Ethereum via Circle’s Cross-Chain Transfer Protocol (CCTP) over several hours without intervention.
“Circle permitted this criminal use of its technology and services,” attorneys representing McCollum wrote, adding: “These losses would not have occurred, or would have been substantially reduced, had Circle taken timely action.”
The suit accuses Circle of aiding and abetting conversion as well as negligence. Mira Gibb, the law firm representing McCollum and other Drift investors, is seeking damages, with the final amount to be determined at trial.
The case touches on a legal grey area around crypto companies that retain control over user funds. While such companies may have the technical ability to intervene or freeze assets, they often cite regulatory constraints or the lack of immediate legal authority as reasons for inaction — leaving accountability unclear as exploits unfold in real-time.

McCollum’s lawyers pointed out that Circle froze 16 USDC wallets in connection with a sealed US civil case about a week before the Drift incident to argue that Circle had the technical capacity to do the same.
Cointelegraph reached out to Circle for comment, but didn’t receive an immediate response.
Crypto analytics firm Elliptic suspected the exploit was committed by North Korean state-backed hackers, who made over 100 transactions via Circle’s bridging technology during US working hours, where the stablecoin company is based.
Related: Ukraine arrests FBI-wanted cybercrime suspect, seizes $11M in assets
The funds were converted into Ether (ETH) and sent through the Tornado Cash privacy protocol to launder the proceeds and obscure the trail.
Circle was put in a lose-lose position: ARK Invest
While Circle faced backlash for the inaction, ARK Invest’s director of research for digital assets, Lorenzo Valente, argued on Thursday that it made the right decision, arguing that freezing funds without a legal order opens the door for arbitrary discretion.
“Every future freeze is now a judgment call. Every non-freeze is a political statement. Why freeze the Drift hacker but not that sketchy Nigerian fraud wallet? Why this protester but not that one?”
While Valente sided with Circle’s decision, he speculated that the stolen funds will likely fund North Korea’s nuclear weapons program:
“Whether Circle got it right comes down to how much you weigh rule-of-law principles vs concrete harm. Reasonable people disagree.”
Magazine: Are DeFi devs liable for the illegal activity of others on their platforms?
‘The Pitt’ Season 2’s Most Visceral Patient Scene Took “a Week and a Half” to Film

Major new business conference coming to North East
Logistics firms enter last mile for IPO delivery, rev up for Rs 9,000 crore issues


-

 Politics6 days ago
US brings back mandatory military draft registration
-
 Sports6 days ago
Man United discover Nico Schlotterbeck transfer fee as defender reaches Dortmund agreement
-

 Fashion6 days ago
Weekend Open Thread: Veronica Beard
-

 Politics7 days ago
Malcolm In The Middle OG Turned Down ‘Buckets Of Money’ To Appear In Reboot
-

 Politics5 days ago
World Cup exit makes Italy enter crisis mode
-

 Business6 days ago
Tesla Model Y Tops China Auto Sales in March 2026 With 39,827 Registrations, Beating Cheaper EVs and Gas Cars
-

 Crypto World3 days ago
The SEC Conditionalises DeFi Platforms to Be Avoided for Broker Registration
-

 Crypto World3 days ago
SEC Signals Exemption for Crypto Interfaces From Broker Registration
-

 News Videos2 days ago
Secure crypto trading starts with an FIU-registered
-
 NewsBeat4 days ago
Pep Guardiola and Gary Neville agree over Arsenal title problem that benefits Man City
-

 Business5 days ago
Ireland Fuel Protests Enter Day 5 as Blockades Spark Shortages and Government Prepares Support Package
-

 Business7 days ago
OpenAI Halts Stargate UK Data Centre Project Over Energy Costs and Copyright Row
-

 Crypto World6 days ago
Federal judge blocks Arizona from bringing criminal charges against Kalshi
-

 Politics7 days ago
LBC Presenter Mocks Trump Over Iran War Failures
-

 NewsBeat3 days ago
Trump and Pope Leo: Behind their disagreement over Iran war
-

 Crypto World3 days ago
SEC Proposes Certain Crypto Interfaces Don’t Need to Register as Brokers
-
 NewsBeat5 days ago
JD Vance announces ‘no agreement’ with Iran over nuclear weapons fear
-

 Business6 days ago
IMF retains floor for precautionary balances at SDR 20 billion
-

 Business6 days ago
Former Liverpool CEO eviscerates FIFA for World Cup ticket pricing
-
Crypto World4 days ago
Sei Network Enters Quiet Reset Phase as On-Chain Metrics Signal a Slowdown in 2026
You must be logged in to post a comment Login