
Crypto World
Kalshi US Visits Jump 1,500% as Regulatory Scrutiny Intensifies

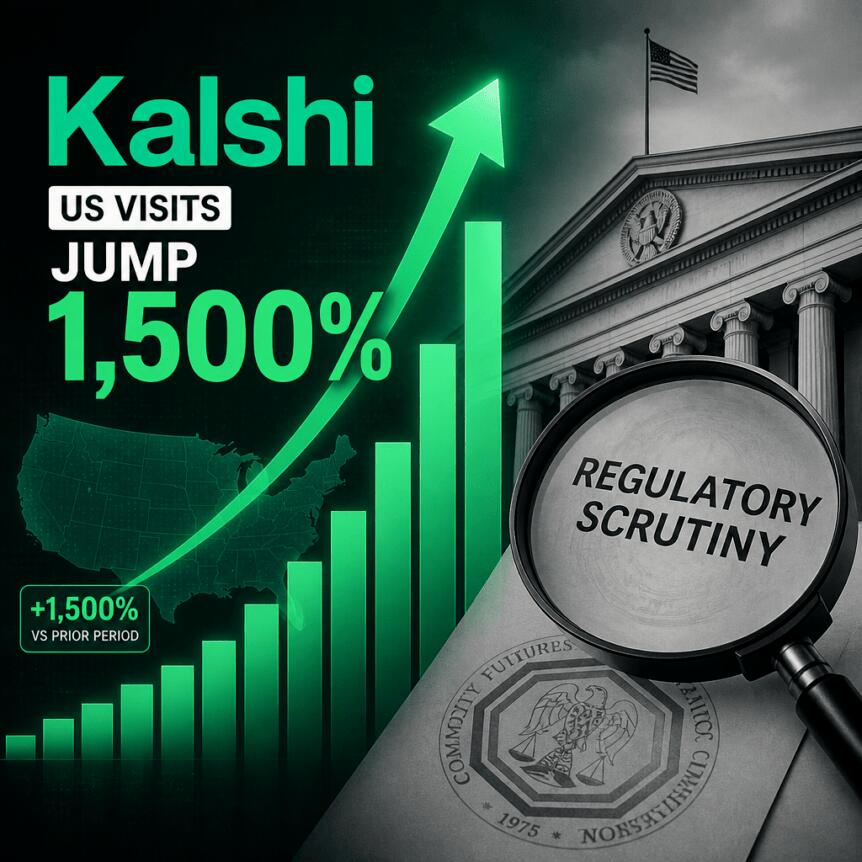
Kalshi’s prediction markets business is drawing sharply more attention from web users—at the same time as legal challenges intensify over how certain contracts should be regulated. New traffic estimates reviewed by Cointelegraph show that US visits to Kalshi surged over the past year, reflecting the platform’s rapid mainstream reach.
According to Similarweb traffic data analyzed by Cointelegraph, Kalshi logged 15.4 million visits from the United States in July, up about 1,520% from just under 1 million in August 2025. The US also remained the dominant source of site activity, accounting for nearly 80% of Kalshi’s traffic in July versus 72.8% in August 2025.
Key takeaways
- Kalshi’s US web traffic reached 15.4 million visits in July, roughly a 1,520% jump versus August 2025, based on Similarweb estimates.
- US users remained the largest share of traffic, at nearly 80% in July compared with 72.8% a year earlier.
- Trading growth appears to be outpacing traffic growth, with monthly notional volume rising to about $40 billion in August from $874 million a year earlier, per Dune Analytics.
- Sports-related contracts represented 83% of Kalshi’s trading volume in July, underscoring why regulatory scrutiny remains focused on event terms.
- Even as traffic increased, Canada and the UK—jurisdictions where Kalshi’s member agreement restricts direct access—still contributed a small share of visits.
Traffic surges as the legal fight escalates
The visibility boost comes during a period of heightened scrutiny of prediction markets in the US. Kalshi has faced legal challenges tied to whether its sports contracts should fall under federal oversight or instead be treated as state-regulated gambling. The dispute has reached the US Supreme Court, after New Jersey took the matter to the Supreme Court, according to earlier coverage.
While web traffic is not the same thing as regulatory status, the strong jump in US visits helps explain why the company’s expanding contract catalog is attracting both user interest and legal attention. The geographic concentration also matters: with the US supplying most of Kalshi’s traffic, any ruling affecting how Kalshi structures or offers certain contracts could quickly reverberate through its core customer base.
Trading volume grows faster than visits
Kalshi’s traffic gains have coincided with even larger growth in trading activity. Dune Analytics’ prediction market data dashboard, as cited by Cointelegraph, shows that Kalshi recorded about $40 billion in monthly notional trading volume in August. That compares with roughly $874 million a year earlier, an increase of around 4,500%.
Looking across the broader prediction-market sector, the same Dune Analytics dashboard indicates that monthly notional volume rose to $50.7 billion from about $2 billion over the same period. Kalshi accounted for nearly 79% of that latest total, meaning the company is not only growing but also increasingly dominant within the category.
Sports contracts were central to this activity. Barron’s reported Thursday that sports-related contracts made up 83% of Kalshi’s trading volume in July. That skew is notable because it aligns with the regulatory focus of the ongoing court dispute—raising the stakes for what happens next if courts determine that certain event contracts should be handled differently.
International interest rises, even where access is restricted
Kalshi’s audience has expanded beyond the United States, though its traffic footprint remains heavily weighted toward the US. Similarweb estimates reviewed by Cointelegraph show that Canada generated about 450,000 visits to Kalshi’s website in July, up from roughly 50,000 in August 2025. UK visits also increased, reaching 296,000 in July from 31,000 a year earlier.
However, both countries fall into a category of restricted jurisdictions under Kalshi’s member agreement, which currently prohibits users from directly accessing or trading on the platform. Kalshi previously addressed this by partnering with Canadian financial services firm Wealthsimple in June to provide access to nearly 4,000 eligible Kalshi contracts through a separate app, as described in Kalshi’s announcement.
Even with visit counts increasing, the share of traffic from these restricted jurisdictions declined over the same period. From August 2025 to July 2026, Canada’s share slipped to 2.3% from 3.8%, while the UK’s share fell to 1.5% from 2.4%—suggesting that Kalshi’s overall growth is outpacing growth in these regions or that US traffic is rising even more quickly.
Cointelegraph reached out to Kalshi for comment on traffic from restricted jurisdictions but had not received a response by publication.
What investors and users should watch next
Kalshi’s traffic and volume growth point to strong demand for event-based markets, especially sports-driven contracts, but the company’s legal situation remains the key uncertainty. With the Supreme Court dispute now in view, readers should watch how court outcomes or compliance changes affect Kalshi’s product offerings—particularly contract types that have drawn the most regulatory attention.

As the industry matures and borrows more pages out of TradiFi’s playbook, crypto projects are starting to adopt some of the behaviors of public companies.
The latest craze rocking cryptoville is token buybacks: using revenue to buy back your own token.
So far in 2026, crypto projects have spent about $640 million on the practice, up around 17% from the same period the year prior, and an order of magnitude more than the $366,000 spent in 2024. Hyperliquid and Pump.fun accounting for almost 90% of the current spend.
So what’s the sudden appeal?
Buybacks can create demand for a token, while burns can reduce the supply making each token more valuable. That dynamic can cause upward pressure on the token price.
It also gives holders a more tangible connection to the economic activity on the underlying protocol. Orest Gavryliak, chief legal officer at decentralized exchange aggregator 1inch, tells Magazine:
“When projects implement revenue-funded buybacks and burns, they typically have one of two objectives in mind: either to decrease the token supply in circulation or to demonstrate the rationale for investing in protocol revenues.”
Gavryliak says that telling users a project has “bought and burned tokens” is “much more straightforward” than explaining how governance rights work, how fees are set, or how the protocol is used.
Related: Pump.fun laid off workers before they received millions in PUMP tokens: Report
But there’s a flipside: every dollar a protocol spends buying its token is a dollar it could have spent hiring developers, expanding the business, strengthening its balance sheet or building the product.
So, as buybacks become one of crypto’s hottest tokenomics tools, are they actually good for the projects using them?
Why crypto projects are buying themselves
You might wonder if projects buying their own token is counterproductive. After all, projects typically sell tokens to raise funds to cover costs.
Almost, but with an important caveat. Using revenue generated to buy back tokens (and then to hold them or burn them) creates an implicit connection between the success of the protocol and the value of its token. That’s something crypto projects have long struggled with. As Max Shannon, senior research associate at Bitwise Europe, explains:
“Buybacks and burns remain an effective way to accrue value to tokenholders: they create a continuous bid in the open market for the token, directly tethering token success to the platform’s adoption.”
That marks a sea-change for an industry that has spent the past couple of years chasing narratives or speculating on the greater fool theory — users who bought Fartcoin or Peanut the Squirrel didn’t do so for their sound economic models.
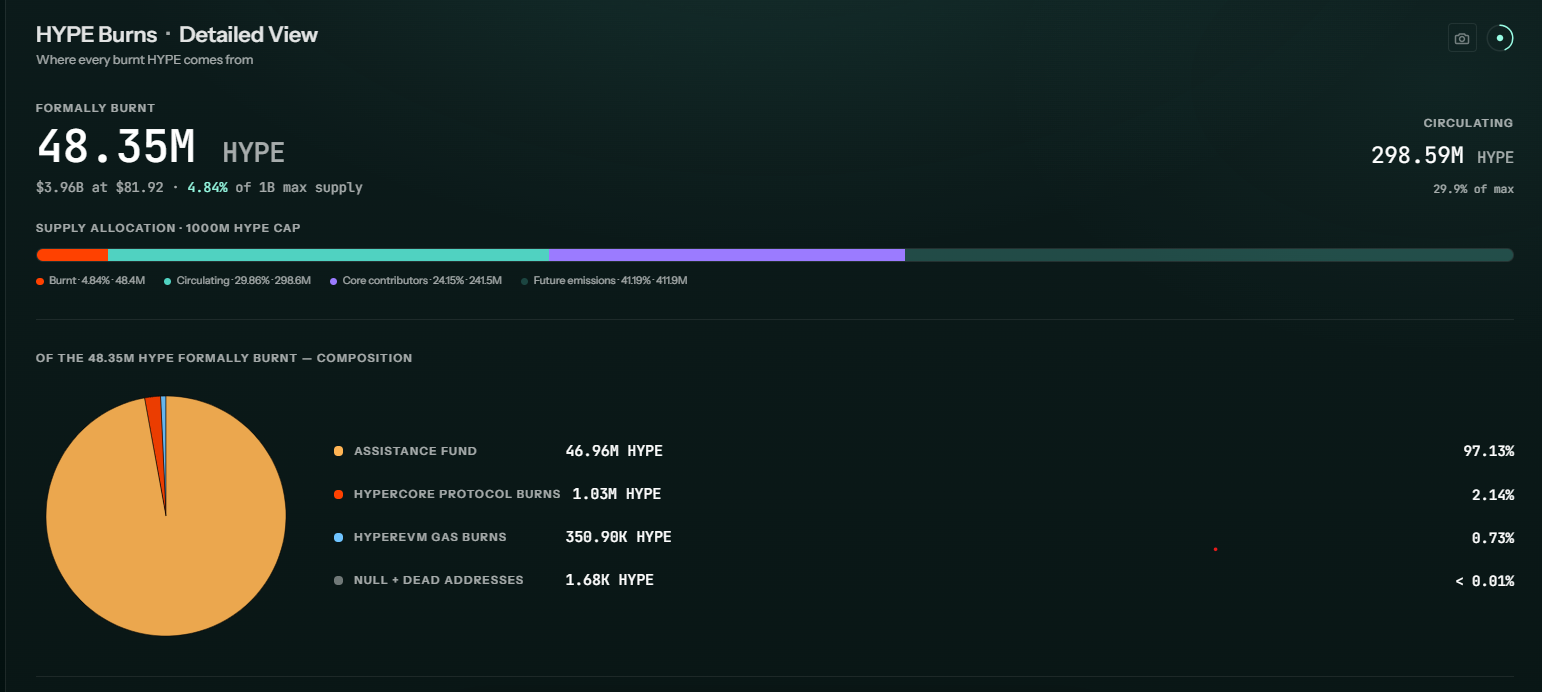
Some protocols are taking the idea much further than others. Hyperliquid, for example, has used 99% of its revenue to buy back and burn HYPE and 50% of Pump.fun’s revenue goes toward buying and burning its token, with $446.65 million worth of PUMP already removed from circulation.
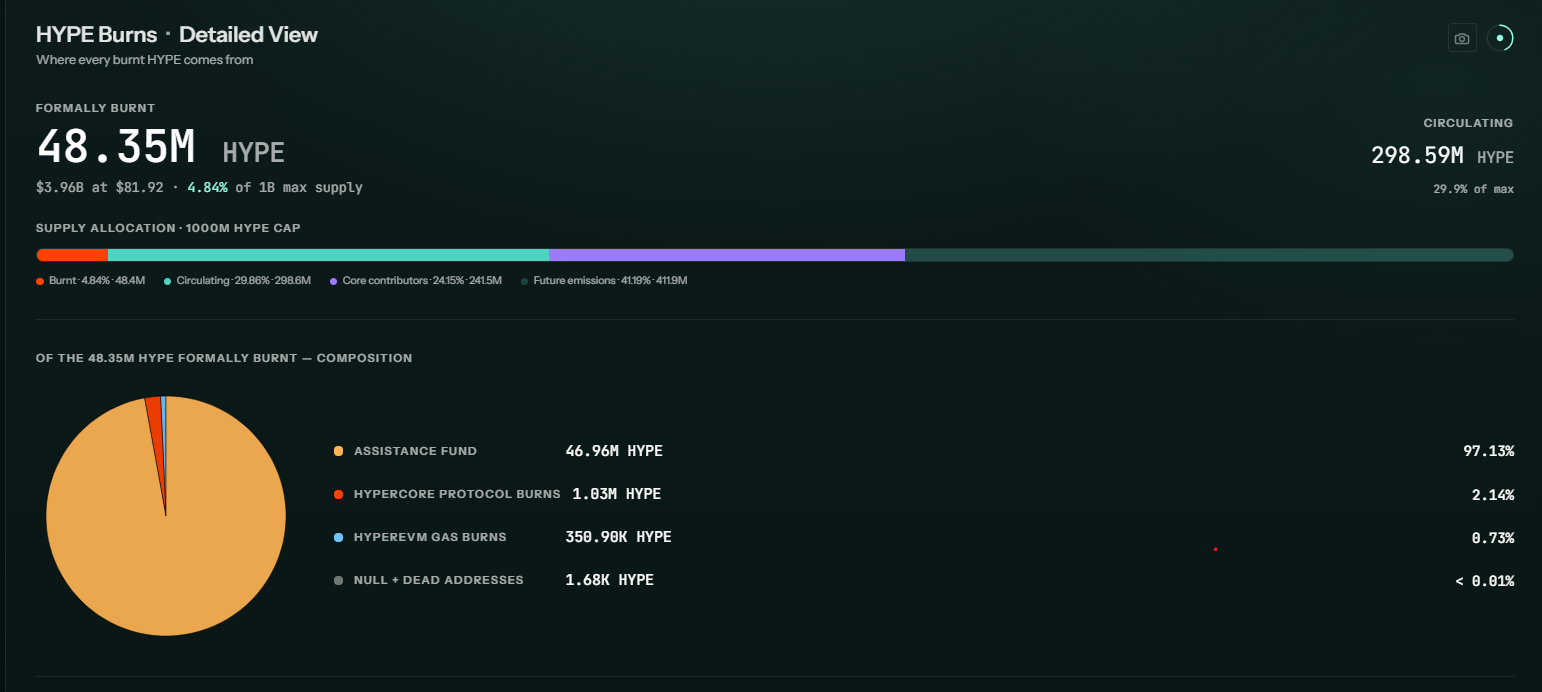
HYPE Burns. Source: Hyperliquid
DeFi infrastructure protocol Spark offers a slightly different model, acquiring over 143 million SPK through open-market buybacks funded by protocol surplus, according to co-founder and chief executive Sam MacPherson.
But those tokens were not burned, and instead remain in the Spark treasury to reward long-term participants in the ecosystem. MacPherson tells Magazine the point is not simply to reduce supply:
“Tokenholders should participate in the long-term economic success of the protocol, rather than simply receive a distribution every time it generates revenue.”
He says buybacks allow Spark to create that alignment while “retaining flexibility over how and when the acquired SPK is ultimately deployed,” allowing the protocol to make its token economically relevant rather than “a simple dividend mechanism.”
Token buybacks are also a highly tax effective way to return revenue to holders, because users don’t cop a hefty tax bill on dividends or rewards.
Is buying the token really the best use of the money?
While that all sounds perfectly rational, the bigger question is whether buying your own token is really the best use of a project’s funds?
Probably not in every case. MacPherson says:
“The question should be: what is the highest-value use of the next dollar of surplus?”
If a protocol can reinvest capital at attractive returns, he says, that can be “far more valuable” than simply distributing revenue as it arrives.
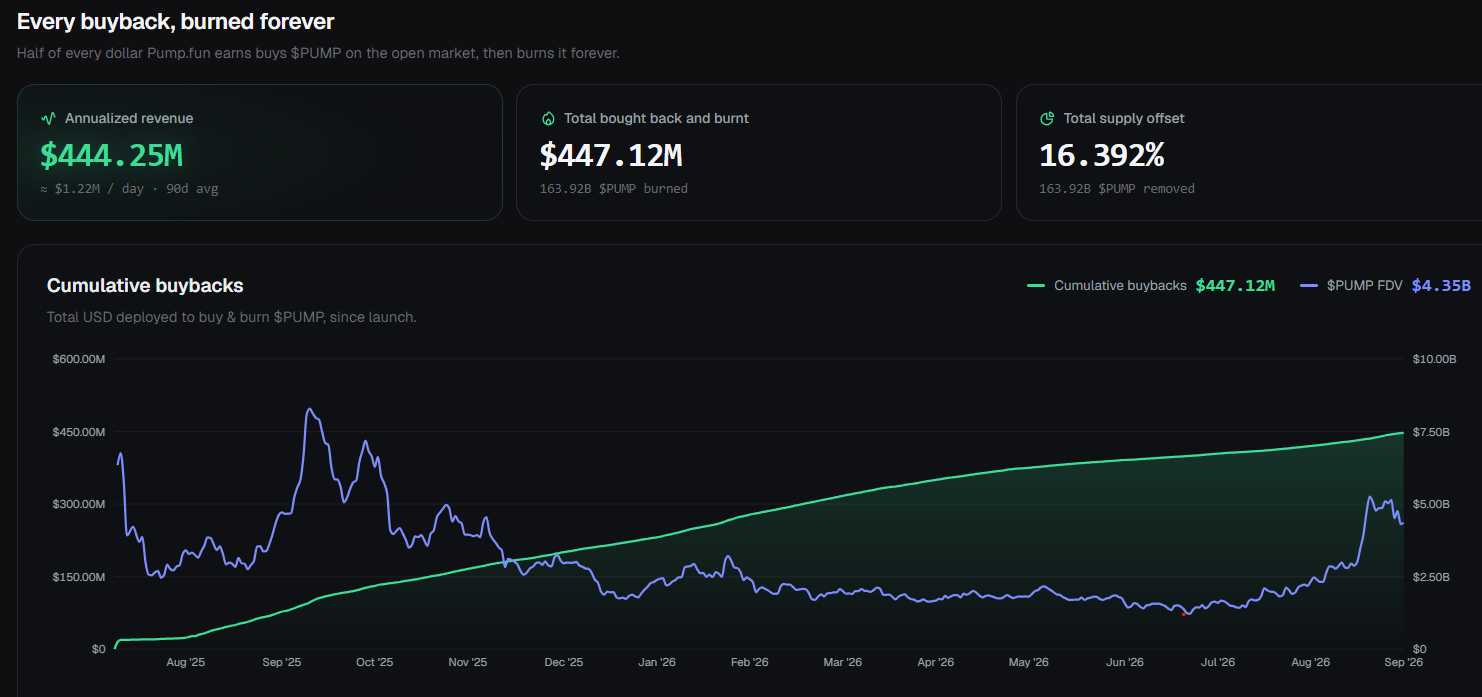
PUMP Burns. Source: Pump.fun
Buybacks can support token economics without actually improving the underlying business.
There is also no ironclad guarantee that buybacks will translate into higher token prices. Pump.fun has been aggressively buying and burning PUMP since July 2025, but the token is still hovering 50% below its September 2025 all-time high. UNI has also given back around half of the gains it made after Uniswap unveiled its UNIfication proposal in November 2025.
Related: Robinhood Chain nears $1B TVL as Uniswap drives liquidity: Standard Chartered
Shannon points out that “many factors” contributed to those price movements, so they don’t prove buybacks failed, but:
“They have prompted investors to debate whether these startup-like projects would be better served by reducing the share of revenue committed to buybacks and burns and reinvesting more in the team and the project itself.”
Investors should make a careful distinction between a buyback scheme that pumps prices, and a successful business model.
A sustainable protocol that generates genuine surplus may decide that buying its token is the best use of some of that money, but equally a project that’s limping along might simply attempt to buyback tokens to move the price. MacPherson notes:
“A buyback doesn’t make an unsustainable protocol sustainable.”
When a token starts looking like a stock
While token buybacks may superficially resemble share buyback program, that doesn’t mean tokens are becoming more like stocks.
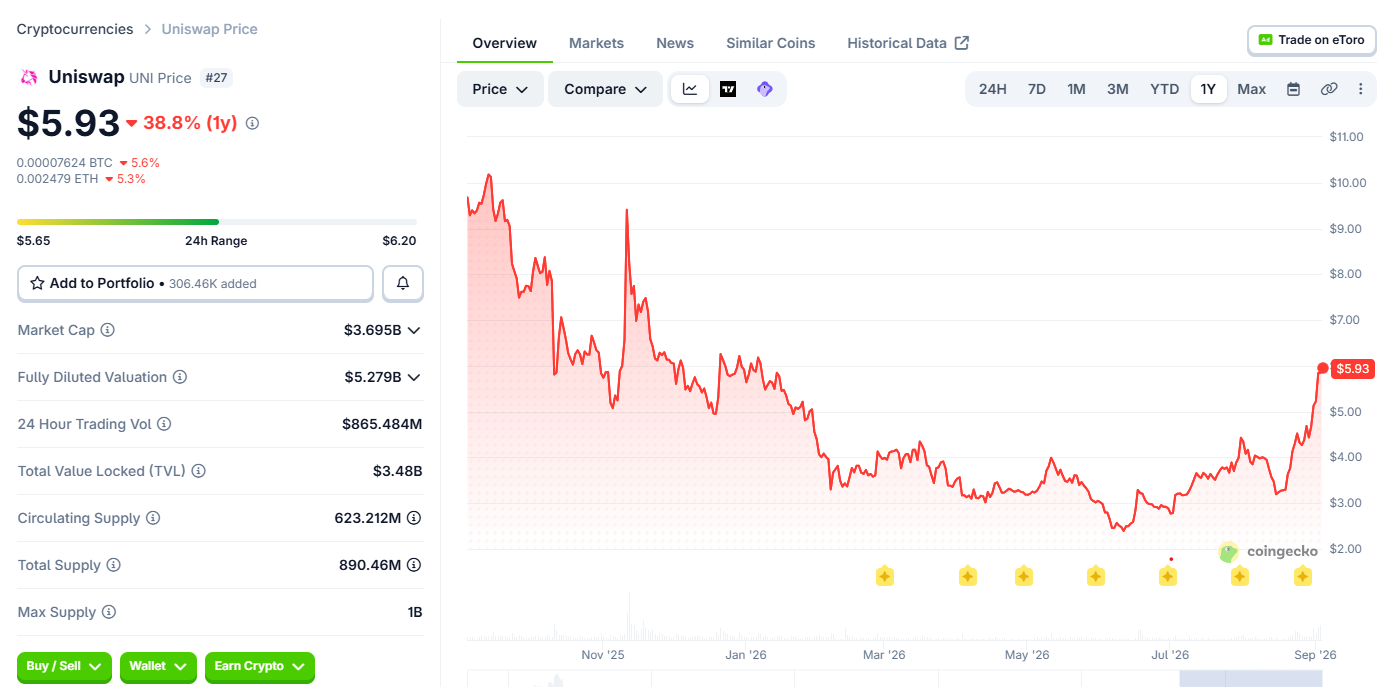
UNI is down around 50% since it started buybacks and burns. Source: Coingecko
A shareholder owns part of a company and may have voting rights, dividends or a claim on its residual assets. Tokenholders generally do not have those same legal rights, and Orest says that distinction is critical. “This is a market mechanism, not a legally enforceable entitlement,” he says.
MacPherson describes SPK as a form of “pseudo-equity” for an onchain protocol. While there isn’t a legal ownership structure in the traditional corporate sense, economically Spark is “trying to create many of the same characteristics: participation in governance, long-term alignment, and a mechanism through which those most committed to the protocol can benefit from its success.”
When buybacks start looking like dividends
But as crypto starts to emulate TradFi buybacks, storm clouds may be gathering on the horizon, as regulators consider what those mechanisms actually amount to.
While the Digital Asset Market Clarity (CLARITY) Act of 2025 remains a draft and should not be treated as settled law, Gavryliak says its proposed framework highlights the key question of where a token’s value comes from:
“If it stems from the functionality of the network itself, then the asset looks like a commodity. But if the value is based on the efforts of the project’s team in matters of shipping, marketing, or providing returns to token holders, then it is already a security. In the end, don’t put the clothes of a stock on the token and expect it to be a commodity.”
At the end of the day, crypto investors want to know what sits underneath a token — revenue, users, sustainable economics — and some credible way for the token to benefit from those things.
While buybacks may offer a solution, they can also be just another piece of financial engineering that makes a token look more valuable than it actually is without fixing the issues underneath, as Gavryliak points out:
“If the buybacks stopped, would there still be a reason to hold the token? If the answer is no, the problem runs deeper than tokenomics.”
Cointelegraph publishes long-form journalism, analysis and narrative reporting produced by Cointelegraph’s in-house editorial team with subject-matter expertise. All articles are edited and reviewed by Cointelegraph editors in line with our editorial standards. Some articles contain affiliate links, from which Cointelegraph may earn a commission. These relationships do not influence which products we review or our editorial conclusions. Content published in here does not constitute financial, legal or investment advice. Readers should conduct their own research and consult qualified professionals where appropriate. Cointelegraph maintains full editorial independence.


Bitcoin (BTC) and gold both dropped within minutes of Friday’s US jobs report, after August payrolls came in at nearly three times what economists expected.
The print revived bets on a September Federal Reserve rate hike. That hit the two assets that had spent the week rallying on expectations of a hold.
Payrolls Triple Forecasts and Flip July Positive
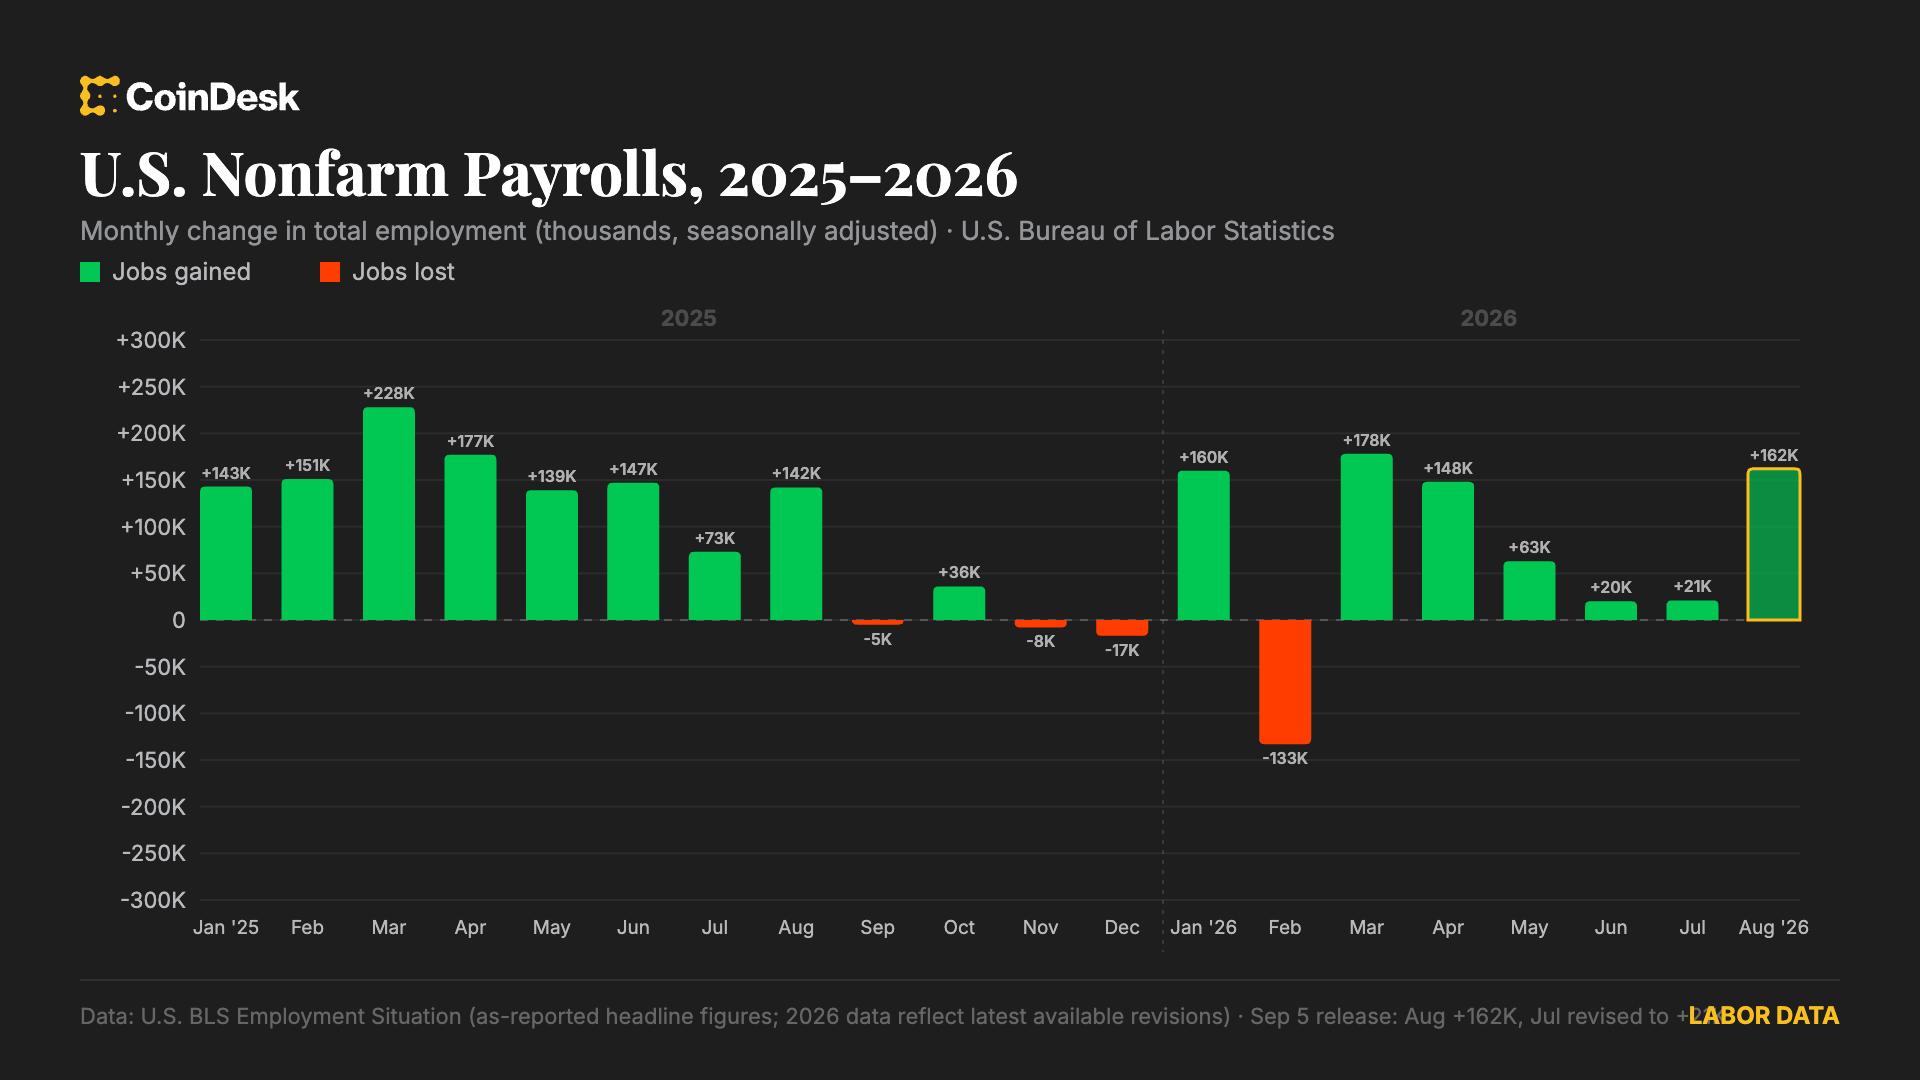
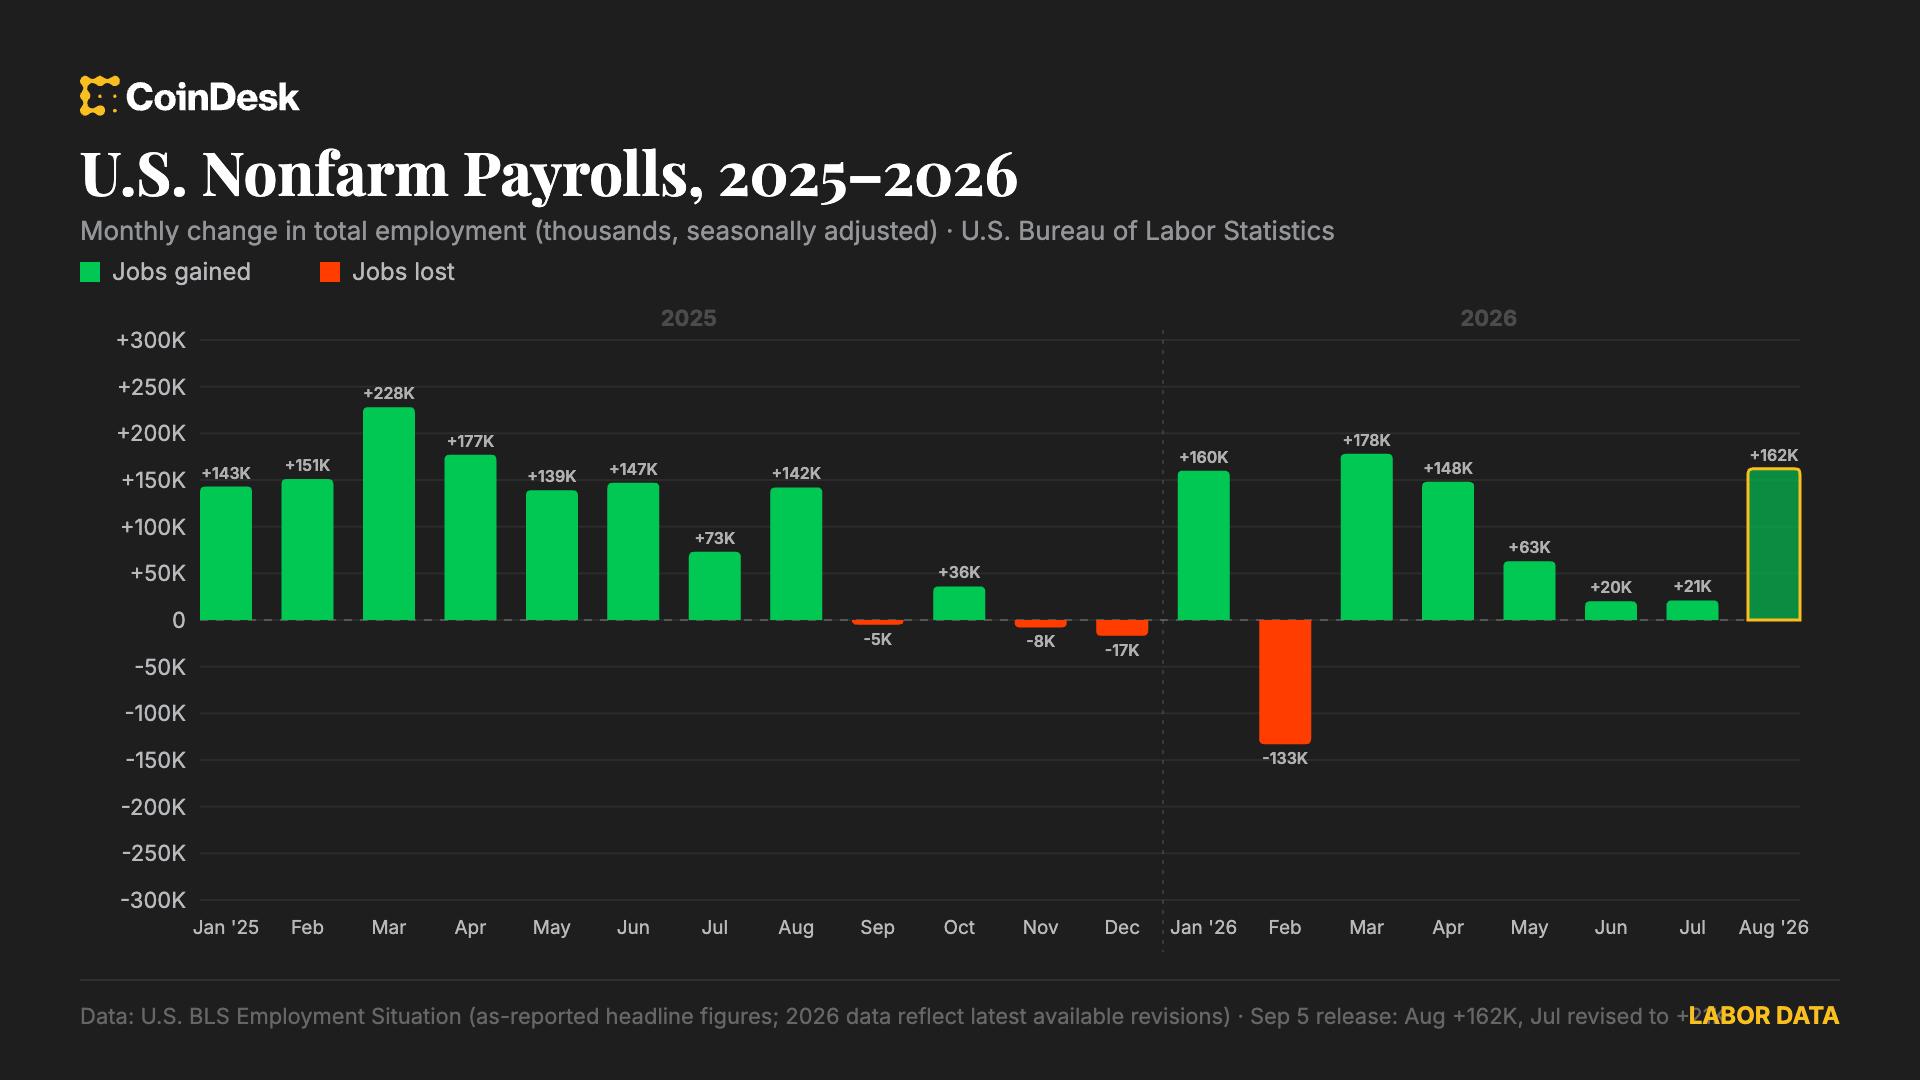
The US economy added 162,000 jobs in August, against a consensus near 56,000. The Bureau of Labor Statistics (BLS) put the prior 12-month average monthly gain at just 31,000.
Revisions did more damage to the slowdown case than the headline did. July’s reported loss of 23,000 jobs became a gain of 21,000. June moved up to 31,000 from 20,000.
Unemployment held at 4.1%. Average hourly earnings rose 0.3% to $37.75, lifting the annual pace to 3.1% and beating the 3.0% forecast.
Bitcoin Loses $80,000 in a Single Candle
Bitcoin traded at $81,340 before the release. It fell to $79,661 inside one five-minute candle, a 1.80% drop, and last changed hands near $79,860.
Gold offered no shelter. The metal slid from $4,473 to $4,376 an ounce, a 1.75% loss, in the same window.
Leverage magnified both moves. CoinGlass logged $201.33 million in liquidations in one hour, $186.01 million of it in longs, taking the 24-hour total to $750.29 million.
BeInCrypto reported hours earlier that Fed hike odds had slipped to a coin flip, and asked whether Bitcoin’s move above $80,000 would hold. It did not.
Warsh Fed Back in Play Before CPI
Hike odds sat near 66% at the end of August. They halved this week after Governor Christopher Waller signaled support for a hold, a shift that carried Bitcoin and gold higher together.
August reverses that logic. Firm wages and upward revisions hand Chair Kevin Warsh the tight labor market his hiking case needs.
The mirror image came a month ago, when a weak July print drove gold futures higher on Binance. Friday ran the trade in reverse.
Consumer price data lands September 11, five days before the Fed decides. A soft inflation print could still undo Friday’s repricing.
The post Bitcoin and Gold Crash As US Payrolls Crush Forecasts appeared first on BeInCrypto.
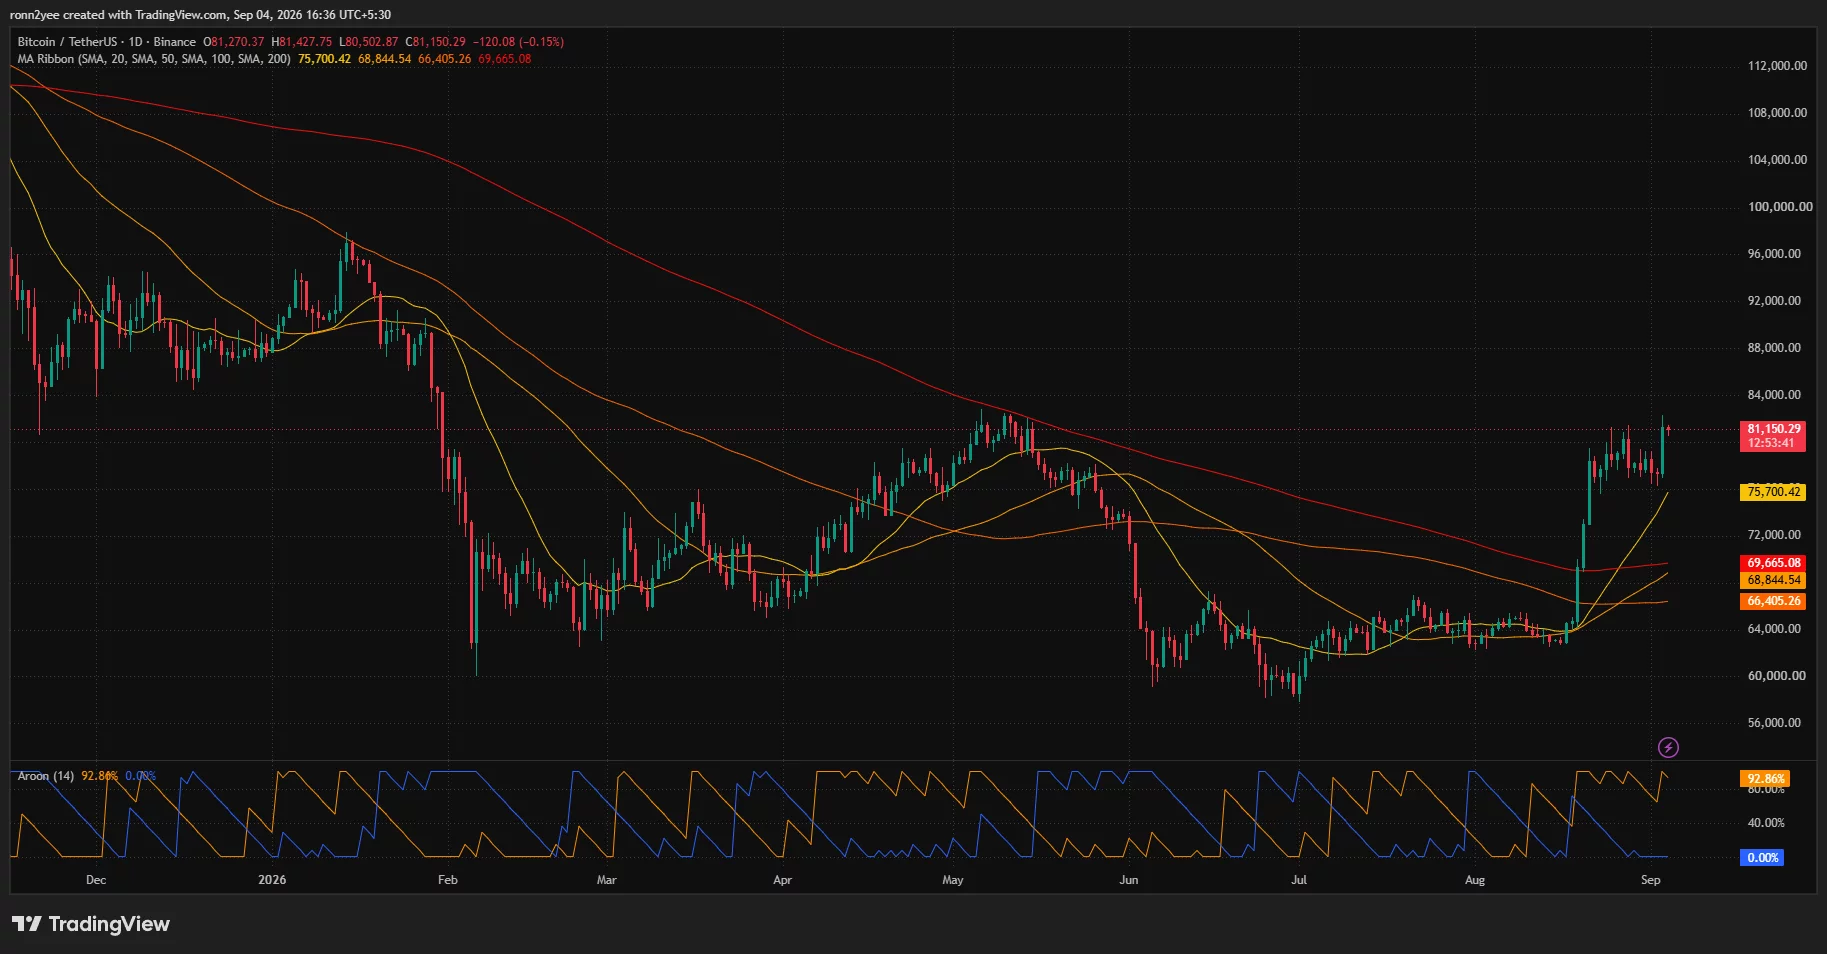
Bitcoin price pulled back after briefly breaking above $82,000 on Sept. 4, as traders took profits following a short squeeze driven by softer Federal Reserve expectations and renewed demand for US spot Bitcoin ETFs.
Summary
- Bitcoin price retreated toward $81,150 after reaching an intraday high above $82,000.
- The 4-hour RSI reached 67.3, while the upper Bollinger Band stood near $82,034.
- US spot Bitcoin ETFs reportedly attracted $730.8 million in net inflows on Sept. 3.
- Liquidation clusters sit near $82,000 above price and between $79,800 and $80,300 below it.
Bitcoin price pulls back after testing $82,000
According to data from crypto.news, Bitcoin (BTC) price traded near $81,150 at the time of writing, having failed to hold an intraday move above the $82,000 psychological level. The pullback left the asset about 1% below its local high but still well above the $80,000 mark reclaimed during the previous session.
The rally accelerated after Bitcoin moved out of a range around $77,000–$79,000. Short sellers were forced to close leveraged positions as the price crossed $80,000, adding automatic buy orders to the market.
CoinGlass data cited by market reports showed that the broader crypto market recorded more than $500 million in liquidations during the rally, with short positions accounting for most of the total. Bitcoin shorts reportedly absorbed about $415 million of those losses.
Price action has since slowed near a technically important area. Galaxy Research data shared by analyst Quinten François placed Bitcoin’s 50-week moving average near $81,041, almost level with the current market price.
According to François, Bitcoin has not closed a weekly candle above that moving average since November 2025. He said a move through $82,800 would also produce the first higher high of the broader downtrend and bring $90,000 back into consideration.
Fed expectations and ETF inflows supported the rally
Bitcoin’s recovery followed a drop in expectations for another US interest-rate increase in September. Fed Governor Christopher Waller said policymakers could keep rates unchanged if incoming inflation data confirms that price pressures are cooling.
The probability of a September rate increase fell from about 63% to nearly 50% after Waller’s comments, according to CME FedWatch. Lower Treasury yields and a weaker dollar accompanied the shift, improving conditions for risk assets.
The move also followed softer US private employment figures. ADP reported weaker job growth than economists expected, adding to the view that the Fed may have less room to tighten monetary policy further.
US-listed spot Bitcoin ETFs provided another source of demand. François, citing Galaxy Research data, said the products recorded $730.8 million in combined net inflows on Sept. 3. The figure marked a sharp improvement from the mixed flows recorded at the beginning of the month.
US investors will now focus on the August employment report and upcoming inflation readings. Waller has not ruled out a hike, meaning stronger inflation data could reverse part of the market’s recent repricing.
Bitcoin technical indicators favor buyers above $78,000
The daily chart shows that Bitcoin has recovered above its major moving averages. The 20-day simple moving average stands near $75,700, while the 50-day and 100-day averages sit at approximately $68,845 and $66,405, respectively.
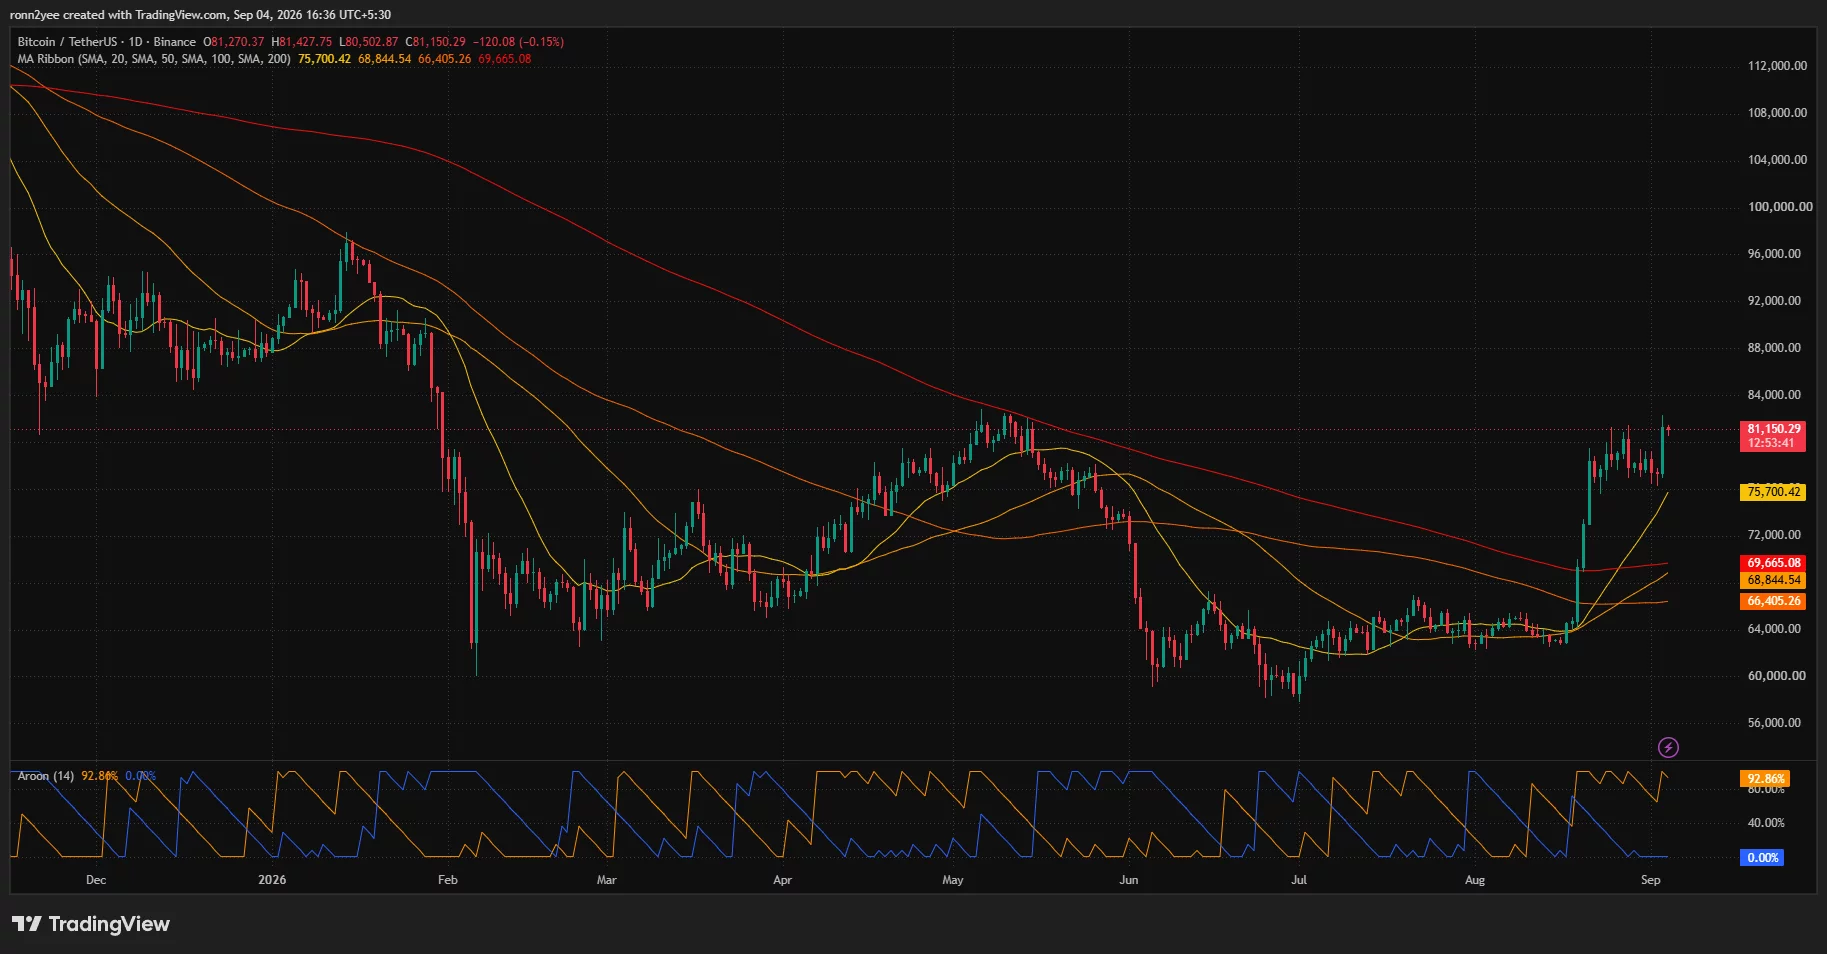
Bitcoin is also above its 200-day moving average near $69,665. The separation between price and the shorter moving averages reflects the strength of the rebound, but it also leaves room for a larger correction if buyers fail to defend the breakout.
The daily Aroon Up reading reached 92.86%, while Aroon Down fell to zero. The indicator shows that a recent high occurred much more recently than a fresh low, supporting the current bullish trend.
Shorter-term readings are less decisive. On the 4-hour chart, Bitcoin is trading close to the upper Bollinger Band at $82,034. The middle band near $78,678 acts as the first mean-reversion target, while the lower band stands around $75,321.
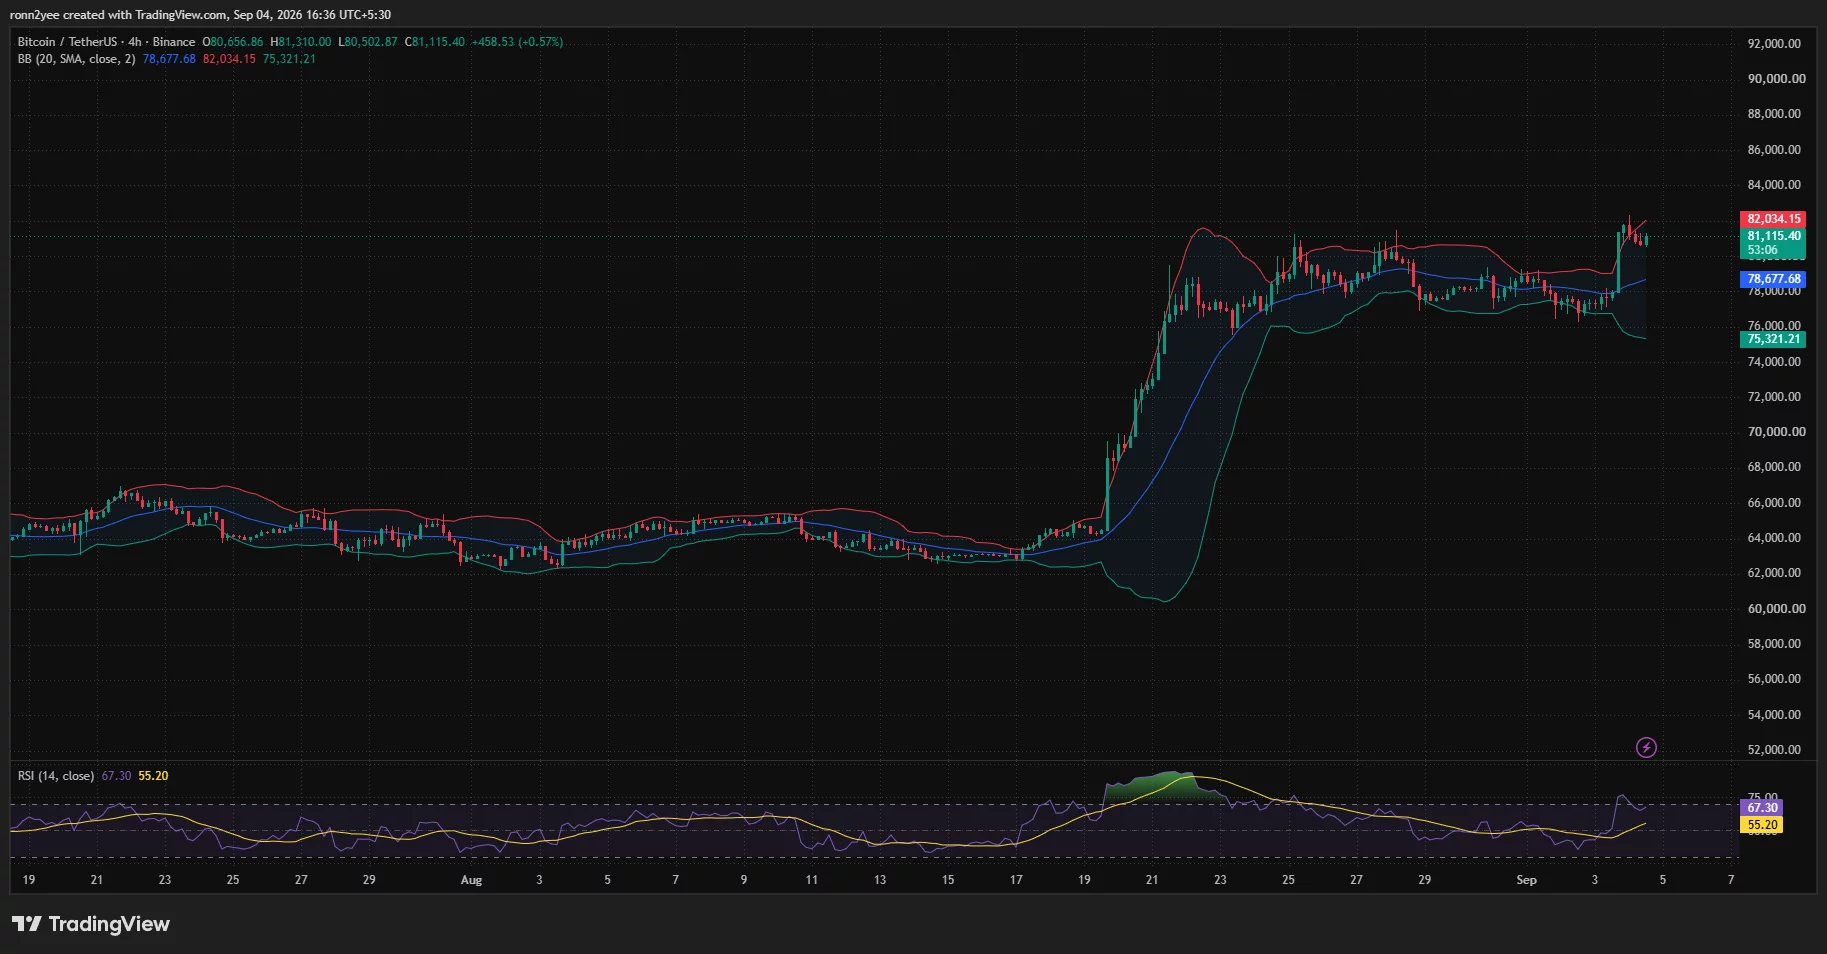
The 4-hour relative strength index was 67.3, just below the conventional overbought threshold of 70. Momentum remains positive, though the reading helps explain why the first move above $82,000 attracted profit-taking.
Liquidation levels frame the next Bitcoin move
The 24-hour CoinGlass liquidation heatmap shows a dense group of leveraged positions between approximately $81,700 and $82,300. A move back through that range could force additional short liquidations and help Bitcoin challenge the next supply area near $83,000–$84,000.
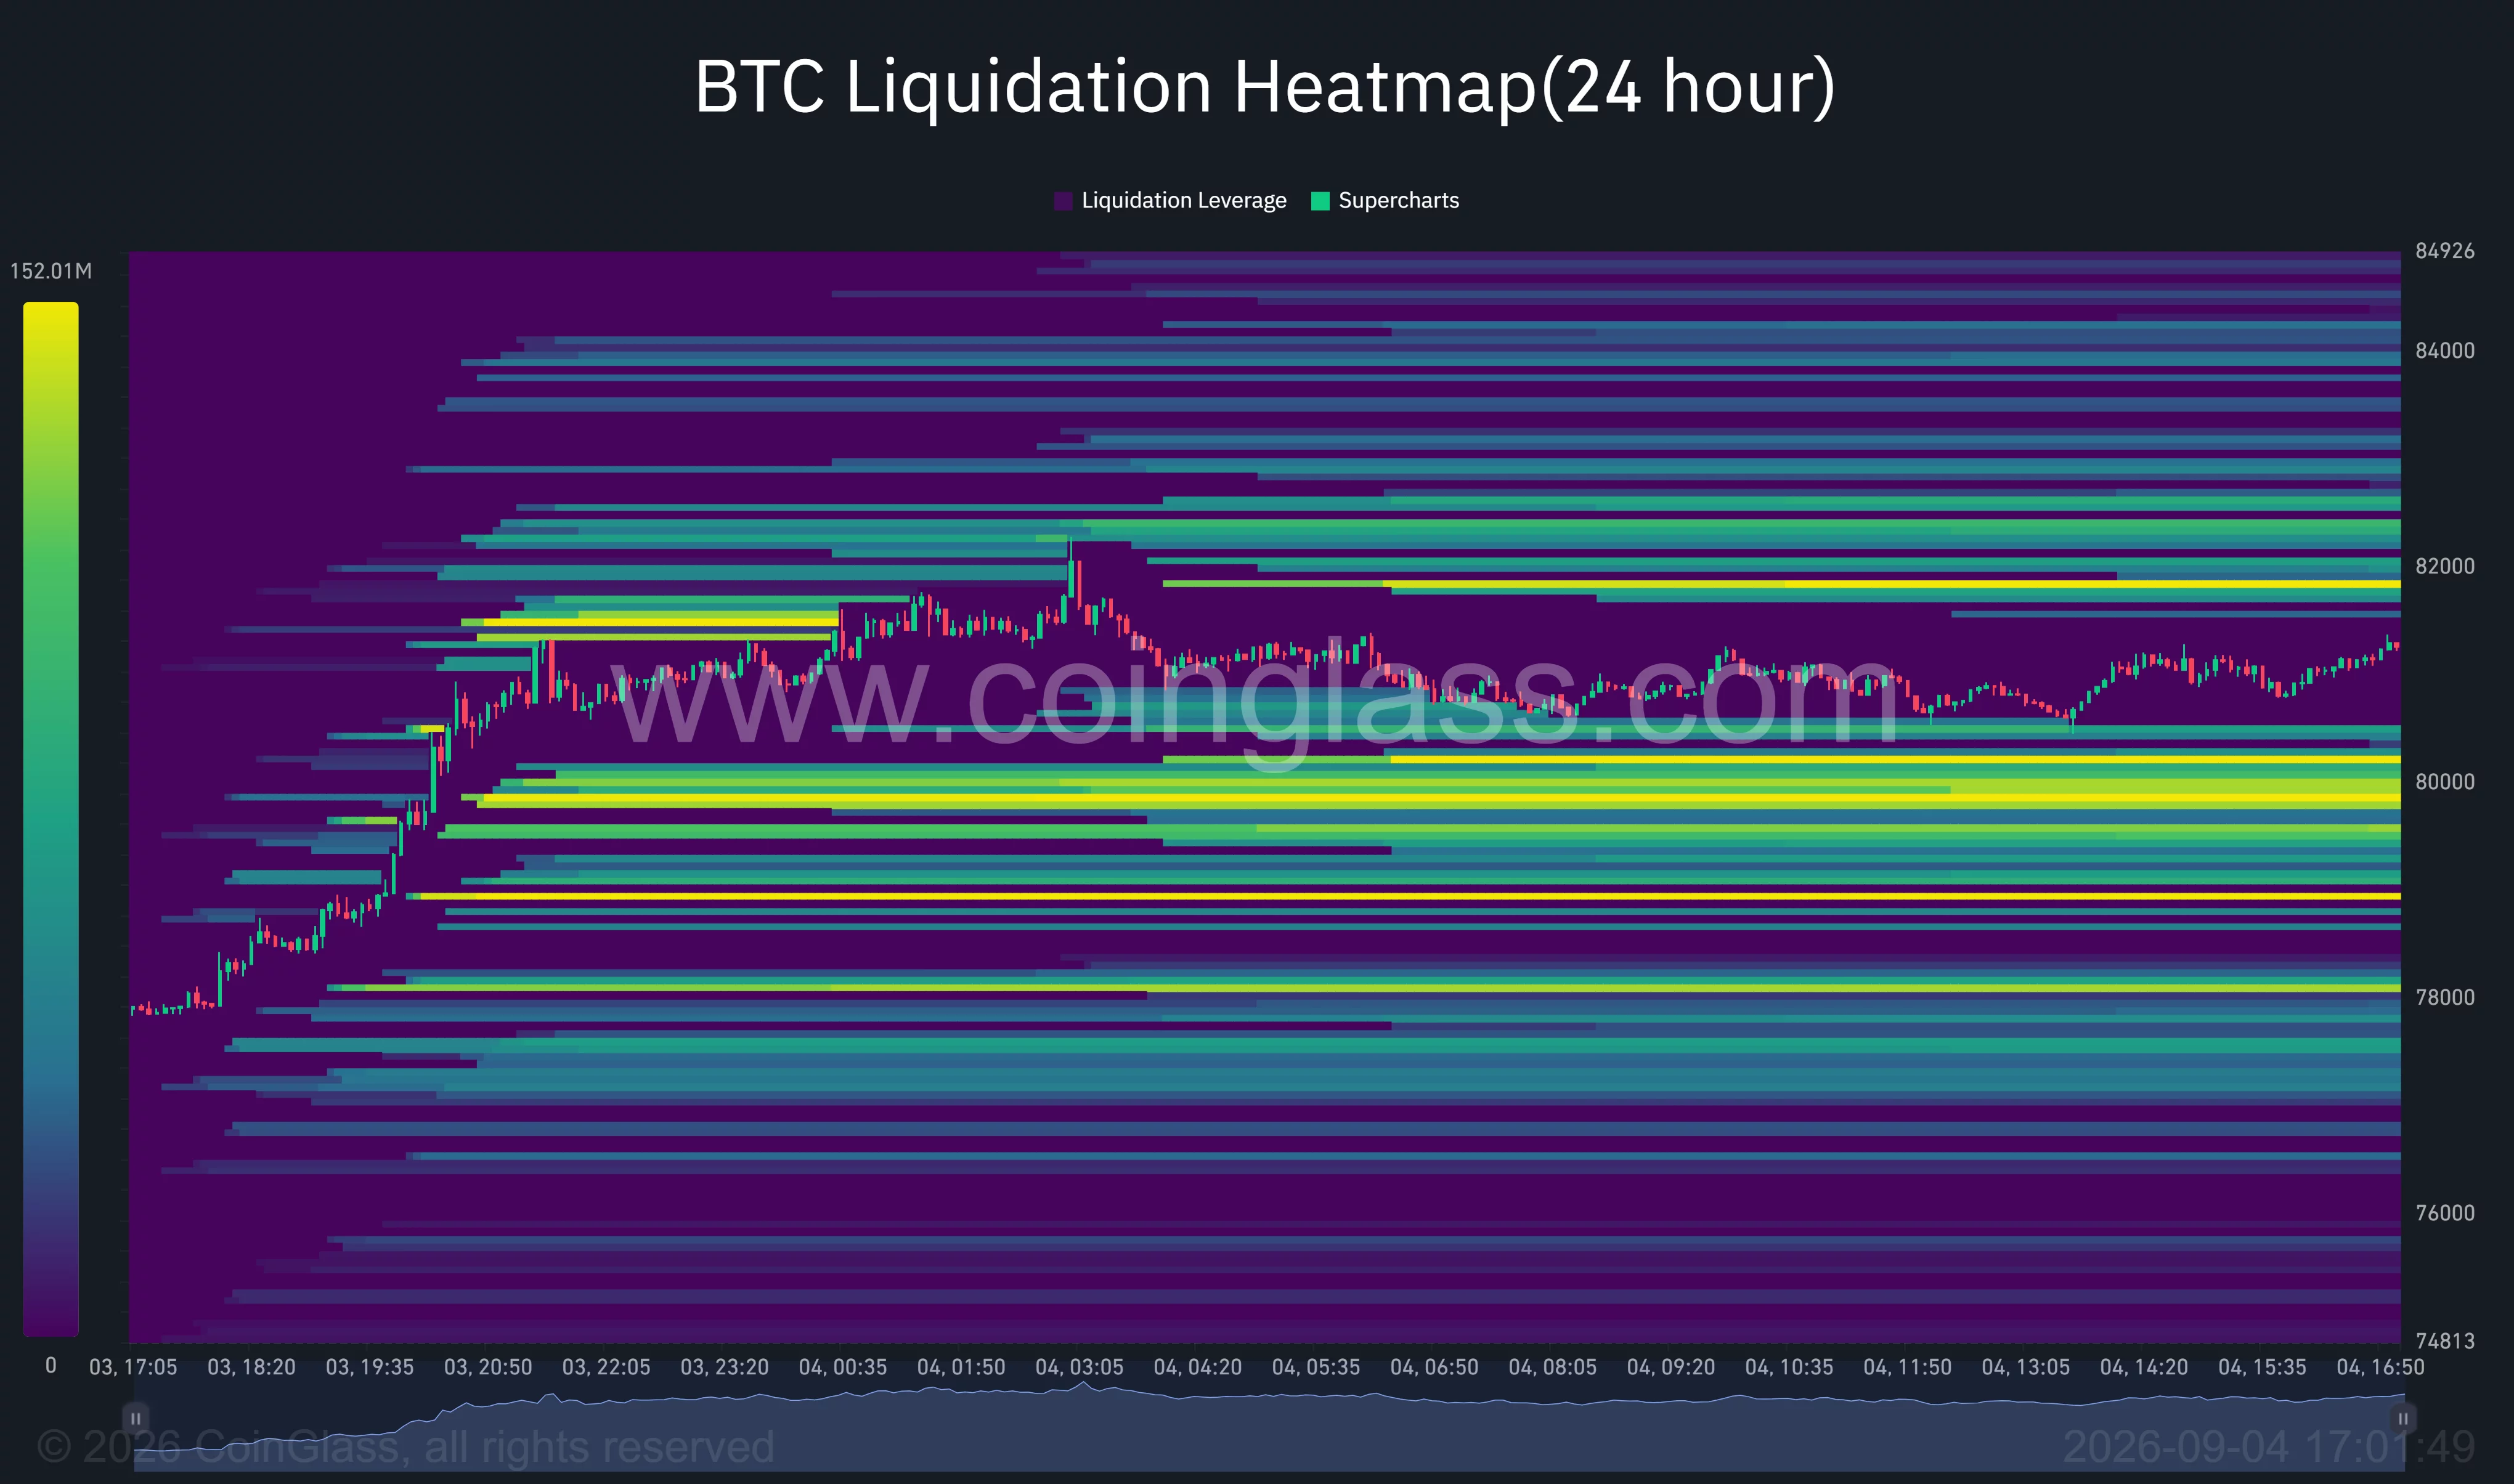
A larger concentration of liquidity is visible below the market between $79,800 and $80,300. Another band sits near $78,900, making both areas possible targets if Bitcoin loses $80,000.
The heatmap does not indicate which level the price will reach first. However, the concentration of leveraged positions on both sides raises the risk of sharp intraday swings as traders approach the weekly close.
Analyst Dami-Defi said Bitcoin had reclaimed a weekly exponential moving-average ribbon extending roughly from $71,000 to $78,000. According to the analyst, weekly closes above $78,000 would preserve the improved structure, while another loss of the ribbon would invalidate the reclaim.
The immediate bullish case requires Bitcoin to close above the 50-week moving average near $81,000 and clear the local high around $82,800. Such a move would expose $84,000, followed by the wider resistance zone between $95,000 and $96,000 identified by Dami-Defi.
Failure to hold $80,000 would instead put the $78,700 Bollinger midpoint and the weekly EMA region near $78,000 back in focus. A deeper decline could extend toward the 20-day moving average around $75,700.
Disclosure: This article does not represent investment advice. The content and materials featured on this page are for educational purposes only.
This morning’s report will be key as the Fed considers whether to raise interest rates at its September policy meeting.
The US economy added almost three times as many jobs as expected in August, triggering an immediate sell-off for risk-on assets like bitcoin as investors reassess the chances of another Federal Reserve rate hike.
The cryptocurrency’s price had risen to over $81,000 before the news went live, but plunged immediately by $2,000 to $79,200.

More specifically, the US economy added 162,000 jobs in August, according to data shared by the Bureau of Labor Statistics. The general expectations were for roughly 55,000-58,000 new jobs, which means that the actual numbers were significantly higher. The unemployment rate remained unchanged at 4.1%.
The July reading was also revised sharply higher, from a previously reported loss of 23,000 jobs to a gain of 21,000. Average hourly earnings increased 0.3% monthly and 3.1% annually.
A strong labor market gives the Federal Reserve more room to keep monetary policy tight, which, given Kevin Warsh’s hawkish speech from last week, spells trouble for risk-on assets like bitcoin.
The blowout jobs number weakens one argument for keeping rates unchanged: that the US labor market needs protection from tighter monetary policy. Higher interest-rate expectations typically push Treasury yields and the greenback north while reducing the relative appeal of risk assets.
Although the jobs report does not guarantee a September rate hike, as inflation remains the biggest concern for the US central bank, it certainly gives investors a lot to think about ahead of the CPI data next week.
The post Bitcoin Price Plunges After Blowout US Jobs Report: Here’s Why appeared first on CryptoPotato.

Ethereum trades at $2,520, sitting right at the pivot point most analysts have flagged in news outlets for weeks. That’s not a coincidence. A completed Elliott Wave Double Three correction just handed ETH a defined support zone, and buyers showed up almost exactly where the pattern said they would.
The technical case centers on a three-wave pullback that unfolded as a classic (W)-(X)-(Y) Double Three, a 3-3-3 corrective structure where each leg forms its own internal A-B-C sequence.
— Pepesso (@0xPepesso) September 2, 2026
 ETHEREUM SETS UP A WAVE 4 PULLBACK$ETH is completing daily Wave 3 after an aggressive impulse surge
Market structure shows downside imbalance left behind during the rally, creating a primary Wave 4 target between $2,112 and $2,222
However, buyers may front-run that deeper… pic.twitter.com/RXXtAE0ZLK
Analysts tracking the pattern projected wave (w) from the end of wave (x) using Fibonacci extension tools, landing on an Equal Legs buying zone at $2,375–$2,337. ETH found buyers there and has since pushed back toward the mid-$2,500s, currently developing what’s labeled the c-leg of the wave.
Zoom out and the broader chart tells a similar story. ETH rallied from roughly $1,850–$1,900 in late August to above $2,550, then consolidated inside a range analysts describe as a bullish flag under mounting selling pressure. The next move hinges on whether $2,500–$2,550 flips from resistance to support.
Discover: The Best Token Presales
Can Ethereum Price Hit $2,800 This Week?
ETH’s 24-hour range has been tight at $2,490 to $2,525, signaling consolidation rather than directional conviction. The immediate resistance band sits at $2,500–$2,550, described elsewhere as both flag resistance and a rising wedge ceiling. Holding the $2,438 Fibonacci level is the line in the sand for bulls; lose it, and the 200-day EMA near $2,161 becomes the next magnet.

- Bull case: A clean break above $2,550 opens the door to $2,700, then $2,800–$3,000, mirroring the flag’s measured move.
- Base case: ETH grinds sideways between $2,400 and $2,550 while wave (y) completes.
- Bear case: A break below $2,337 invalidates the Double Three read and drags price toward $2,212–$2,220.
None of these scenarios is guaranteed. Elliott Wave counts are probabilistic, not prophetic. Traders should treat $2,500 as the level that decides which narrative wins.
Trade ETH on Bybit and Get a Chance to Win Our $1,000 USDT Airdrop
Bitcoin Hyper Targets Early Mover Upside As Ethereum Comes With Bullish News
XRP holders riding the ETF narrative have already captured most of the easy upside from the $1.00 to $1.70 move. At current levels, a rally back to $2 caps out around 45% from the $1.38 price point. It’s solid, but not the kind of asymmetric setup that early-stage capital tends to chase.
The above reasons are pushing a segment of traders toward presale infrastructure plays where the ceiling hasn’t been priced in yet. Enter Bitcoin Hyper ($HYPER), a Bitcoin Layer 2 integrating the Solana Virtual Machine, the first project with SVM execution speeds faster than Solana itself, layered directly onto Bitcoin’s security base.
The presale has raised $33 million at a current token price of $0.0136855, with staking rewards offered at a high 65% APY. Core features include a decentralized canonical bridge for BTC transfers and low-latency smart contract execution, solving Bitcoin’s long-standing programmability gap.
Research Bitcoin Hyper through the official presale page before deciding.
Discover: The Best Crypto to Diversify Your Portfolio
The post Ethereum News: Double Three Pattern Hints at Another Rally appeared first on Cryptonews.


Prediction market Kalshi won’t let you bet on whether New Jersey’s case against it will reach the US Supreme Court, or what verdict the Supreme Court would issue if it ever did.
That’s according to Barron’s reporter Nick Devor, who claims that Kalshi’s policy means it “won’t have a way to hedge against the biggest risk to the company’s business.”
A Kalshi spokesperson told Devor that the firm could list a market on the Supreme Court’s actions if it wanted to, “but is not doing so on principle.”
Devor also notes that Kalshi doesn’t want to introduce a market which it could influence, as that would break its company policy.
Appeals courts are split over Kalshi
Last Friday, an appeals court ruled in Nevada’s favor that sports contracts aren’t swaps, putting them under the category of bets and within the scope of state regulation.
However, in April an appeals court sided with Kalshi after it sued New Jersey. The ruling stated federal regulators like the CFTC should have the final say over prediction markets and sports-related contracts.
Read more: American Indian tribes want Kalshi and Polymarket off their land
Because of this split across courts, New Jersey filed a petition with the Supreme Court this week asking it to decide on “whether prediction markets can offer sports wagers without following state sports-gambling laws.”
NFL says prediction markets threaten game integrity
The state of Michigan this week also banned Kalshi from offering event contracts to its citizens. It threatened a $500,000-a-day fine if it breached this new preliminary injunction.
The NFL also wrote to prediction markets yesterday, reiterating that it doesn’t want sports contracts on offer that are easily manipulated or “inherently objectionable.”
It said, “It is deeply concerning that bets within the objectionable categories that we identified months ago have been and continue to be listed as contracts on exchanges.”
Got a tip? Send us an email securely via Protos Leaks. For more informed news and investigations, follow us on X, Bluesky, and Google News, or subscribe to our YouTube channel.
[PRESS RELEASE – Los Angeles, California, United States, September 4th, 2026]
Digital collectibles platform MEMONS has officially launched its service. MEMONS is a digital collectibles platform where users can obtain digital cards of various rarity levels by opening Capsules, collect them, and trade them with other users through the Marketplace.

Unlike conventional collectible services that end once an item is acquired, MEMONS connects Capsule Opening, Collection, and Marketplace functions within a single platform. This creates a continuous ecosystem in which collecting and trading continue even after cards are obtained.
MEMONS combines the concepts of collecting, scarcity, and trading—widely used across the global collectible card, loot box, gacha, and digital asset markets—within a digital environment.
Recently, Web3 projects have increasingly expanded beyond token- and community-centered models into services where users can actively participate, including IP, gaming, digital content, and marketplaces.
In line with this trend, MEMONS is expanding into a digital collectibles platform that can connect various IPs and Web3 projects, beginning with APEPE.
About MEMONS
MEMONS is a digital collectibles platform that brings Capsule Opening, Collection, and Marketplace experiences together within a single ecosystem. Users can obtain digital cards of varying rarity levels, build their own collections, and trade cards with other users through the Marketplace.
Incubated within the APEPE ecosystem, MEMONS is designed as a scalable platform capable of supporting various IPs, characters, and Web3 communities. APEPE serves as its founding IP and core ecosystem partner.
Website: https://memons.io
The post Digital Collectibles Platform ‘MEMONS’ Officially Launches appeared first on CryptoPotato.

Bitcoin headed for its third straight winning week, as traders searched for refuge amid volatile moves in equities, currencies and bond markets.
The token is also up 4.6% week to date and hit a high of $82,272.31 overnight. That marks its highest level since May 11, when bitcoin peaked at $82,499.99. It last traded at $81,151.10.
Bitcoin had been in the doldrums for much of this year, trading roughly within the range of $60,000 to $70,000 since early June. However, the digital asset broke above $70,000 in late August, and it has continued to climb since then as the so-called debasement trade — a strategy in which traders move away from dollars into assets such as crypto or gold — regained momentum.

Bitcoin 5-day chart
“The price breakout came towards the [end of August] with the re-emergence of the debasement trade re-igniting investor interest in BTC – the U.S. Treasury announced it would increase purchases of longer-dated Treasuries, long yields fell, the dollar weakened, and BTC and gold moved higher,” Dominika Nestarcova, Goldman Sachs executive director of digital assets, said in a note Thursday.
Other cryptocurrencies are also rising. Ether hit a high of $2,545.62 on Friday, or its most elevated level since August 27. Solana jumped to as much as about $105.70, marking its highest price since August 31.


The impact of hardware wallet provider Trezor’s data breach was larger than initially estimated, expanding to an additional 67,000 US customers.
The breach may endanger more US users who ordered between November 2019 and August 2021, Trezor said in a Friday X post, citing the latest update from its shipping provider, ShipMonk.
These customers had their full details exposed, including name, email, number, shipping address and order specifics. Trezor blamed the shipping provider for not deleting the data from these orders, despite saying it had received written assurances from ShipMonk.
While Trezor systems were not compromised, the data breach may threaten the digital asset holdings of the 67,000 customers, as attackers may use the information for phishing attacks impersonating Trezor, in a bid to steal users’ seed phrases controlling their wallets.
In August, Trezor initially estimated that only 14,000 users had their data exposed through the shipping provider. Trezor reported in January 2024 that about 66,000 users were at risk of phishing attacks if they had contacted the company’s support team since December 2021.
Phishing attacks and social engineering don’t require exploiting code vulnerabilities. Still, these impersonation-based scams drove the majority of the crypto industry’s losses in the first quarter of the year, accounting for $306 million of the total $482 million lost, according to blockchain security company Hacken.
In July, a crypto investor lost nearly $1 million after signing a malicious phishing token approval transaction on Ethereum.
Related: Thai businessmen sue Tether for freezing $42M in $61M pig butchering case

Brooklyn Beckham and Nicola Peltz cosy up to one another as they drink red wine in Venice ahead of her receiving a ‘rising star’ award

Overview of Recent Events in Thailand Covering Political, Economic, Tourism, and Social Matters

Token Buybacks Are Booming. Are They Good For Crypto Projects?





-

 Fashion7 days ago
Weekend Open Thread: Maeve – Corporette.com
-

 Crypto World2 days ago
CLARITY Act could advance within weeks, Atkins says
-

 Business6 days ago
Onto Innovation Stock: AI’s Next Bottleneck Is Yield (NYSE:ONTO)
-

 Crypto World2 days ago
Elon Musk Says Grok 4.7 Lands in 10 Days and Will Beat Every Model
-

 Crypto World7 days ago
Bitcoin price tests $82K resistance as Brandt stays long
-
 Tech6 days ago
Hugging Face built a $4.5 billion empire on free AI models. Now Nvidia is buying it for $12.9 billion
-

 Business7 days ago
iPhone 18 Pro Pre-Orders Could Shift to Saturday as Apple Reportedly Avoids September 11 Anniversary
-

 Sports8 hours ago
Devon Dampier throws for 3 TDs as No. 21 Utah demolishes Idaho
-
Crypto World7 hours ago
XRP Trading Activity Hits Highest Level Since February as Price Jumps 8%
-

 Tech7 days ago
PaperCut releases second emergency patch for exploited flaws
-

 News Videos5 days ago
Charlie Munger on Robinhood: No one should believe that Robinhood’s trades are free
-

 Crypto World1 day ago
Kalshi seeks CFTC approval for WTI perpetual
-

 Tech6 days ago
As the influencer economy drives retail sales, Seattle startup raises $22M to play matchmaker
-
 Crypto World3 days ago
Bitcoin slips below $77.5K as macro pressure offsets ETF inflows
-

 Tech6 days ago
Tamagotchi Ring Takes the 30-Year Digital Pet and Places it on Your Finger
-
 Business2 days ago
Oil Price Today (September 2): Crude oil nears $97 as war tensions escalate. Will it hit $100 again?
-
 Entertainment5 days ago
Taylor Swift Reportedly ‘Frustrated’ With Travis Kelce After ‘Short’ Honeymoon
-

 Business7 days ago
Apple Confirms September 9 iPhone Launch Event as Tim Cook Prepares to Hand CEO Reins to John Ternus
-

 News Videos5 days ago
News kii Crypto ugu danbeeyey & Suuqa oo dhaqaaqey
-
 NewsBeat5 days ago
Trump posts AI video of ‘Lake America’ being protected by an army of bequiffed ‘Donald Ducks’
You must be logged in to post a comment Login