
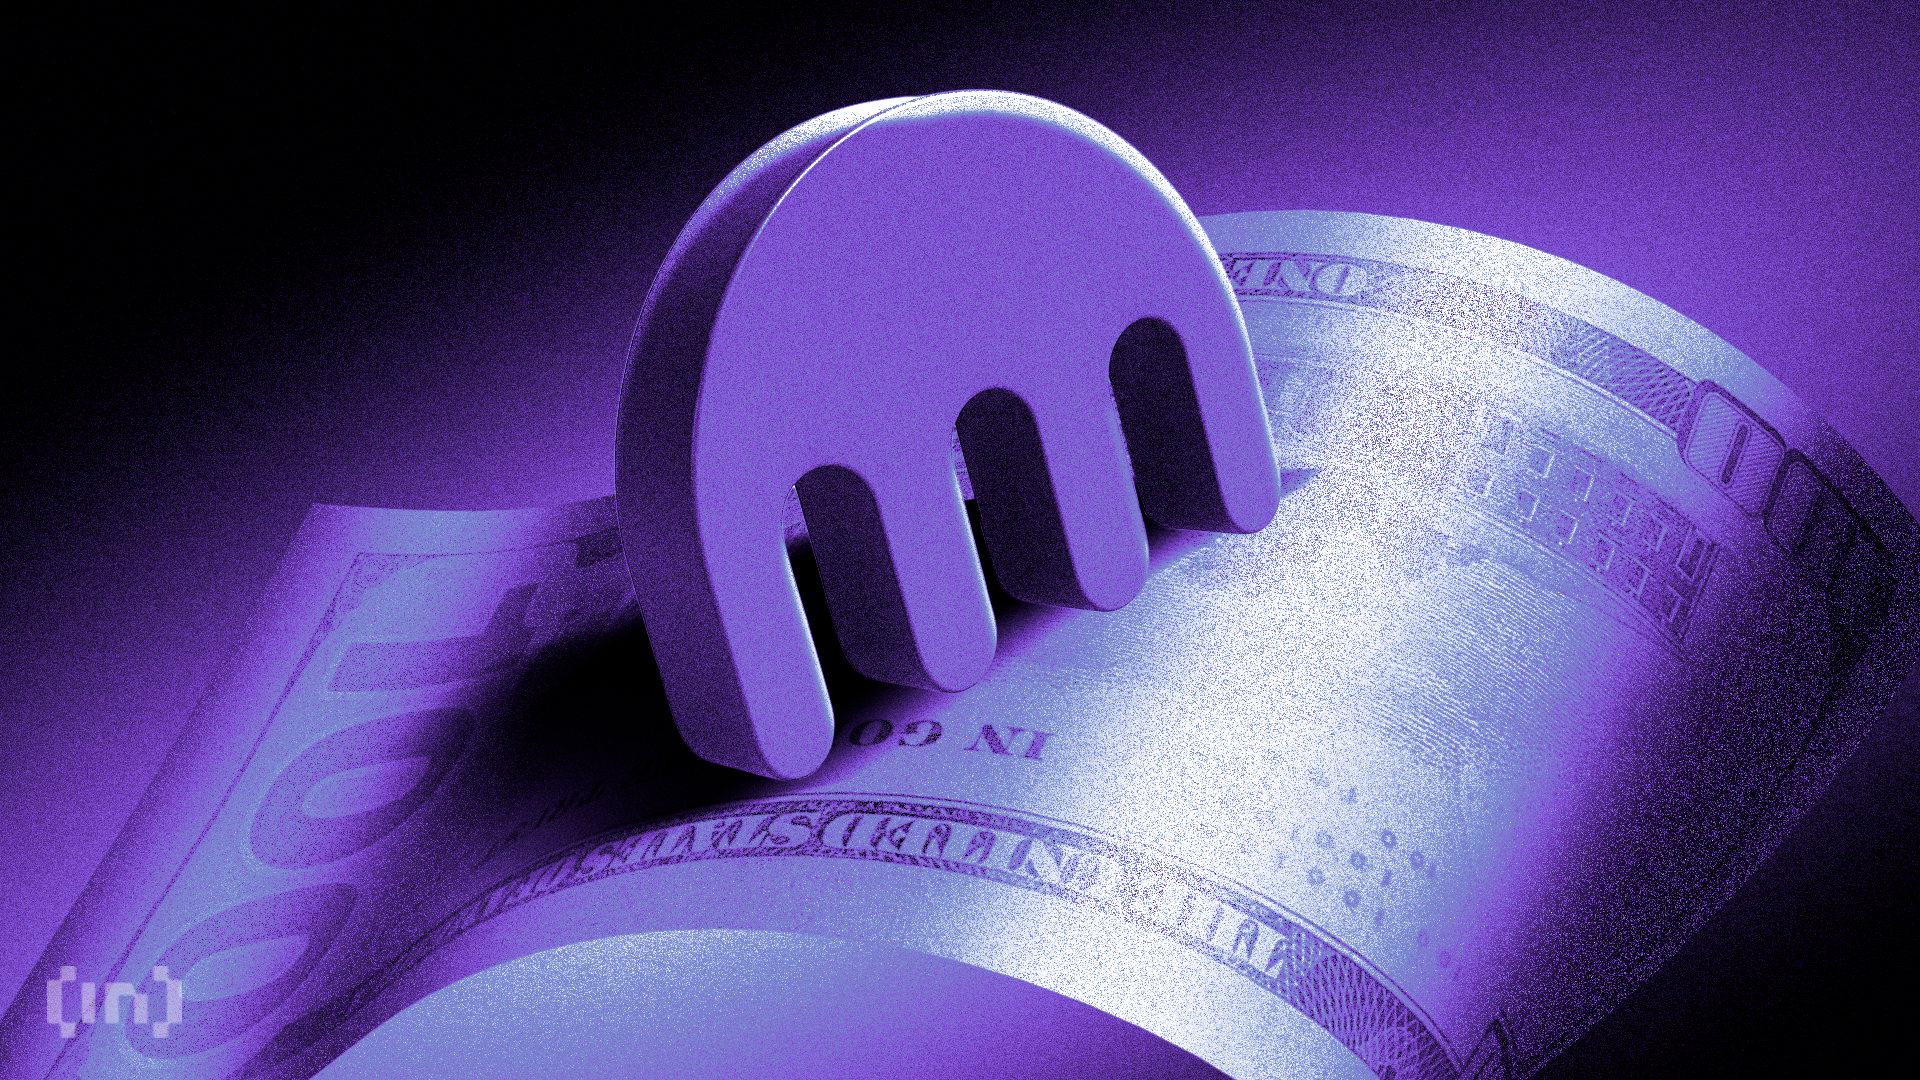
Crypto World
Kraken Builds Beyond Crypto With Futures, Tokenized Stocks, and Payments

Kraken has been around long enough to see nearly every version of the crypto market up close.
Founded in 2011, it lived through Bitcoin’s early volatility, the first big exchange era, the ICO boom, the long bear markets, the rise of institutional crypto, and the latest push into tokenized and multi-asset trading.
Across those cycles, Kraken kept adding products, expanding its reach, and finding new ways to stay relevant as the industry changed around it.
In March 2025, Kraken agreed to buy NinjaTrader for $1.5 billion. In April 2025, it launched trading in more than 11,000 U.S.-listed stocks and ETFs for select U.S. clients. In June 2025, it rolled out xStocks for eligible non-U.S. clients, starting with 60 tokenized U.S. equities, and launched Krak, a payments app supporting transfers across more than 160 countries and 300-plus assets.
The company kept building through the second half of 2025 with deals for Capitalise.ai, Breakout, Small Exchange, and Backed, then added Magna in February 2026 and Bitnomial soon after. By early 2026, Kraken was pushing further into tokenized equities as xStocks expanded from 60 at launch to 100 tokenized U.S. stocks and ETFs.
Let’s take a closer look at how Kraken has been building through this latest phase of the market.
NinjaTrader and regulated finance
The NinjaTrader deal in March 2025 gave Kraken a serious foothold in U.S. regulated futures.
Kraken valued the transaction at $1.5 billion and described NinjaTrader as the leading U.S. retail futures platform.
A few months later, Kraken used that foothold to launch U.S. regulated crypto futures and said it planned to add commodity, fixed income, FX, and equity futures later in 2025.
This gave Kraken a direct route into one of the main markets active traders use for hedging and directional bets.
Small Exchange gave Kraken a U.S. venue
Kraken pushed further in October 2025 when it bought Small Exchange from IG Group for $100 million. Importantly, Small Exchange came with a CFTC-regulated Designated Contract Market license.
Kraken said the purchase would help it launch a fully U.S.-native derivatives suite. Reuters reported the same deal as a move to strengthen Kraken’s American derivatives business for retail and institutional clients.
This put Kraken closer to the center of the U.S. futures market.
Backed and tokenized equities
Kraken’s tokenized equity push became far more serious in 2025.
Reuters reported on May 22, 2025, that Kraken planned to offer tokenized versions of more than 50 U.S. stocks and ETFs, including Apple, Tesla, and Nvidia, to non-U.S. clients.
Kraken formally launched tokenized U.S. equities on June 30, 2025 with 60 assets on the platform.
On December 2, 2025, it announced the acquisition of Backed, the company behind xStocks, saying the deal would bring issuance, trading, and settlement closer together.
By March 18, 2026, Kraken said xStocks had grown to 100 tokenized U.S. stocks and ETFs and had surpassed $25 billion in total transaction volume since launch. That growth soon fed into a partnership with Nasdaq, announced through Kraken parent Payward, focused on developing an equities transformation gateway for tokenized equities and helping connect regulated market structure with on-chain distribution.
Magna took Kraken into token operations
In February 2026, Payward, the platform behind Kraken, acquired Magna.
Kraken described Magna as a token management platform used for vesting, claims, distributions, and related workflows.
Magna will keep operating as a standalone product, though Kraken also said it will be deeply integrated.
This gives Kraken a place in the day-to-day work of token teams, not just the trading venue where assets change hands after launch.
Capitalise.ai and Breakout
Kraken also used acquisitions to widen the kinds of traders it can serve.
In August 2025, it bought Capitalise.ai, a no-code automation platform that turns plain-language prompts into trading strategies and backtests.
In September 2025, it acquired Breakout, a prop trading platform that offers up to $200,000 in trading capital, with users keeping up to 90% of profits according to Kraken’s materials.
These additions fit a platform trying to keep more of the trader workflow inside one account, from idea generation to automation to funded execution.
Krak linked payments
Krak shows how Kraken wants to connect markets with everyday money movement.
Reuters reported on June 26, 2025 that the app launched in more than 100 countries for crypto and fiat transfers.
Kraken’s own product pages later put the figure at more than 160 countries and said users could transact across 300-plus assets. The company also said physical and virtual cards were planned.
This gives Kraken a consumer payments product sitting next to trading, tokenized equities, and derivatives rather than outside them.
Bitnomial adds another U.S. derivatives layer
In April 2026, Kraken parent Payward announced the acquisition of Bitnomial, a CFTC-regulated derivatives exchange and clearinghouse. The deal adds another regulated U.S. futures asset to Kraken’s portfolio and expands its ability to serve traders who want futures access inside American market structure.
A one-platform financial business
Let’s go through the list once more.
- NinjaTrader opened the door to U.S. regulated futures.
- Small Exchange added a licensed venue.
- Backed brought xStocks in-house.
- Magna added token administration tools.
- Capitalise.ai and Breakout served more active traders.
- Krak brought payments into the same product family.
- Bitnomial added another U.S. regulated derivatives venue and clearing capability.
Kraken also launched U.S.-listed stock and ETF trading in April 2025, giving select U.S. users access to more than 11,000 equities on the same platform.
The legal side is worth noting too. In Europe, Kraken now operates through MiCA-regulated entities and also holds a MiFID II license. Those approvals give the company stronger footing across the EEA as it expands trading, payments, tokenized equities, and related services.
There is also a major U.S. regulatory angle. Kraken said in March 2026 it became the first digital asset firm with a Federal Reserve master account. Direct access to the U.S. payments system adds another serious piece to its financial-services buildout.
Acquisitions can assemble the parts quickly, but users and institutions will judge the result by whether those parts work well together. Kraken now has trading, payments, token operations, tokenized equities, and multiple regulated derivatives assets. The next phase is proving that this collection functions like one platform.
The post Kraken Builds Beyond Crypto With Futures, Tokenized Stocks, and Payments appeared first on BeInCrypto.


Reppo landed a $20m strategic commitment from Bolts Capital to scale its prediction market protocol and “Datanets,” aiming to turn staked human judgment into high‑quality AI training data.
Summary
- Reppo Foundation has secured a $20,000,000 strategic investment commitment from Bolts Capital to scale its decentralized prediction market protocol.
- The deal aims to expand Reppo’s ecosystem and use markets to generate high-quality training data for artificial intelligence models.
- Reppo supports multimodal data — from text and images to audio and video — via decentralized “Datanets” designed for model training, evaluation, and fine-tuning.
Decentralized prediction market network Reppo has secured a $20,000,000 strategic investment commitment from Bolts Capital to back the next phase of its protocol development and ecosystem growth, the Reppo Foundation said on April 23.
The foundation said the funding will also be used “to promote the use of prediction markets to solve the training data bottleneck issue,” positioning Reppo at the intersection of crypto-native market design and AI infrastructure.
Bolts Capital’s commitment is structured as a strategic investment, underscoring that this is not just balance-sheet capital but a longer-term wager on Reppo’s core thesis and the wider prediction-market-as-data narrative.
Turning human judgment into AI training data
Reppo’s central idea is to convert human judgment into verifiable, incentivized data streams using prediction market mechanisms, rather than relying solely on traditional data-labeling pipelines.
According to the project, this design directly targets “the current challenges in acquiring high-quality data for AI training,” where noisy, biased, or low-signal datasets can cap model performance even as compute scales.
By forcing participants to stake capital on their beliefs and be financially accountable for being wrong, prediction markets can, in theory, produce sharper probability estimates and richer behavioral signals than conventional surveys or annotation tasks.
Building decentralized Datanets for models
Reppo says its protocol supports multimodal data processing, spanning text, images, audio, and video, all organized through decentralized data networks it calls “Datanets.”
These Datanets are pitched as infrastructure for model training, evaluation, and fine-tuning, effectively turning a prediction market layer into a continuous source of scored, time-stamped, and incentive-aligned data.
The $20,000,000 commitment is meant to accelerate both protocol development and ecosystem expansion around these Datanets, from new prediction-market primitives to tooling for AI teams that want to plug Reppo-derived data into their pipelines.
If Reppo can prove that markets can reliably generate better training and evaluation data than conventional labeling shops, Bolts Capital’s bet could mark an early, high-conviction signal that crypto prediction markets are maturing from speculative casinos into critical plumbing for AI development.

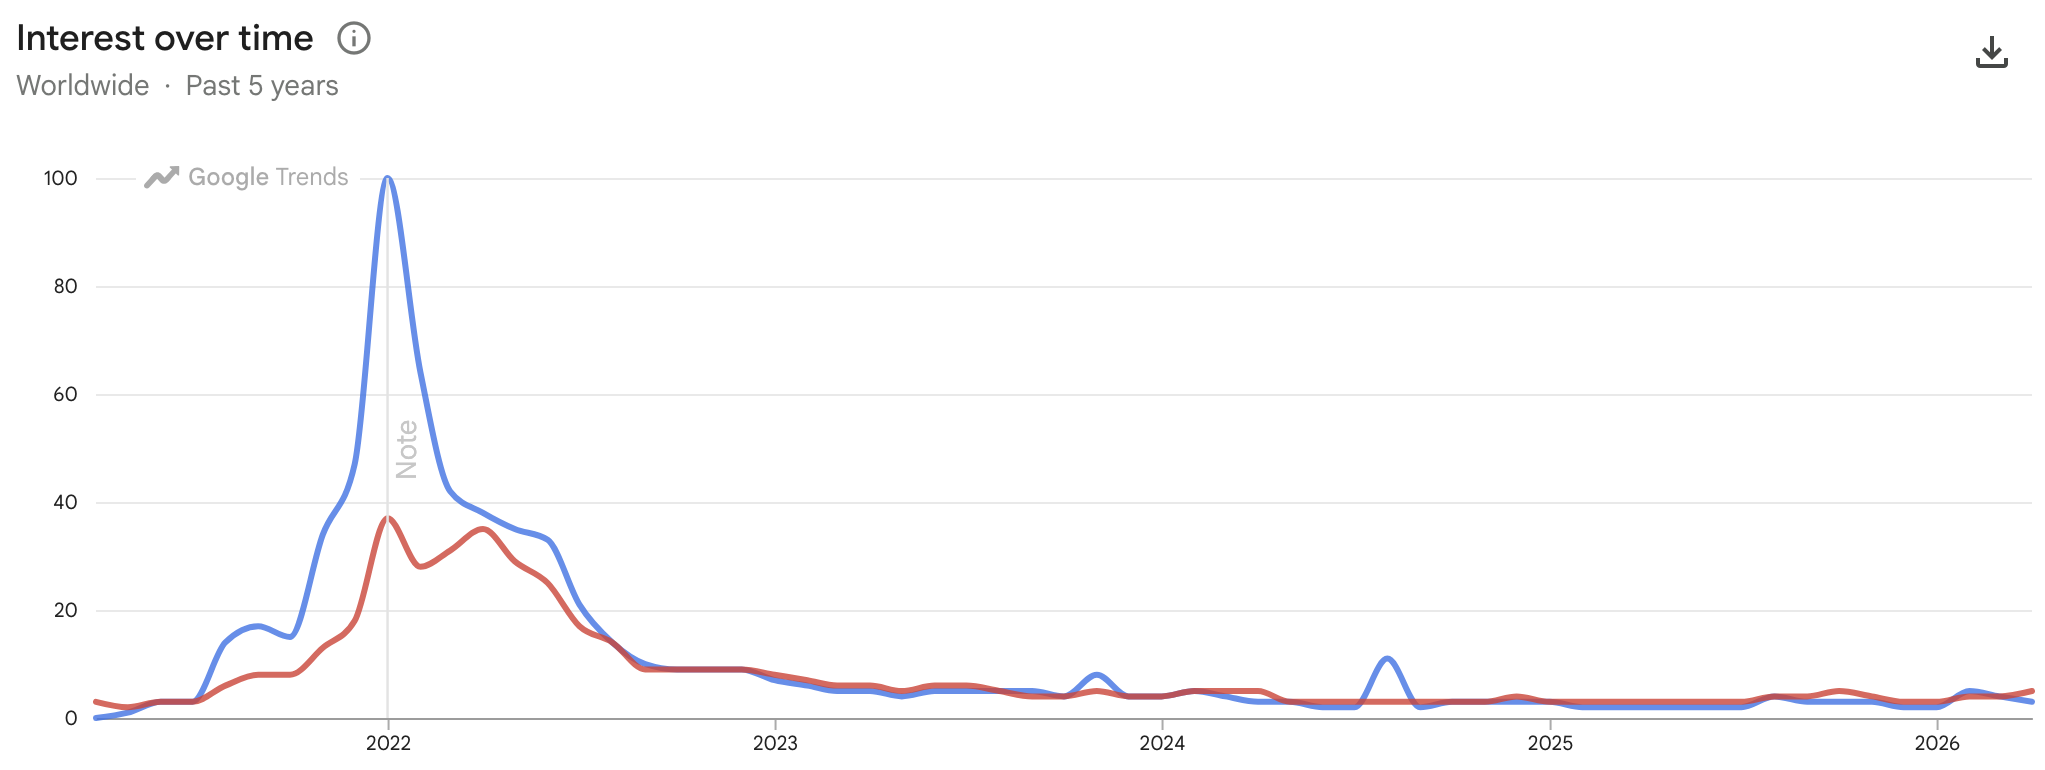
Bored Ape Yacht Club (BAYC) celebrates its fifth birthday today. Unfortunately, celebrations have been a little muted.
The project’s once massive pool of high-profile celebrity supporters that included the likes of Paris Hilton,, Mark Cuban, and Jimmy Fallon, has dwindled, and online interest has cratered.
Indeed, searching Google Trends for the term “Bored Ape Yacht Club” reveals that interest in the company is 97 times lower than it was during the NFT frenzy of 2022.
During the height of NFT and Bored Ape Mania, the likes of Snoop Dogg and Eminem promoted the project and the short-lived metaverse fad onstage at various times.
Eminem at least put his money where his mouth is, reportedly buying an Ape for roughly $462,000. Unfortunately, top offers for the same NFT are now sitting at around 8.83 ether (ETH), or $20,000.
Eminem hasn’t posted anything about NFTs or BAYC on his X account since 2022.
Snoop, also spent big, paying $366,000 for four Apes back in 2021. However, the top offers for these four NFTs are worth just shy of $28,000.
And while he’s maintained some support for the floundering project, his enthusiasm seems to have waned. Despite calling it a “cultural juggernaut” at the time, he’s posted very little about the project on X since 2022.
Read more: Yuga Labs directs royalties to bankrupt FTX US
Celebrities aren’t talking about Bored Ape Yacht Club anymore
While Snoop Dogg has continued to mention BAYC from time to time, he now appears to be using it as more of an attention getter for other projects than anything else.
For example, a trip arranged by BAYC for holders to visit Snoop’s compound to celebrate 4/20 ended up being just a promotional stunt for his family’s ice cream brand, Dr Bombay — named after his Ape — which hasn’t posted on X in years.
While Snoop was briefly present at the event, and there was little to no BAYC-themed promotion from him on social media, save for a shoddy AI-generated video of his Ape and a single repost of an old image.
Other celebrities such as, Justin Bieber, Serena Williams, Neymar Jr, Post Malone, DJ Khaled, Paris Hilton, Mark Cuban, and Jimmy Fallon have all supported the BAYC brand.
Canadian pop elf Bieber paid roughly $1.3 million for his very own Ape in 2021. Its current top offer is roughly $19,000 and he’s seemingly not happy, having posted nothing at all about BAYC or NFTs.
Brazilian footballer Neymar Jr. spent over $1.1 million on two APES in 2022, however these are now worth somewhere in the region of $57,000.
Surprise surprise, Neymar hasn’t posted about NFTs or BAYC since 2022.
Talk show host Fallon spent $224,000 buying an Ape in 2021 but its value has since slid to just $19,000.
He hasn’t talked about it on X since.
DJ Khaled, Paris Hilton, Mark Cuban, and Serena Williams have all neglected to mention BAYC since 2022 on X while Post Malone brings up no results for either NFTs or BAYC.
Perhaps worst of all, none of these celebrities wished BAYC a happy birthday today.
Read more: Yuga Labs wants Pauly0x’s $400K worth of crypto seized
As interest in BAYC itself dries up, so too are the funds entering its wider NFT ecosystem.
The floor price of the BAYC collection is down 94.3% from its all-time high in May 2022, while BAYC’s token ApeCoin is also down 99.6% from it’s similarly timed peak.
Last year, one BAYC buyer sold two of his NFTs at a 92% loss despite holding them during the 2022 craze. During the May highs, they were worth $4.3 million, however, they eventually sold them for $420,000.
Five years of legal wrangling and blinding fans
2021/2022 was a wild couple of years for BAYC and its followers.
It appeared to have hit the mainstream in earnest when Jimmy Fallon and Paris Hilton awkwardly promoted the project on his primetime talk show. Meanwhile, Snoop Dogg and Eminem sang the brand’s praises at the MTV VMAs.
However, these celebrity endorsements ultimately led to a 2022 lawsuit which accused the project’s creator Yuga Labs of promoting the NFTs without clarifying their compensation. It also claimed that the NFTs should be classified as securities.
Three years later, a judge dismissed the lawsuit and ruled that NFTs are not, in fact, securities.
Read more: BAYC goes full ‘laser eyes’ and allegedly blinds ApeFest attendees
Further damaging to BAYC’s image was its 2023 ApeFest. The event was a three-day get together in Hong Kong that, far from catapulting Bored Apes to even greater heights, was thrown into chaos when UV lighting used on stage temporarily blinded a number of attendees.
The previous year, Yuga Labs bought the rights to NFT collection CryptoPunks. However, by 2025, it sold that stake to the non-profit Node Foundation for $20 million.
In 2024, Yuga Labs sunk $450 million into web3 game Otherside. Its launch was a virtually unplayable buggy mess.
Today, the firm continues to promote meetups with holders, and recently replaced its former CEO Greg Solano with Michael Figge.
Got a tip? Send us an email securely via Protos Leaks. For more informed news and investigations, follow us on X, Bluesky, and Google News, or subscribe to our YouTube channel.
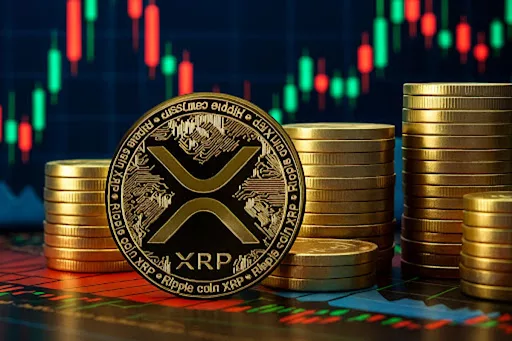

XRP is grinding in the mid‑$1.40s, trapped between stubborn resistance and strong support as fresh “digital commodity” clarity, ETF rails and April seasonality fight flat flows.
Summary
- XRP trades around 1.42–1.45, still roughly 60% below its 2018 all‑time high near $3.65, with a key 1.30–1.35 support band and 1.50–1.52 acting as near‑term resistance.
- April is historically XRP’s strongest month with average returns above 20%, and 2026 is already shaping up as one of its better Aprils thanks to renewed regulatory clarity, ETF access and altcoin rotation.
- A joint SEC–CFTC statement now treats XRP as a digital commodity, Ripple is leaning into its “institutional rails” pitch, and derivatives open interest is well below 2025 peaks, leaving room for a squeeze if 1.50 breaks on volume.
XRP (XRP) is still down roughly 60% from its 2018 all‑time high near $3.65, even after a strong bounce off the low‑$1 area earlier this year. April is historically XRP’s best month, with average returns above 20%, and 2026 is already one of its strongest April performances since 2025, driven by renewed regulatory clarity and an altcoin rotation bid. The SEC’s decision to fully drop its lawsuit against Ripple resets the narrative: the token moves from “regulatory orphan” back to credible settlement rail, which institutions actually model in their payment stacks.
XRP market structure and history
Spot XRP is currently trading around 1.42–1.45, with most short‑term models clustering April fair value between 1.40 and 1.63. Price is compressing in a range where 1.30–1.35 acts as major support and 1.50–1.52 caps upside; above that, 1.70–1.80 opens quickly, with thin historical resistance until the high‑$1.70s. On daily charts, XRP is trading above short‑term SMAs (3–50 day) but still below the 100–200 day averages, which remain a drag; this is classic mid‑cycle repair, not euphoric blow‑off.
Volume tells the real story. Open interest in XRP derivatives is currently far below 2025 peaks and ETF flows have cooled from hundreds of millions a week to low single‑digit millions, even registering net outflows in March. Yet social sentiment is perversely strong: XRP carries one of the best positive‑to‑negative mention ratios among majors, even as price underperforms. That is exactly the kind of positioning that produces violent squeezes when a catalyst finally hits.
Recent headlines matter:
- Ripple is currently leaning into the “institutional rails” pitch, with at least a quarter of surveyed big allocators planning to add XRP exposure in 2026.
- A joint SEC–CFTC release is now classifying XRP as a digital commodity, with the CLARITY Act markup sitting in the near‑term pipeline.
- ETFs tied to XRP, including leveraged products, are already live and giving traditional funds cleaner access.
Smug trader’s price view (next 4–8 weeks)
Base case: XRP is currently trading in an accumulation band; I expect a grind higher into the 1.65–1.80 zone as regulatory headlines crystallize and ETF outflows stabilize. That implies roughly 15–25% upside from here, with volatility compressing first, then expanding on a clean break of 1.50–1.52 on rising volume.
Bear case: a failed breakout above 1.50 that rejects back into the range and loses 1.30 support sends XRP toward 1.15–1.20, where there is stronger historical holder density. In that scenario, leveraged longs get rinsed, and April’s “seasonality edge” dies right there.
Moon‑boy case: structurally possible, not yet probable. The 3–5 region some analysts tout would require a synchronized risk‑on regime, BTC making new highs, and a second wave of ETF inflows as banks roll out real XRP‑based payment products. I am currently treating that as an option, not a forecast.


- Chainlink price retested $9.50 as bears keep sentiment in check.
- Bridgetower has adopted Chainlink’s solutions to tokenize $11 billion in securities.
- LINK price faces short-term resistance around $9.50-$10.50.
Chainlink’s LINK token trades at $9.31 after shedding gains from intraday highs of $9.50 earlier in the day.
The altcoin continues to hover below the $10 mark amid broader market dynamics.
Macro and geopolitical headwinds remain notable factors keeping bears in control, but could Bridgetower’s adoption of Chainlink to tokenize over $11 billion in securities provide fresh momentum for LINK?
Here’s a brief outlook for Chainlink’s price following this latest milestone in institutional asset tokenization.
Bridgetower’s Chainlink integration
According to an announcement, Bridgetower is set to leverage Chainlink’s institutional platform to tokenize assets across natural resources, energy, and metals.
The move will initially bring the DOM X Arizona Copper-Gold Project, a US-based natural resource initiative valued at $11 billion, on-chain.
NOW: Bridgetower adopts Chainlink to tokenize $11B+ in securities from the DOM X Arizona Copper-Gold Project.
By integrating the full Chainlink stack into its tokenization platform, BridgeTower is unlocking the issuance and distribution of tokenized securities at scale. pic.twitter.com/wnucctQ3IP
— Chainlink (@chainlink) April 23, 2026
Bridgetower will enable the issuance and management of the tokenized asset via Chainlink’s Cross-Chain Interoperability Protocol (CCIP), Proof of Reserve, and NAVLink solutions.
The integration embeds KYC, KYB, and AML controls at the protocol level within Bridgetower’s Tokenization Platform, supported by fiat and stablecoin rails from Iron, a MoonPay company.
“We’re excited to see Bridgetower move from a CRE early adopter to live institutional tokenized asset deployment around an $11 billion asset in just a few months. All the world’s largest financial institutions are watching tokenization right now, and they are looking for production evidence for powering assets at an institutional scale,” said Johann Eid, chief business officer of Chainlink Labs.
This development strengthens Chainlink’s momentum in the tokenization sector.
Recent months have seen major financial institutions and governments tap into the oracle network for real-world asset tokenization. Chainlink has helped secure over $100 billion in total assets, and analysts say this traction could reflect in LINK’s long-term price.
Chainlink price – short-term technical outlook
With LINK hovering around $9.30, key support lies in the $8.70–$9.00 range, while immediate resistance is between $9.50 and $10.50.
If buyers push higher, a potential rebound toward $14–$15 could follow. However, a breakdown on high volume could send prices lower toward support at $7.80.
Technical indicators support this mixed outlook. The RSI on the daily chart is around 48, placing it in neutral territory and suggesting room for gains.
However, the MACD shows waning momentum with a flat histogram, hinting at a possible inflection point.

A broader bullish breakout in cryptocurrencies—particularly if Bitcoin moves above $80,000—would be supportive for LINK. Conversely, geopolitical uncertainty or escalation that dampens risk appetite could trigger selling pressure across major altcoins, including Chainlink.

Key Takeaways
- Circle Internet Group (CRCL) soared 9.7% Wednesday following a rating upgrade from Freedom Capital to hold.
- Shares reached an intraday peak of $104.39, closing up from the previous $96.02, though volume remained significantly below normal levels.
- Rising USDC stablecoin adoption is fueling investor enthusiasm as the company approaches its May 11 Q1 earnings announcement.
- The company exceeded Q4 projections with earnings per share of $0.43 versus consensus of $0.25 and year-over-year revenue growth of 76.9% to $770.23M.
- Wall Street remains divided on CRCL, with an aggregate “Hold” rating and a mean price target of $127.24.
Circle Internet Group (CRCL) posted a robust 9.7% gain Wednesday, advancing from $96.02 to an intraday high of $104.39 before stabilizing near $105.33 during midday trading.
The surge followed Freedom Capital’s decision to elevate CRCL to a hold rating. Though a hold designation typically signals neutrality, the move was sufficient to spark renewed buying momentum.
Share turnover registered approximately 2.99 million — roughly 80% beneath the typical daily average of 15.08 million. The advance occurred on subdued volume, a detail that warrants attention from active traders.
The upgrade wasn’t the sole driver. Market participants are increasingly zeroing in on accelerating demand for Circle’s USDC stablecoin and heightening institutional engagement as the May 11 Q1 earnings release approaches.
Expanding USDC reserves are being interpreted as evidence that Circle’s primary revenue engine is gaining traction. This developing story has amplified bullish sentiment.
Wall Street’s Mixed Signals
The analyst community presents a fragmented outlook. Based on MarketBeat intelligence, CRCL maintains an average “Hold” rating with a collective price target of $127.24.
The distribution: 1 Strong Buy, 9 Buy recommendations, 11 Hold ratings, and 3 Sell calls. The consensus lacks uniformity, though optimistic voices have grown more prominent recently.
Robert W. Baird increased its price objective from $110 to $138 in March while maintaining an “outperform” designation. Clear Street elevated CRCL to a strong buy recommendation during the same period.
Conversely, JPMorgan reduced its target from $100 to $90 in February while preserving an “overweight” rating — an approach that struck some observers as inconsistent.
Mizuho boosted its target from $100 to $120 in March but maintained a “neutral” stance. William Blair reaffirmed its “outperform” view in February.
Q4 Results Exceeded Expectations
Circle’s most recent quarterly disclosure, published February 25, delivered solid results. The firm reported earnings per share of $0.43 for the period, surpassing the Wall Street consensus of $0.25 by $0.18.
Revenue reached $770.23 million, representing a 76.9% year-over-year increase. These figures commanded attention across the investment community.
The analyst community collectively projects full-year earnings per share of $0.84 for the ongoing fiscal period.
The stock’s 50-day moving average currently stands at $94.86, while the 200-day moving average rests at $92.82. Wednesday’s advance positioned CRCL decisively above both technical benchmarks.
Regarding insider activity, CFO Jeremy Fox-Geen divested 4,238 shares at $90.00 on April 2, generating proceeds of $381,420. Director M. Michele Burns sold 1,666 shares at $92.38 on April 6 for $153,905. Both dispositions occurred under predetermined Rule 10b5-1 trading arrangements.
Cumulatively, company insiders have sold 545,874 shares valued at $52.99 million across the past quarter. Insiders retain ownership of 10.85% of outstanding shares.
Market capitalization approximates $25.91 billion, accompanied by a price-to-earnings multiple of -56.38.


Spanish police seized crypto cold wallets tied to an alleged illegal manga site, as questions remain over whether officers can access the funds.

Key Takeaways
- First-quarter earnings per share reached $9.71, surpassing the Wall Street estimate of $8.95
- Revenue for the quarter totaled $3.99 billion, representing an 8.7% year-over-year increase and exceeding the $3.87B forecast
- Annual revenue projection elevated to $16.9B–$17.4B range, improved from previous $16.8B–$17.3B outlook
- Expansion fueled by nonresidential construction, infrastructure projects, power sector, and mining operations
- Bernstein maintained its Outperform rating as URI has delivered 37% gains over the trailing twelve months
The equipment rental leader delivered an impressive first quarter that exceeded analyst projections on both the top and bottom lines, triggering a swift market response.
Shares of URI skyrocketed approximately 20% during Thursday’s trading session, reaching levels near $960, positioning it as the S&P 500’s strongest performer for the day. The stock has now gained 32% in April alone and posted 19% gains year-to-date.
Adjusted earnings per share for the first quarter registered at $9.71, exceeding analyst expectations of $8.95 by $0.76. This represents growth from the $8.86 per share recorded in the comparable period last year. Total revenue reached $3.99 billion, marking an 8.7% increase from the prior-year figure of $3.72 billion and surpassing the consensus estimate of $3.87 billion.
Rental revenue—representing the company’s primary business segment—advanced to $3.42 billion, improving from $3.15 billion in the first quarter of 2025 and establishing a new quarterly record for the period. The average original equipment cost increased 5.7%, while overall fleet productivity showed improvement of 2.3%.
CEO Matthew Flannery highlighted that expansion came from multiple business segments. On the construction front, nonresidential construction and infrastructure projects drove performance, while the industrial segment benefited from strength in power, mining, and minerals.
New construction activity in healthcare facilities, data centers, manufacturing plants, and infrastructure projects all played a role in the quarter’s strong showing.
Company Elevates Full-Year Projections
United Rentals increased its annual revenue forecast to a range of $16.9 billion to $17.4 billion, representing an upgrade from the previous guidance of $16.8B to $17.3B. The revised midpoint of $17.15 billion slightly exceeds the Street consensus of $17.07 billion.
The company tightened its adjusted EBITDA guidance to $7.625B–$7.875B, compared to the earlier range of $7.575B–$7.825B. Free cash flow projections remained steady at $2.15B–$2.45B.
During the analyst call, Flannery noted the year is “playing out better than we expected just a few months ago,” emphasizing that field-level feedback continues to be positive, particularly regarding large-scale projects.
World Cup Tournament Provides Additional Tailwind
Flannery specifically highlighted one notable opportunity: the 2026 FIFA World Cup. The company anticipates serving as “a key partner” for the international tournament beginning in the second quarter.
Construction activity is currently progressing throughout host cities in the United States, Mexico, and Canada, encompassing stadium modifications to meet FIFA specifications along with extensive infrastructure enhancements.
First-quarter adjusted EBITDA totaled $1.76 billion, exceeding consensus projections by 5%. The General Rentals segment posted gross margins of 33.8%, approximately 180 basis points higher than analyst forecasts. Specialty segment gross margins reached 41.4%, falling roughly 200 basis points short of expectations, although Specialty rental revenues still surpassed estimates by 5%.
Bernstein SocGen Group maintained its Outperform rating on the stock following the quarterly report, keeping its price target at $903. The current trading price near $960 places shares significantly above that target following Thursday’s rally.
URI’s market capitalization now stands at roughly $50.5 billion, with the stock generating approximately 37% returns over the past year.
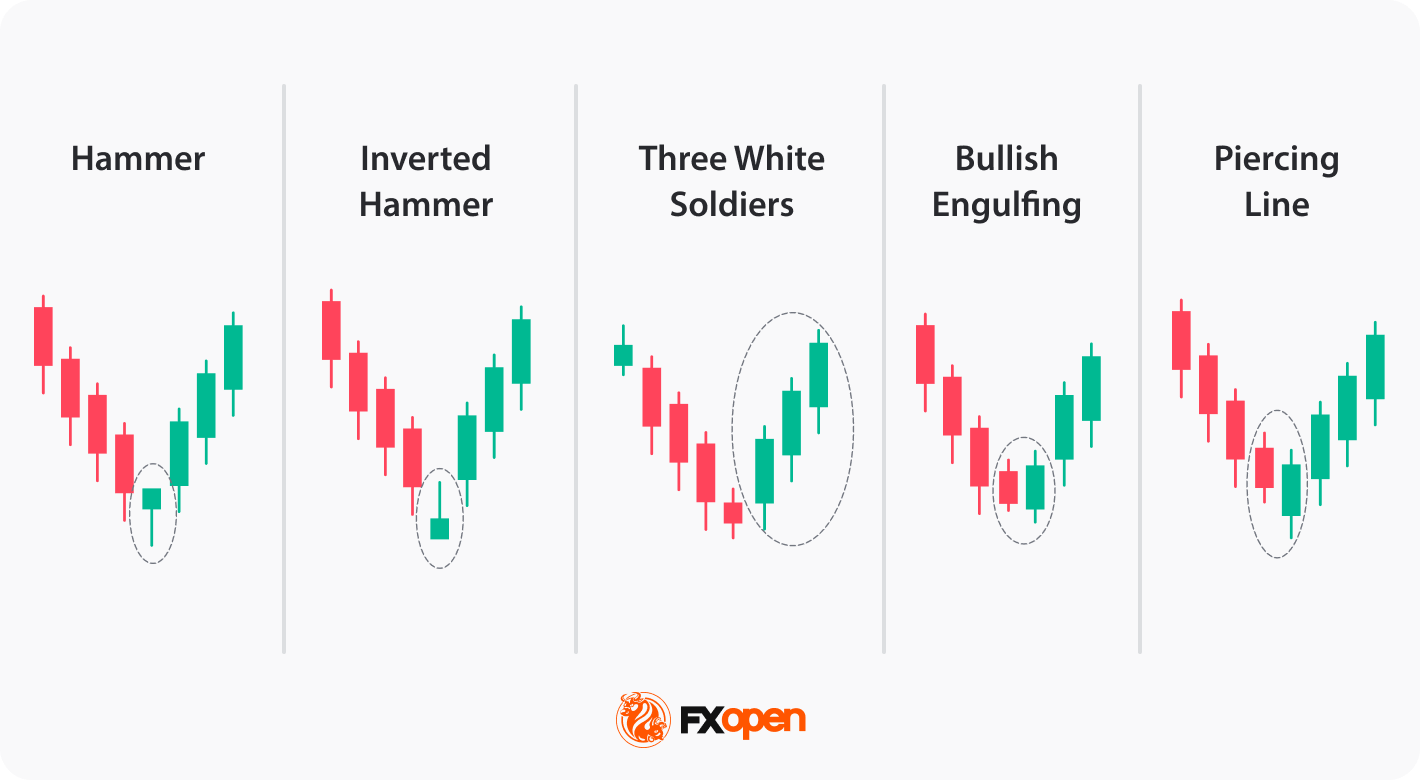
Candlestick reversal patterns are formations that signal a potential shift in price direction as an existing trend begins to lose momentum. They typically appear at the end of trends, where buying or selling pressure starts to weaken, offering traders an early indication of a possible turning point.
There are many ways to spot a trend reversal, including momentum indicators, trend-following tools, and chart and candlestick patterns. Candle patterns, in particular, have been widely used by traders for decades due to their clear structure and well-defined signals, which have been tested and applied across various financial markets.
Depending on the data source, the total number of candlestick patterns ranges from 30 to more than 100, when niche formations are included. Since it may be challenging to remember and recognise all of them, we have selected 10 of the most popular reversal candlestick patterns that traders with any level of experience can implement in their trading strategies.
Definition and Market Function
Candlestick reversal patterns are formations on a price chart that signal a potential trend change after an extended move. Each candle captures the open, high, low, and close for a set period. The shape of the formation reflects the balance between buyers and sellers at that moment.
Reversal differs from retracement. A reversal points to a change in the dominant trend. A retracement is a counter-move within a trend that quickly resumes. Context matters. A pattern carries weight when it forms at a tested support or resistance level and aligns with recent market structure. In the middle of a range, the same shape means little.
This article covers 10 reversal candlestick patterns:
Market Interpretation of Reversals
Market structure shifts when sustained move exhausts and the opposing side quietly builds conviction. The turn often shows in price action before lagging indicators like moving averages or oscillators react.
Three forces cluster around a change in market structure:
- Liquidity pools build near trend extremes, where stop orders sit above swing highs or below swing lows.
- Positioning becomes one-sided, exposing the weaker side to a squeeze.
- Volatility often expands at the turn, producing wide-range candles with long wicks.
Reading the signal requires trend context and level alignment, not shape alone.
Classification of Reversal Patterns
Candlestick reversal patterns in forex fall into three groups by candle count. Single-candle patterns form in one candle. The hammer, hanging man, inverted hammer, and shooting star belong here. Their signal rests on wick-to-body ratio and trend position.
Double-candle patterns involve two consecutive candles. Bullish engulfing, bearish engulfing, piercing line, and dark cloud cover sit in this group. The second candle is opposite and usually overwhelms the first.
Triple-candle patterns need three candles to complete. Three white soldiers and three black crows form this category. They develop slowly but show directional pressure.
Bullish Reversal Patterns
Bullish reversal patterns form at the end of downtrends. Selling momentum fades as buyers regain control.

Hammer
The hammer candlestick pattern has a small body, a lower wick at least twice the body length, and little to no upper wick. It appears at the end of a downtrend after sustained selling pressure. A close above the hammer’s high on the following candle supports the signal.
Inverted Hammer
The inverted hammer has a small body, an upper wick at least twice the body length, and little to no lower wick. It forms after a prolonged downtrend, often near a tested support zone. Traders often look for the next session to close above the candle’s body before acting.
Three White Soldiers
The three white soldiers pattern consists of three consecutive bullish candles, each opening within the prior body and closing at a new high with short upper wicks. It develops after a downtrend, typically following a stall near the low. The third candle closing above a recent resistance level adds weight to the pattern.
Bullish Engulfing
The bullish engulfing forms when a bullish candle’s body fully covers the prior bearish candle’s body. It appears at the end of a downtrend, with the bearish candle often marking the final push lower. Confirmation is found when a close is seen above the engulfing pattern, meaning the reversal likely has more weight.
Piercing Line
The piercing line pairs a long bearish candle with a bullish candle that opens below the prior low and closes above the bearish body’s midpoint. It forms at the end of a downtrend, often at a tested support zone. Another bullish candle forming after the pattern reinforces the signal.
Bearish Reversal Patterns
These bearish reversal patterns form at the end of uptrends. Buying momentum fades as sellers regain control.
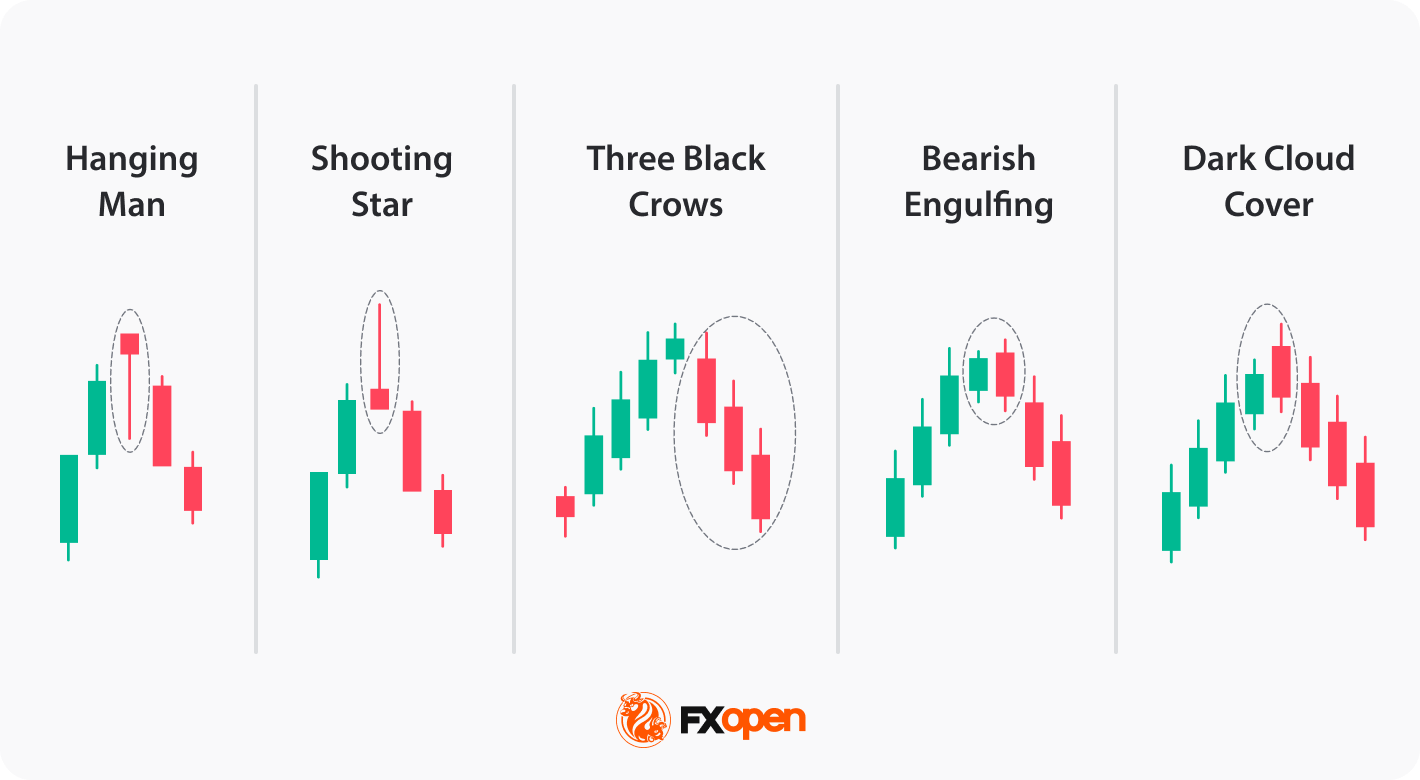
Hanging Man
The hanging man has a small body, a lower wick at least twice the body length, and little to no upper wick. This candlestick pattern structure appears at the end of an uptrend after sustained buying pressure. A close below the hanging man’s low on the following candle supports the signal.
Shooting Star
The shooting star has a small body, an upper wick at least twice the body length, and little to no lower wick. It forms after a prolonged uptrend, often near a tested resistance zone. Traders often look for the next candle to close below the candle’s body before acting.
Three Black Crows
The three black crows formation consists of three consecutive bearish candles, each opening within the prior body and closing at a new low with short lower wicks. It develops after an uptrend, typically following a stall near the high. The third candle closing below a recent support level adds weight to the pattern.
Bearish Engulfing
The bearish engulfing forms when a bearish candle’s body fully covers the prior bullish candle’s body. It appears at the end of an uptrend, with the bullish candle often marking the final push higher. A close below the engulfing candle’s low session supports the reversal.
Dark Cloud Cover
The dark cloud cover setup pairs a long bullish candle with a bearish candle that opens above the prior high and closes below the bullish body’s midpoint. It forms at the end of an uptrend, often at a tested resistance zone. Another bearish candle forming after the pattern reinforces the signal.
How Traders Identify Reversal Candles
Identifying a candlestick reversal pattern involves four observable checks. Each one either confirms or filters the signal before it carries weight.
- Trend presence: the pattern forms at the end of a clear uptrend or downtrend. Shapes that appear inside a range or consolidation carry little meaning.
- Key level alignment: the pattern aligns with a tested support or resistance zone, a prior swing point, or a known supply or demand area.
- Candle structure: wick-to-body ratios, close position, and body size match the pattern’s definition. Loose approximations dilute the signal.
- Confirmation: the next candle closes in the reversal direction, or a second pattern, indicator reading, or price-action event aligns with the signal before action.
Skipping any of the four reduces the pattern to a shape on the chart rather than a usable signal. Platforms such as TickTrader let traders explore, identify, and trade these patterns across multiple instruments.
Application in Trading Context
Candlestick reversal patterns sit inside a wider decision process rather than drive trades on their own. Position sizing, stop placement, and volatility conditions shape how traders interpret and act on any signal.
Risk context matters at the trade level. A pattern at a major resistance zone in a quiet market carries different weight than the same pattern ahead of an important economic release. Traders often scale position size based on volatility, recent range, or proximity to liquidity levels. Broader risk management frameworks often define stop placement based on the pattern’s structure rather than arbitrary price offsets.
Volatility expansion around reversal patterns cuts both ways. Wider price ranges can make candlestick patterns more visually distinct, but they also increase the likelihood of false breakouts and unreliable signals. False signals appear more often around news releases, low-liquidity hours, and transitions between major trading windows.
Limitations and Market Risks
Candlestick reversal patterns in technical analysis have consistent limitations worth naming directly.
- Low-liquidity conditions distort pattern formation. Thin order books produce wider spreads, longer wicks, and candles that look like patterns but lack the participation to drive a reversal. Exotic currency pairs during off-peak hours often show this behaviour.
- News releases override technical structure. A hammer printed seconds before a non-farm payrolls release may face volatility that ignores the pattern entirely. Scheduled events and surprise headlines both reset short-term price structure.
- Timeframe dependency shapes signal weight. The same pattern on a 1-hour chart often carries less weight than on a daily or weekly chart, where each candle represents more participation and more information.
Takeaway
Bullish vs bearish candlestick patterns are tools for identifying shifts in market direction across forex, stocks, indices, and commodities. They carry weight when structure, trend context, and key levels align.
In practice, traders treat them as early signals and rely on confirmation before acting. Combined with sound risk management, they may help refine timing.
Traders who want to test candlestick patterns and develop their own strategies can consider opening an FXOpen account today and access over 700 instruments with tight spreads and low commissions (additional fees may apply). Good luck!
FAQ
What Are Candlestick Reversal Patterns?
Candlestick reversal patterns are single candles or short sequences that form at the end of a trend and mark a potential change in market direction. They reflect a shift in the balance between buyers and sellers, visible through the candle’s open, close, high, and low. Common examples include the hammer, shooting star, engulfing patterns, and three black crows. Their weight depends on where they form, not just their shape.
Which Candlestick Patterns Signal a Reversal?
Ten patterns commonly appear in reversal analysis: hammer, hanging man, inverted hammer, shooting star, three white soldiers, three black crows, bullish engulfing, bearish engulfing, piercing line, and dark cloud cover. Each pattern carries weight only when it appears at a tested level in a clear trend.
What Is the Difference Between Bullish and Bearish Reversal Patterns?
Bullish reversal patterns form at the end of a downtrend and point to a potential move higher. Hammer, inverted hammer, bullish engulfing, three white soldiers, and piercing line sit in this group. Bearish reversal patterns form at the end of an uptrend and point to a potential move lower. Hanging man, shooting star, bearish engulfing, three black crows, and dark cloud cover belong here. Shapes often mirror across the pair.
Do Candlestick Reversal Patterns Require Confirmation?
Confirmation matters when trading candlestick patterns. A pattern on its own shows a shift in the last candle or two, but not whether the broader trend has turned. Traders often wait for the next candle to close in the reversal direction, or for a second signal from price action, a technical indicator, or a break of a key level. Patterns that form without confirmation produce more false signals, especially in low-liquidity or high-news conditions.
Are Reversal Patterns Popular in Forex Trading?
In forex, reversal signals are widely used, and for reasons tied to the market’s structure. Forex runs 24 hours on weekdays across overlapping sessions, producing clear trending and reversal behaviour around liquidity transitions. The patterns work across major, minor, and exotic pairs, and across all timeframes from intraday to weekly. Traders often combine them with support and resistance zones, moving averages, or momentum readings to filter signals.
This article represents the opinion of the Companies operating under the FXOpen brand only. It is not to be construed as an offer, solicitation, or recommendation with respect to products and services provided by the Companies operating under the FXOpen brand, nor is it to be considered financial advice.

XRP (XRP) price is setting up for an 18.81% breakdown on the 8-hour chart, but weakening sell-side volume and steady ETF inflows are delaying the move.
The signal comes from a hidden bearish divergence that flashed during the bearish pattern formation, now compounded by long-term holder capitulation. However, a mismatch between retail holders and institutional buyers is keeping the price propped up near key resistance.
Hidden Bearish Divergence Sets the Stage for Downtrend Resumption
XRP (XRP) price traded at $1.41 on April 23, slightly down on the 8-hour timeframe and broadly flat across weekly and monthly windows. The shorter timeframe reveals what the longer ones mask.
Between March 23 and April 22, price made a minor lower high while the Relative Strength Index (RSI), a momentum indicator, which made a higher high. In a broader downtrend, this setup is a hidden bearish divergence. It signals that the corrective bounce is losing momentum even as price pushes higher, suggesting the downtrend is set to resume.
The divergence appeared as XRP sits inside a head-and-shoulders structure, a bearish reversal pattern. The right shoulder topped on April 17. However, the timing of the breakdown depends on whether the selling pressure has enough strength to drive the move immediately, which the next chart addresses.
Sell-side pressure has been fading exactly when the bearish structure needs it most. Between April 12 and April 23, the red volume bars on the 8-hour chart trended lower as XRP price trended higher.
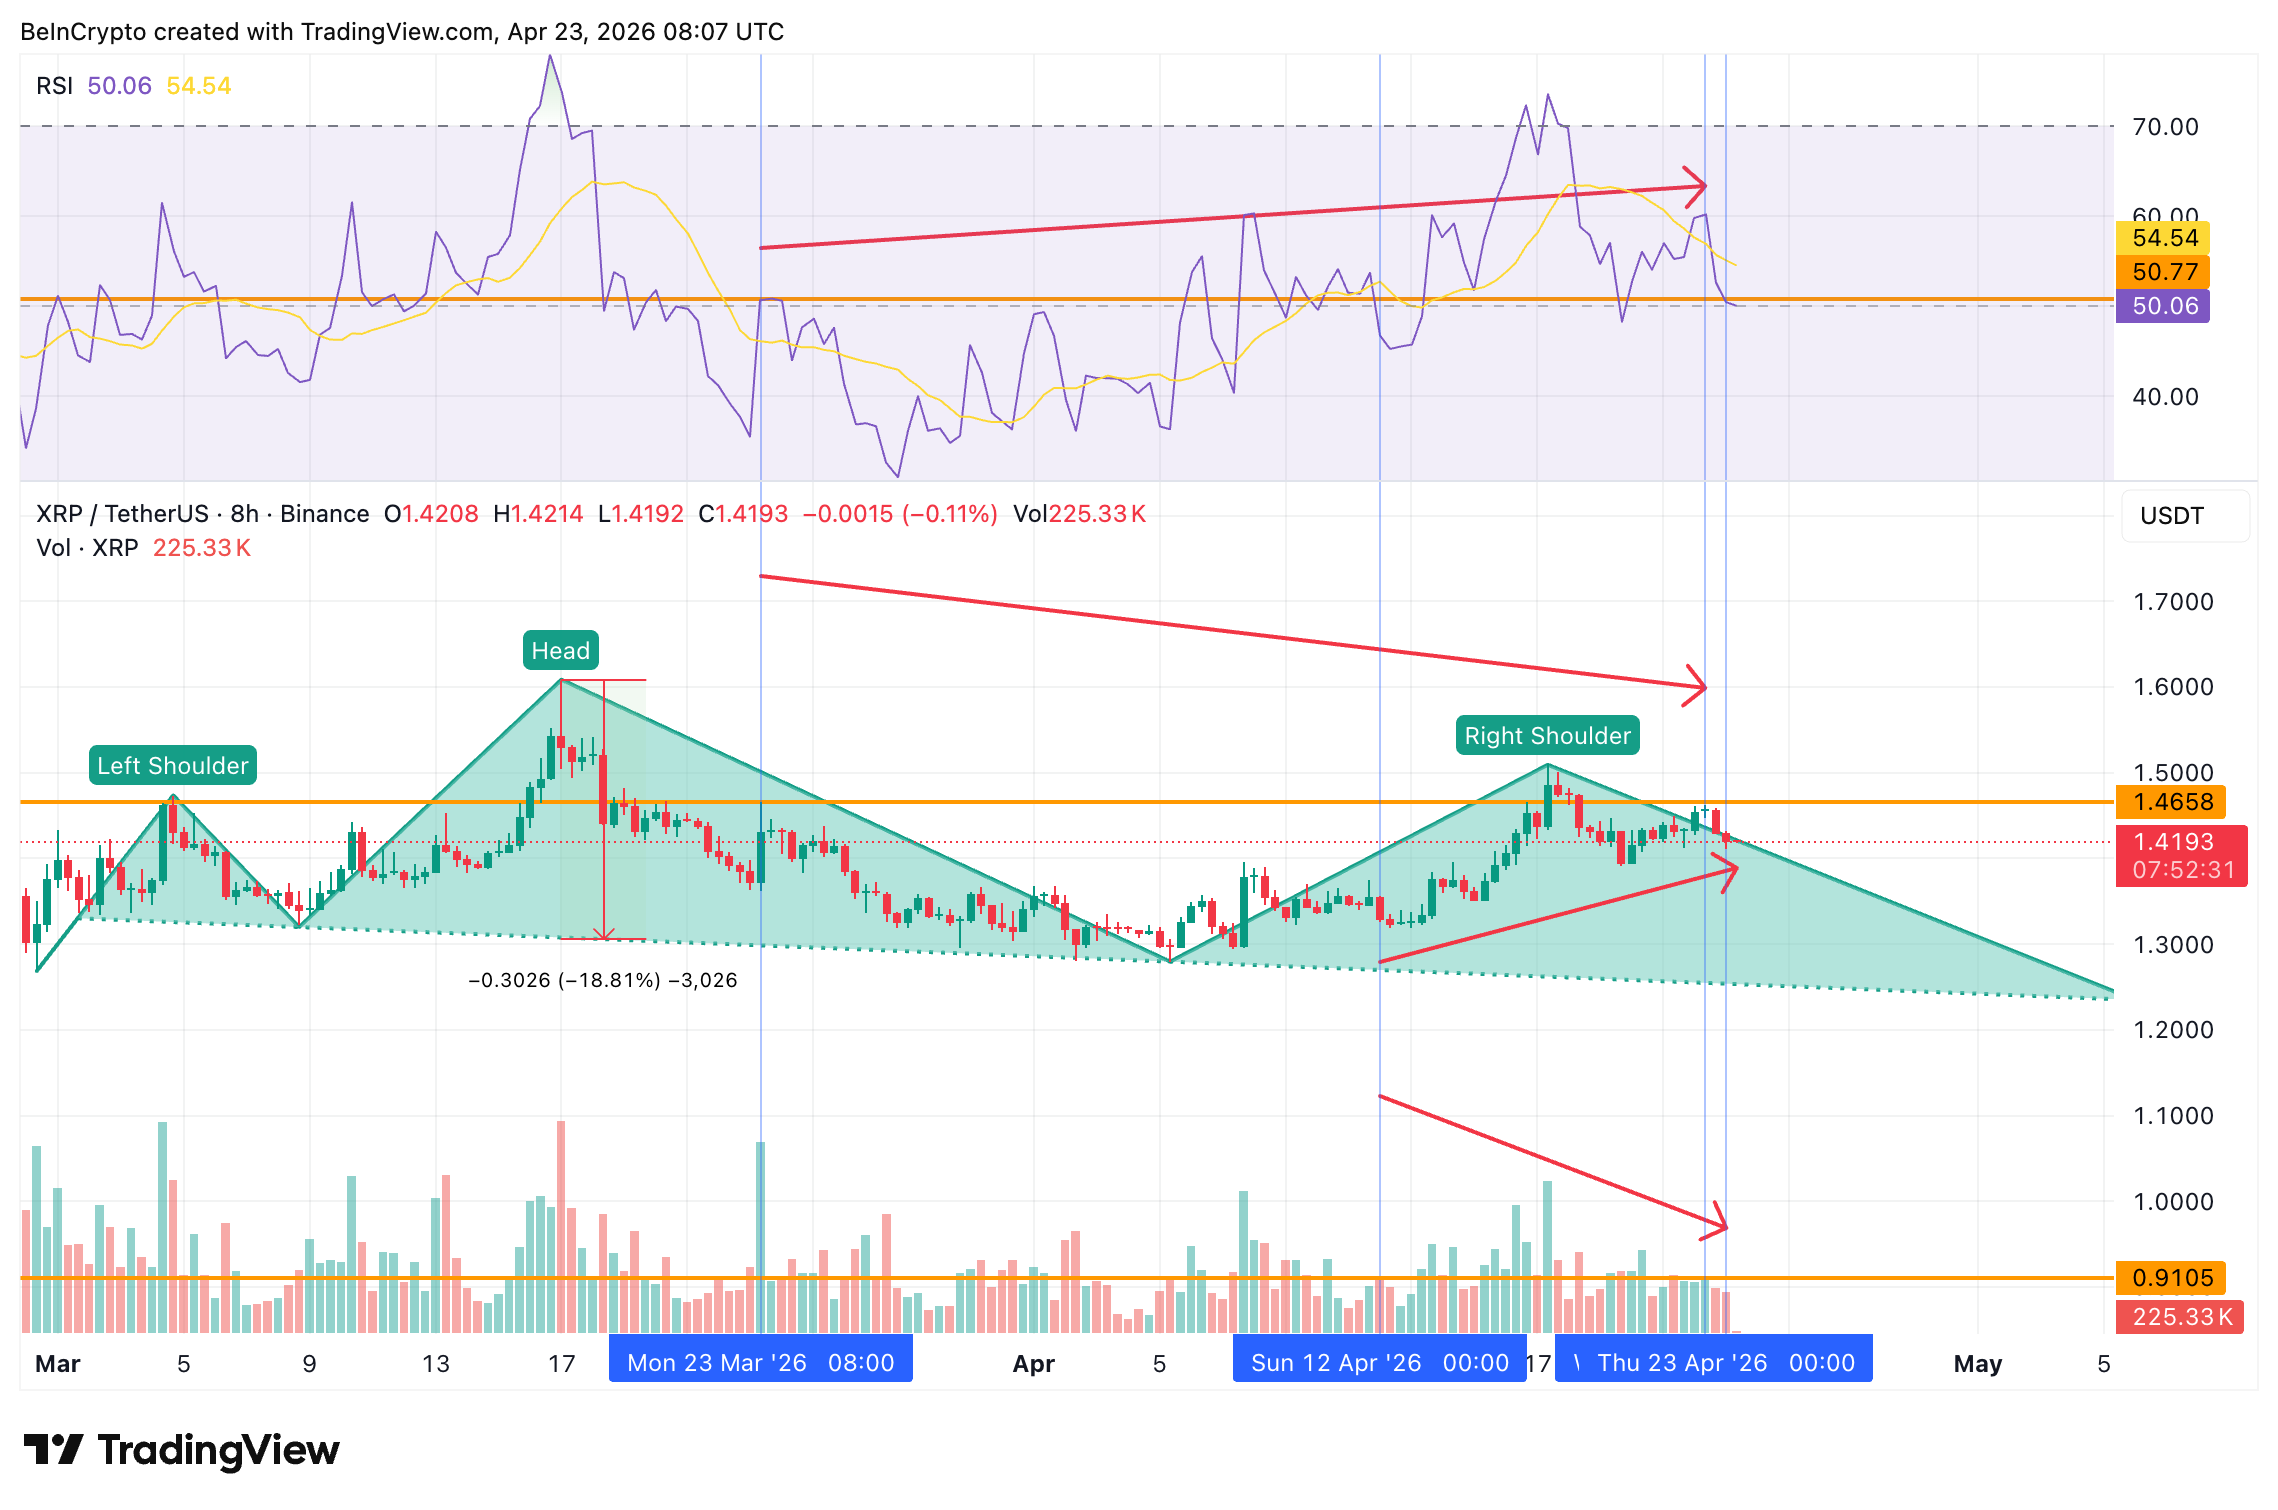
The fading XRP volume on the sell side shows the pullback could be running out of steam yet. The implication is a delayed breakdown rather than an invalidated one. The pattern stays intact, but the 18.81% measured move will have to wait for sell pressure to re-accelerate.
This creates a near-term stalemate. The structural case and momentum divergence both say breakdown, but the volume tape says not right now. Whether hodler and institutional flows confirm or override the volume signal determines the next move.
Long-Term Hodlers Capitulate as ETFs Keep Buying
On-chain data shows a split between XRP hodlers and institutional buyers. According to Glassnode, the hodler net position change sat at 260,176,113 XRP on April 12. By April 22, it had dropped to 149,050,480 XRP. That is a decline of roughly 42.7% in ten days, reflecting long-term holders (155 days or more) trimming positions.
Want more token insights like this? Sign up for Editor Harsh Notariya’s Daily Crypto Newsletter here.
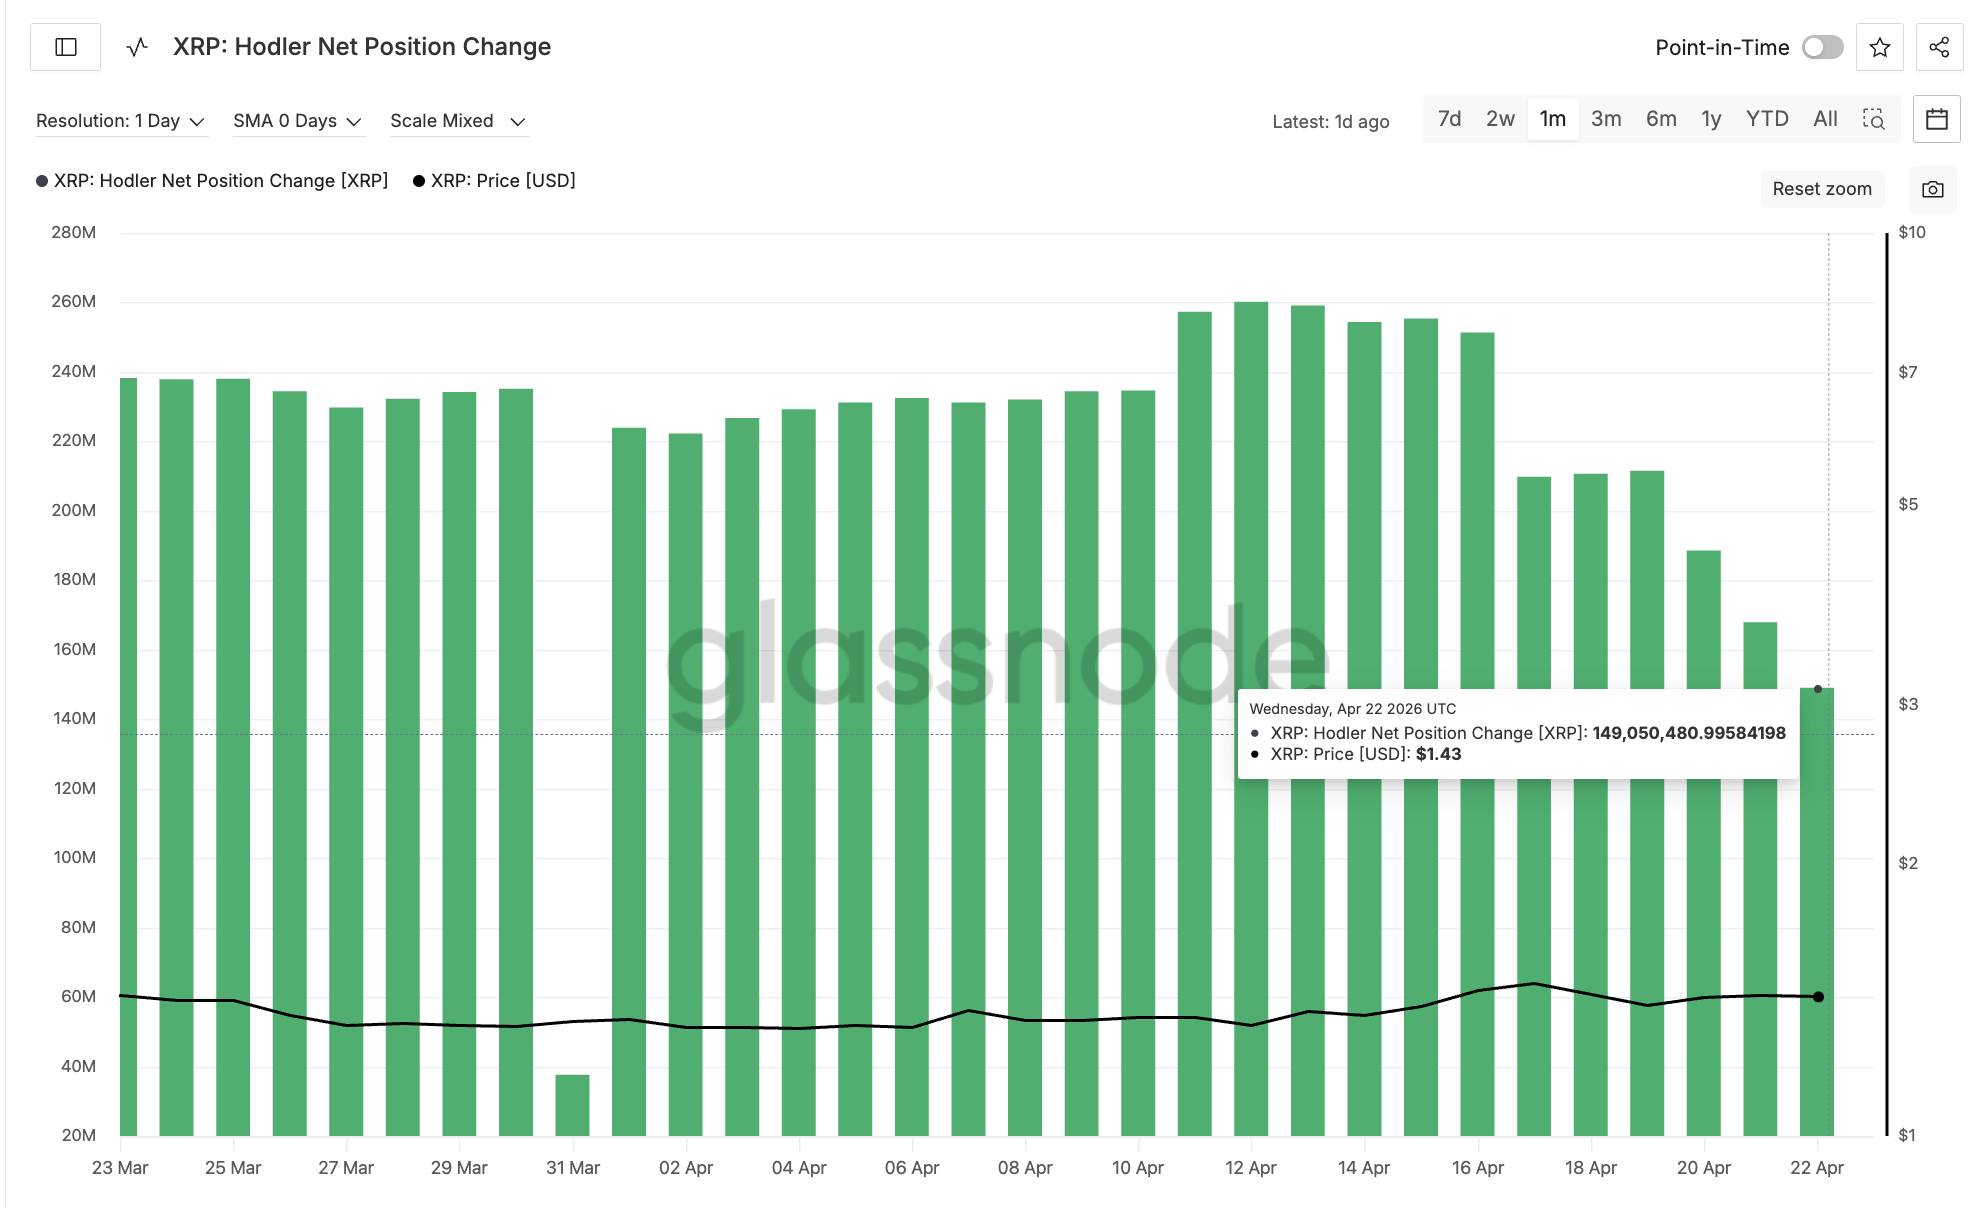
The hodler distribution started before the right shoulder formed on April 17. The timing suggests long-term holders were already losing confidence in the bounce.
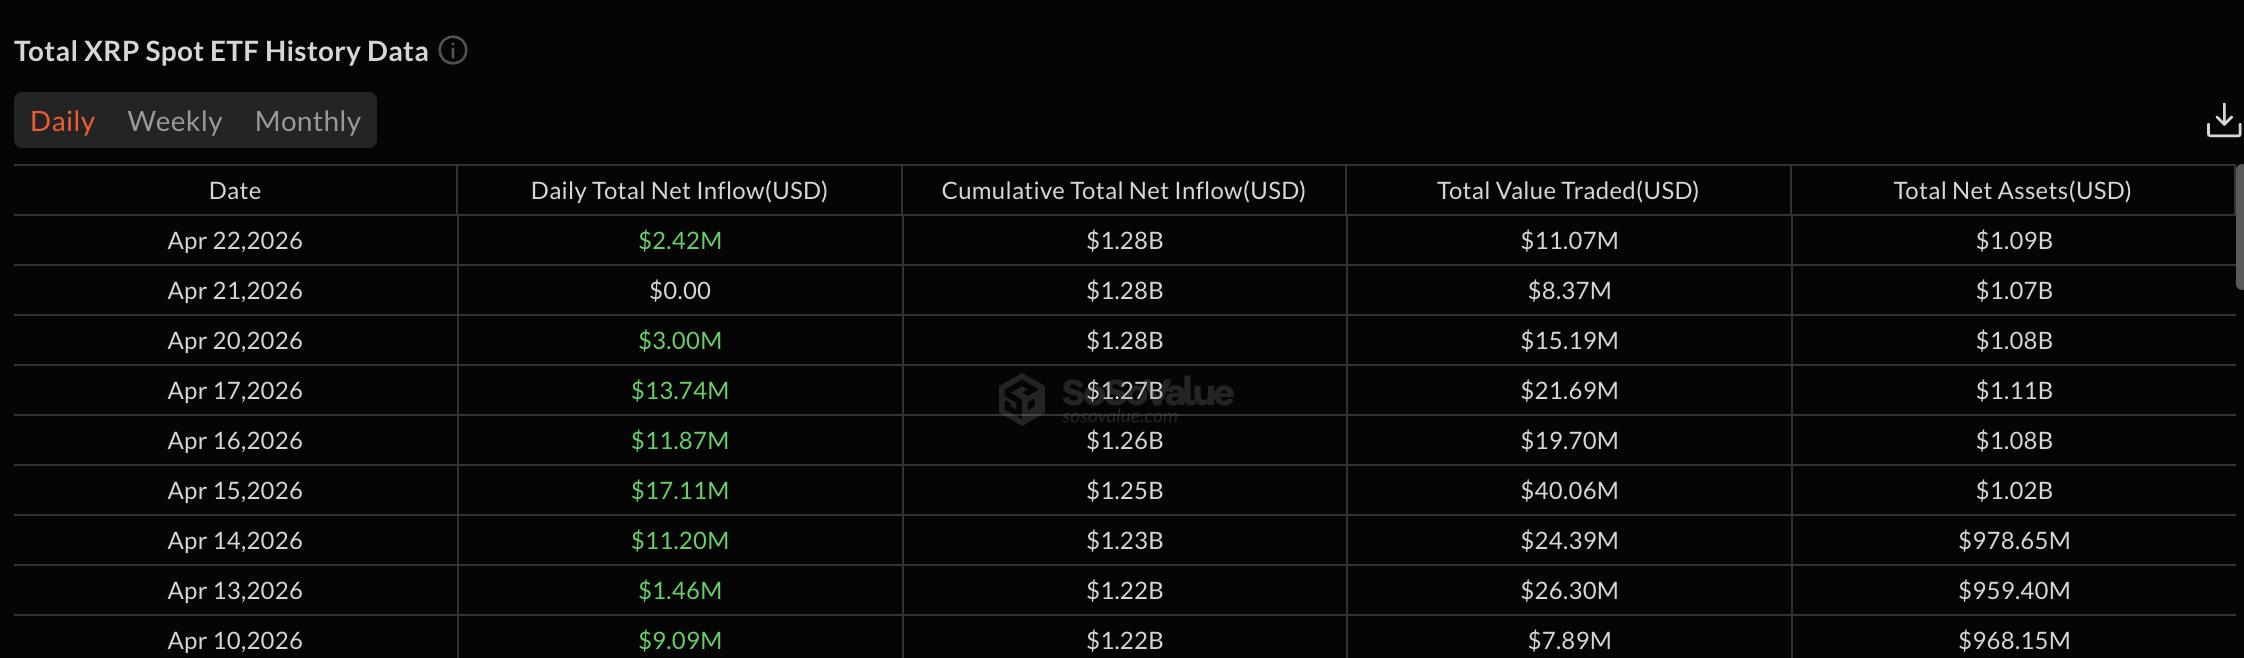
However, institutional buyers saw it differently. US spot XRP ETF products have logged net inflows on 8 of the last 9 trading days, a run that spans nearly two weeks since April 10.
The only exception was a flat session on April 21 with zero net flow, meaning there were no outflows during the entire window. The data suggests steady accumulation through the same period hodlers were distributing. April 17 alone saw $13.74 million in inflows, followed by $3 million on April 20 and $2.42 million on April 22.
The disjoint matters. Retail long-term holders are betting on the pattern breakdown, while institutional flow is betting the bounce extends. The XRP price chart will eventually vindicate one side over the other.
XRP Price Levels That Resolve the Tension
The XRP price chart lays out the full decision zone. XRP has already lost the 0.236 Fibonacci level at $1.43, which served as the immediate bounce cap. Below it, the 0.382 Fib at $1.38 and the 0.5 Fib at $1.34 are the first downside tests.
The key decision level sits at $1.30, the 0.618 Fib. A daily close below this level clears the path toward $1.25 (0.786 Fib) and triggers the measured move projection. The measured move from the right shoulder points to $1.18 initially, with extension to $1.01, representing an 18.81% decline from the breakdown point.
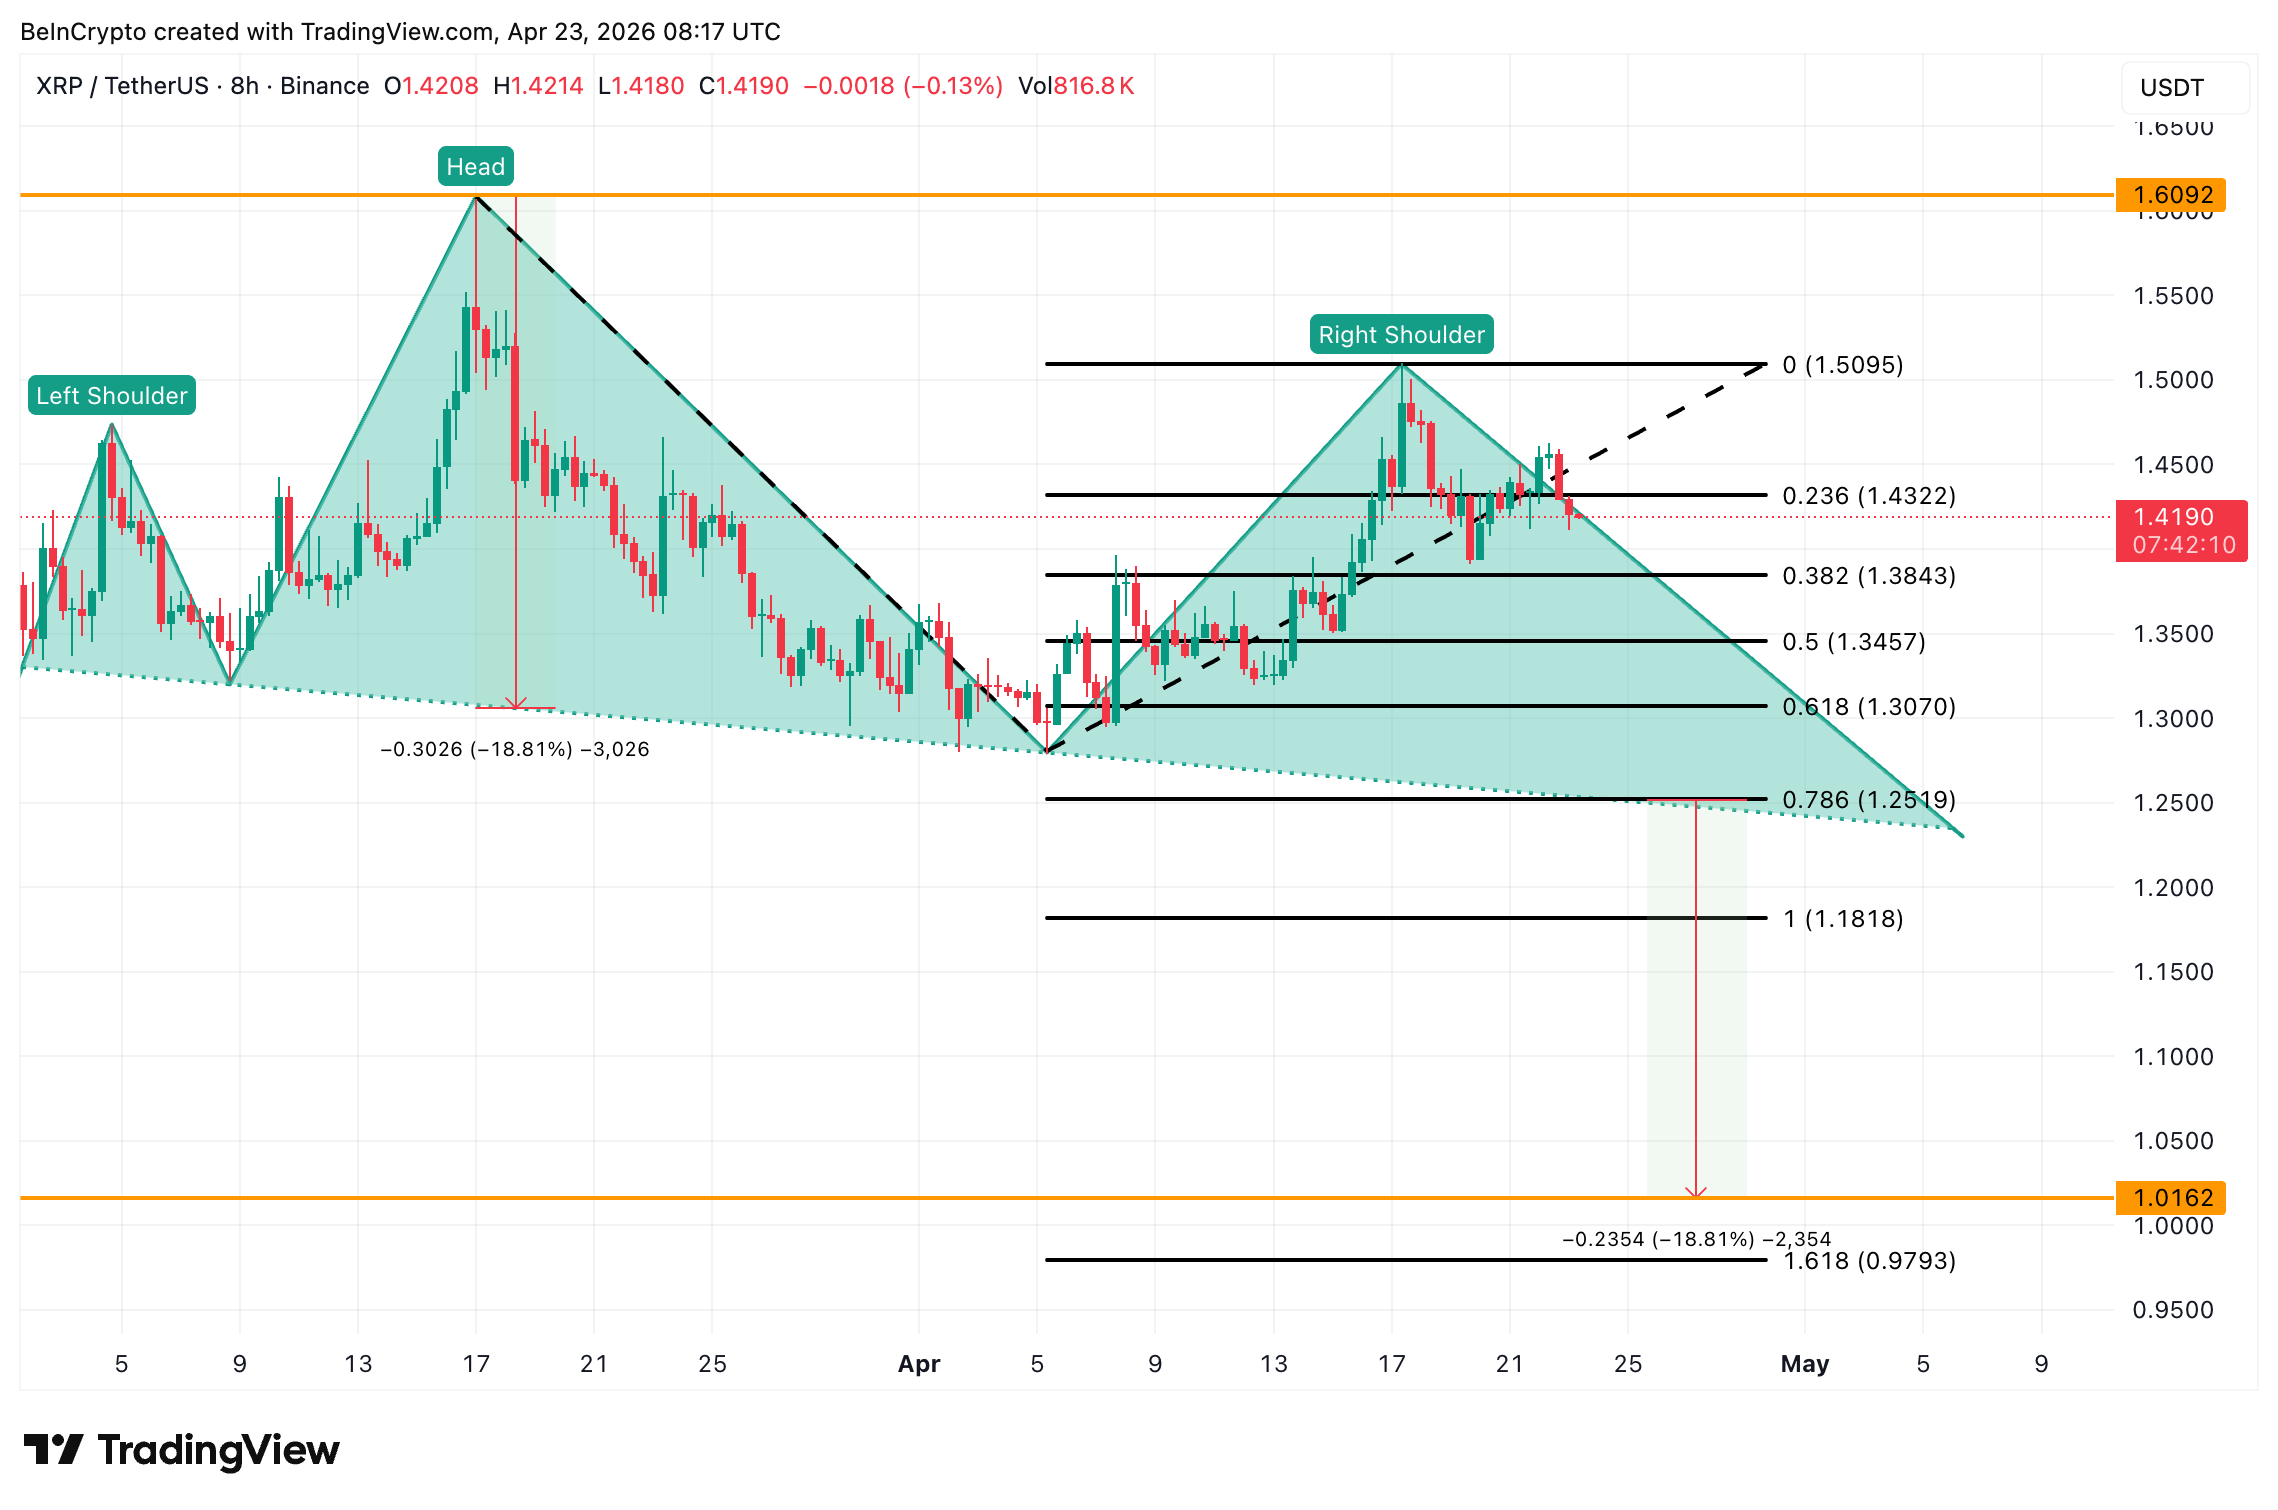
For invalidation, XRP needs to reclaim the right shoulder cap at $1.50 on the 8-hour close. A move above $1.60, the head peak, would fully invalidate the bearish structure and align with the ETF thesis.
The $1.30 level separates a shallow pullback supported by fading sell pressure and ETF demand from a deeper 18.81% flush toward $1.01 if hodler capitulation spreads.
The post Can 2 Weeks of XRP ETF Buying Delay the 18% Price Breakdown? appeared first on BeInCrypto.
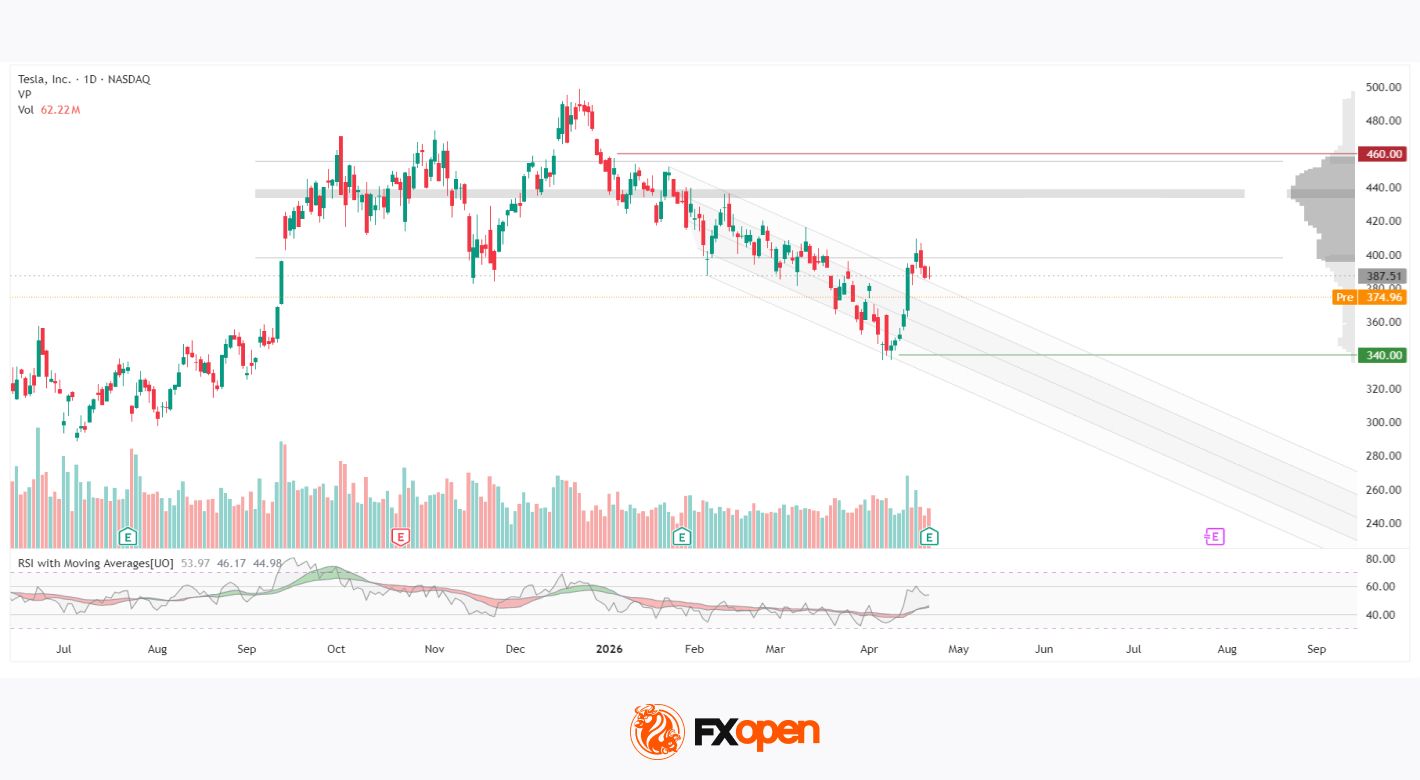
On 22 April, Tesla released its Q1 2026 results: adjusted earnings per share came in at $0.41 versus expectations of $0.37, but revenue of $22.39 billion fell short of the $22.64 billion forecast. The automotive segment continues to lose ground under pressure from competitors, particularly China’s BYD and Xiaomi. Additional concern came from the energy storage division, where deployments dropped 38% compared to the record fourth quarter of 2025 — a segment that had recently been seen as a key growth driver.
Management continues to pin its long-term growth strategy on robotaxis and autonomous driving.
Technical picture

On the daily chart, TSLA has been trading within a sustained downward channel since peaking near $500 in December. In early April, the price reached the $340 level, which coincided with the lower boundary of the channel — the confluence of these levels strengthened buyer reaction. In recent sessions, the price has moved above the upper boundary of the channel, though the breakout has yet to be confirmed by a sustained close, and the earnings release has not clarified the near-term trend. Nevertheless, the move itself is noteworthy.
The horizontal volume profile spans the $398–455 range, with the Point of Control concentrated around $433–440 — an area of high liquidity that now represents the nearest resistance. The RSI with moving averages shows readings of 53 / 46 / 44: the indicator has crossed above the neutral 50 level, while both moving averages remain below it, suggesting that a sustained bullish impulse has yet to be confirmed.
Summary
The earnings report delivered mixed signals to the market: the earnings beat was not sufficient to offset weaker revenue and a sharp decline in the energy segment. From a technical perspective, the key question is whether the price can hold above the upper boundary of the channel — an unconfirmed breakout can easily turn false, particularly with a dense volume zone overhead.
Buy and sell stocks of the world’s biggest publicly-listed companies with CFDs on FXOpen’s trading platform. Open your FXOpen account now or learn more about trading share CFDs with FXOpen.
This article represents the opinion of the Companies operating under the FXOpen brand only. It is not to be construed as an offer, solicitation, or recommendation with respect to products and services provided by the Companies operating under the FXOpen brand, nor is it to be considered financial advice.
Nearly 300 workers made redundant after Welsh furniture firm collapses into administration

Reppo lands $20m bet on using prediction markets to fix AI’s data problem

Kelly Dodd Slams Caroline Manzo Sexual Assault Claim
Manchester United reach agreement with Casemiro over contract clause amid transfer speculation

Steven Gerrard disagrees with Gary Neville over ‘shock’ Chelsea and Arsenal claim | Football

US brings back mandatory military draft registration


-

 Sports6 days ago
NWFL Suspends Two Players Over Post-Match Clash in Ado-Ekiti
-

 Fashion6 days ago
Weekend Open Thread: Theodora Dress
-

 Politics6 days ago
Palestine barred from entering Canada for FIFA Congress
-
Entertainment4 days ago
NBA Analyst Charles Barkley Chimes in on Ice Spice McDonald’s Fiasco
-

 Business4 days ago
Powerball Result April 18, 2026: No Jackpot Winner in Powerball Draw: $75 Million Rolls Over
-

 Tech5 days ago
Auto Enthusiast Scores Running Tesla Model 3 for Two Grand and Turns It Into Bare-Bones Go-Kart
-

 Politics4 days ago
Zack Polanski demands ‘council homes not luxury flats for foreign investors’
-

 Crypto World6 days ago
Russia Pushes Bill to Criminalize Unregistered Crypto Services
-

 Politics3 days ago
Gary Stevenson delivers timely reminder to register to vote as deadline TODAY
-

 Business1 day ago
Rolls-Royce Voted UK’s Most Iconic Trade Mark as IPO Register Hits 150
-

 Politics23 hours ago
Disabled people challenge government SEND proposals over segregation concerns
-

 Politics23 hours ago
Making troops accountable for war crimes threatens US alliance, ex-SAS colonel warns
-
 Business7 days ago
Creo Medical agree sale of its manufacturing operation
-

 Crypto World6 days ago
Russia Introduces Bill To Criminalize Unregistered Crypto Services
-

 Politics24 hours ago
Starmer handler McSweeney to be dragged from shadows by Foreign Affairs Committee
-

 Politics24 hours ago
Zack Polanski responds to home secretary’s taser threat
-
Politics1 day ago
Wings Over Scotland | How To Get Away With Crimes
-
 Crypto World5 days ago
Kelp DAO rsETH Bridge Hack Drains $292M as DeFi Losses Top $600M in Two Weeks
-

 Politics21 hours ago
‘Iran is still a nuclear threat’
-

 Crypto World2 days ago
New York sues Coinbase, Gemini over prediction market offerings
You must be logged in to post a comment Login