
Crypto World
Large and small holders are selling, but BTC remains resilient
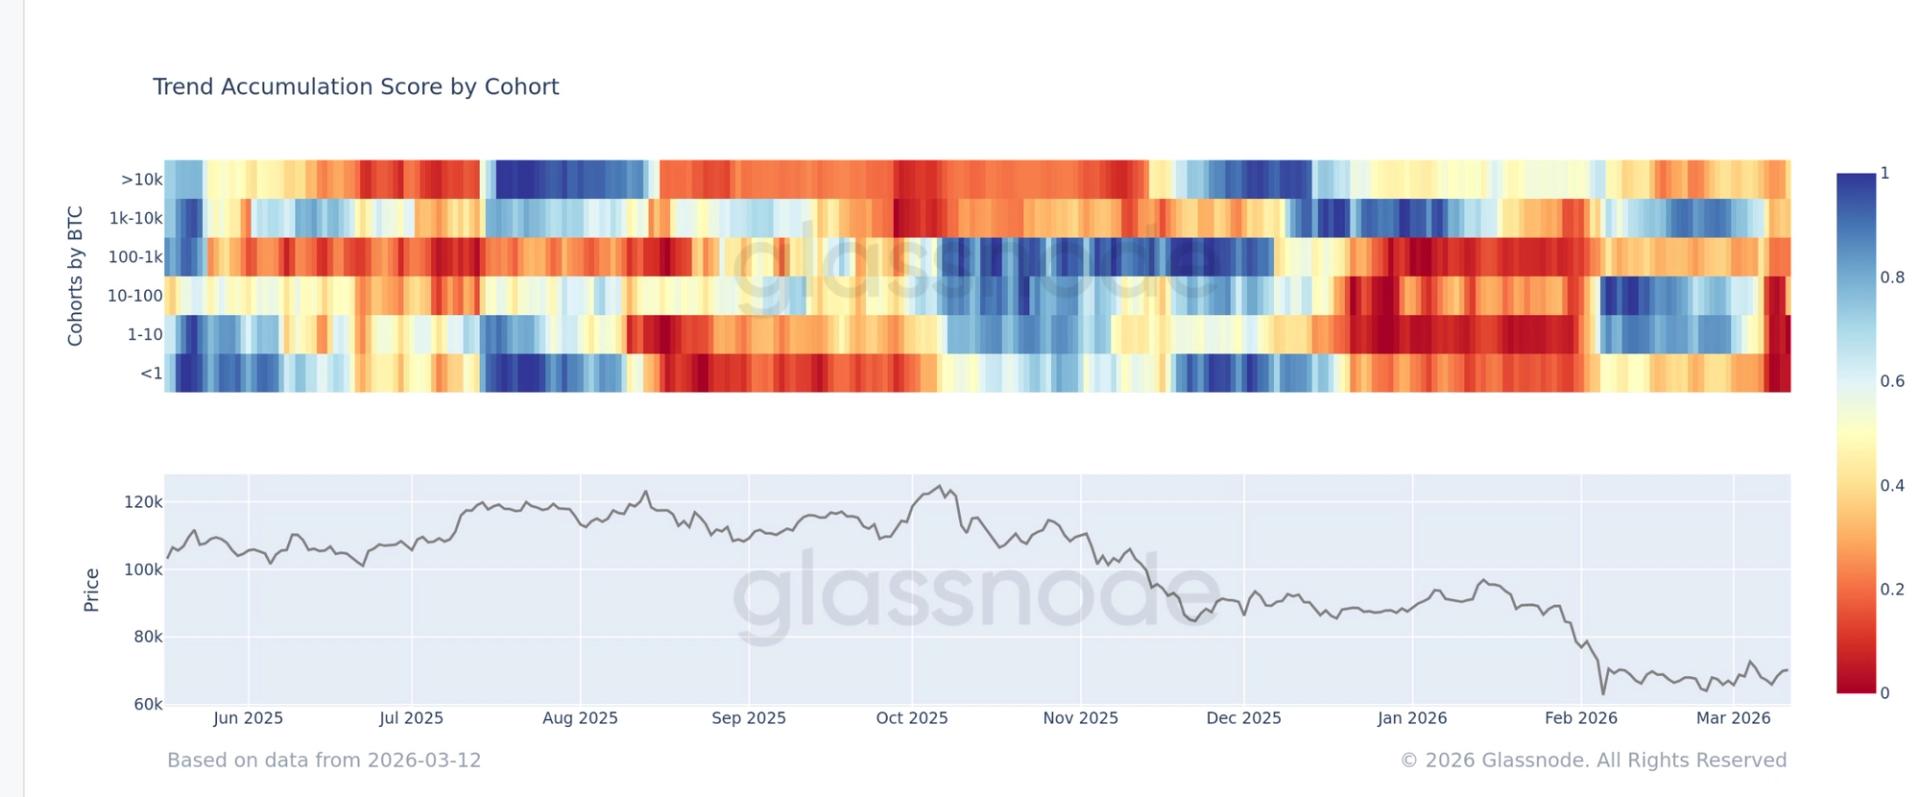

On-chain data from Glassnode shows that bitcoin holders across nearly all wallet cohorts have shifted back to aggressive selling amid persistent geopolitical tensions in the Middle East.
The distribution is being led primarily by retail investors, who appear to be the main source of selling pressure.
Glassnode’s Accumulation Trend Score, which measures whether different wallet groups are buying or selling, has dropped to around 0.04, signalling deep net distribution across the network.
The metric evaluates both the size of entities and the amount of bitcoin they have accumulated over the past 15 days.
The breakdown shows that smaller holders are leading the distribution. Wallets holding 1 to 10 BTC, typically associated with retail investors, are in heavy selling mode.
Entities holding 10 to 100 BTC are also distributing at a significant pace. Even larger participants are not immune to the trend. Wallets holding 1,000 BTC or more are also net sellers, though the intensity of their selling is less severe than that seen among smaller cohorts.
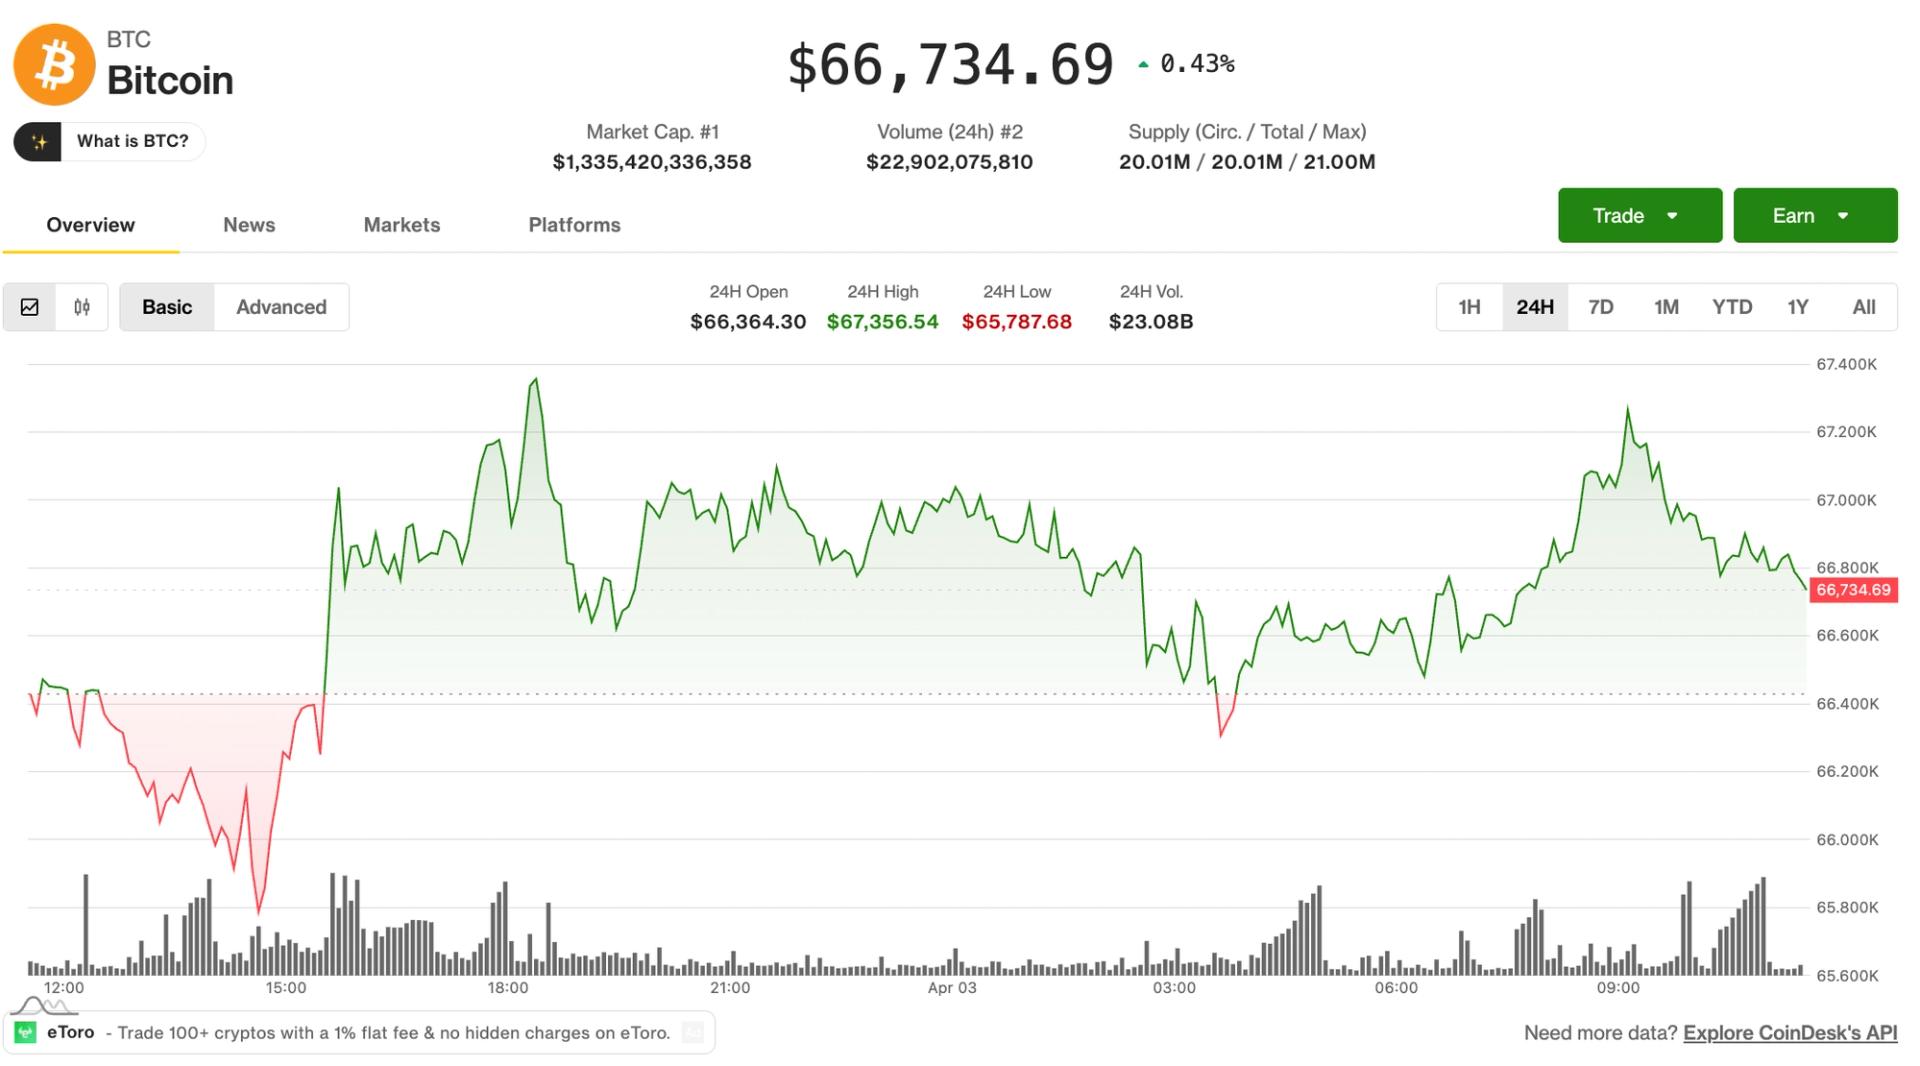
Despite the broad-based distribution, bitcoin continues to demonstrate relative resilience compared with traditional macro assets.
The U.S. dollar index has risen above 99.5, the U.S. 10-year Treasury yield has climbed to a one-month high above 4.2%, and brent crude oil is trading around $100. Typically, stronger yields, a firmer dollar and higher oil prices create significant headwinds for risk assets. Bitcoin’s ability to hold near $70,000 suggests underlying demand remains intact even as on-chain data shows investors bailing in the short term.

Crypto World
Google unveils Gemma 4 as its most advanced open AI model for reasoning and agentic tasks


Google has introduced Gemma 4, its latest open artificial intelligence model family focused on advanced reasoning and agent-style workflows.
Summary
- Google launches Gemma 4, its latest open AI model family focused on advanced reasoning and agent-style workflows.
- The model is available in four sizes, ranging from edge-device variants to high-performance systems, and supports over 140 languages.
- Gemma 4 introduces features such as multi-step reasoning, agent tools, and offline code generation, with models accessible via AI Studio and Edge Gallery.
In an April 2 post on X, Demis Hassabis, chief executive of Google DeepMind, announced the launch of Gemma 4, its latest open artificial intelligence model family focused on advanced reasoning and agentic workflows.
Open models are designed to be modified and adapted by developers, allowing them to tailor systems for specific use cases.
The release comes amid strong uptake of the Gemma ecosystem. Since the first version launched, developers have recorded over 400 million downloads and created more than 100,000 variants, according to Google.
Hassabis said Gemma 4 is available in four sizes, each suited to different workloads and hardware setups, and can be fine-tuned for specialised tasks.
The largest version, 31B, is a dense model built for “great raw performance,” prioritising accuracy and depth of output, though it requires high-end computing resources.
Alongside it is the 26B Mixture of Experts (MoE) model, which is designed for lower latency. It activates fewer parameters during inference, allowing faster responses and improved efficiency, albeit with some trade-offs in output quality.
For lighter use cases, Google has introduced the 2B and 4B models. These are optimised for edge devices such as smartphones and compact systems, enabling on-device execution with lower computational demands.
What can you do with Google Gemma 4?
Gemma 4 introduces improved reasoning capabilities, allowing it to handle tasks that require multi-step logic and structured problem-solving. It has also shown stronger performance in benchmarks tied to mathematics and instruction-following.
The models support agent-style workflows through native function calling, structured JSON outputs, and system-level instructions. These features allow developers to build autonomous systems that can interact with APIs, tools, and external services. Gemma 4 also enables high-quality offline code generation, turning local machines into AI coding assistants.
Another key feature is its expanded context window. The edge models support up to 128K tokens, while the larger variants extend this to 256K tokens, allowing the processing of long documents or codebases in a single prompt. The models are trained across more than 140 languages, which allows for global deployment.
Sundar Pichai reposted the announcement, saying Gemma 4 is “packing an incredible amount of intelligence per parameter.”
The models are built to run across a vast range of hardware, from smartphones and laptops to GPUs and developer workstations, with smaller variants capable of running locally without constant internet access.
Developers can start testing Gemma 4 across multiple platforms, with the 31B and 26B MoE models available on Google AI Studio for higher-performance use cases, while the smaller E2B and E4B variants are accessible through Google AI Edge Gallery for on-device and lightweight applications.
Disclosure: This article does not represent investment advice. The content and materials featured on this page are for educational purposes only.

TLDR
-
Google debuts Gemma 4 featuring enhanced reasoning capabilities and autonomous agent frameworks
-
Four distinct model configurations serve mobile devices, edge computing, and enterprise infrastructure
-
Gemma 4 delivers powerful AI performance with reduced computational overhead
-
Supports extended context processing, programming tasks, and multilingual applications
-
Apache 2.0 open licensing encourages widespread developer integration and customization
Google has officially released Gemma 4, advancing its portfolio of open-source AI models with enhanced reasoning abilities and autonomous agent functionality. This latest generation delivers scalable architectures supporting sophisticated workflows and versatile hardware deployment. Gemma 4 emerges as an adaptable platform for developers pursuing robust performance while minimizing computational demands.
Gemma 4 Advances Open-Source AI Innovation
Gemma 4 represents the evolution of Google’s previous open model initiatives, responding to increasing market demand for adaptable AI frameworks. This launch arrives following substantial adoption momentum, with download counts exceeding 400 million worldwide. The developer community has produced over 100,000 customized implementations across the expanding platform.
This model generation comprises four distinct configurations tailored for diverse operational requirements and infrastructure platforms. Options span from compact edge-optimized versions to robust high-capacity architectures for intensive computational workloads. Consequently, Gemma 4 accommodates smartphone implementations alongside large-scale enterprise operations.
Demis Hassabis validated this release as a component of Google’s comprehensive initiative toward democratized AI advancement. The company pursues equilibrium between computational power and operational efficiency across heterogeneous hardware configurations. Gemma 4 reinforces Google’s commitment to transparent AI ecosystem development.
Gemma 4 introduces refined reasoning mechanisms and systematic problem-resolution across numerous evaluation metrics. The system processes sequential analytical tasks with heightened precision and dependable results. These models execute instruction-based operations with superior consistency.
The architecture incorporates autonomous agent frameworks via built-in function invocation and formatted response generation. These capabilities facilitate automated engagement with application programming interfaces and third-party utilities. Developers construct self-directed systems exhibiting more reliable operational patterns.
Gemma 4 additionally enhances programming generation features for disconnected operating environments. This enables standalone computing systems to function as self-contained AI assistants. Developers maintain comprehensive deployment authority independent of cloud-based resources.
Tiered Architecture Addresses Varied Infrastructure Requirements
Gemma 4 features a 31B dense architecture optimized for premium output quality and comprehensive analytical operations. This configuration demands substantial computing infrastructure but produces exceptional results. The version targets research initiatives and corporate-level implementations.
The 26B Mixture of Experts variant emphasizes processing velocity and resource optimization. It engages selective parameter sets during operational cycles to minimize response delays. Consequently, developers obtain accelerated results with streamlined resource allocation.
Gemma 4 additionally delivers compact 2B and 4B configurations designed for edge computing devices. These editions execute effectively on mobile hardware and condensed systems. Users implement AI functionality locally without persistent network connectivity.
The architectures accommodate expanded context processing capabilities for analyzing extensive documentation and software repositories. Compact configurations manage contexts reaching 128K tokens, whereas larger variants process up to 256K tokens. Gemma 4 facilitates comprehensive application scenarios across multiple sectors.
Gemma 4 provides compatibility with more than 140 languages, enabling worldwide implementation across varied geographical markets. This multilingual functionality improves accessibility and practical utility. Developers construct applications serving international user populations.
The models function across platforms encompassing mobile devices, graphics processing units, and development workstations. Google additionally facilitates integration with prominent AI engineering frameworks. Consequently, Gemma 4 delivers versatility for both experimental prototyping and operational deployment.
Open Licensing Framework Accelerates Platform Adoption
Gemma 4 operates under Apache 2.0 licensing, permitting commercial application and research utilization without significant limitations. This framework encourages collaborative advancement and transparent development practices. Developers obtain complete authority over modification and implementation strategies.
The launch corresponds with Google’s strategic vision to broaden its AI ecosystem alongside proprietary platform offerings. It supplements existing infrastructure while enabling local and offline operational modes. Gemma 4 connects open-source and proprietary AI architectures.
Developers acquire access to Gemma 4 through diverse platforms including cloud infrastructure and local computing environments. The models accommodate specialized training for particular applications and industry verticals. Organizations therefore customize AI implementations to precise operational specifications.
Google persistently establishes Gemma 4 as a pragmatic and expandable AI platform. Strategic emphasis centers on efficiency, analytical capabilities, and practical implementation. Gemma 4 elevates the significance of open-source models throughout contemporary AI advancement.

Crypto World
Post-Quantum Cryptography Threat Divides Blockchain Networks as Google Paper Reshapes Timeline
TLDR:
- Google’s latest paper slashes the qubit threshold to break elliptic curve cryptography below 500,000.
- Ethereum targets full post-quantum deployment by 2029 with live testnets and ten active client teams.
- Bitcoin holds an estimated 5–15% quantum-vulnerable supply, including roughly one million Satoshi-era coins.
- Jefferies removed Bitcoin from model portfolios, flagging quantum vulnerability as a material investor risk.
Post-quantum cryptography has become a pressing concern for major blockchain networks worldwide. On March 30, Google Quantum AI published research showing that quantum computers could break Bitcoin and Ethereum’s cryptographic protections with far fewer resources than previously estimated.
A companion paper by Oratomic, a Caltech and Harvard startup, suggested neutral-atom quantum computers could achieve this with just 10,000 qubits. Earlier estimates had placed that threshold at one million qubits or more.
Ethereum Builds the Most Advanced Post-Quantum Cryptography Roadmap Among Major Blockchains
All major blockchains currently rely on elliptic curve cryptography to secure transactions. Shor’s algorithm allows quantum computers to reverse this process and expose private keys quickly. The qubit threshold to break elliptic curve cryptography dropped from 9 million in 2023 to under 500,000 today.
Ethereum Foundation researcher Justin Drake co-authored the Google paper and leads post-quantum research efforts. He estimates at least a 10% chance of a cryptographically relevant quantum computer emerging by 2032.
Google, meanwhile, has set a 2029 internal deadline to migrate its own infrastructure to post-quantum cryptography.
Ethereum’s post-quantum effort stands as the most advanced among major blockchains today. The Foundation began funding hash-based cryptography research in 2018 with a $5 million grant.
The network now has a public roadmap targeting full deployment by 2029, live test networks with around ten client teams, and a $1 million cryptographic bounty program.
Drake described the 2029 target as “realistic/conservative” and pointed to the 2022 Merge as evidence of execution capacity.
That upgrade transitioned Ethereum from proof-of-work to proof-of-stake on a live multi-hundred-billion-dollar network without disruption.
Signature aggregation technology will compress post-quantum signatures into compact proofs, avoiding a throughput penalty.
Ethereum’s quantum-vulnerable supply sits at roughly 2%, compared to Bitcoin’s estimated 5–15%. The network is younger, and better key management practices from launch kept this number lower.
Drake recently remarked: “I’ve stopped thinking about post-quantum as a hurdle that we have to overcome, and I think of it more as an opportunity.”
Bitcoin and High-Throughput Chains Face Greater Post-Quantum Migration Challenges
Bitcoin carries the same elliptic curve vulnerability but operates within a more complex governance environment. BIP-360, a post-quantum migration proposal, has received broad community engagement so far. Even so, over $1.5 trillion in value at stake has not generated the same urgency visible at Ethereum.
Nic Carter, founding partner at Castle Island Ventures, offered a candid comparison between the two networks. He described Ethereum’s approach as “best in class” and Bitcoin’s current posture as “worst in class.” He added: “Elliptic curve cryptography is on the brink of obsolescence. Whether it’s 3 or 10 years; it’s over and we need to accept that.”
Bitcoin’s development culture treats the protocol more as a finished product than an evolving system. That stance benefits monetary credibility but creates friction when cryptographic upgrades are urgently needed. The debate over roughly 1 million BTC in Satoshi-era addresses will also take considerable time to resolve.
Solana and other high-throughput chains face a separate but equally serious challenge. Hash-based signatures are far larger than classical ones, and Solana exposes all public keys by default.
A full migration would narrow the throughput advantage that has served as Solana’s primary competitive differentiator.
Jefferies has already removed Bitcoin from model portfolios, citing quantum vulnerability as a material risk. Carter warned: “ETH people have already figured this out. Unless something changes quickly, ETHBTC will start to reflect the divergence in prioritization.”
Tokenization platforms managing assets with 10- to 30-year durations will increasingly treat post-quantum migration capability as a baseline requirement for institutional deployment.


Key takeaways
- ETH is up by less than 1% and now trades above $2,050.
- The bulls defended the $2,000 support level, with further upward movement on the card.
Ethereum is up by less than 1% at the time of writing on Friday, halting the bearish performance that gripped the market on Thursday. The coin could rally higher in the near term as buyers have stepped in over the past few hours.
Onchain data paints a mixed picture for Ether
ETH is trading above $2,050 at press time, but onchain data paint a mixed picture for the top altcoin. Over the past week, investors across different cohorts have cracked under pressure.
According to the onchain data, wallets with a balance of 10K-100K, which have been major buyers throughout the recent downtrend, offloaded 340K ETH between March 24-30.
However, the wallets flipped back to buying on Tuesday, scooping 270K ETH across the past two days.
On the other hand, wallets with 100-1K and 1K-10K ETH continued distribution, scaling down their holdings by roughly 200K ETH over the past week.
In addition to that, US spot ETH exchange-traded funds (ETFs) have also posted a similar trend. The ETFs have recorded only two days of inflows over the past two weeks of trading, indicating a bearish bias.
Ethereum Price Forecast: Bulls defend the $2k psychological level
The ETH/USD 4-hour chart is bullish and efficient as Ether recorded its first monthly gain in six months.
At press time, ETH is trading at $2,062. Its near-term bias remains mildly bullish as ETH is trading below the 20- and 50-day Exponential Moving Averages (EMAs), which cap advances at around $2,080 and $2,160.

The Relative Strength Index (RSI) reads 53, slightly above the neutral level, while the MACD has stabilized around the midline, both indicating a growing bullish momentum.
If the recovery persists, the bulls would face immediate resistance at $2,108, followed by $2,389 and then $2,746. A daily close above $2,108 would be the first step to ease pressure and expose the higher resistance band toward the 100-day EMA and $2,389.
However, if the sellers regain control, ETH would test the initial support at $1,911, followed by $1,741 and $1,524.
If ETH continues to trade below $2,108, it risks drifting back toward the $1,700 area in the near term.
Crypto World
Bitcoin rangebound as altcoins rally while derivatives signal downside risk: Crypto Markets Today

The crypto market continued to exhibit signs of choppiness on Friday, with bitcoin trading at $67,000 in the middle of a trading range that spans back to early February.
A selection of altcoins picked up during the lower liquidity Asia hours, prompting the likes of ALGO and RENDER to post double-digit gains over the past 24 hours.
But the wider picture remains the same; the crypto market is trading in a macro downtrend dating back to October, characterized by a series of lower highs nad lower lows.
U.S. equities trade flat on Friday as volatility continues to cool since Donald Trump’s comments about a potential end to the war in Iran on Monday.
Brent crude oil is trading at $109 a barrel, indicating that an end to the war is perhaps not as close as some analysts are predicting.
Derivatives Positioning
- Futures markets for Bitcoin and Ethereum remained subdued, with the extended holiday weekend keeping trading volumes thin. Open interest in both assets was largely unchanged over the past 24 hours.
- Open interest in Solana futures has climbed to over 65 million SOL, its highest level since Feb. 7. The increase, combined with negative funding rates and an OI-adjusted cumulative volume delta, suggests traders are increasingly positioning for downside, with short sellers showing greater conviction.
- Similar bearish market dynamics are present TRX and BCH.
- OI in Privacy-focused Zcash (ZEC) futures have steadied near 1.70 million ZEC for the third straight day. ZEC’s CVD is also the highest among majors. This combination suggests sustained positioning with strong directional conviction, likely driven by aggressive buying pressure.
- Bitcoin’s 30-day implied volatility index has declined to 51.28%, the lowest since Feb. The market shows no signs of panic whatsoever despite geopolitical concerns and energy market volatility.
- Ether’s volatility index has slipped to 72.55%, the lowest since Feb. 26.
- On Deribit, bitcoin and ether puts continue to trade pricier than calls, indicating a bias for downside protection.
- Glassnode said that the dealer gamma exposure below $68,000, all the way down to $50,000 is negative. This means that dealers could sell in a falling market to hedge their exposure, adding to downside volatility.
Token talk
- The altcoin market has been relatively resilient to crypto’s choppy behavior this week, certain portions of the market have outperformed bitcoin and crypto majors, particularly DeFi and AI tokens.
- The DeFi Select Index (DFX) is up by 1.3% since midnight UTC, while the CoinDesk Computing Select Index (CPUS) rose by 1.5%, beating the bitcoin-heavy benchmarks likes the CoinDesk 20 (CD20), which is up by just 0.16% on Friday.
- The outperformance of certain altcoins is symptomatic of a consolidating market. When bitcoin and the majors trade flat, traders often speculate on lower liquidity altcoins. That speculation typically grinds to a halt when bitcoin is back deciding the next major market move.


Key takeaways
- PYTH is up 9% in the last 24 hours, outperforming other major cryptocurrencies.
- The rally comes following Pyth Network’s integration with Polymarket.
PYTH, the native coin of the Pyth Network, is one of the best performers in the crypto market over the past 24 hours. It could rally higher in the near term as the broader market recovers from Thursday’s slump.
PYTH rallies on Polymarket integration
On Thursday, Pyth Network revealed in a blog post that Polymarket, the world’s largest prediction market platform, has integrated Pyth Pro as its data source for a new suite of traditional asset contracts.
The initial offerings include gold, silver, and major equity index ETFs. Polymarket now relies on Pyth Pro’s data to power its daily up/down and daily close markets, with live price charts updated every second to ensure full transparency.
The integration has seen PYTH rally by 9% in the last 24 hours and now trades at $0.0420 per coin.
Pyth Pro provides real-time price data through WebSocket, which Polymarket samples every second to display as a live “price to beat” chart. This allows traders to monitor the market’s status relative to their position in real-time.
The selected assets span a wide range of traditional finance, including major equity indices, commodities like gold, silver, WTI crude, and natural gas, along with over a dozen high-profile U.S. equities such as TSLA, COIN, and PLTR.
Polymarket has integrated this real-time data as a key component of its perpetual futures trading platform. Pyth Pro delivers institutional-grade market data directly from top firms, ensuring it is accurate, transparent, and affordable across all asset classes and regions.
To enhance this, Pyth has partnered with industry leaders and government agencies like Cboe, Jane Street, Revolut, and the U.S. Department of Commerce. This collaboration has helped establish a new model to make market data more accessible, accurate, and transparent.
PYTH eyes $0.050 as bulls step in
The PYTH/USD 4-hour chart is bearish and efficient despite the coin adding 9% to its value in the last 24 hours.
The technical indicators have flipped bullish, indicating that the bulls are now in control of the market. The RSI of 63 is well above the neutral 50 and would enter the overbought territory if the rally persists.

The MACD lines are also within the positive region, indicating a strong bullish bias. If the rally continues, PYTH could retest the $0.050 psychological level for the first time since March 17.
However, if the bears regain control, PYTH could retest the Thursday low of $0.038 over the next few hours or days.
Drift Protocol, a Solana-based decentralized exchange (DEX), said Friday it had opened onchain contact with wallets tied to funds stolen in the exploit that outside firms have estimated at roughly $280 million to $286 million.
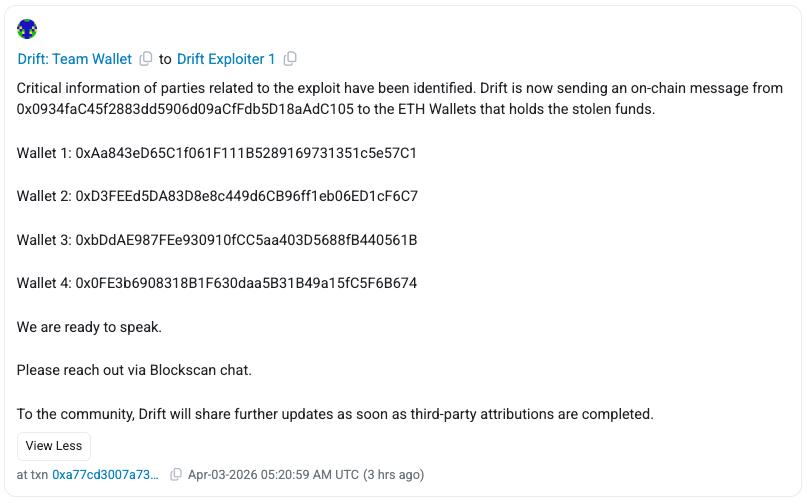
Drift said on X that it had initiated onchain contact with wallets holding the stolen Ether (ETH), seeking to open a line of communication.
The team sent onchain messages from its Ethereum address (0x0934faC) to four wallets linked to the exploiter at the time of publication, urging the attacker to reach out via Blockscan chat. “We are ready to speak,” Drift said.
Onchain messaging has become a common tactic in exploit response, allowing protocols to communicate directly with attackers while preserving anonymity. In past cases, such as the Euler Finance hack, similar outreach led to the partial recovery of funds.

Anonymous sender tries to pressure the attacker
Drift’s communication came hours after an unknown sender using the ENS name readnow.eth also reached out to wallets linked to the attacker on Thursday via onchain messages.
The sender claimed to know the identities behind the attack and demanded a payment of 1,000 ETH in exchange for withholding information.

The claims could not be independently verified and may represent an attempt to mislead or pressure the wallet holder. The incident highlights how, alongside official communications, unverified messages can circulate onchain after crypto exploits.
Solana fallout keeps spreading
According to SolanaFloor, Drift’s exploit has so far affected at least 20 Solana protocols, including the decentralized finance (DeFi) platform Gauntlet, which was estimated to be impacted to the scale of $6.4 million.
Blockchain security platform Cyvers said the impact was still expanding as of Friday morning, with no funds being recovered 48 hours past the attack.
Cyvers said that the attack was likely a “weeks-long, staged operation,” noting that the attacker set up durable nonces, a Solana feature allowing users to pre-sign transactions for future execution, days before the exploit.
Related: Crypto hackers steal $169M from 34 DeFi protocols in Q1: DefiLlama
“This closely mirrors the Bybit hack, different technique, same root issue: signers unknowingly approving malicious transactions,” Cyvers added.
Some industry observers, including Ledger chief technology officer Charles Guillemet, suggested the exploit may involve North Korea-linked actors, though details remain unconfirmed.
Magazine: Nobody knows if quantum secure cryptography will even work
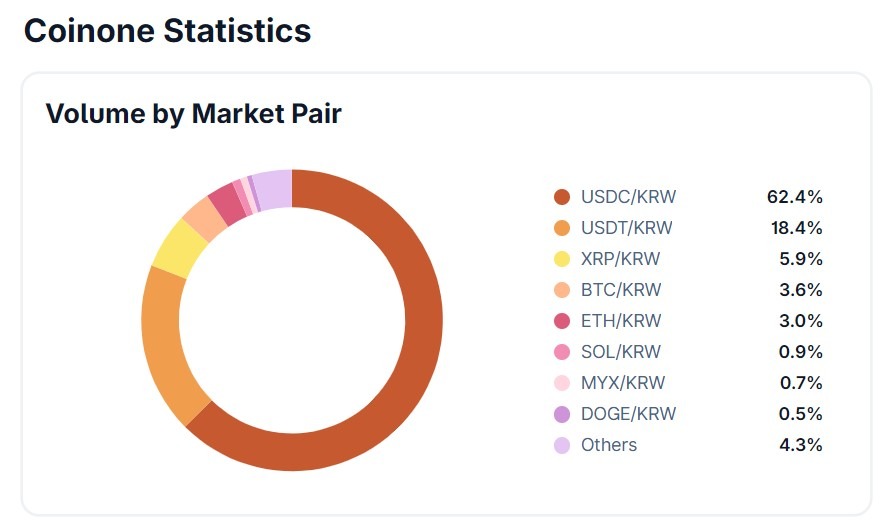
South Korean brokerage Korea Investment & Securities (KIS) is reviewing a potential stake in crypto exchange Coinone, according to Korean media reports and company comments, though no deal has been finalized.
Citing people familiar with the matter, the Korea Herald reported that KIS started engaging with regulators and politicians as part of a broader process tied to a potential investment in Coinone. Coinone also said no specific transaction had been decided.
The news comes as South Korea considers a proposal to cap major shareholders’ stakes in domestic crypto exchanges at 20%, a move that could force ownership changes across parts of the sector if enacted. Coinone Chairman Cha Myung-hoon reportedly controls about 53.44% of the exchange, meaning a stake sale could become one way to adapt if the proposed cap advances into law.
The move would position KIS alongside its rival, Mirae Asset Group, which agreed to acquire a controlling stake in crypto exchange Korbit, according to a February filing. KIS recorded a net profit of over 2 trillion won (about $1.3 billion) in 2025, making it a strong candidate for a potential stake acquisition in Coinone, Hankyung reported.

South Korea moves to cap crypto exchange ownership at 20%
The potential deal unfolds as South Korea moves to reshape ownership structures in its crypto exchange market.
On March 4, the South Korean government and ruling party agreed on a plan to cap ownership stakes of major shareholders in local exchanges at 20%. According to Herald Economy, the Democratic Party of Korea’s digital asset task force and the Financial Services Commission (FSC) agreed to set the maximum shareholding limit at 20% after discussions.
Related: South Korea tax agency seeks private crypto custodian after security lapses
Under the proposal, exchanges would have three years from the law’s enforcement to adjust their ownership structures if the measure is passed.
With Cha holding more than half of Coinone, the proposed cap could eventually require him to reduce his stake. The Herald said he could still retain management control even if a sale proceeds.
The reported talks follow other recent moves by major South Korean companies to secure positions in the crypto sector.
In late 2025, Naver Financial disclosed plans for a roughly $10.3 billion all-stock deal to acquire Dunamu, the operator of Upbit. On March 30, Naver Financial delayed its planned share swap with Dunamu, as regulatory reviews continued and trading volumes declined.
Magazine: Banks want to run Vietnam’s crypto exchanges, Boyaa’s $70M BTC plan: Asia Express

Bitcoin’s on-chain profit-and-loss metrics are edging toward the bear-market territory observed in prior cycles, according to CryptoQuant data analyzed by a CryptoQuant analyst known as Darkfost. The latest figures show about 11.2 million BTC in profit, with the trough of the last bear market recording roughly 9 million BTC in profit. On the loss side, around 8.2 million BTC are currently in loss, a level that Glassnode data indicate has not been seen since late 2022. Darkfost notes that during the previous bear market, the profit supply peaked around 10.6 million BTC, a level the market now approaches from a different angle.
The juxtaposition of sizable profit supply and rising losses is fueling a nuanced debate among analysts about what comes next for BTC. While some see the on-chain configuration as hinting at undervaluation similar to prior downturns, others caution that the signals reflect mounting market stress and may precede a period of consolidation rather than an imminent bottom.
Key takeaways
- Bitcoin profit-supply stands near bear-market-like thresholds, with approximately 11.2 million BTC in profit and about 8.2 million BTC in loss, according to CryptoQuant and Glassnode data.
- In the last bear market, profit supply reached around 10.6 million BTC, suggesting current levels are approaching historical extremes but not identical to prior cycles.
- Analysts diverge on interpretation: some see signs of undervaluation, while others flag rising market stress and potential pre-bottom consolidation.
- BTC has fallen roughly 52% from its all-time high this cycle, a drawdown notably smaller than the 77%–84% declines seen in many earlier bear markets.
- Macro backdrop remains challenging: a stronger U.S. dollar and tighter global liquidity could delay a sustained recovery, with rate cuts not broadly anticipated until late 2026 or 2027.
On-chain signals tightening toward bear-market parity
CryptoQuant data analyzed by Darkfost indicate that Bitcoin’s profit supply has climbed toward levels historically associated with bear markets. The current figure sits around 11.2 million BTC in profit, while the loss-side metric sits near 8.2 million BTC. Glassnode data corroborate that the loss-supply level is at a point not seen since late 2022. Darkfost emphasized that the last bear market had as much as 10.6 million BTC in profit, underscoring how the current scene sits near a store of historical extremes but remains distinct from past dynamics.
These metrics do not automatically spell doom, but they do illuminate a market where profit-bearing coins are plentiful even as a substantial portion of supply sits in loss. That configuration can complicate the price path, since a broad cohort of holders remains profitable, while others are under water—potentially influencing sentiment, risk tolerance, and selling pressure as conditions evolve.
Different readings: undervaluation versus market stress
In a contrasting view, Andri Fauzan Adziima, the research lead at the Bitrue exchange, argues that the data point to rising market stress rather than an imminent undervaluation. He notes that true capitulation bottoms historically accompany sharper pain: in 2022, supply in loss exceeded 50% and profit hovered around 45% or lower, with metrics such as net unrealized profit/loss (NUPL) and market value to realized value ratio (MVRV) at extreme levels.
“Current data points to early/mid-bear transition (potential structural bottom near $55,000), with more downside or consolidation likely before a full reset.”
Separately, coverage from Cointelegraph highlighted that Fidelity described Bitcoin’s drawdown this cycle as less dramatic than in some past cycles, illustrating the divergent interpretations across the market.
Beyond these readings, Bitcoin’s drawdown from its all-time high this cycle stands at about 52%, a smaller drop than typical bear markets, which have seen declines of approximately 77% to 84% from cycle highs. Such dynamics can be interpreted as evidence of a more resilient near-term setup, though they do not by themselves guarantee a sustained rally or a durable bottom.
Macro backdrop: dollar strength and liquidity constraints
Macro factors are shaping how traders assess on-chain signals. Timothy Peterson, a well-known commentator on Bitcoin markets, observed that BTC tends to struggle when the U.S. dollar is strong and the Chinese yuan is weak, a situation that tightens global liquidity and nudges capital toward cash and government bonds when yields remain elevated. The implication is that dollar strength acts as a headwind for risk assets, including Bitcoin, even as liquidity conditions shift with policy moves.
Peterson notes that a meaningful improvement for BTC would come only when U.S. interest rates fall and dollar yields lose their appeal, a development he expects is unlikely before the second half of 2026 or, more plausibly, in 2027. The U.S. dollar index (DXY) has risen about 5% over the past two months, according to data tracked on TradingView, adding to the macro hurdles facing a rapid BTC recovery.
Taken together, the on-chain signals and macro backdrop present a nuanced landscape: a market that, on one hand, shows pockmarks of bear-market-like behavior in profit metrics, but, on the other, is contending with a robust dollar and cautious liquidity that can prolong a period of consolidation rather than deliver a quick reset. Investors should watch for shifts in dollar dynamics, policy expectations, and changes in on-chain metrics such as NUPL and MVRV as new data come in over the coming quarters.
Looking ahead, the question remains what path Bitcoin will take as macro conditions evolve. If on-chain indicators begin to align with a genuine bottom—supported by a sustained weakening of the dollar and a more favorable liquidity environment—the next phase could reflect a gradual re-rating rather than an abrupt rebound. Conversely, if the macro regime remains restrictive and stress signals persist or intensify, the market may continue to drift below recent highs before any meaningful reset materializes.
Readers should keep an eye on evolving rate expectations, liquidity conditions, and the trajectory of on-chain risk metrics. The coming quarters will clarify whether Bitcoin’s current configuration marks the end of a broader drawdown or merely a protracted period of accumulation before a more decisive breakout.


The United States Commodity Futures Trading Commission and the Department of Justice have filed lawsuits against Illinois, Connecticut, and Arizona over the federal government’s authority to regulate prediction markets.
Summary
- The CFTC and Department of Justice have sued three states, arguing that prediction markets fall under exclusive federal derivatives oversight.
- Illinois and other states had issued cease and desist orders, claiming event contracts violated local gambling laws and licensing rules.
According to a complaint filed against Illinois Governor JB Pritzker, Attorney General Kwame Raoul, and the Illinois Gaming Board, the state gaming board improperly classified event contracts as “wagers” or “sports betting” instead of swaps.
In the lawsuits, the CFTC maintains that it has “exclusive jurisdiction” to regulate “Designated Contract Markets (DCMs),” which it says extend to prediction platforms under the Commodity Exchange Act (CEA).
Per the regulator, Illinois’s move to shut down such platforms “intrudes on the exclusive federal scheme Congress designed to oversee national swaps markets, prompted by the evolution of national financial markets and repeated conflicts with state law.”
“Unless restrained and enjoined by the court, defendants are likely to continue their attempts to subvert federal law and the exclusive jurisdiction to regulate event contract swaps conferred on the CFTC by Congress,” the lawsuit added.
The case stems from cease and desist letters issued by the states and their gaming regulators last year against platforms including Kalshi and Polymarket. The letters claimed that the contracts violated local gambling laws and licensing requirements.
Commenting on the developments, CFTC Chairman Mike Selig described the actions as “aggressive and overzealous attempts to overstep the CFTC,” in a separate statement after the lawsuits were filed.
“Our action today is meant to ensure we are able to effectively regulate the markets that Congress intended us to exclusively oversee,” he added.
Over the past year, at least 11 U.S. states, including Arizona, Nevada, Illinois, Maryland, New Jersey, Montana, Ohio, Connecticut, Tennessee, New York, and Massachusetts, have filed actions against prediction market operators.
Simultaneously, some lawmakers are advancing legislative proposals that would ban sports-related event contracts, while others seek to restrict participation in prediction markets tied to war.
Despite the legal pressure, prediction markets are witnessing rapid growth. As previously reported by crypto.news, transaction activity surged, with volumes increasing by more than 2,800% from the same period last year.

India’s Middle Class Debt Trap: EMI, Loans & Financial Crisis Explained | ft. Medha | Jist
‘Our Ryan Giggs’ – Brad Friedel hails Ireland legend, outlines World Cup fan regret

Current Security Lines Short with 5 to 12 Minutes Wait Time


-

 NewsBeat7 days ago
The Story hosts event on Durham’s historic registers
-

 NewsBeat16 hours ago
Steven Gerrard disagrees with Gary Neville over ‘shock’ Chelsea and Arsenal claim | Football
-

 Sports7 days ago
Sweet Sixteen Game Thread: Tide vs Michigan
-
Entertainment4 days ago
Fans slam 'heartbreaking' Barbie Dream Fest convention debacle with 'cardboard cutout' experience
-

 Crypto World2 days ago
Gold Price Prediction: Worst Month in 17 Years fo Save Haven Rock
-
 Entertainment6 days ago
Lana Del Rey Celebrates Her Husband’s 51st Birthday In New Post
-
Crypto World3 days ago
Dems press CFTC, ethics board on prediction-market insider trades
-

 Tech4 days ago
The Pixel 10a doesn’t have a camera bump, and it’s great
-

 Business11 hours ago
No Jackpot Winner and $194 Million Prize Rolls Over
-

 Sports3 days ago
Tallest college basketball player ever, standing at 7-foot-9, entering transfer portal
-

 Fashion5 days ago
Amazon Sundays: Soft Spring Layers
-

 Tech3 days ago
EE TV is using AI to help you find something to watch
-

 Business1 day ago
Login and Checkout Issues Spark Merchant Frustration
-

 Fashion6 days ago
When Evening Dressing Gets Colorful for Spring
-

 Tech5 days ago
Elon Musk’s last co-founder reportedly leaves xAI
-

 Tech4 days ago
Avatar Legends: The Fighting Game comes out in July and it looks pretty slick
-

 Crypto World4 days ago
U.S. rule change may open trillions in 401(k) funds to crypto
-

 Tech3 days ago
How to back up your iPhone & iPad to your Mac before something goes wrong
-

 Tech4 days ago
Apple will hide your email address from apps and websites, but not cops
-

 Politics4 days ago
Should Trump Be Scared Strait?
You must be logged in to post a comment Login