
Crypto World
LBank Launches Crypto Resilience Initiative, Building on Its Security Collaboration with CertiK


[PRESS RELEASE – Singapore, Singapore, August 10th, 2026]
LBank today announced the launch of the Crypto Resilience Initiative, an effort to support the security of its platform. As part of this initiative, LBank will continue to work with CertiK, the largest Web3 security services provider, through CertiK’s penetration testing services and LBank’s participation in CertiK’s Bug Bounty program.
The initiative is intended to support LBank’s ongoing security efforts by applying CertiK’s professional penetration testing capabilities and extensive blockchain security expertise into LBank’s platform security practices.
As digital assets continue to see broader adoption, exchanges and blockchain infrastructure providers are facing increasingly sophisticated threats, including cross-chain exploits, smart contract vulnerabilities, and AI-assisted attack techniques. The Crypto Resilience Initiative is designed to support more proactive security practices through enhanced technical assessments and external blockchain security expertise.
“Security is becoming increasingly collaborative,” said Eric He, Community Angel Officer and Risk Control Advisor at LBank. “As the blockchain ecosystem grows more interconnected, protecting users requires not only stronger internal controls but also closer cooperation across the industry. Through the Crypto Resilience Initiative, we look forward to working with CertiK to contribute to a safer digital asset ecosystem.”
Alongside external security partnerships, LBank continues to maintain a multi-layered security framework that includes cold wallet custody, multi-signature authorization, behavioral analytics, AI-assisted risk detection, and continuous monitoring designed to safeguard user assets and maintain platform stability.
Looking ahead, LBank plans to continue working with CertiK to further advance the Crypto Resilience Initiative. The companies expect the initiative to support stronger security practices across the industry while contributing to the long-term resilience of the digital asset ecosystem.
About CertiK
CertiK is the largest Web3 security service provider, headquartered in New York. Since its founding in 2017, the company has grown into a trusted risk management partner for regulators, institutions, and Web3 innovators worldwide.
CertiK delivers AI-powered, full-lifecycle risk management solutions that integrate directly into institutional clients’ system development lifecycles (SDLC). To date, CertiK has detected more than 119,000 vulnerabilities and protected over $600 billion in digital assets across 150+ countries and regions. Operating under SOC 2 Type II and ISO 27001 standards, CertiK works closely with regulators worldwide on digital asset policy development and regulatory consultation.
About LBank
Founded in 2015, LBank is a leading global cryptocurrency exchange serving over 25 million registered users in 160 countries and regions. With a daily trading volume exceeding $23.81 billion and 10 years of safety with zero security incidents, LBank is dedicated to providing a comprehensive and user-friendly trading experience. Through innovative trading solutions, the platform has enabled users to achieve average returns of over 130% on newly listed assets.
LBank has listed over 300 mainstream coins and more than 50 high-potential gems. Ranked No. 1 in 100x Gems, Highest Gains, and Meme Share, LBank leads the market with the fastest altcoin listings, unmatched liquidity, and industry-first trading guarantees, making it the go-to platform for crypto investors worldwide.
Follow LBank for Updates
Website: https://www.lbank.com/
Twitter: https://twitter.com/LBank_Exchange
Telegram: https://t.me/LBank_en
Instagram: https://www.instagram.com/lbank_exchange
LinkedIn: https://www.linkedin.com/company/lbank
For media requests, please contact:
Email: press@lbank.com
The post LBank Launches Crypto Resilience Initiative, Building on Its Security Collaboration with CertiK appeared first on CryptoPotato.



Bitdeer mined 2,694 BTC in Q2, but ended the quarter holding just 150 BTC after liquidating its treasury earlier this year.

Barrick Mining (B) and Newmont (NEM) reached an agreement that may clear the way for Barrick’s IPO of its North American gold assets to unlock their full value. While the agreement resolves opposition from Newmont, with which Barrick has a Nevada Gold Mines joint venture, Bloomberg reported on Sunday that some major Barrick shareholders disapprove of the IPO plan. While…
Copyright ©2026 Investor’s Business Daily, LLC. All rights reserved. 87990cbe856818d5eddac44c7b1cdeb8
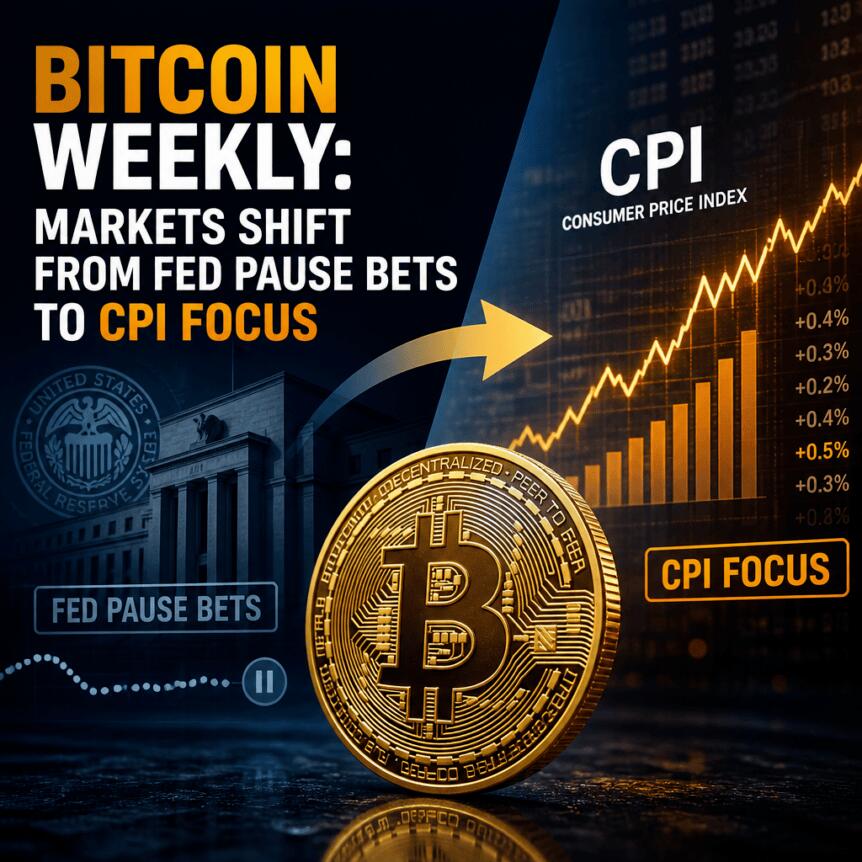
Bitcoin opened the week by printing fresh August highs as traders digested incoming U.S. inflation figures and renewed attention on global rate expectations. With the latest month-to-date strength pushing price toward the mid-$60,000s, market participants are now focusing on whether key technical levels can hold—especially with volatility risk rising ahead of CPI and PPI releases.
At the same time, the macro backdrop remains complicated: markets are still recalibrating the path for Federal Reserve policy into 2026, while the Japanese yen has moved back toward the widely watched 160-per-dollar area after recent U.S.-linked intervention. The mix of macro drivers and onchain positioning is helping shape a market debate that’s increasingly split between large holders and smaller retail addresses.
Key takeaways
- U.S. CPI and PPI data land this week, arriving after mixed-but-cooler inflation and labor signals that have shifted rate-hike odds.
- The Japanese yen is back near the 160 level following earlier intervention dynamics that traders link to broader risk-asset liquidity.
- BTC bulls are centered on the $65,800 region, framed by multiple traders and order-book-derived liquidation focus.
- CryptoQuant data points to a multi-month high in accumulation among large Bitcoin wallets (addresses holding >10,000 BTC).
- Despite pockets of strength, onchain “cycle” indicators still suggest the bear market phase may not be over—particularly in the second half of 2026.
Inflation data and the Fed’s tightening/pausing calculus
This week’s market attention is firmly on the release schedule for the Consumer Price Index and Producer Price Index. The July CPI is due on Wednesday and the July PPI on Thursday, milestones that often move expectations around the Federal Reserve’s future interest-rate path.
Recent inflation signals have been uneven, and the new prints arrive amid additional uncertainty tied to the U.S.-Iran conflict. According to Reuters, oil prices have remained sensitive to developments around the Strait of Hormuz—an exposure that can feed through to CPI depending on whether shipping conditions deteriorate or reopen. SS WealthStreet founder Sugandha Sachdeva told Reuters that crude oil remains “caught between opposing forces” as markets weigh the possibility of a breakthrough over the strait versus Iran’s conditions for reopening.
Beyond oil, the immediate context for traders is the direction of prior U.S. macro releases. Cointelegraph previously noted that last month’s CPI and PPI results surprised to the downside, with CPI posting its largest monthly decline since April 2020. Labor-market data also contributed to a cooler tone: after nonfarm payrolls fell short of expectations, Cointelegraph reported weaker-than-expected labor conditions and rising odds of a more dovish Fed.
Those changes have mattered for rate pricing. As reflected in CME Group’s FedWatch Tool, the probability of the Fed pausing at its Sept. 16 meeting stood at 56% as of Monday, after earlier market pricing leaned more heavily toward a hike. In the latest edition of its newsletter, Mosaic Asset Company wrote that a week earlier implied odds favored a September rate hike, but now pricing “slightly favor[s] the Fed keeping rates on hold,” with just one hike before pausing well into next year.
Yen dynamics return to the center of risk-asset debate
While U.S. data drives part of the narrative, traders are also monitoring currency flows that can alter liquidity across global markets. The Japanese yen has remained a focal point after a rare episode of U.S.-Japanese coordination—the first joint intervention since the late 1990s.
After USD/JPY weakened to its lowest levels since 1986 earlier in August, the New York Fed—acting on behalf of the U.S. Treasury—purchased yen using euros via the Exchange Stabilization Fund. U.S. Treasury Secretary Scott Bessent indicated at the time that further interventions were possible, arguing the U.S. strongly supports Japan’s steps to correct what he characterized as the yen’s “substantial undervaluation.”
In the days since, the yen’s trajectory has been mixed. It initially strengthened toward around 156 per dollar, but has since weakened again and is back above 158.50, edging toward the key 160 level.
Brookings Institution senior fellow Robin Brooks cautioned that intervention mechanics alone may not reverse the underlying trend. In a Substack post, he compared the effectiveness of the move to prior “rate check” dynamics around Japan’s Feb. 8 general election, arguing that price action didn’t show meaningful reversal and suggesting the intervention is unlikely to stop the yen’s weakening trend.
Earlier Cointelegraph reporting also flagged how the yen carry trade can influence liquidity conditions for crypto and other risk assets. QCP Capital similarly emphasized that the larger issue is whether higher Japanese yields change incentives for investors to allocate capital overseas.
BTC technical focus shifts to $65,800 while traders watch liquidity
Bitcoin’s price action during the week has been defined by a blend of breakout expectations and resistance from widely watched moving averages. Into Sunday’s weekly close, BTC printed month-to-date highs around $65,420, then consolidated as traditional markets reopened.
TradingView data continued to show BTC/USD stuck in a range, with the 50-month exponential moving average (EMA) acting as overhead resistance near $65,827. Still, trader Michaël van de Poppe argued that three breakout signals are forming based on traditional momentum indicators. He reported “strong” bullish divergences in both MACD and RSI across three-day and one-week time frames—an approach that looks for confirmation even when price temporarily stalls.
In van de Poppe’s framework, the pivotal line is $65,800. He suggested that if the $65,800 weekly level breaks, a “volatile move upwards” could follow due to short-side liquidity being forced to exit after consolidation. Separately, CoinGlass order-book-derived liquidation mapping also highlighted $65,800 as a key area where liquidations could cluster if price turns decisively.
At the time of reporting, cross-crypto short liquidations over the prior 24 hours were $53 million, indicating that while the market is not in a full-scale expansion phase, traders are positioned enough for moves around key levels to have feedback effects.
Other technical commentary from CryptoQuant contributor Andrew Kamsky pointed to a falling wedge pattern on the daily chart and described a potential “decision window” for the range by Aug. 17. He framed scenarios where rejection between $66.4K and $66.8K followed by higher lows could build toward an ascending triangle, while a move back inside the wedge would weaken the bullish setup and a break below support would invalidate it. As an upside possibility, Kamsky cited $72,000 as a “possible scenario.”
Onchain signals: large-wallet accumulation rises as smaller holders reduce
The most constructive onchain development comes from growing activity among large Bitcoin investors. CryptoQuant’s analysis points to a sharp shift toward accumulation among addresses holding more than 10,000 BTC. On a 60-day rolling basis, that cohort’s balance increased by 46,420 BTC on Aug. 9, which CryptoQuant described as the largest uptick since March 15.
CryptoQuant also emphasized that the latest reading nearly doubled the 23,238 BTC accumulation peak recorded in mid-March. In other words, the acceleration has not merely continued—it has intensified.
Just as importantly, CryptoQuant described a divergence between large holders and smaller addresses. After accumulating through July, wallets holding between 0.1 BTC and 1 BTC distributed roughly 9,700 BTC over the same 60-day window through Aug. 9. The implication is that large holders are adding exposure while smaller participants are trimming, a positioning split that matters because it can influence how quickly demand absorbs sell pressure if price tests lower support levels.
This week’s accumulation narrative also fits into a broader backdrop of participation concerns. Cointelegraph previously cited CryptoQuant-era observations of strong accumulation between $62,000 and $65,000 alongside order-book and market-structure debates. Glassnode cofounder Rafael Schultze-Kraft added another angle in social commentary: he described spot markets as “virtually dead,” pointing to a daily spot turnover ratio of 0.32% (the lowest level in his data) and a roughly 64% year-over-year decline in dollar volume.
Cycle indicators still warn that the bear market may be lingering
Even with accumulation data and bullish divergences on short-term charts, some analysts argue the market remains in a late-stage bear-market condition. Schultze-Kraft discussed a record “capitulation” phase in a basket of 45 indicators tracked via Glassnode’s Bitcoin Cycle Position Heatmap. In his description, the market is in its coldest stretch since FTX—late in the bear cycle but not yet in the most definitive “deep blue” stage that previously marked a floor.
CoinGlass offers a similar framing through its Bull Cycle Peak Indicators compilation, which it reports as sitting 32% toward an ideal “sell” zone. Taken together, these approaches suggest that while selective accumulation and liquidity dynamics may support short-term upside attempts, structural reversal confirmation may still require more broad participation than what spot metrics currently indicate.
Trader and analyst Rekt Capital added a historical lens by comparing the current chart structure to the 2022 bear market. In a weekend post, he argued that Bitcoin was forming lower highs relative to a July upside wick in 2022, while August produced a higher high in that earlier cycle. He also reiterated that Bitcoin has yet to reclaim the 50-month EMA around $65,827—presenting the same technical ingredient that often precedes a deeper bear-market capitulation phase.
For traders and investors, the next decision points are likely to converge: how CPI and PPI shift Fed expectations, whether the yen’s approach to 160 changes global liquidity incentives, and whether BTC can turn $65,800 into a confirmed support level rather than another range boundary. Watch whether onchain accumulation broadens alongside spot activity—or whether the market continues to show strength dominated by a smaller set of large holders.
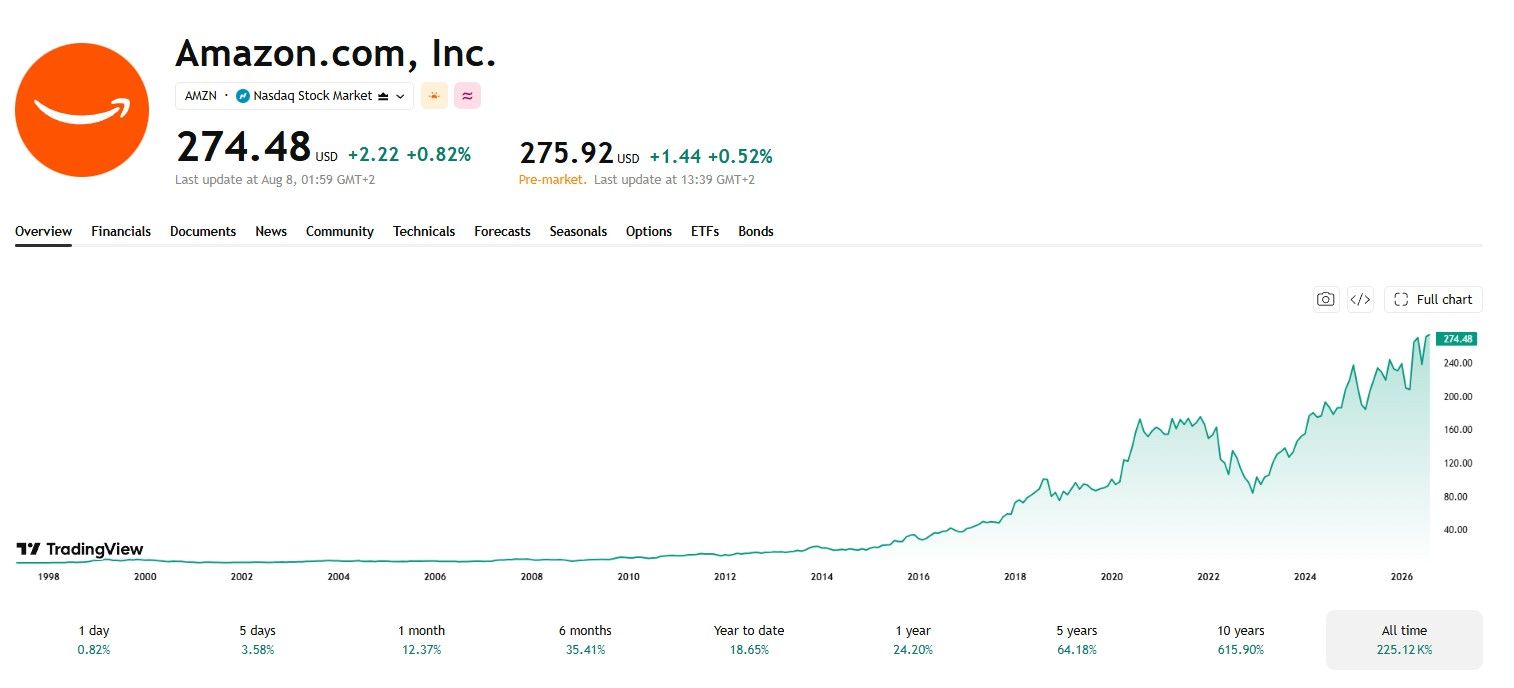
Amazon stock is trading close to record levels as founder Jeff Bezos closes in on a roughly one-third stake in Liverpool Football Club.
Sky News reports that Fenway Sports Group could announce the transaction this week. One insider said the stake may now exceed 30%, valuing the club at $6 billion.
Bezos Joins a Consortium Chasing More Than 30% of Liverpool
Amit Bhatia leads the syndicate. He is the son-in-law of steel billionaire Lakshmi Mittal and held a stake in Championship side Queens Park Rangers until recently.
Eduardo Saverin sits alongside Bezos in the group. The 44-year-old Facebook co-founder backed a failed bid for Chelsea during the 2022 auction. Forbes puts the Bezos fortune above $280 billion, while Saverin is worth more than $32 billion.
FSG confirmed the approach last month.
“An investment consortium led, managed, and represented by Amit Bhatia has expressed interest in making a strategic minority investment in Liverpool Football Club.”
FSG spokesperson, via Sky
FSG bought Liverpool for 300 million pounds in 2010. Dynasty Equity then took a small position in 2023 at a valuation above $4.5 billion. A $6 billion figure would therefore cap 16 profitable years at Anfield.
Bezos has never been linked to a football deal before. His interest signals how far wealthy investors now treat sport as an asset class. Liverpool meanwhile enters a season of transition after the sacking of Arne Slot and the departure of Mo Salah. The club won the Premier League in 2024-25, then finished fifth.
Amazon Stock Holds Near Records After the $3 Trillion Close
Amazon closed at $274.48 on Friday, up 0.82% on the day. Shares have gained 24.2% over the past year and 18.65% since January.

The company topped $3 trillion for the first time on August 3, although that record lasted one day. Amazon is worth roughly $2.96 trillion now, with a 52-week high of $287.20.
Cloud growth at Amazon Web Services drove the run. Analysts responded by lifting Amazon price targets, and the most bullish reached $400.
Bezos also completed a scheduled $4 billion sale of Amazon shares this month. He filed that plan eight months earlier, so the timing was mechanical rather than opportunistic. Crypto traders can follow the same names onchain, because brokers have started listing tokenized US stocks.
FSG and the consortium both declined to comment on timing. Football’s finances face wider scrutiny after FIFA moved to sell a World Cup stake. The coming days should show whether Liverpool’s new backers stay passive or eventually push for outright control.
The post Amazon Back Near $3 Trillion as Jeff Bezos Reportedly Eyes a Third of Liverpool appeared first on BeInCrypto.
MicroStrategy (now Strategy) disclosed another Bitcoin (BTC) sale on Monday, offloading 1,690 BTC for $108.6 million. Every dollar went into buybacks of its STRC preferred stock.
The company still holds 840,447 BTC, the largest corporate Bitcoin treasury. However, it now sells coins below cost to repair a preferred stock that will not hold its intended price.
Inside the Latest Strategy Bitcoin Sale
The sale ran from August 3 to August 9 at an average price of $64,262 per coin. Strategy detailed the transaction in a Form 8-K filing with the US Securities and Exchange Commission (SEC).
Net proceeds funded the repurchase of 1,152,020 shares of STRC. That security is the variable-rate perpetual preferred stock Strategy issued to help finance its Bitcoin accumulation. Its dividend resets monthly, currently at 12% annualized, to keep the share price near a $100 par value.
The market has resisted the design. STRC closed Friday at $95.01, up 1.16%, after sinking as low as $71.25 within the past year. It ticked up to $95.55 in Monday’s pre-market.
The transaction extends a clear pattern. Strategy sold 1,638 BTC one week earlier, marking consecutive weeks as a net seller. The filing listed no new Bitcoin purchases for the period.
Meanwhile, the remaining stack cost $63.36 billion to build, an average of $75,385 per coin. Every disposal near current prices locks in a loss against that basis. Executive chairman Michael Saylor, for his part, maintains he has never sold personally.
MSTR Share Sales Lift the USD Reserve to $4.65 Billion
Strategy also sold 6,585,682 MSTR shares through its at-the-market (ATM) equity program, raising $653.1 million. It routed $650 million of that into its USD reserve, which now stands at $4.65 billion.
Saylor framed the week as a credit exercise rather than a retreat from Bitcoin.
“Strategy increased its USD Reserve by $650M and repurchased $109M of $STRC. This increased USD Duration by 143 days to 2.7 yrs and tightened STRC’s BTC Credit by 10 bps. As of 8/9/26, we hold ₿840,447 in our BTC Reserve and $4.65B in our USD Reserve,” Saylor wrote.
The buyback consumed most of the remaining preferred repurchase authorization, leaving $785.2 million available. In contrast, roughly $22 billion in MSTR issuance capacity remains untouched.
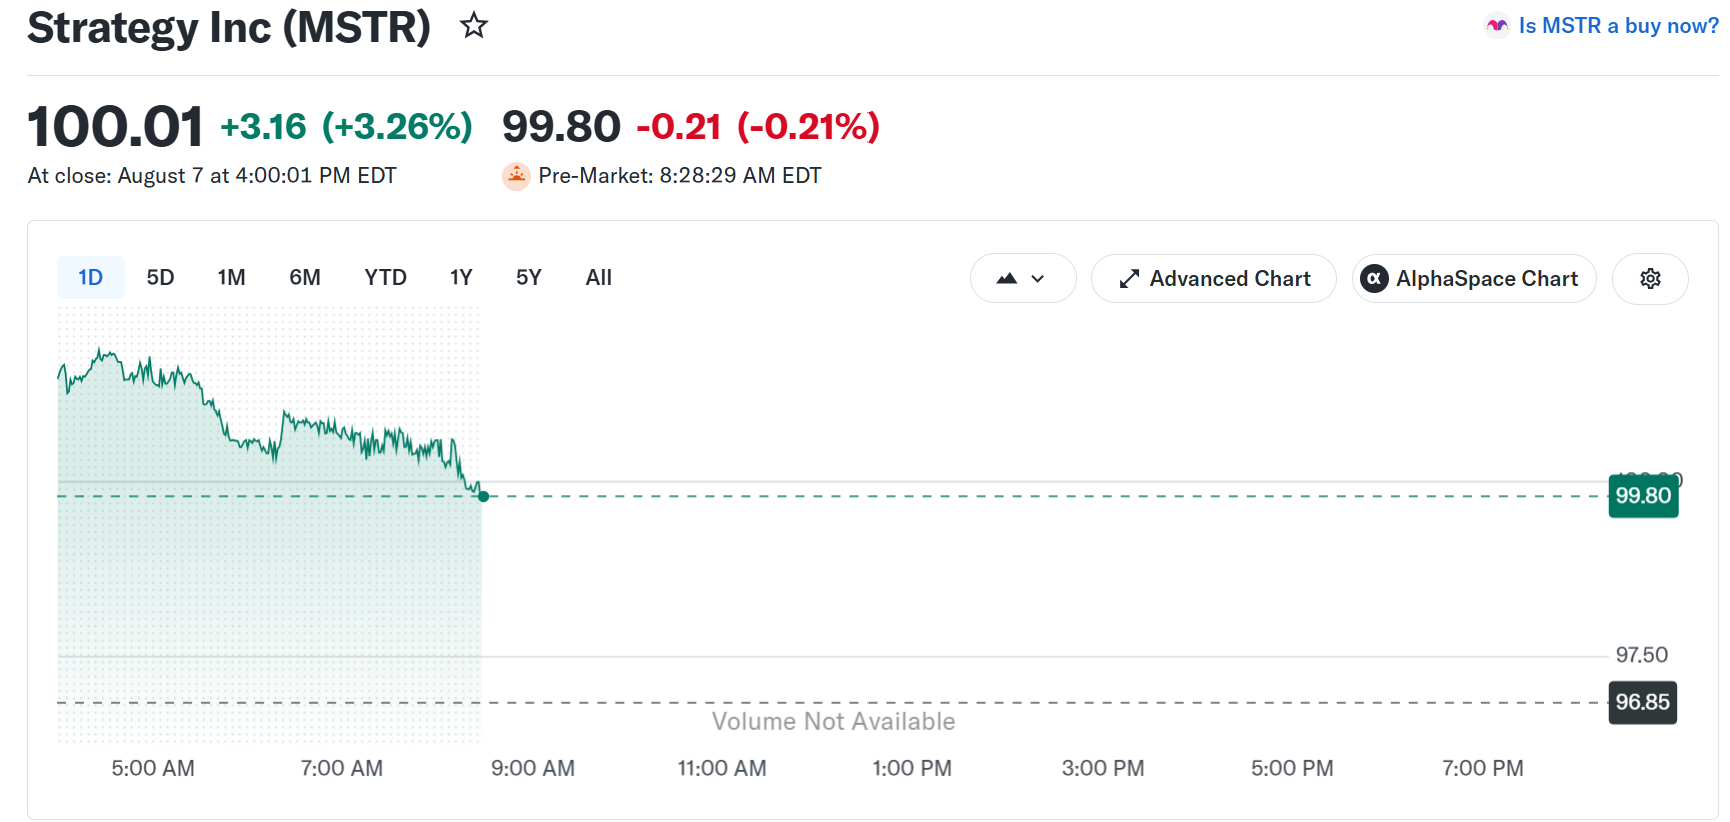
MSTR closed Friday at $100.01, up 3.26%, but edged 0.21% lower in Monday’s pre-market.

Why Strategy Keeps Selling Bitcoin
The behavior traces back to the Digital Credit Capital Framework, a plan adopted in late June. It authorizes limited Bitcoin sales to fund preferred dividends, buybacks, and cash reserves when issuing equity looks less attractive.
Since then, Strategy has paused new Bitcoin purchases while raising cash almost every week. The company argues the reserve now covers years of dividend obligations across its preferred stack.
The repair effort shows partial results. STRC has recovered roughly 33% from its lows. Even so, a 12% dividend and $109 million of buybacks have not yet closed the gap to par.
Bitcoin traded near $65,019 on Monday, up 1.5% over 24 hours. That leaves the market roughly 13% below Strategy’s average purchase price.
Upcoming filings will show whether weekly sales continue or accumulation resumes. Either way, shareholders confront a big MSTR trade-off. Their Bitcoin proxy has become a treasury actively managed to serve its own capital structure.
The post MicroStrategy Sells More Bitcoin to Fix STRC Stock: Will It Work? appeared first on BeInCrypto.
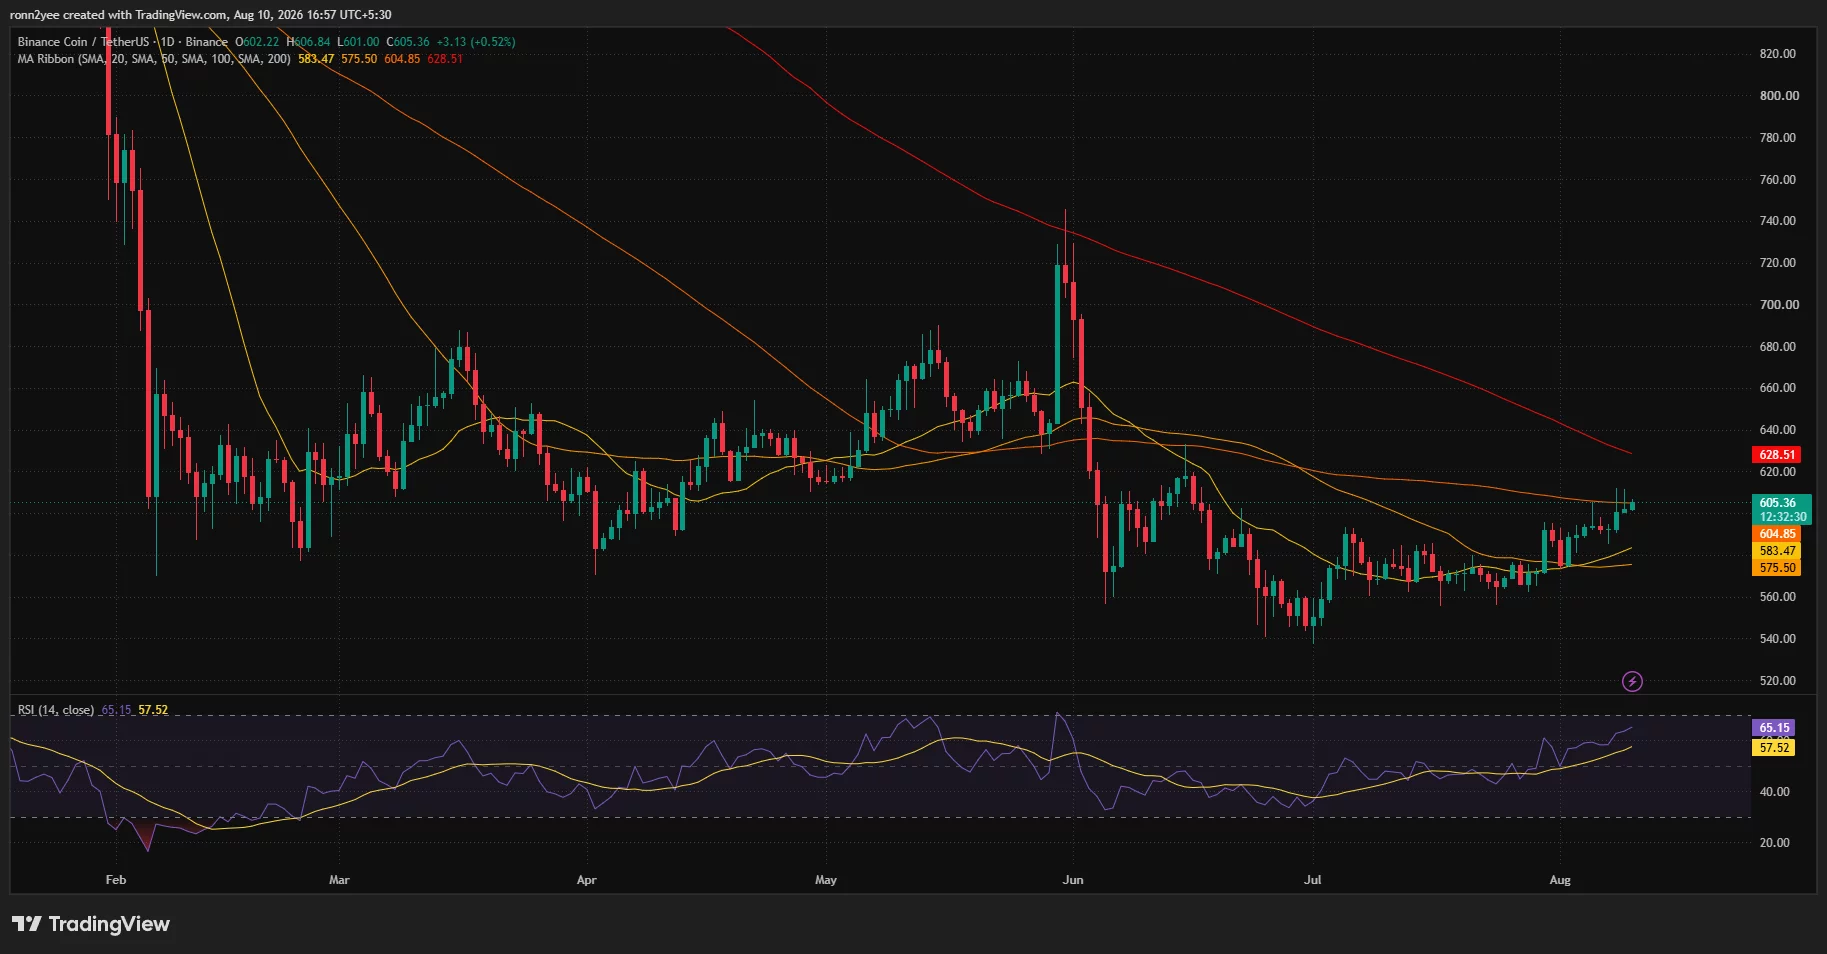
BNB price traded near $605 on Aug. 10 after reclaiming the psychological $600 level, with improving momentum and nearby liquidation clusters raising the prospect of another short squeeze.
Summary
- BNB price traded at $605, slightly above its 100-day moving average near $604.85.
- Daily RSI climbed to 65.15, showing stronger demand without entering overbought territory.
- 4-hour Supertrend support rose to $593.86, making $594–$600 the key defense zone.
- Liquidation data shows concentrated short exposure around $618–$623, with downside liquidity near $598.
BNB reclaims $600 after its July recovery
According to data from crypto.news, BNB (BNB) price extended its recovery on Aug. 10, trading around $605 after reaching an intraday high near $606.84. The token has now moved above $600, a level that repeatedly limited gains during the previous sessions.
The daily chart shows BNB recovering from a late-June low near $540. Buyers gradually returned through July before accelerating the move during the first 10 days of August. The price has gained roughly 12% from the June bottom and is attempting to establish a higher-high structure.
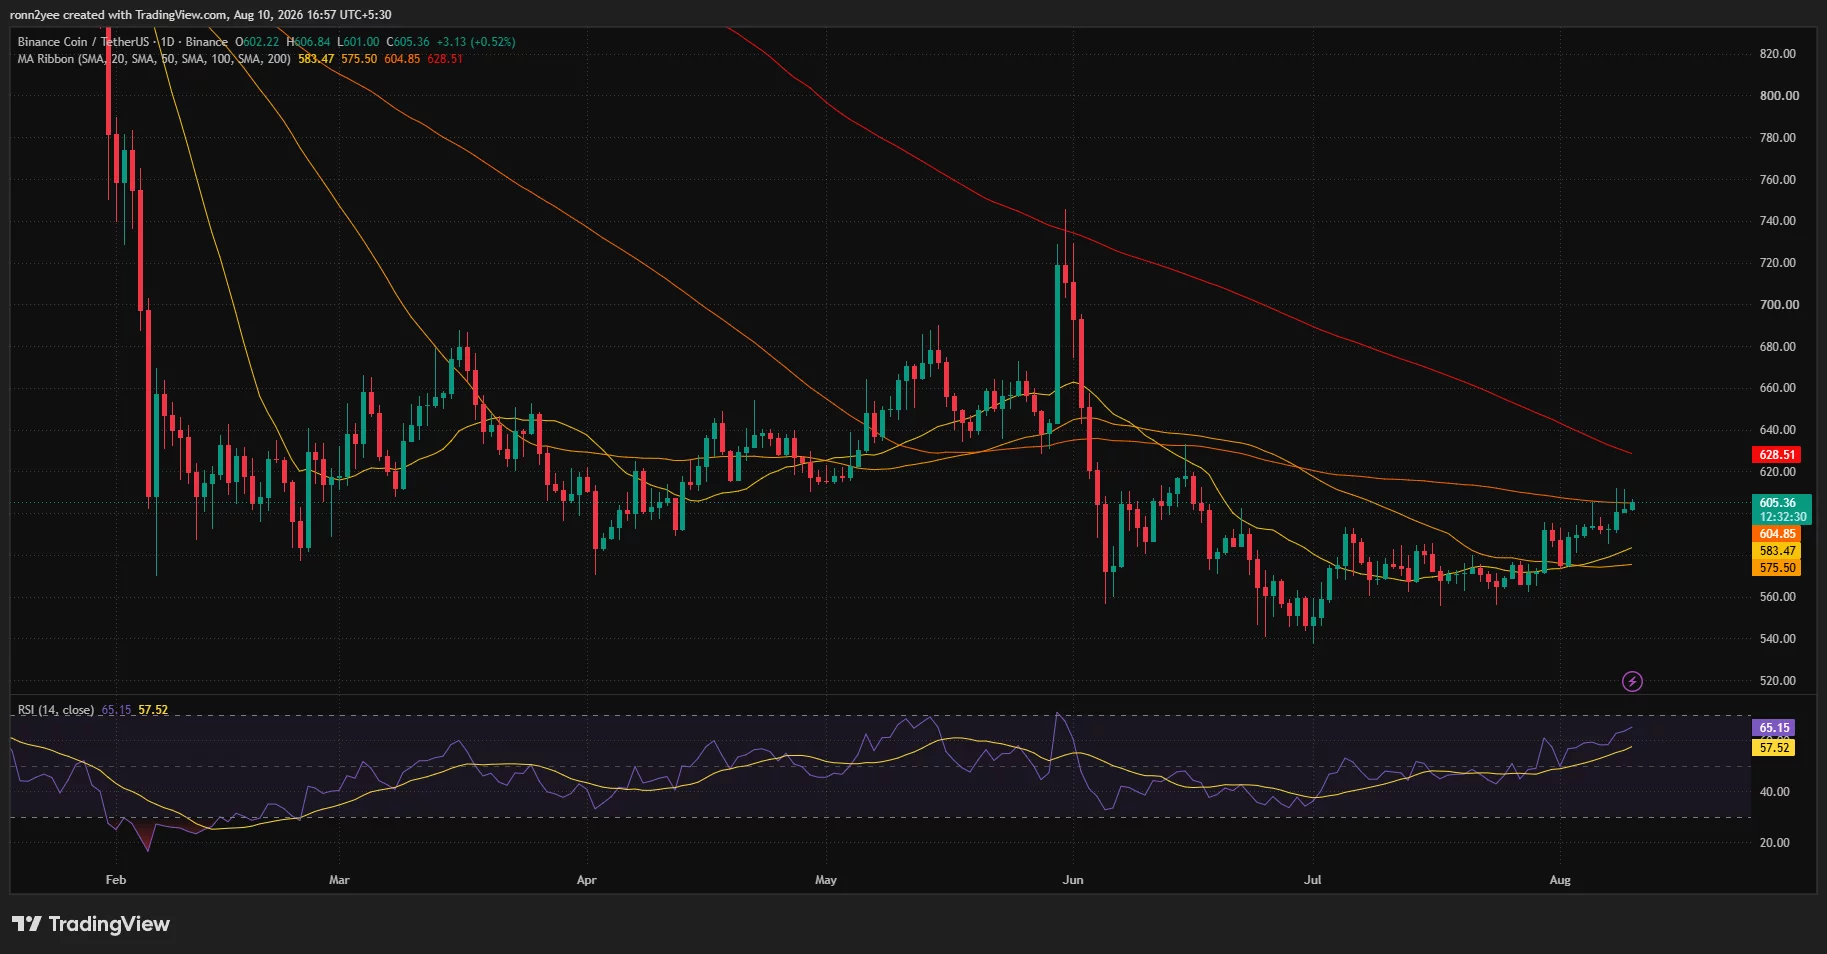
Momentum has also improved. The daily Relative Strength Index rose to 65.15, above its signal average of 57.52. An RSI reading below 70 suggests that buying pressure is increasing, but BNB has not yet entered technically overbought territory.
Still, the move has not produced a decisive breakout. BNB remains near a group of resistance levels between $605 and $610, where repeated intraday rejections show that sellers remain active.
Moving averages support the rebound, but volume lags
The latest advance appears primarily technical. BNB has reclaimed its 20-day and 50-day moving averages, currently positioned near $583.47 and $575.50, respectively. Both levels now sit below the market and could provide support during a pullback.
BNB is also testing its 100-day moving average near $604.85. A sustained daily close above this line would strengthen the recovery case and shift attention toward the 200-day moving average at $628.51.
The 4-hour chart supports the short-term bullish setup. BNB remains above the Supertrend indicator, which has moved up to $593.86. The indicator flipped bullish in late July and has continued to track the price higher.
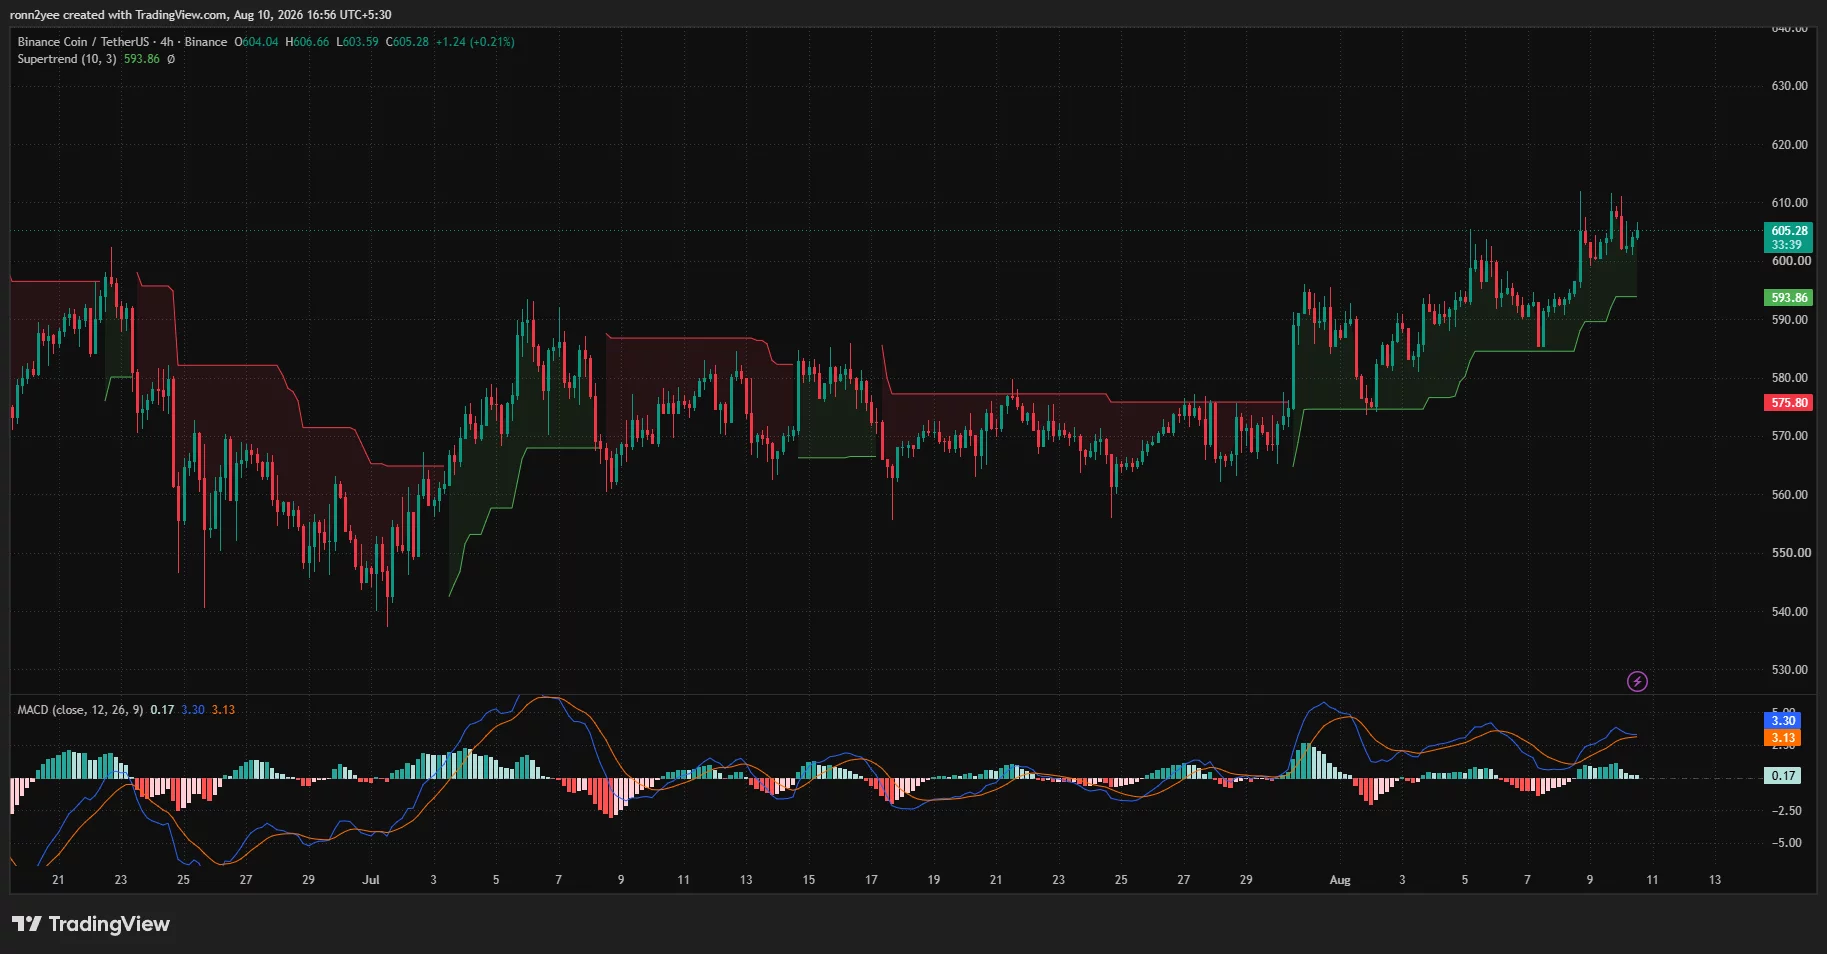
The Moving Average Convergence Divergence indicator remains positive, with the MACD line at 3.30 and the signal line at 3.13. However, the histogram has narrowed to 0.17, suggesting that upward momentum is slowing as BNB tests resistance.
Thin follow-through therefore remains a risk. A lack of stronger buying volume could keep the token within its current range even if it continues to hold above $600.
Liquidation clusters put $623 within reach
BNB’s immediate resistance sits between $606 and $610, covering recent intraday highs. A 4-hour close above $610 could clear the latest supply zone and open a path toward the first major liquidation cluster around $618–$620.
The 3-day liquidation heatmap shows an even larger concentration of leveraged positions near $622–$623. If BNB breaks $610 with increasing volume, forced closures of short positions could accelerate the move into this zone.
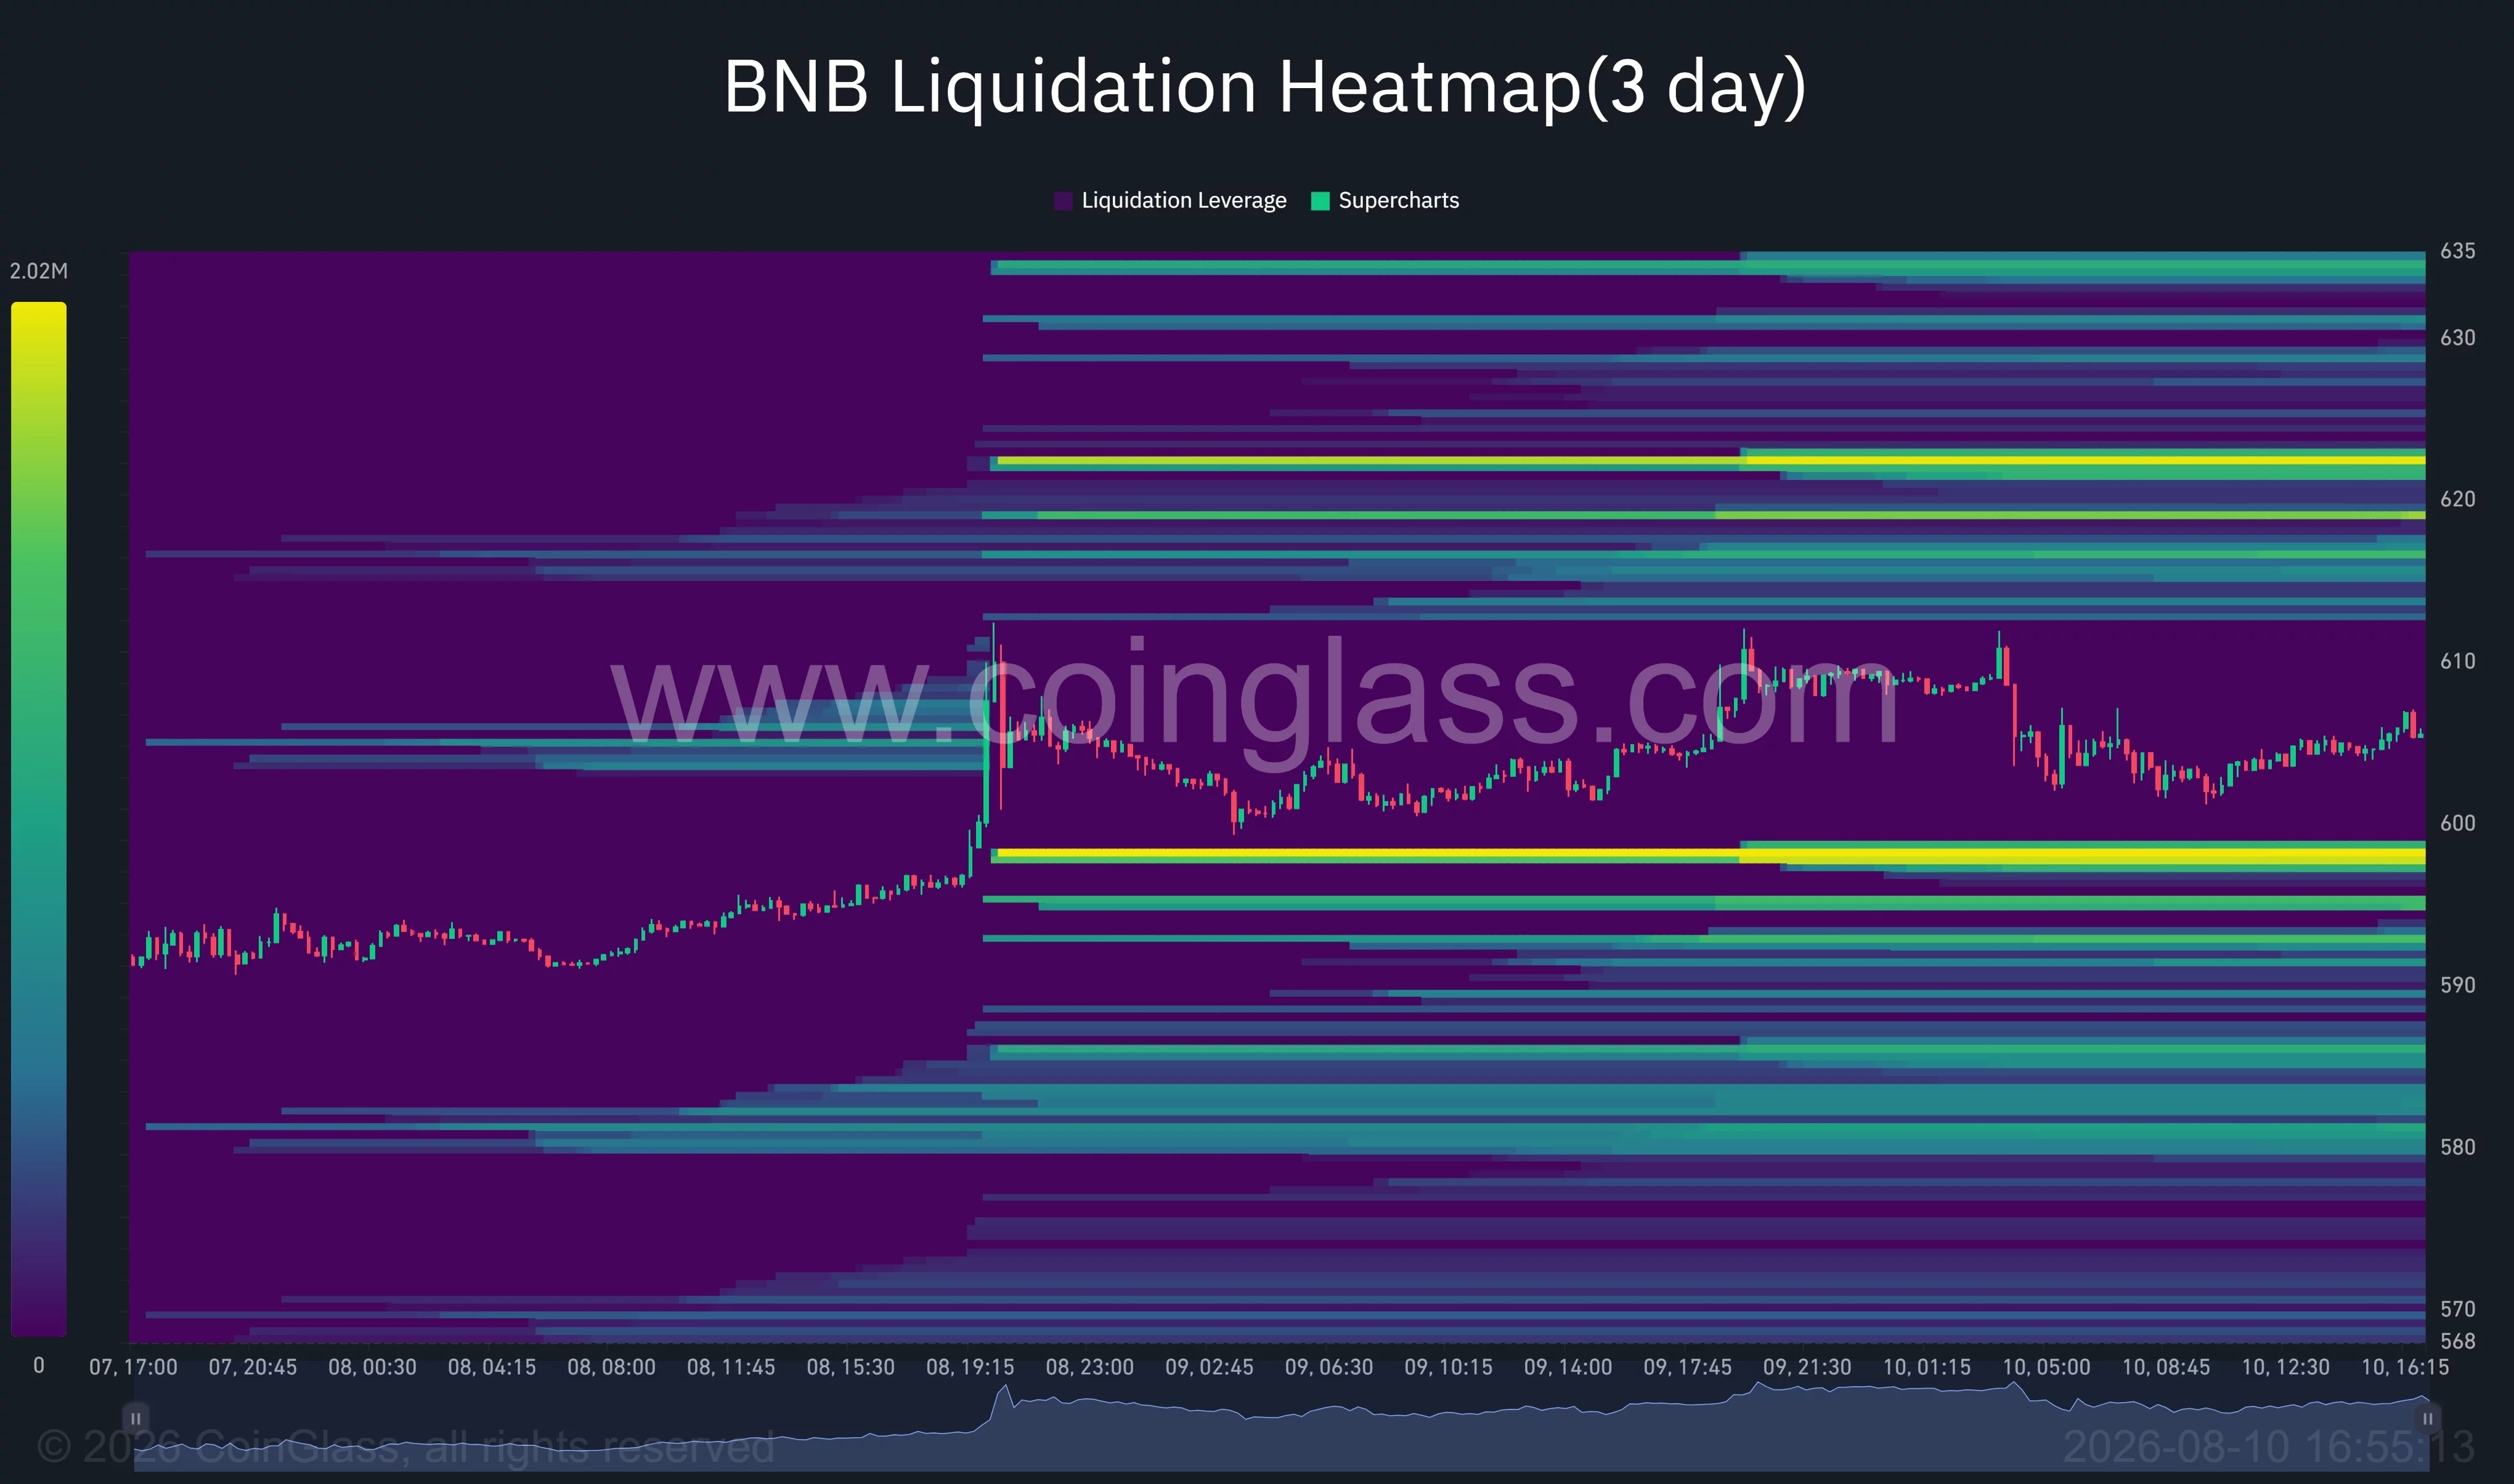
Beyond that, the 200-day moving average at $628.51 represents the main daily resistance. Additional liquidity appears near $630 and $635, making the broader $628–$635 region a difficult area for bulls to clear.
On the downside, the closest liquidity pool is around $598. That level sits just below the psychological $600 mark and could attract price during a short-term correction.
The Supertrend at $593.86 provides the next support. Losing that level would weaken the 4-hour structure and expose the 20-day moving average at $583.47. The 50-day moving average near $575.50 would become the deeper invalidation level for the current recovery.
Analyst maps a longer-term path toward $780
Crypto commentator DongPham said BNB has recorded three constructive weekly closes but remains in a broader retracement after losing a long-term uptrend around $673 in February.
The analyst identified $780–$790 as a possible longer-term retest area. Reaching that target would require BNB to first reclaim the $628–$635 resistance zone and then break above the former trend level near $673.
DongPham also noted that trading volume had not increased alongside the latest recovery. That divergence matters because a price rise without stronger participation may struggle to continue through multiple resistance levels.
The short-term charts support a more measured target. BNB first needs to hold $600 and close above $610 before the liquidation clusters at $618–$623 become attainable. The $780–$790 projection remains a longer-term scenario rather than an immediate target.
Losing $594 could invalidate the bullish setup
For US traders, BNB remains sensitive to broader moves in Bitcoin, Ethereum and global risk assets. Changes in US interest-rate expectations, Treasury yields and the dollar can affect demand for higher-risk crypto assets even when BNB’s immediate setup is driven by technical levels.
BNB also carries exchange-specific risk because of its close association with the Binance ecosystem. Its availability and liquidity can differ across US trading platforms, so American investors may face different spreads and execution conditions from traders using global exchanges.
The short-term bias remains constructive while BNB stays above $593.86. A confirmed break above $610 could trigger a move toward $618–$623, while failure to defend $598 would put the current breakout attempt at risk.
Disclosure: This article does not represent investment advice. The content and materials featured on this page are for educational purposes only.
USD/JPY finds itself at the centre of one of the most dramatic currency stories this summer. Having weakened to a four-decade low near ¥164, the yen was pulled back sharply after Japan and the US carried out a coordinated intervention, with Tokyo reportedly spending around $34 billion in a single session to defend its currency. The move briefly pushed the pair toward ¥155, though the yen has since given back some of those gains, trading back near ¥158 as doubts persist over how long intervention alone can hold.
The underlying driver remains the wide gap between US and Japanese interest rates, made worse by rebounding oil prices following renewed tensions in the Strait of Hormuz. Markets are now watching for a possible BoJ hike in September, encouraged by six straight months of rising real wages, while the Fed’s own July dissents—three policymakers pushed for a hike over a hold—keep US rates firmly in the driver’s seat too.
With both central banks now genuinely in play, USD/JPY’s next move looks set to hinge on which side moves first: Tokyo’s rate decision, or Washington’s next data-driven signal.
Technical Analysis of USD/JPY
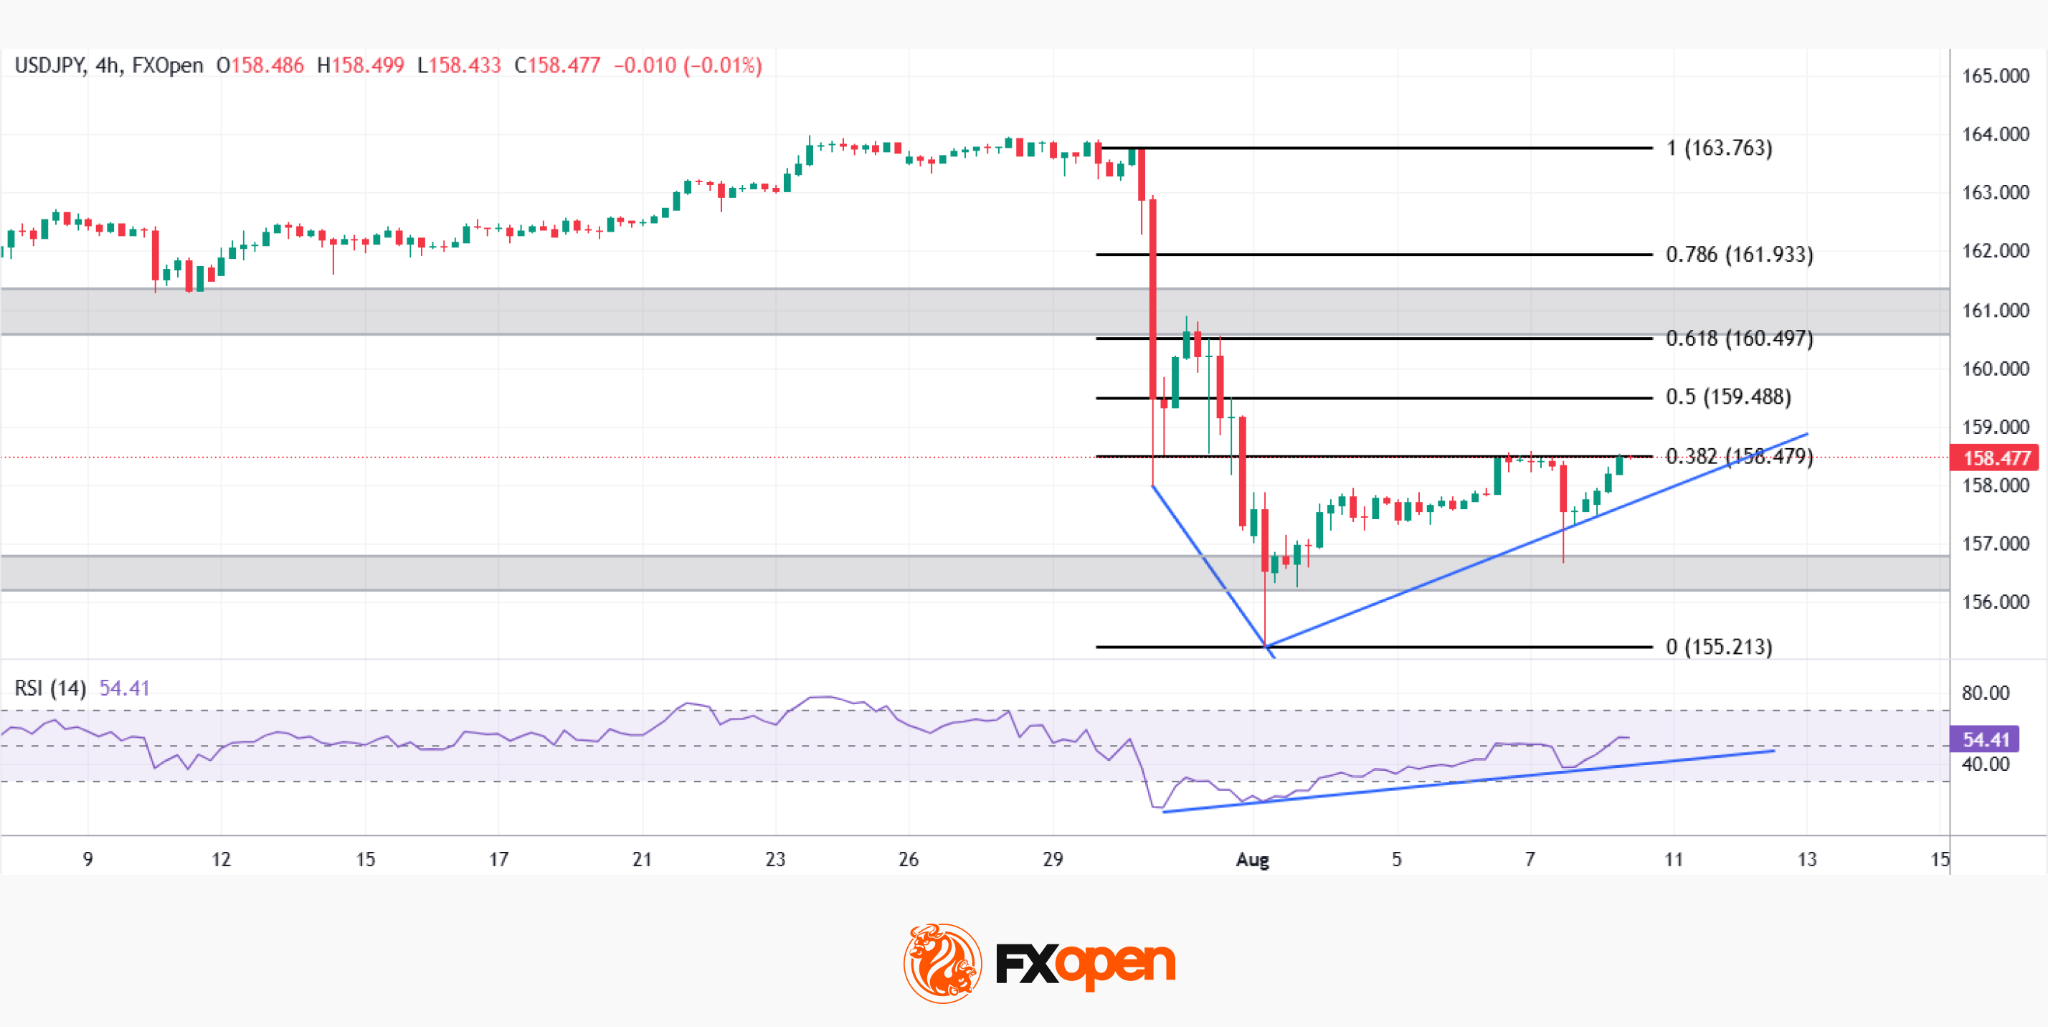
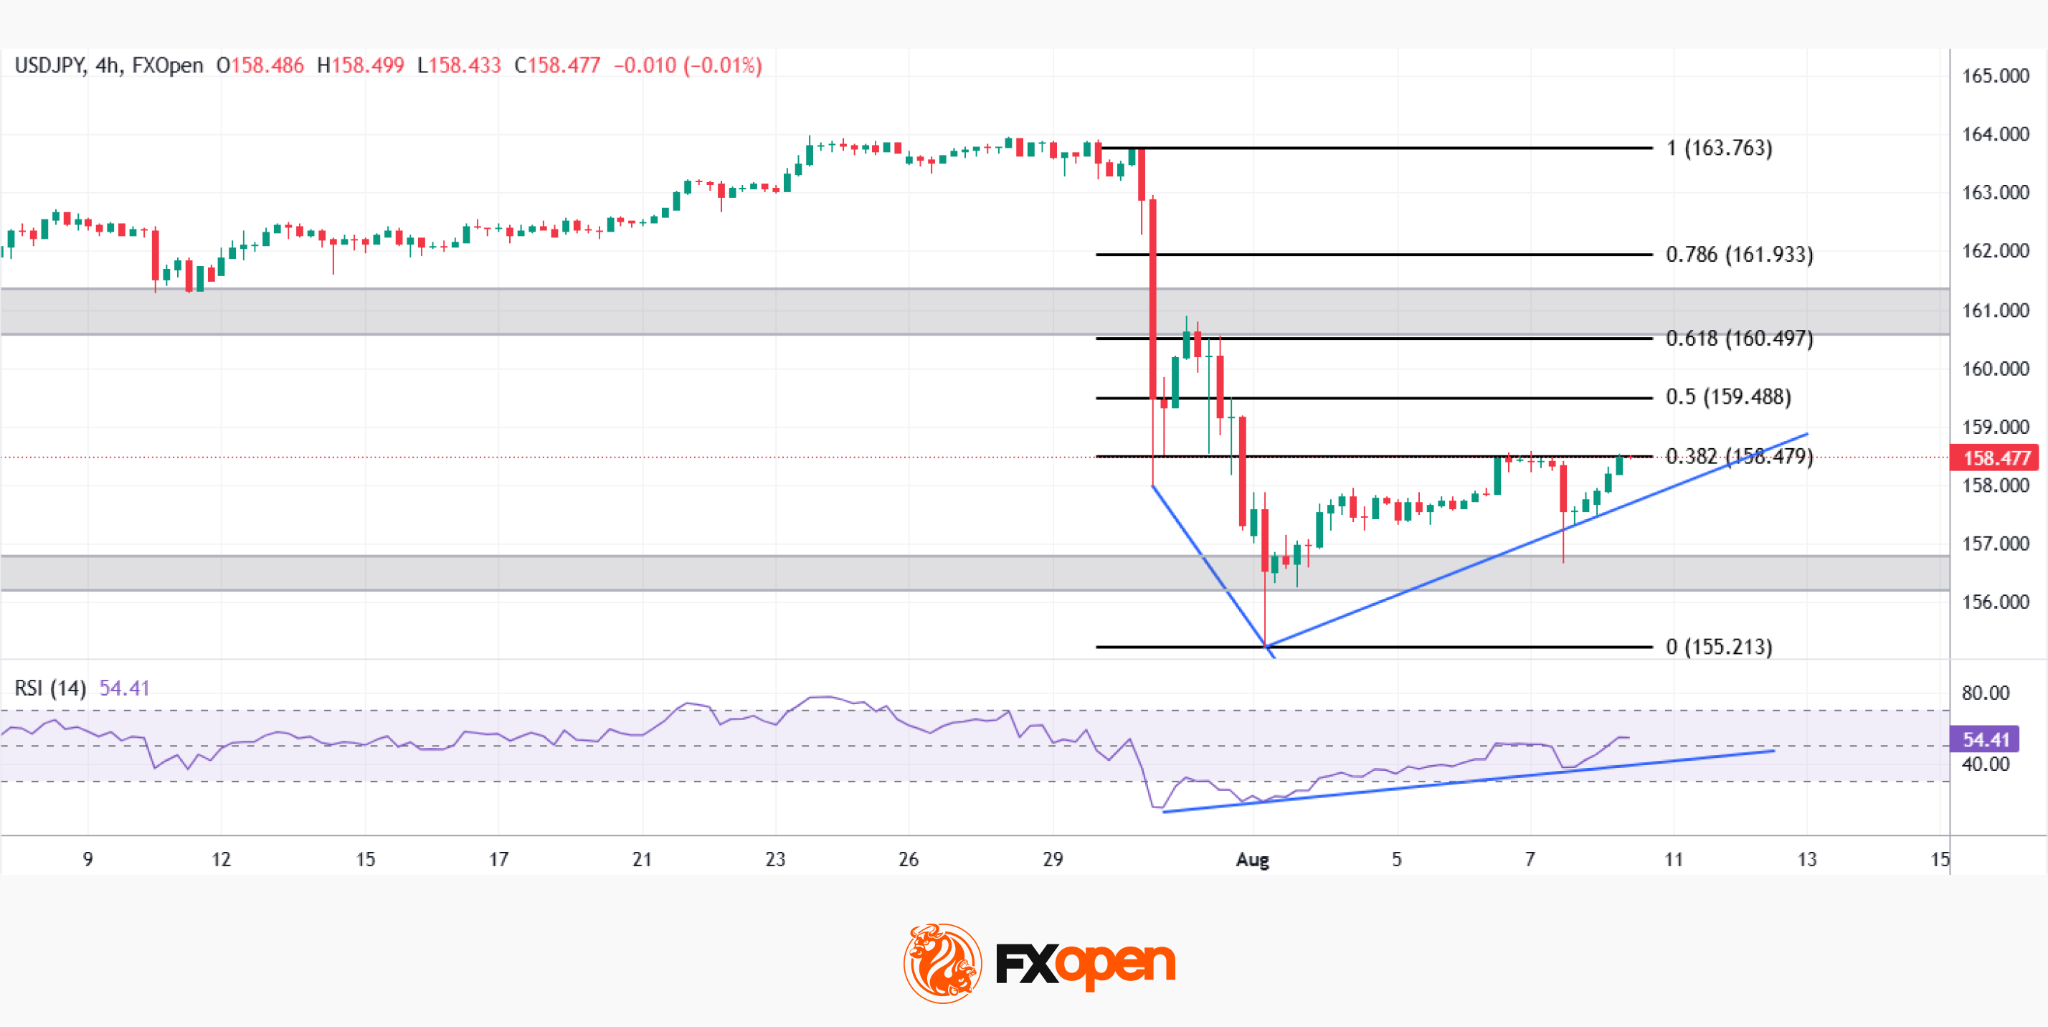
As the USD/JPY chart shows, the pair collapsed sharply after the coordinated intervention, dropping from the 163.76 highs to a low near 155.21 before staging a steady recovery. Price is now testing the 0.382 Fibonacci retracement near 158.48, supported by an ascending trendline off the intervention low, with the RSI showing a bullish divergence as it prints higher lows even as price briefly retested the range.
Bullish Scenario
Should buyers hold the ascending trendline and break decisively above the 0.382 retracement, the path would open toward the 0.5 level near 159.49, with a stronger move targeting the 0.618 retracement around 160.50, where deeper resistance likely awaits.
Bearish Scenario
Conversely, a break below the ascending trendline would invalidate the current recovery structure, exposing a retest of the intervention low near 155.21-156.00, with the RSI divergence losing credibility if price fails to hold this zone.
With price coiled right at the 0.382 confluence, and both the trendline and RSI hinting at renewed strength, USD/JPY looks set for a decisive move—will the recovery from intervention extend, or will Tokyo’s defence prove only temporary?
Trade over 50 forex markets 24 hours a day with FXOpen. Take advantage of low commissions, deep liquidity, and spreads from 0.0 pips (additional fees may apply). Open your FXOpen account now or learn more about trading forex with FXOpen.
This article represents the opinion of the Companies operating under the FXOpen brand only. It is not to be construed as an offer, solicitation, or recommendation with respect to products and services provided by the Companies operating under the FXOpen brand, nor is it to be considered financial advice.
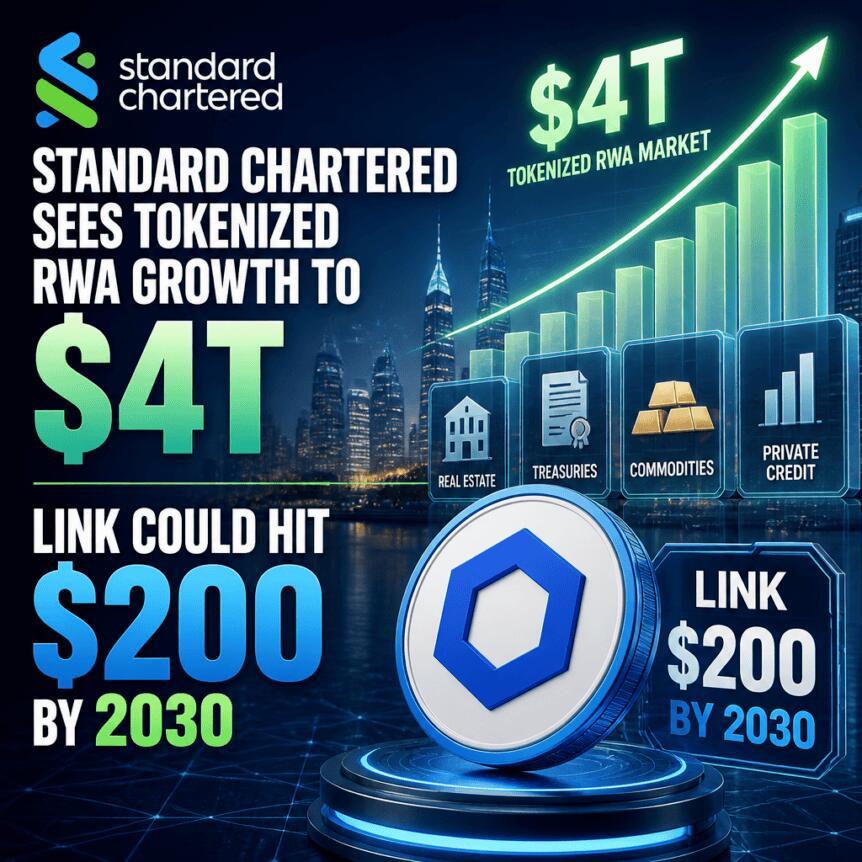
Standard Chartered’s Geoff Kendrick has outlined a bullish long-term scenario for Chainlink’s LINK token, arguing that the accelerating rollout of tokenized real-world assets could significantly expand demand for secure onchain data infrastructure.
In a Monday report shared with Cointelegraph, Kendrick suggested tokenized assets reaching $4 trillion by the end of 2028 could translate into a more than 25-fold increase in LINK by the end of the decade—potentially pushing the token toward $200 by 2030, compared with roughly $8 at the time of the analysis.
Key takeaways
- Standard Chartered forecasts tokenized real-world assets could reach $4 trillion by end-2028, which the report links to increased onchain data needs.
- Kendrick argues that securely bringing external data onchain at scale may raise Chainlink’s fee generation, supporting an end-2030 outlook of $200 for LINK.
- The bank also projected a 37-fold rise in tokenized and crypto-native assets deployed in DeFi, reaching $2.7 trillion by 2030.
- Cointelegraph notes that tokenized RWA trading on decentralized exchanges reached a new all-time high of $141 billion in July, according to CryptoRank data.
- Standard Chartered flagged several risks to its LINK price view, including slower institutional tokenization, competitive pressure from other oracle providers, and potential technical issues.
Why tokenized assets could boost oracle demand
Kendrick’s thesis centers on a practical bottleneck: as tokenized real-world assets move onto blockchains, the ecosystem increasingly depends on reliable, permissioned, and verifiable information to function correctly onchain.
According to the report, tokenized assets will require “external data” to be brought securely onchain. Kendrick linked this to potential increases in Chainlink’s fee generation, suggesting that the LINK token could benefit if tokenized asset growth translates into broader network usage.
The bank’s onchain growth scenario for DeFi and tokenization
The report does not focus solely on tokenized RWA volumes. It also points to broader DeFi expansion, forecasting a 37-fold increase in tokenized and crypto-native assets deployed in decentralized finance—rising to $2.7 trillion by the end of 2030.
To support that kind of growth, Kendrick argued these assets will need more than just tokenization mechanics. The report highlights requirements including trusted data sourcing, interoperability between networks, privacy-preserving compliance, and integrations with existing financial systems.
In Kendrick’s view, meeting these needs is a capability currently embodied by Chainlink—an argument framed around the role of decentralized oracle infrastructure and the practical integration of offchain information into onchain applications.
Market momentum: tokenized RWA activity on DEXs keeps rising
The bullish framework arrives as tokenized RWA trading activity appears to be gaining traction in public markets.
Cointelegraph cited CryptoRank data showing tokenized RWA trading on decentralized exchanges reached a new all-time high of $141 billion in July. The same dataset was described as representing a 19.5% month-over-month increase, with public equities listed as a major driver.
That growth aligns with the report’s underlying premise: if more tokenized products—particularly those tied to traditional financial instruments—are actively traded onchain, the ecosystem’s dependency on secure and interoperable data workflows tends to rise in parallel.
Chainlink’s competitive positioning and the risks to the forecast
Standard Chartered’s bullish conclusion also builds on Chainlink’s standing in the oracle sector.
The report referenced crosschain oracle infrastructure metrics compiled by data aggregation services. Cointelegraph notes that Chainlink is ranked as the leading decentralized oracle provider for crosschain communication, citing $34.4 billion in total value secured, while Chronicle is listed second with $7.36 billion, according to DefiLlama’s oracle data.
Even with that positioning, Kendrick’s report included explicit caveats. Standard Chartered said risks to its LINK price forecast include slower-than-expected institutional tokenization initiatives, competition from specialist oracle providers, and potential technical setbacks that could affect performance or adoption.
What investors should watch next
Whether LINK reaches the kind of valuation implied by Standard Chartered’s end-2030 outlook will depend on how quickly real-world asset tokenization scales beyond pilots, and whether oracle infrastructure sees sustained fee growth alongside rising onchain trading and DeFi deployment. Readers should monitor both RWA adoption metrics and signs of intensifying oracle competition or execution risk.


The U.K.’s financial watchdog is preparing rules for tokenized gold as part of its digital asset strategy to ensure London maintains its status as the top global hub for the trade of the precious metal.
The Financial Conduct Authority (FCA) approached financial institutions to explore tokenized gold regulations to foster market growth, the Financial Times reported Monday, citing people familiar with the plans.
London’s over-the-counter market (OTC) market has historically ranked as the number one center for gold trade and currently accounts for 70% of the world’s notional trading volume, according to the World Gold Council. However, London’s dominance is being increasingly challenged by China.
The tokenization of gold is the process by which digital tokens are created to represent ownership rights in physical gold, with the token issuer holding the gold as backing.
The FCA, which has also discussed digitizing the wholesale financial markets, is seeking feedback on the role tokenized gold could play as collateral in wholesale markets and is expected to announce progress on drafting new rules for tokenized digital assets within the next few months, the report said.
The regulator had not responded to CoinDesk’s request for further comment at press time.


Crypto exchange Coinsbuy lost more than $8 million in a coordinated attack across TRON and Ethereum on Aug. 9, according to onchain data reviewed by blockchain security researchers.
The attacker began with a 5 USDT transaction before draining eight TRON wallets of 6.04 million of the dollar-pegged stablecoin in about an hour. On Ethereum, three wallets were simultaneously emptied of 1.89 million USDT and 77 ETH, which was swapped to ETH via 1inch through a wallet created the same day.
Onchain records show the two chains were linked through cross-chain swapper Bridgers, whose Ethereum payout contract sent funds directly into the Ethereum swap wallet, connecting what appeared to be separate operations into a single incident.
The attacker routed some 79% of the stolen funds through instant exchange FixedFloat using roughly 50 single-use addresses. ChangeNOW separately froze a six-figure sum after being contacted by Specter Investigations.
Around 282 ETH, roughly $542,000, across five addresses remains unmoved.

What to expect in Wisconsin’s state primary

Monday Stock Falls As Software Maker’s Guidance Trumps Earnings Beat

Bitdeer increased Bitcoin mining output by nearly fivefold in Q2

Renter of Home in Anne Heche Crash Denies Settlement With Son

No Jackpot Winner as $257 Million Prize Rolls Over to $269 Million Monday Draw

Weekend Open Thread: Staud – Corporette.com

Warren Buffett on ChatGPT and A.I.: It’s ‘extraordinary’ but don’t know if it’s ‘beneficial’ #Shorts

CRAZY CLARITY IS DONE?! BULLISH XRP SOLANA AND CHAINLINK UPDATES! #xrp #crypto #bitcoin n

How Much Bitcoin Do You Need To Be Financially Free
-

 Fashion3 days ago
Weekend Open Thread: Mattifying Sunscreen
-

 Fashion3 days ago
Frugal Friday’s Workwear Report: Cap-Sleeve Pointelle Crewneck Sweater
-

 Sports4 days ago
Jordan Coyle & Cordiamo take Laya Arena Stakes at RDS
-

 News Videos2 days ago
Can Astrology Help Find Gold and Silver Trends? A Financial Astrology Guide
-
 Business5 days ago
US stocks: Dow closes at record on Mideast optimism; SpaceX, AMD drag Nasdaq
-
 Crypto World7 days ago
US Tech Stocks See Largest 5-Week Inflow in History: Can Nasdaq Break Its Downtrend?
-

 Politics4 days ago
Reform UK And Greens Sink To Lowest Favourability Ratings To Date
-

 Business6 days ago
Nvidia Stock Climbs 2.5% as Chip Sector Rally Builds Ahead of AMD Earnings, Nvidia’s Own Report Looms
-

 Crypto World6 days ago
Polymarket targets $20 billion valuation as competition heats up in prediction market sector
-

 Tech5 days ago
OpenAI, Anthropic AI agents targeted real people and systems in cyber tests
-

 Business5 days ago
Supply chain issues impact Ingredion
-
 Crypto World6 days ago
CLARITY Act Senate Vote Locked In, But 60-Vote Hurdle Looms Large
-

 Tech3 days ago
Rinn Pharma & Biopharma to join NordicPharmaTrain network
-

 Crypto World6 days ago
The Senate has one week: CLARITY’s last August window
-
 Crypto World5 days ago
Dow and S&P 500 Hit Records on AI Earnings: When Will the Bubble Burst?
-
 Crypto World7 days ago
California Wildfire Bets Expose Polymarket’s Dark Side
-

 Business1 day ago
How to Start a Cleaning Business: A Step-by-Step Guide
-

 Business1 day ago
Datadog: Best Of Breed For Multiple Reasons
-

 Business7 days ago
CNH Industrial Shares Jump Over 15% After Beating Estimates and Raising Full-Year Earnings Guidance
-

 Crypto World6 days ago
New York sued, who is next
You must be logged in to post a comment Login