

Crypto World
Liquidity Time Preference Markets (Shadow TVL)
Reimagining DeFi Liquidity Through Time. Decentralized Finance has largely measured its strength using one metric: Total Value Locked (TVL). Billions of dollars sit inside smart contracts, signaling capital commitment, protocol confidence, and market depth. But TVL has a hidden flaw: it ignores time.
A dollar locked for 5 minutes and a dollar locked for 5 years are treated the same.
This blind spot opens the door to a new primitive in DeFi design: Liquidity Time Preference Markets, also known as Shadow TVL.
The Problem With Traditional TVL
TVL answers one question:
“How much capital is inside a protocol right now?”
But DeFi users behave very differently depending on how long they intend to stay.
Consider three liquidity providers:
| Provider | Capital | Lock Duration |
|---|---|---|
| Trader A | $1M | 30 minutes |
| Yield Farmer B | $1M | 7 days |
| DAO Treasury C | $1M | 2 years |
Traditional TVL says:
TVL = $3M
But economically, these deposits are not equal. The DAO treasury provides structural stability, while Trader A provides temporary liquidity that could vanish instantly.
This creates the concept of Shadow TVL — a deeper metric that accounts for time-weighted liquidity commitment.
What is Shadow TVL?
Shadow TVL = Liquidity adjusted by time commitment.
Instead of measuring only how much capital is present, Shadow TVL measures:
-
How long is liquidity expected to remain
-
How stable is the capital base, actually?
-
The protocol’s real economic security
Example:
| Deposit | Amount | Lock Duration | Shadow Value |
|---|---|---|---|
| $1M | 1 hour | 0.0001 weight | |
| $1M | 30 days | 0.3 weight | |
| $1M | 2 years | 1.0 weight |
Even though TVL is $3M, Shadow TVL may only equal ~$1.3M in stable liquidity.
This reveals the true durability of a protocol’s liquidity base.
Introducing Liquidity Time Preference Markets
Rather than just measuring time preference, DeFi could trade it directly.
A Liquidity Time Preference Market allows participants to buy and sell liquidity commitment durations.
Participants could trade:
-
Short-term liquidity rights
-
Long-term liquidity guarantees
-
Liquidity futures contracts
Think of it like interest rate markets, but for capital patience.
How It Could Work
Step 1 — Liquidity Commitment Tokens
When depositing liquidity, users mint a token representing their lock duration.
Example tokens:
-
LQ-1D → Liquidity locked for 1 day
-
LQ-30D → Liquidity locked for 30 days
-
LQ-365D → Liquidity locked for 1 year
These tokens represent time-bound liquidity guarantees.
Step 2 — Secondary Markets
These liquidity commitments become tradable assets.
Traders could speculate on:
-
Liquidity shortages
-
Market volatility
-
Protocol stability
Example:
If traders expect high volatility next month, 30-day liquidity tokens become more valuable, because protocols will need deeper liquidity.
Step 3 — Shadow TVL Pricing
Protocols could use market prices of these tokens to compute Shadow TVL in real time.
Instead of:
TVL = $500M
Protocols would show:
Shadow TVL = $500M capital with 87-day average commitment
This creates a liquidity durability index.
Why This Changes DeFi Economics
1. Eliminates “Mercenary Liquidity.”
Yield farmers often chase incentives and exit instantly.
Liquidity Time Markets reward long-term capital commitment, reducing unstable liquidity.
2. New Derivatives Market
Liquidity duration becomes a financial asset.
Examples:
DeFi could develop a yield curve for liquidity similar to government bond markets.
3. Predictable Protocol Stability
Protocols could price risk based on how long liquidity is expected to remain.
A DEX with:
is far more stable than one with $200M TVL but a 2-day commitment.
4. Capital Efficiency
DAOs and funds could optimize treasury deployment by selecting liquidity durations matching their risk profile.
Example:
| Strategy | Liquidity Duration |
|---|---|
| Arbitrage Funds | 1–3 days |
| Market Makers | 30–90 days |
| DAO Treasuries | 1–3 years |
Liquidity becomes programmable over time.
The Emergence of a Liquidity Yield Curve
Just like traditional finance has a bond yield curve, DeFi could develop a Liquidity Commitment Curve.
Example market rates:
| Duration | Expected Yield |
|---|---|
| 1 day | 2% APR |
| 30 days | 7% APR |
| 1 year | 18% APR |
This curve reflects market demand for liquidity stability.
During volatile markets, long-duration liquidity becomes extremely valuable.
Potential Use Cases
Stablecoin Defense
Stablecoin protocols could require a minimum liquidity duration for collateral pools.
This prevents bank-run style liquidity collapses.
MEV Protection
Validators and builders could secure blockspace liquidity guarantees, ensuring deep order books even during congestion.
DeFi Credit Markets
Lenders could issue loans backed by liquidity commitment tokens, turning liquidity guarantees into collateral.
Risks and Challenges
Despite its promise, Liquidity Time Preference Markets introduce new complexities:
Smart Contract Risk
Liquidity locks and tokenization increase protocol complexity.
Liquidity Fragmentation
Too many duration tokens could fragment capital across markets.
Speculation Loops
Traders might speculate heavily on liquidity scarcity.
However, these risks are similar to those seen in early interest rate derivatives markets in traditional finance.
Why This Idea Matters
DeFi’s biggest weakness is unstable liquidity.
TVL numbers can look impressive, but capital can disappear instantly.
Shadow TVL introduces a missing dimension: time.
Instead of measuring how much liquidity exists, DeFi could measure:
How committed is that liquidity actually?
Liquidity Time Preference Markets turn patience into a tradable financial primitive.
And once time becomes a market…
DeFi doesn’t just have liquidity.
It has predictable liquidity stability.
REQUEST AN ARTICLE

Key takeaways:
-
ETH derivatives signal a shift to safety as professional desks hedge against downside risks and global instability.
-
Institutional preference for decentralization keeps Ethereum dominant despite its recent drop in network activity.
Ether (ETH) price dropped by 6% following a brief rally to $2,200 on Wednesday, tracking a downturn in US equities as the war in Iran entered its sixth day. Disruptions to global oil production and Middle East natural gas shipping pushed WTI crude prices to levels not seen since July 2024.
Investors lowered their economic growth outlook as the conflict escalated and moved to a risk-off posture.
Traders’ sentiment was further pressured as the Trump administration faced a legal setback on its import tariffs. A Federal court on Monday rejected a Justice Department request to pause the case for 90 days, effectively striking down the administration’s use of emergency powers for trade levies.
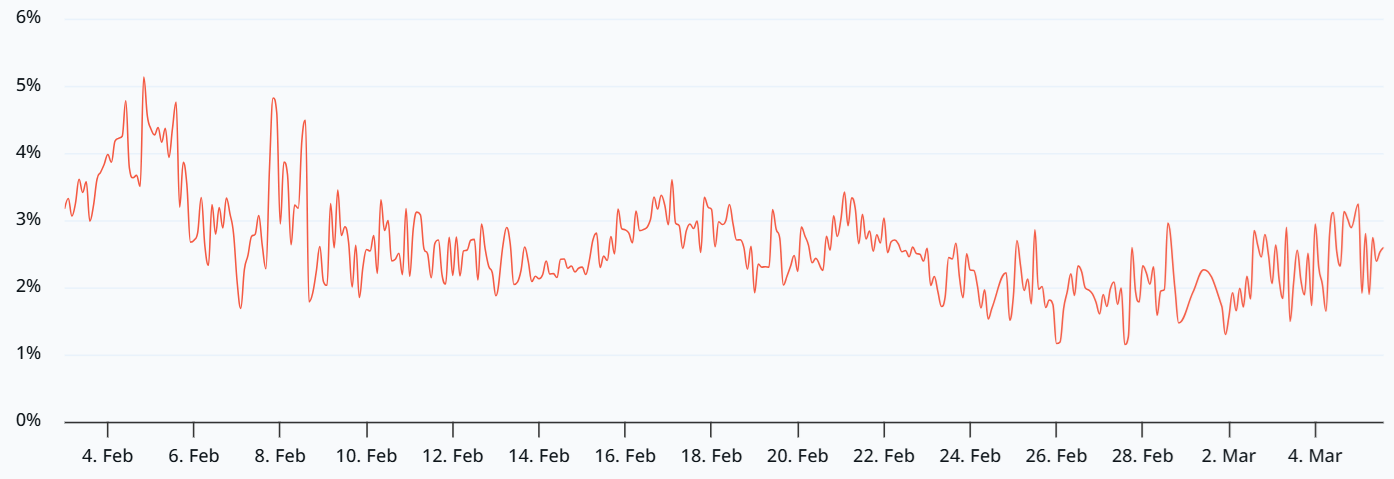
Ether remains caught in this macroeconomic crossfire, which has stifled momentum despite a 22% recovery from the $1,800 retest on Feb. 24. Onchain data and derivatives markets currently reflect significant apathy from bulls.

The ETH 30-day futures annualized premium sits well below the 5% neutral threshold, signaling a lack of demand for bullish leverage. However, this metric is weighed down by the fact that ETH trades 58% below its August 2025 all-time high of $4,956. To gauge whether professional desks anticipate further downside, one must analyze the options market.
When whales and market makers seek protection against price drops, the ETH options skew (put-call) typically rises above the 6% neutral mark. Extreme market stress can push this indicator past 15%.

The ETH options skew reached 7% on Thursday after briefly touching neutral levels a day prior. This persistent skepticism among professional traders provides bears with the necessary leverage to fuel further uncertainty. Beyond external macro pressures, including US private credit losses and rising corporate layoffs, Ether continues to face its own idiosyncratic headwinds.
Ethereum is positioned to capture the pickup in DApps demand
Ethereum network activity has stagnated following a modest rally in early February. Consistent demand for blockchain utility remains essential for sustainable ETH price action and reducing inflationary pressure. The built-in burn mechanism of Ethereum depends on competition to enter the validation queue, a process typically fueled by decentralized exchange (DEX) activity.

Weekly DEX volumes on the Ethereum network recently hit $12.6 billion, falling from $20.2 billion one month prior. Decentralized application (DApp) revenues dropped to $14.1 million over seven days, marking a 47% decline from the previous month. Competing blockchains have seen a similar trend, as DEX volumes on Solana also decreased by 50% over the same 30-day window.
Related: Bitcoin trader sees ‘lower soon’ as BTC price starts to erase $74K breakout
Despite the weak onchain metrics, ETH is well-positioned to capture an eventual pickup in DApp activity due to its dominance in total value locked (TVL). When including layer-2 scaling solutions, the Ethereum ecosystem accounts for nearly 65% of the total blockchain market TVL.
Related: 38% of altcoins near all-time lows, worse than FTX crash–Analyst

The Ethereum base layer holds $55.4 billion in TVL, while its leading competitor Solana, accounts for $6.8 billion. This gap serves as evidence of a preference among institutional investors for decentralization over the lower fees and faster user experiences offered by networks like Solana and BNB Chain.
The current weakness in Ether derivatives and onchain metrics does not necessarily signal an imminent price crash. Market sentiment can shift quickly toward a sustained bullish momentum if ETH reclaims the $2,400 level. For the moment, the Ether price remains closely tied to the broader risk-off sentiment, which reduces the odds of a sustainable bullish momentum.
This article does not contain investment advice or recommendations. Every investment and trading move involves risk, and readers should conduct their own research when making a decision. While we strive to provide accurate and timely information, Cointelegraph does not guarantee the accuracy, completeness, or reliability of any information in this article. This article may contain forward-looking statements that are subject to risks and uncertainties. Cointelegraph will not be liable for any loss or damage arising from your reliance on this information.
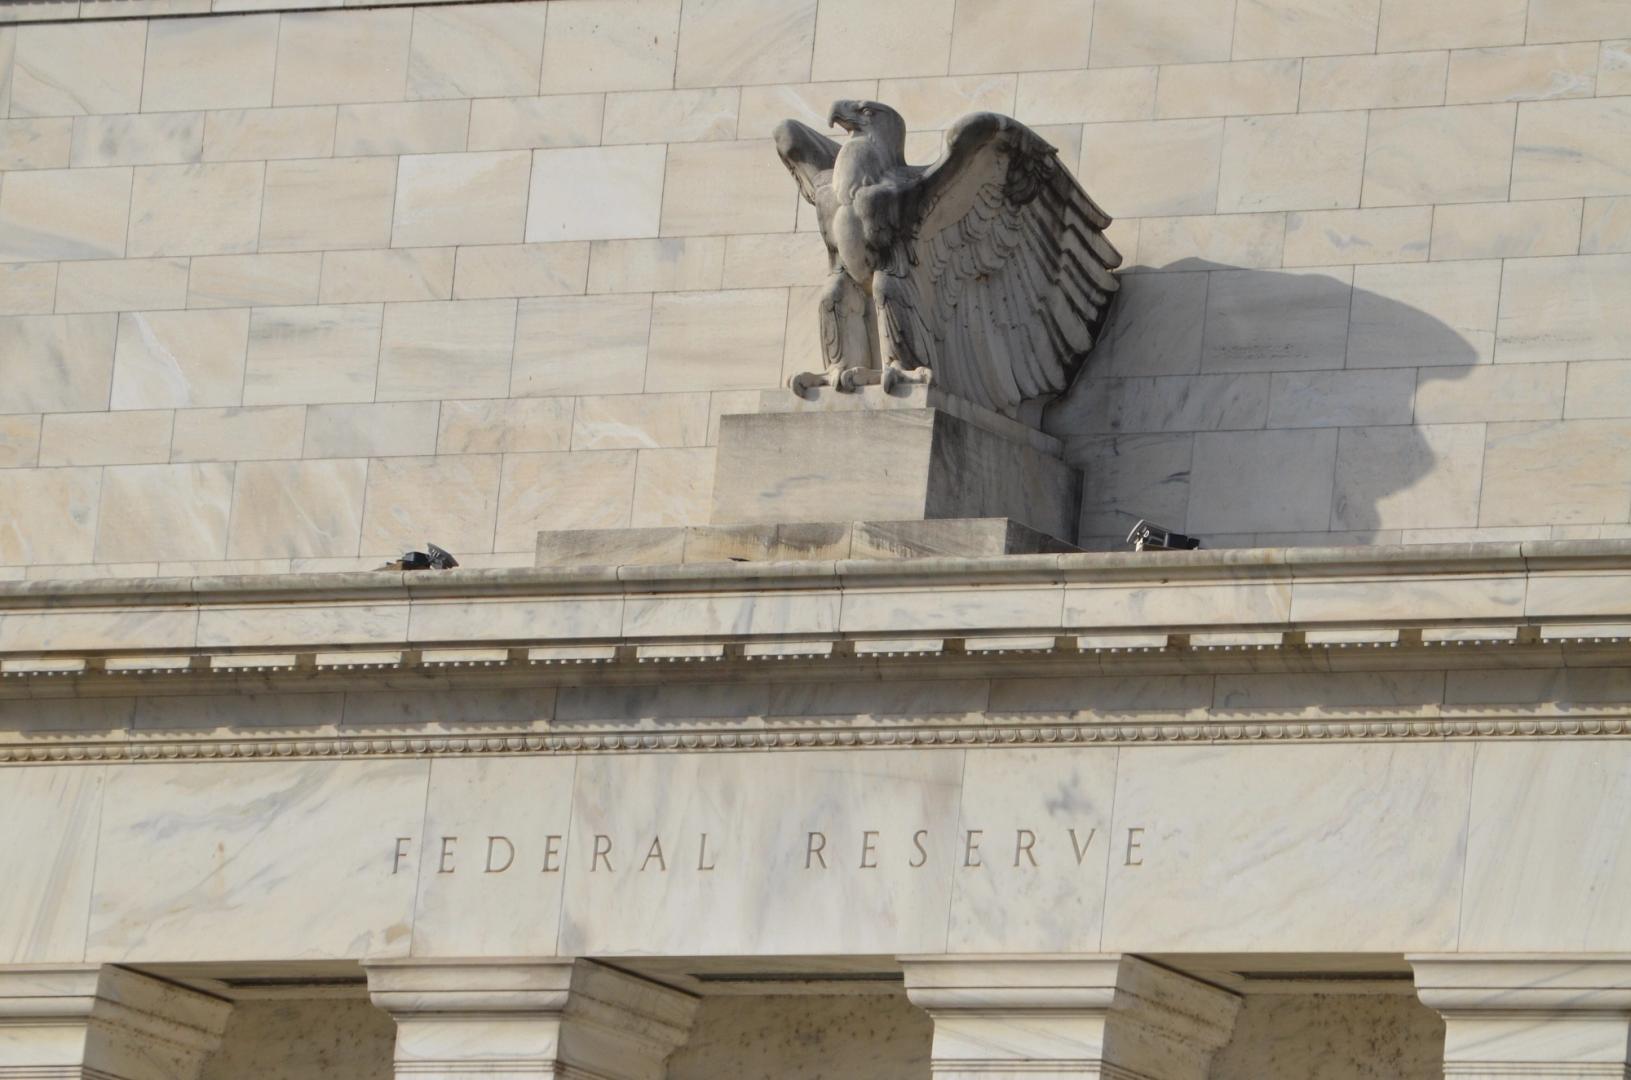

The crypto industry keeps knocking down the barriers into the core U.S. financial system, and digital assets exchange Kraken’s approval for a limited Federal Reserve account marked another such milestone that analysts think could be the first of a trend.
The crypto arrival inside the Fed payment system — provisional and limited though it is — has aggravated the traditional banks and injected some confusion in the Fed’s ongoing effort to write policies for how crypto firms are supposed to go about getting limited “skinny” master accounts. But Kraken’s Co-CEO Arjun Sethi said that this development represents “what it looks like when crypto infrastructure matures into core financial infrastructure.”
Kraken’s Wyoming-chartered banking arm, Payward Financial, is granted a year of access to a “limited purpose” account as a “Tier 3” entrant, according to the Federal Reserve Bank of Kansas City, one of a dozen regional banks in the Federal Reserve system.
“We see this as the first of many Federal Reserve approvals for crypto entities to obtain master accounts, which gives them direct access to the central bank payment rails including Fed Wire,” said Jaret Sieburg, a Washington policy analyst at TD Cowen, in a client note on Thursday. “Crypto entity access to master accounts was inevitable under President [Donald] Trump, given his support for the crypto sector. We expect additional announcements in the coming months.”
Ian Katz, an analyst who tracks federal financial policies at Capital Alpha in Washington, echoed that sentiment.
“The Fed’s decision could open the doors for other crypto operations including Circle, Anchorage and Custodia, a Wyoming-based firm that has unsuccessfully sued the Fed over the right to have a master account,” he noted.
What does direct access to the Fed payments systems mean for Kraken?Potentially, according to Sethi: instant “settlement between fiat and crypto, institutional-grade cash management integrated with digital asset custody and programmable financial products built within a fully regulated framework.”
Those who operate traditional banks in the U.S. were displeased with the Kraken development — the latest threat they’ve flagged from the crypto space.
“There are significant risks to expanding direct Fed account access to institutions that operate outside the traditional banking regulatory framework,” the Independent Community Bankers of America said in a statement. “The Fed should continue limiting master account access to institutions that meet the financial services sector’s highest standards.”
But former Kraken CEO and current chairman, Jesse Powell, celebrated the development.
“We’re the bankers now,” the Kraken co-founder posted on social media site X. “Saddle up.”
Other crypto-tied institutions have also sought entry onto the Fed rails, including Anchorage Digital (which has sought a full master account, which would include earning interest on reserves placed with the Fed) and the recent arrival among federally approved trust banks, Erebor Bank. The industry also continues to lobby the Fed on its effort to establish a new policy to replace the 2022 guidance that Kansas City’s Kraken decision was based on.
At the national level, the Federal Reserve board started writing new policies for establishing what are commonly referred to as “skinny” master accounts for firms that don’t need the entire array of traditional master account services. But that process is in the early stages, and if regional Fed banks start approving similar accounts in the meantime, it could create uncertainties about what happens when the new policy is set.
“This action ignores public comment that the Federal Reserve sought on this framework, and it was issued with no transparency into the process for approval or the risk mitigants that have been imposed to address the very significant risks it raises,” the Bank Policy Institute’s co-head of regulatory affairs, Paige Pidano Paridon, said in a statement.
The Fed board in Washington, where the central bank is headquartered, deferred requests for comment this week to Kansas City.
The regional Fed banks, of which there are a dozen throughout the U.S., each operates under its own priorities and management, which can make their decisions uneven on such matters. So it’s uncertain whether the location of the Fed hub — Minneapolis for Anchorage Digital, for instance, and Cleveland for Erebor — will affect their outcomes.
The Kansas City Fed will keep working with firms there “to help ensure that access to the payment system supports a level competitive field and reinforces the stability and resilience that has underpinned the Federal Reserve’s payment system offerings throughout its history,” said President Jeff Schmid.


The U.S. Securities and Exchange Commission reached a settlement with Tron and founder Justin Sun on Thursday, the SEC said in a court filing.
Under the terms of the settlement, Rainberry Inc., one of the companies associated with the Tron network, will pay a $10 million fine and be barred from future violations of securities regulations. The SEC sued Sun and Tron in 2023, alleging violation of federal securities laws through the sale and airdropping of TRX.
“The remaining claims against Rainberry would be dismissed with prejudice,” the filing said. “The Final Judgment would also dismiss all claims against Justin Sun, Tron Foundation, and BitTorrent Foundation.”
With prejudice means the SEC would not be able to bring a similar case again in future for the same conduct.
“The Commission has reviewed and approved the terms of the settlement, as reflected in the Consent and proposed Final Judgment. Rainberry, Justin Sun, Tron Foundation, and BitTorrent Foundation have consented to entry of the Final Judgment,” the filing said.
The proposed settlement is still subject to a federal judge’s approval.
At the time the SEC, under the leadership of former Chair Gary Gensler, brought a number of lawsuits against crypto firms.
The SEC dropped most of these cases after President Donald Trump retook office last January, mostly under Commissioner Mark Uyeda, the acting chair. The commission is now run by Chairman Paul Atkins.
Sun bought about $80 million worth of World Liberty Financial tokens (WLFI) — the token tied to the company partially owned by Trump and his family — after Trump was reelected in 2024. The SEC’s case against Sun was paused last year, alongside numerous other cases the agency brought against crypto firms.


The U.S. Federal Reserve and other regulators told bankers that they need to maintain the same amount of capital to back tokenized securities as they do regulator securities.
“The technologies used to issue and transact in a security do not generally impact its capital treatment,” according to the agencies, also including the Office of the Comptroller of the Currency and the Federal Deposit Insurance Corp. The three sent a new frequently-asked-questions document on Thursday to the banks they regulated.
The legal rights to owners of securities are meant to be the same whichever way the securities transact, and the regulators say the capital should also be the same. The assets themselves may also be used as financial collateral in the same way that securities are, the agencies clarified, “subject to the same haircuts applicable to the non-tokenized form of the security.”
Banks and other financial firms are required by their regulators to maintain capital as a cushion against financial distress, setting aside certain levels of liquid assets to be able to protect themselves and their customers. Setting the same standard for both forms of securities ownership means the crypto-linked assets won’t face more stringent treatment.
The same capital treatment also applies whether the tokens are issued on permissioned or permissionless blockchains, the regulators said, and that technology-neutral approach holds true for the capital tied to derivatives that reference tokenized securities, as well.
Tokenization of securities is a rising segment of crypto activity, in which such assets as stocks, bonds and real estate can be represented in a token issued on a blockchain. The U.S. Securities and Exchange Commission is also working on policies to direct how the tokens are handled.
Capital requirements represent a core compliance demand in the banking business, and clarity on such aspects of crypto capital further advances the assets into melding with U.S. banking. Though U.S. bank watchdogs were hesitant in recent years to embrace crypto and blockchain technology, the incoming leaders appointed during the administration of President Donald Trump last year have made it a special point to champion pro-crypto moves.

TLDR:
- SoFiUSD is the first stablecoin issued by a U.S. nationally chartered and insured deposit bank on a public chain.
- BitGo’s Stablecoin-as-a-Service platform powers SoFiUSD’s minting, burning, and institutional distribution.
- Both SoFi Bank and BitGo Bank & Trust are OCC-regulated, creating a dual-compliance framework for the token.
- The GENIUS Act passage enabled the legal foundation for SoFiUSD’s launch as a bank-issued stablecoin product.
SoFi Bank has launched SoFiUSD, a U.S. dollar-pegged stablecoin running on a public, permissionless blockchain. It is the first stablecoin issued by a nationally chartered and federally insured U.S. bank.
BitGo Bank & Trust, is providing the infrastructure behind the token. The move comes following the passage of the GENIUS Act, which opened clearer regulatory pathways for bank-issued stablecoins.
BitGo Powers Stablecoin Issuance for a Chartered U.S. Bank
BitGo is delivering this through its Stablecoin-as-a-Service platform.
The platform handles technology and operational infrastructure for SoFi Bank’s minting and distribution process. BitGo Bank & Trust is itself OCC-regulated. Both institutions operate under the same regulatory framework, which forms the backbone of the compliance model.
According to the official announcement, BitGo will also work with select payments providers, market participants, and exchanges.
This is designed to expand institutional reach for SoFiUSD. The token targets banks, fintechs, and enterprise treasury operations specifically. It is not positioned as a retail consumer product.
SoFiUSD is pegged 1:1 to the U.S. dollar. Third-party auditors will provide regular attestations to confirm reserve backing. BitGo’s smart contract infrastructure handles minting, burning, and transaction controls. The setup mirrors compliance-first architectures used in traditional finance.
SoFi’s crypto distribution team described SoFiUSD as critical financial infrastructure.
The token is aimed at institutions seeking settlement efficiency around the clock. It targets a specific gap in global treasury operations. Traditional banking rails still close on weekends and holidays.
SoFiUSD Aims to Bridge Regulated Banking and Blockchain Settlement Rails
The GENIUS Act passage has created new legal clarity for bank-issued stablecoins. SoFiUSD is the first product to market under this emerging framework.
BitGo’s infrastructure was built to support large-scale institutional asset flows. That makes SoFiUSD more aligned with wholesale finance than consumer crypto.
The partnership structure keeps regulatory accountability central. Both SoFi Bank, N.A. and BitGo Bank & Trust answer to the OCC. That dual-regulated relationship distinguishes SoFiUSD from stablecoins issued by non-bank entities.
It also positions the token as a potential model for future bank-issued digital currencies.
BitGo has described its Stablecoin-as-a-Service offering as purpose-built for institutions requiring regulatory trust alongside technical capability.
The infrastructure supports 24/7 onchain liquidity. That addresses a longstanding limitation for corporate treasurers managing cross-border payments. Real-time settlement across time zones has historically required multiple intermediaries.
SoFiUSD’s blockchain deployment on a permissionless public chain is notable. Most bank-adjacent digital assets have launched on private or permissioned networks.
This approach increases transparency and external auditability. It also allows third-party integration without requiring special access or agreements.

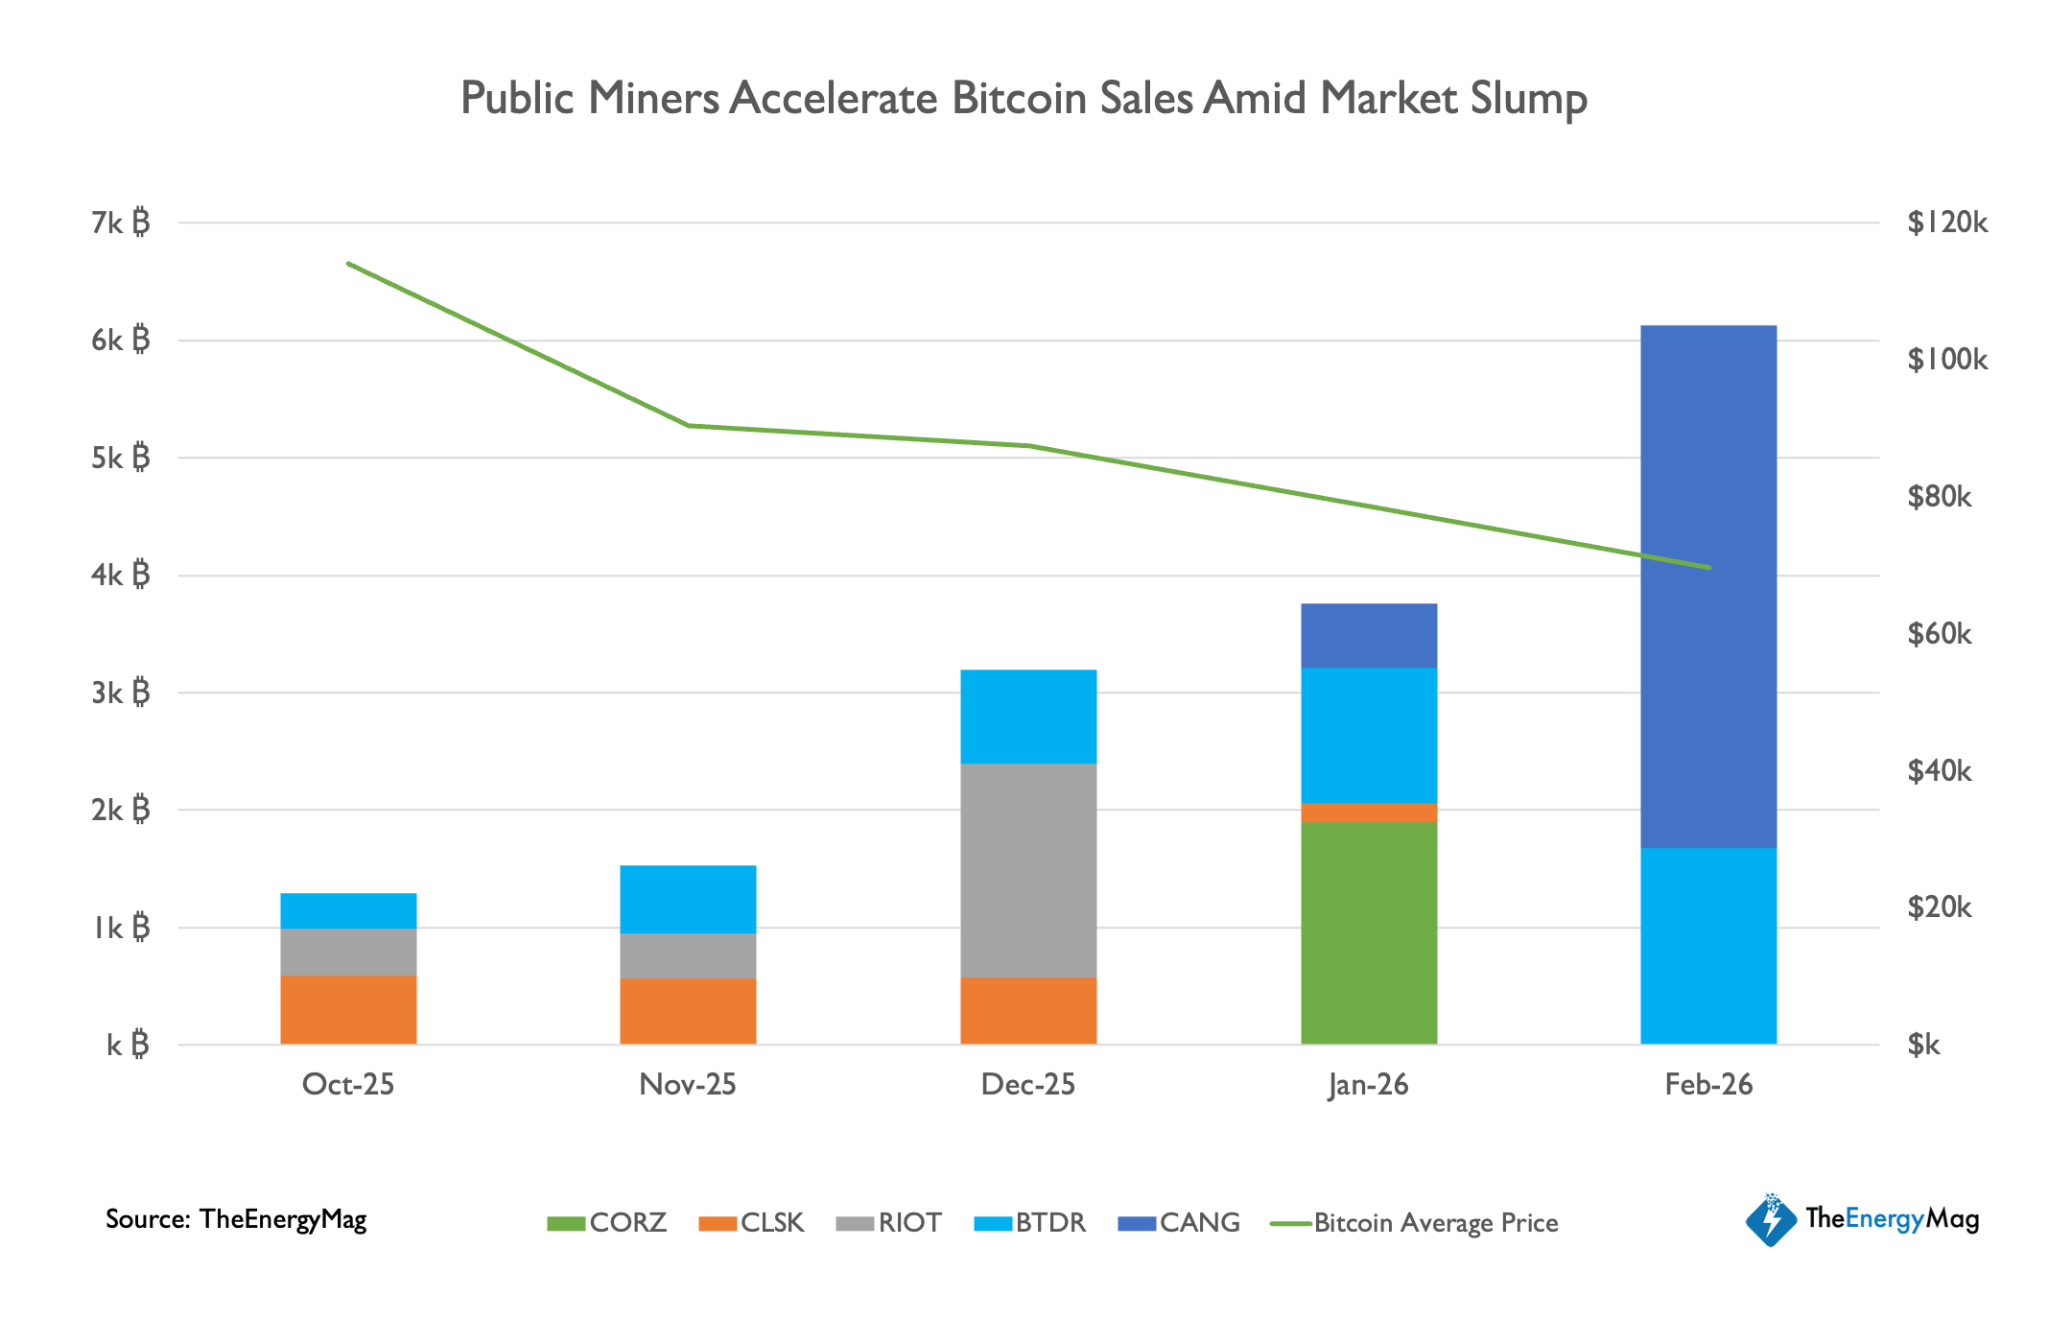
Bitcoin mining companies have offloaded a sizable portion of their Bitcoin reserves in recent months, signaling a shift away from the self-treasury strategy that dominated the industry during the 2024–2025 market upcycle.
According to TheEnergyMag’s Miner Weekly newsletter, publicly listed miners have sold more than 15,000 Bitcoin (BTC) since October. That month marked the market’s peak before a historic flash crash triggered widespread deleveraging across the industry.
Several large miners contributed to the sell-off. The newsletter highlighted Cango’s February sale of 4,451 BTC, equal to roughly 60% of its reserves, as well as Bitdeer, which reportedly liquidated its entire Bitcoin treasury last month.
It also pointed to Riot Platforms’ multiple BTC sales in December and Core Scientific’s plan to sell roughly 2,500 BTC during the first quarter.

MARA Holdings, the largest publicly traded Bitcoin mining company, drew attention this week after updated regulatory filings indicated it may both buy and sell Bitcoin to maintain flexibility and optionality.
Markets initially focused on the potential for sales, prompting vice president Robert Samuels to clarify the company’s position that the filing allows flexible sales but does not signal a majority liquidation.
MARA currently holds more than 53,000 BTC, making it the second-largest public corporate holder of Bitcoin, behind Michael Saylor’s Strategy.
Related: Bitcoin mining’s 2026 reckoning: AI pivots, margin pressure and a fight to survive
Mining companies shift strategy as margins tighten
Bitcoin miners’ recent sales mark a sharp departure from earlier cycle trends, when many companies adopted a de facto “treasury strategy” by holding a larger share of their self-mined BTC on their balance sheets.
At the time, research from Digital Mining Solutions and BitcoinMiningStock.io suggested the holding pattern reflected expectations of further price appreciation. It also coincided with efforts by several miners to strengthen their financial footing while expanding into adjacent businesses such as AI infrastructure, high-performance computing and data center services.
Industry conditions have deteriorated since October, however, with some observers describing the current environment as the harshest margin squeeze on record for mining companies.
The pressure has begun to show on balance sheets. CleanSpark, for example, repaid its Bitcoin-backed credit line in full, a move the company said was aimed at reducing financial risk amid tightening industry margins.
Related: American Bitcoin boosts hashrate with 11,298 new mining machines


Short seller Culper Research is betting against ether (ETH) and ETH-linked stocks such as BitMine (BMNR), arguing that the network’s economics deteriorated following Ethereum’s latest network upgrade.
The firm said in a Thursday report that the December 2025 upgrade dubbed Fusaka flooded the network with excess blockspace and has “impaired ETH tokenomics.” That drove transaction fees sharply lower. Because validators earn part of their income from those fees, the drop has reduced staking yields.
That dynamic could create a negative feedback loop, the report said, where declining validator yields reduce staking demand and network security.
The report also highlighted that Ethereum co-founder Vitalik Buterin sold nearly 20,000 ETH, worth around $40 million at current prices, this year, citing data from blockchain sleuth Lookonchain.
“Vitalik is selling, while bulls like Tom Lee are clueless as to ETH’s new reality,” the report said. “We’re with Vitalik.”
The report pushes back on bullish claims from Lee, chairman of Ethereum-centric treasury firm BitMine, who has pointed to rising transaction counts and active addresses as evidence of stronger network fundamentals.
Culper said those metrics are misleading. Its analysis claimed a significant share of the activity surge stems from address poisoning attacks, a scam tactic where attackers send small transactions to trick users into copying malicious wallet addresses. Culper estimated Ethereum fees have dropped roughly 90% since the upgrade.
“By Lee’s own logic, if utility is NOT going up, then ETH is in a death spiral,” the report said. “This is exactly what we believe is happening.”
The short thesis also targeted BitMine (BMNR), one of the largest corporate buyers of ether.
Since July, the company has accumulated roughly 4.4 million ETH as part of its treasury strategy. With ether prices down significantly from recent highs, those holdings are estimated to be 45% underwater, with BitMine sitting on roughly $7.4 billion in unrealized losses, DropsTab data shows.
BitMine did not return a request for comment by press time.
Read more: Vitalik Buterin reveals his bold new plan to fix Ethereum’s scaling problem

Meanwhile, some market observers believe PI could eventually explode above $1.
The cryptocurrency market continues its impressive recovery, with Pi Network’s PI stealing the show with an impressive 15% daily surge.
However, certain factors suggest that its price could soon turn downward again.
Time to Cool Off?
PI is the best-performing top-100 cryptocurrency today (March 5), with its valuation soaring to a three-week high of $0.20 (per CoinGecko data). Its market capitalization exceeded $1.9 billion, thus making it the 43rd-largest digital asset.
Perhaps the most likely catalyst fueling the rally is the broader revival of the cryptocurrency sector. Bitcoin (BTC) briefly rose to almost $74,000, Ethereum (ETH) neared $2,200, while well-known altcoins like Monero (XMR), Aster (ASTER), and Toncoin (TON) have jumped by 6-7% on a 24-hour scale.
PI’s pump also coincides with the latest updates announced by the Core Team. As CryptoPotato reported, the protocol v19.9 migration was successfully completed. The next version is v20.2, and it is expected to be released before Pi Day 2026 (March 14).
The upcoming token unlocks, though, indicate that PI may not be out of the woods yet. Data shows that a substantial amount of coins will be freed up in the coming days: a development that doesn’t guarantee a price decline but increases immediate selling pressure. March 7 is scheduled as the record day, when almost 21 million PI will be released.
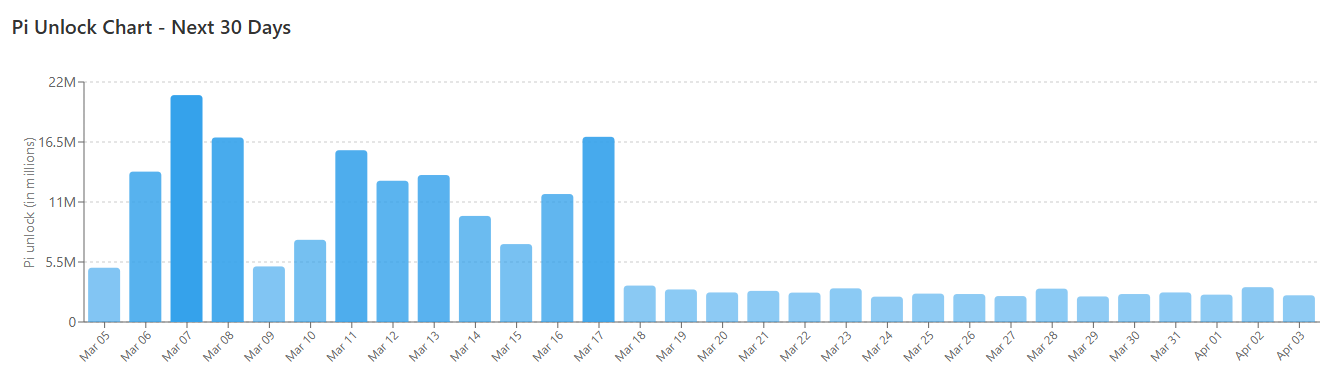
The second bearish factor is the rising supply stored on exchanges, now sitting at roughly 365.5 million coins. Such a shift from self-custody toward centralized platforms is often interpreted as a pre-sale step.
You may also like:

Last but not least, we will touch upon PI’s Relative Strength Index (RSI). The technical analysis tool measures the speed and magnitude of the latest price changes and is used by traders to identify trend reversals. It runs from 0 to 100, and ratios above 70 signal that the asset has entered overbought territory and could be on the verge of a pullback. As of press time, PI’s RSI stands at around 72.

How About Further Gains?
Some market observers expect PI’s rally to continue in the short term. X user ALTS GEMS Alert predicted that the price might soar above $0.30 should it hold the key level around $0.19.
“Momentum building… breakout could send it much higher,” they added.
Whale Hunter forecasted that PI will move “small by small,” starting at $0.20, then $0.40, and eventually exploding to $0.70 and beyond $1. “That’s how crypto works. Finally, you are X5 to X10 profit,” they suggested.
Meanwhile, there has been growing speculation that the leading crypto exchange Kraken might list Pi Network’s native cryptocurrency on Pi Day. Such a move would increase liquidity, improve availability, strengthen its reputation, and potentially support a positive price reaction.
Binance Free $600 (CryptoPotato Exclusive): Use this link to register a new account and receive $600 exclusive welcome offer on Binance (full details).
LIMITED OFFER for CryptoPotato readers at Bybit: Use this link to register and open a $500 FREE position on any coin!
Disclaimer: Information found on CryptoPotato is those of writers quoted. It does not represent the opinions of CryptoPotato on whether to buy, sell, or hold any investments. You are advised to conduct your own research before making any investment decisions. Use provided information at your own risk. See Disclaimer for more information.
The US Internal Revenue Service (IRS) is seeking to require electronic delivery of tax forms to crypto exchange users.
Under the current rules, exchanges are required to provide paper copies of tax form 1099-DA, the IRS tax form used to document crypto transactions from a centralized exchange or broker, if users request paper forms.
The proposed new rules, slated to be published on Friday, remove this requirement and allow brokers to “terminate” their relationships with existing clients if they refuse electronic delivery of tax forms.
Additionally, the IRS proposal would also prohibit users from retroactively revoking consent for electronic forms.

The IRS requires all broker-dealers, platforms providing crypto services to users like exchanges, to report user proceeds from each transaction and to provide users with Form 1099-DA, detailing their transaction history for the tax season.
However, the exchanges are not required to track cost basis for the 2025 tax year; tracking cost basis, or the price paid for each investment purchase, is the investor’s responsibility. The IRS outlined the reporting requirements for brokers:
“Brokers required to make these returns must include identifying information of the customer, such as the customer’s name and tax identification number (TIN), and such other relevant information, including the gross proceeds from the transaction.”
One in five Americans, or about 55 million individuals, hold digital assets in the US, according to the National Cryptocurrency Association (NCA), a crypto advocacy group.

Tax compliance was one of the biggest impediments to adopting crypto, with 10% of the 54,000 respondents in the NCA survey citing digital asset taxes as an issue.
More than one-third of the respondents indicated that they wanted more education on the tax implications of digital assets, according to the NCA.

Related: Crypto lobby Blockchain Association pitches tax plan to Congress
Concerns resurface after Trump killed the controversial “DeFi broker rule,”
In December 2024, the IRS issued a rule classifying all front-end services, including decentralized exchanges (DEX) and decentralized finance (DeFi) platforms, as broker-dealers, subjecting them to tax reporting requirements.
This meant that DeFi platforms would have to collect know-your-customer (KYC) information and report proceeds from user sales to the IRS.
US President Donald Trump signed a resolution in April 2025 that killed the DeFi broker rule, which was well-received by the crypto industry.
However, crypto industry executives have sounded the alarm about ambiguous language in the stalled CLARITY market structure bill that could force KYC reporting requirements onto DeFi platforms and limit activity in the nascent sector.
Magazine: Clarity Act risks repeat of Europe’s mistakes, crypto lawyer warns

Ethereum price has rejected the $2,200 resistance level after failing to sustain momentum above a key value area high. The rejection increases the probability of a rotational move toward lower support as bearish pressure begins to build.
Summary
- Resistance Rejection: Ethereum rejected the $2,200 level and closed below the value area high.
- Range Structure: Price remains trapped within a broader consolidation range.
- Downside Target: A rotational move toward the $1,826 support level is possible if resistance holds.
Ethereum’s (ETH) recent price action has shown clear signs of weakness after the asset attempted to reclaim the $2,200 resistance level but failed to hold above it. The rejection from this area has reinforced the broader range-bound structure that has been developing over recent sessions.
With price now trading back below the value area high, the market is beginning to show signals that a rotational move toward lower support may occur if selling pressure continues.
Ethereum price key technical points
- Key Resistance: $2,200 rejection confirms strong overhead supply.
- Value Area Structure: Price closed below the value area high, signaling weakening momentum.
- Technical Target: Potential rotation toward the $1,826 support level.
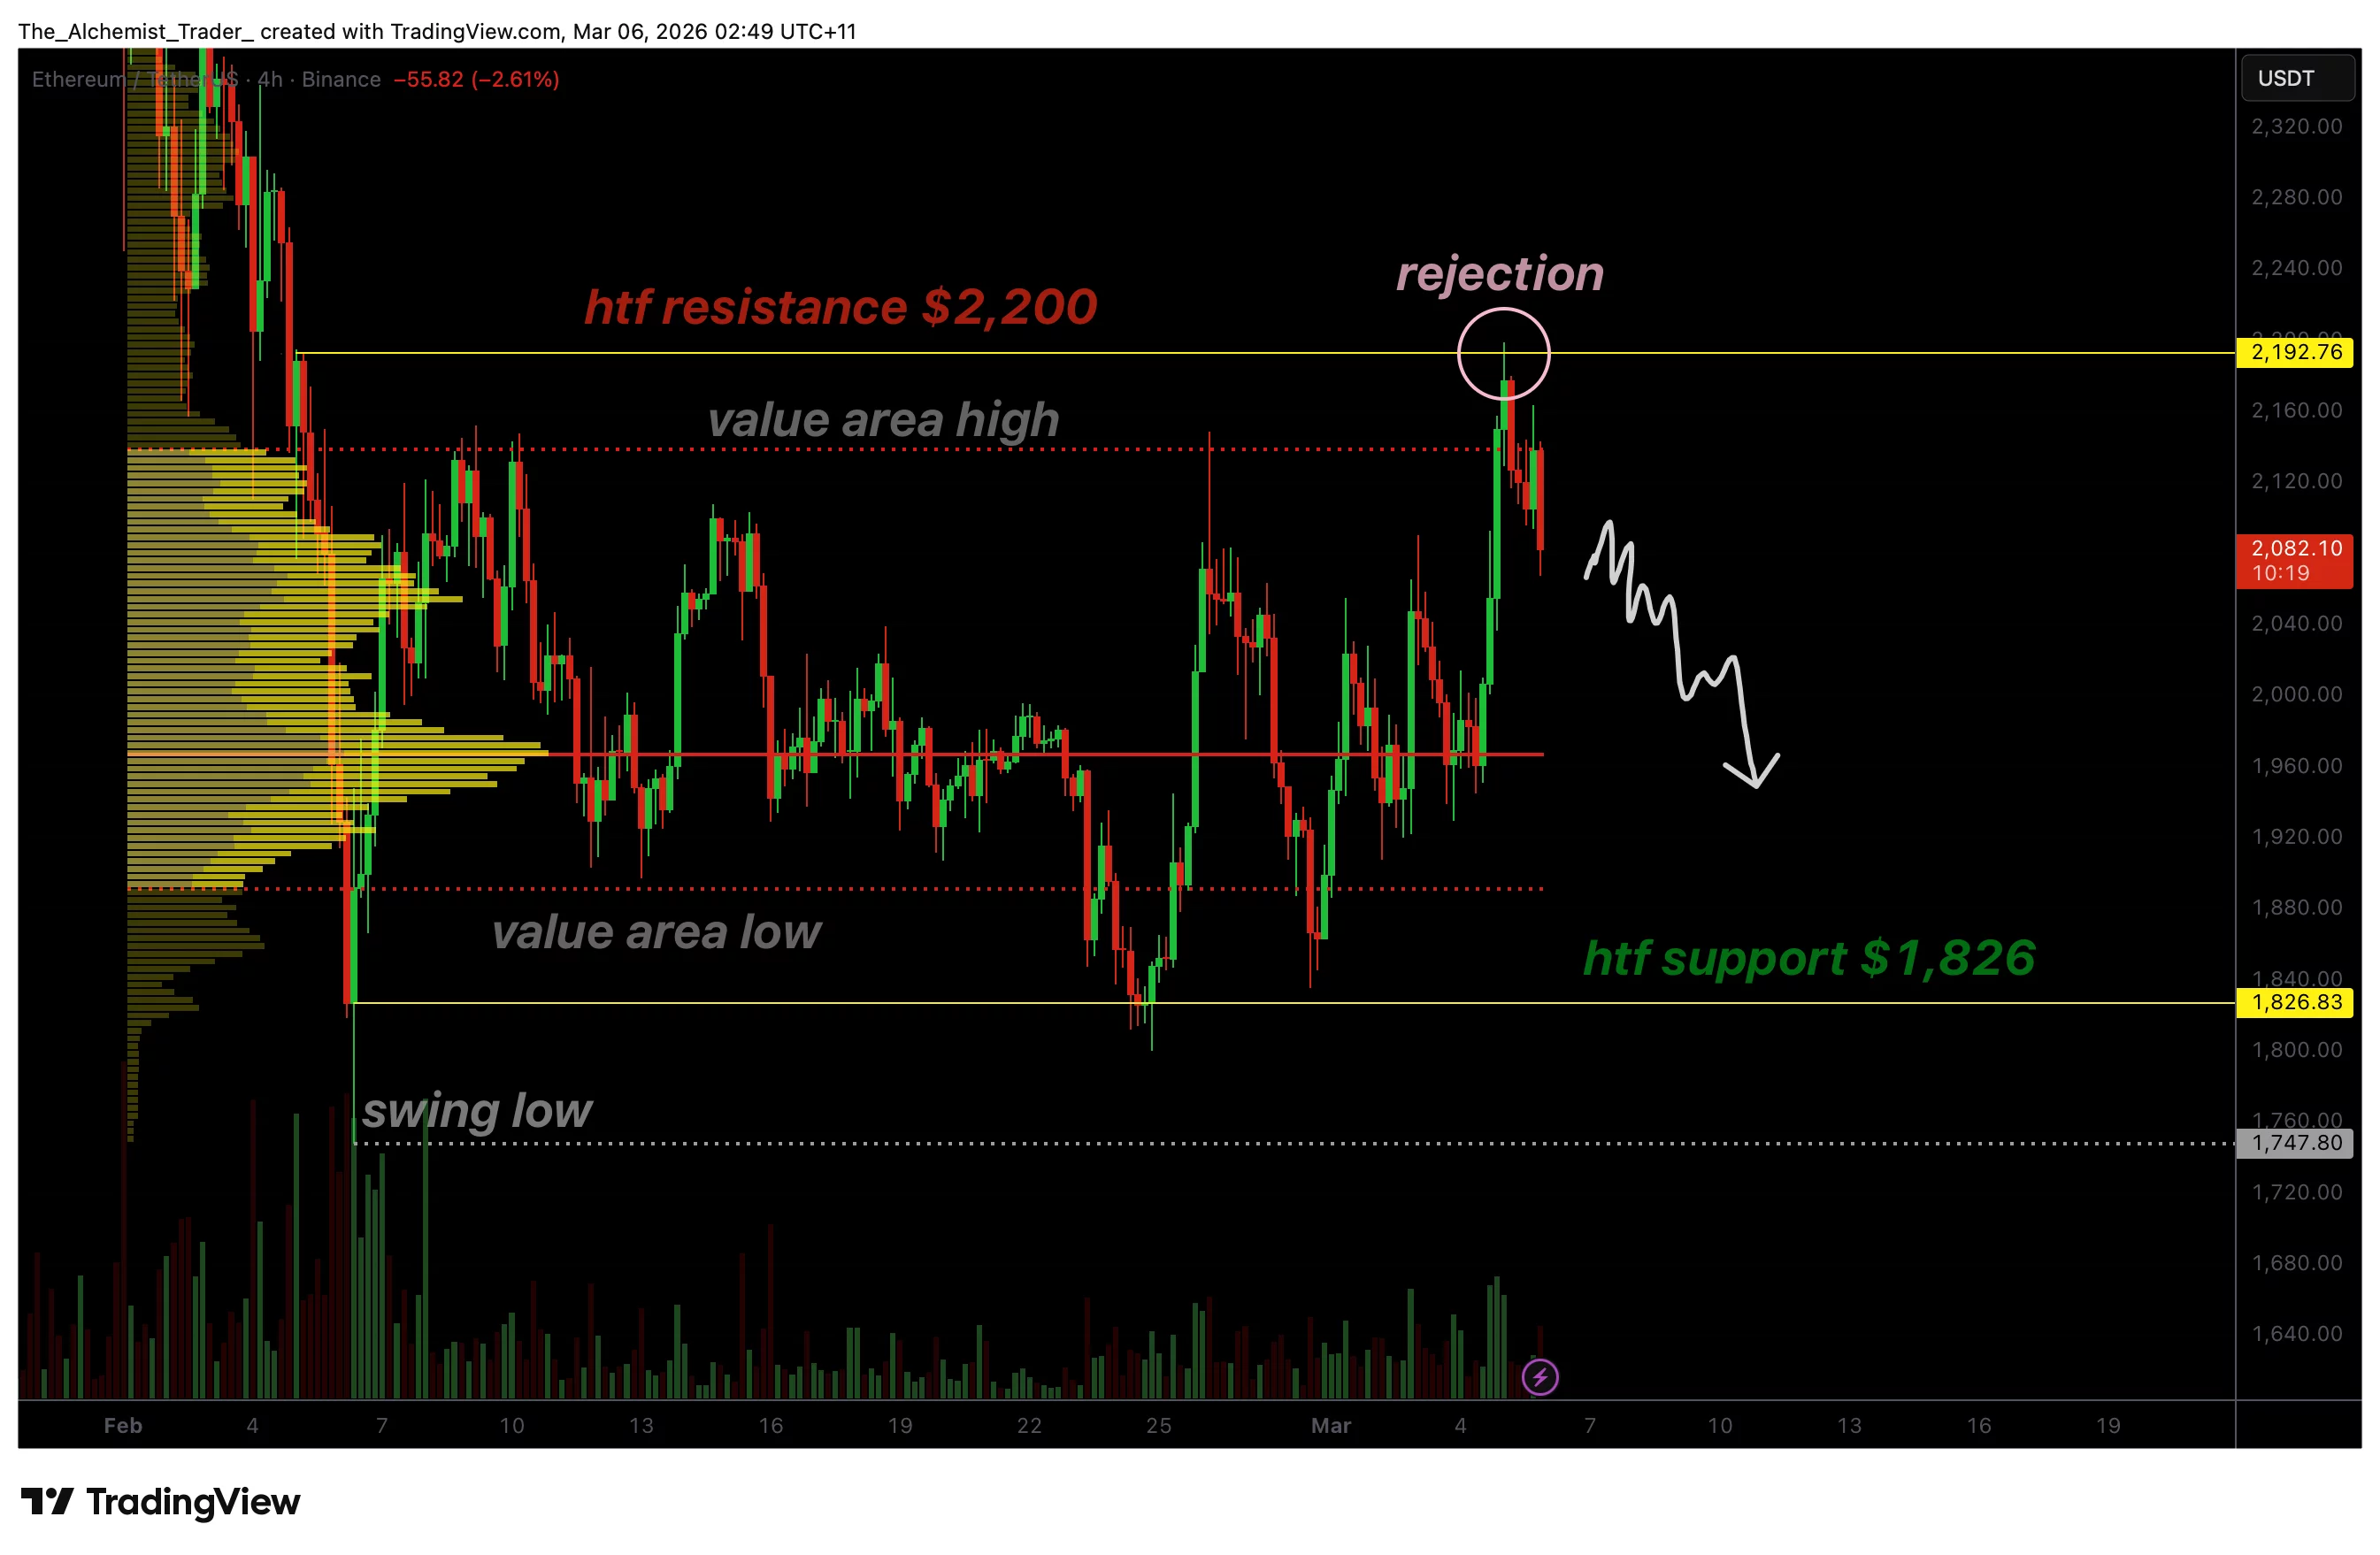
Ethereum recently approached the $2,200 region, which has acted as a strong resistance level within the current trading structure. This area coincides closely with the value area high, a key technical zone derived from the volume profile that often acts as a pivot for price direction.
When Ethereum briefly traded near this region, buyers failed to generate enough momentum to sustain a breakout. Instead, the market printed a clear rejection and quickly moved back below the level.
This rejection is technically significant because it confirms that the upper boundary of the current trading range remains intact. The value area high often acts as a distribution zone where selling pressure emerges, and the inability for price to hold above this level indicates that market participants may still be favoring a range-bound structure rather than a breakout continuation.
With the rejection confirmed through a close below the value area high, the probability of a rotational move within the established range increases. In range-bound environments, price typically oscillates between the value area high and value area low while searching for liquidity at both extremes. In this case, the lower support around $1,826 becomes the next logical technical magnet for price action.
Meanwhile, broader discussions within the ecosystem continue after Vitalik Buterin recently described Ethereum as part of a wider network of “sanctuary technologies,” open-source systems designed to protect freedom, privacy, and resilience in an increasingly uncertain world.
Market structure also supports the potential for a downward rotation. Ethereum has repeatedly struggled to establish higher highs above the $2,200 region, suggesting that buyers are losing control at this level. Without a strong influx of bullish volume to reclaim resistance, price is more likely to revisit lower liquidity zones where demand may re-enter the market.
Additionally, the proximity between the value area high and the broader range resistance strengthens the case for rejection. When multiple technical levels align in the same region, the probability of price reacting to that zone increases significantly, which likely contributed to the sharp rejection seen in recent candles.
Although Ethereum recently rebounded above the $2,000 psychological support level amid improving market sentiment and a large purchase of over 50,000 ETH by Bitmine, the confluence of resistance overhead continues to limit upside momentum.
If Ethereum continues to print multiple closes below the value area high, the market may gradually rotate toward the lower boundary of the range. Such movements are common in consolidation environments, where price action shifts between support and resistance until a decisive breakout eventually occurs.
What to expect in the coming price action
As long as Ethereum remains below the $2,200 resistance and continues closing below the value area high, the probability favors a rotational move toward the $1,826 support level.
A reclaim of the resistance zone would invalidate this bearish outlook, but until then, the broader market structure suggests that downside pressure may persist within the current trading range.

XRP AND RIPPLE *DONE* (”XRP WILL CHANGE THE WORLD”!?!?)

T20 World Cup: Brendon McCullum wants to stay as England coach – but will that be enough?

Trump, Bondi sued by shareholders over alleged TikTok deal law violations


-

 Politics7 days ago
ITV enters Gaza with IDF amid ongoing genocide
-

 Politics3 days ago
Alan Cumming Brands Baftas Ceremony A ‘Triggering S**tshow’
-

 Fashion6 days ago
Weekend Open Thread: Iris Top
-

 Tech5 days ago
Unihertz’s Titan 2 Elite Arrives Just as Physical Keyboards Refuse to Fade Away
-
Sports6 days ago
The Vikings Need a Duck
-
 NewsBeat5 days ago
Dubai flights cancelled as Brit told airspace closed ’10 minutes after boarding’
-

 NewsBeat5 days ago
Abusive parents will now be treated like sex offenders and placed on a ‘child cruelty register’ | News UK
-
 NewsBeat5 days ago
The empty pub on busy Cambridge road that has been boarded up for years
-

 NewsBeat4 days ago
‘Significant’ damage to boarded-up Horden house after fire
-

 Tech15 hours ago
Bitwarden adds support for passkey login on Windows 11
-

 Entertainment4 days ago
Baby Gear Guide: Strollers, Car Seats
-
 Sports4 hours ago
499 runs and 34 sixes later, India beat England to enter T20 World Cup final | Cricket News
-
 Tech6 days ago
NASA Reveals Identity of Astronaut Who Suffered Medical Incident Aboard ISS
-
Politics5 days ago
FIFA hypocrisy after Israel murder over 400 Palestinian footballers
-
 NewsBeat5 days ago
Emirates confirms when flights will resume amid Dubai airport chaos
-

 NewsBeat3 days ago
Is it acceptable to comment on the appearance of strangers in public? Readers discuss
-

 Crypto World7 days ago
From Crypto Treasury to RWA: ETHZilla Retreats and Relaunches as Forum Markets on Nasdaq
-

 Tech5 days ago
Viral ad shows aged Musk, Altman, and Bezos using jobless humans to power AI
-

 Video4 days ago
How to Build Finance Dashboards With AI in Minutes
-

 Business2 days ago
Guthrie Disappearance Enters Fifth Week as Family Visits Memorial