

Crypto World
Liquidity Zones and Liquidity Voids: Analysing Price Dynamics

Liquidity zones are areas where large buy and sell orders cluster, often acting as support or resistance. Liquidity voids (or imbalances) are fast price moves where little trading occurred, and price often returns to fill them.
Traders use liquidity zones to identify entry and exit points, while liquidity voids may help anticipate retracements and continuation moves.
This article explains how liquidity zones and liquidity voids function in market structure and highlights their role on price charts.
Takeaways
- Liquidity zones = high trading activity (support/resistance)
- Liquidity voids = low activity (fast price moves)
- Price tends to:
- move towards liquidity
- return to fill voids
- Commonly used with:
- market structure
- volume analysis
Liquidity Zones vs Liquidity Voids
Liquidity zones and liquidity voids differ primarily in how order flow is distributed and how price behaves within each environment.
In liquidity zones, trading activity is elevated due to the presence of clustered orders around previous highs, lows, or consolidation ranges. This concentration of liquidity typically causes prices to slow down, rotate, or produce reactions, reinforcing their role as support and resistance areas.
In contrast, liquidity voids form during strong directional moves, leaving behind areas where little trading activity has previously occurred. As a result, when price revisits these regions, it often moves quickly due to the absence of significant opposing orders.
Liquidity zones are generally associated with reversal or breakout strategies, where traders anticipate interaction between buyers and sellers. Liquidity voids, however, are typically approached with mean reversion expectations, as the market tends to rebalance prior inefficiencies.
Understanding Liquidity in Trading
In trading, liquidity refers to how easily an asset can be bought or sold without significantly affecting its price. High liquidity means there are enough buyers and sellers at a given price level, facilitating smoother transactions. This concept is critical because it affects how quickly and at what price a trader can enter or exit positions.
Assets with high liquidity tend to have tighter spreads, which may reduce trading costs.
Conversely, assets with low liquidity can experience abrupt price movements due to limited order flow. Understanding liquidity may help traders make decisions.
These dynamics give rise to two important phenomena in trading: liquidity zones and voids. Liquidity zones are areas with a high concentration of trading activity, while liquidity voids represent gaps in the market where trading activity is sparse, each presenting unique conditions for trading strategies.
What Are Liquidity Zones in Trading?
Liquidity zones (also called liquidity levels) are specific areas on a price chart where trading activity is highly concentrated. These zones indicate areas where large orders can be executed with minimal price impact.
Forex liquidity zones highlight areas where currency pairs tend to see higher activity.
These areas may be useful for identifying reversals or breakouts, providing reference points for entries and exits.
These zones often form around historical price levels where significant trading activity has occurred. They often act as magnets, attracting future price movement due to expected order flow. Liquidity levels are commonly associated with support and resistance. When price approaches these levels, traders can expect increased order flow, which may lead to clearer price reactions.
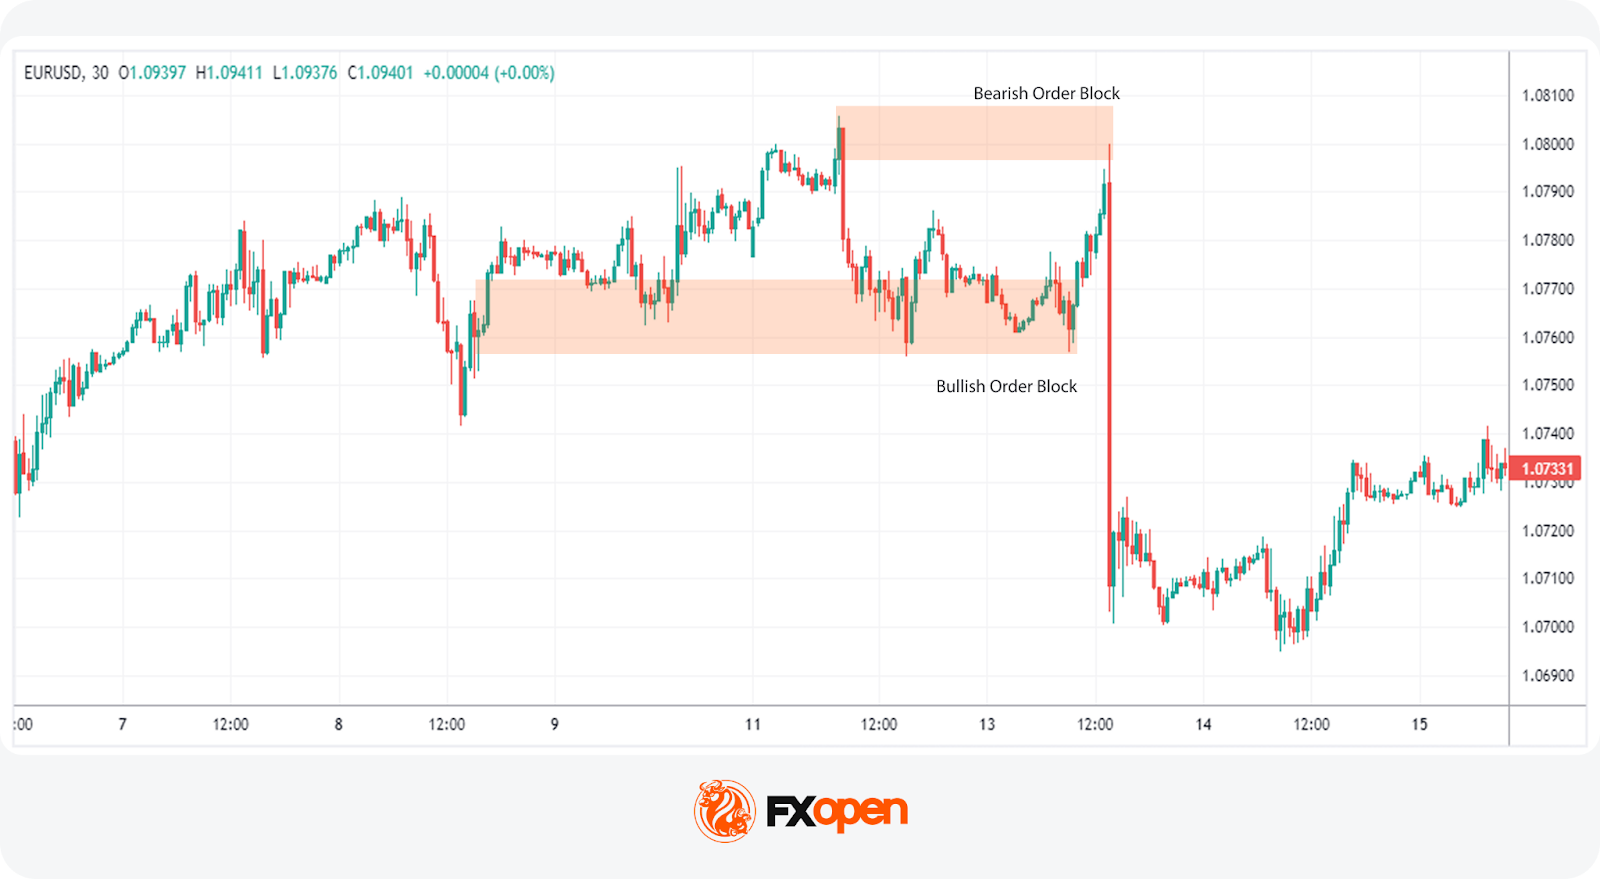
Liquidity Zones vs Order Blocks
How Traders Identify Liquidity Zones (With Examples)
Traders identify liquidity zones using volume, price structure, and historical levels. Liquidity zone trading depends on accurately identifying areas where trading activity is concentrated. These levels highlight regions of high volume and may act as pivot points for price action.
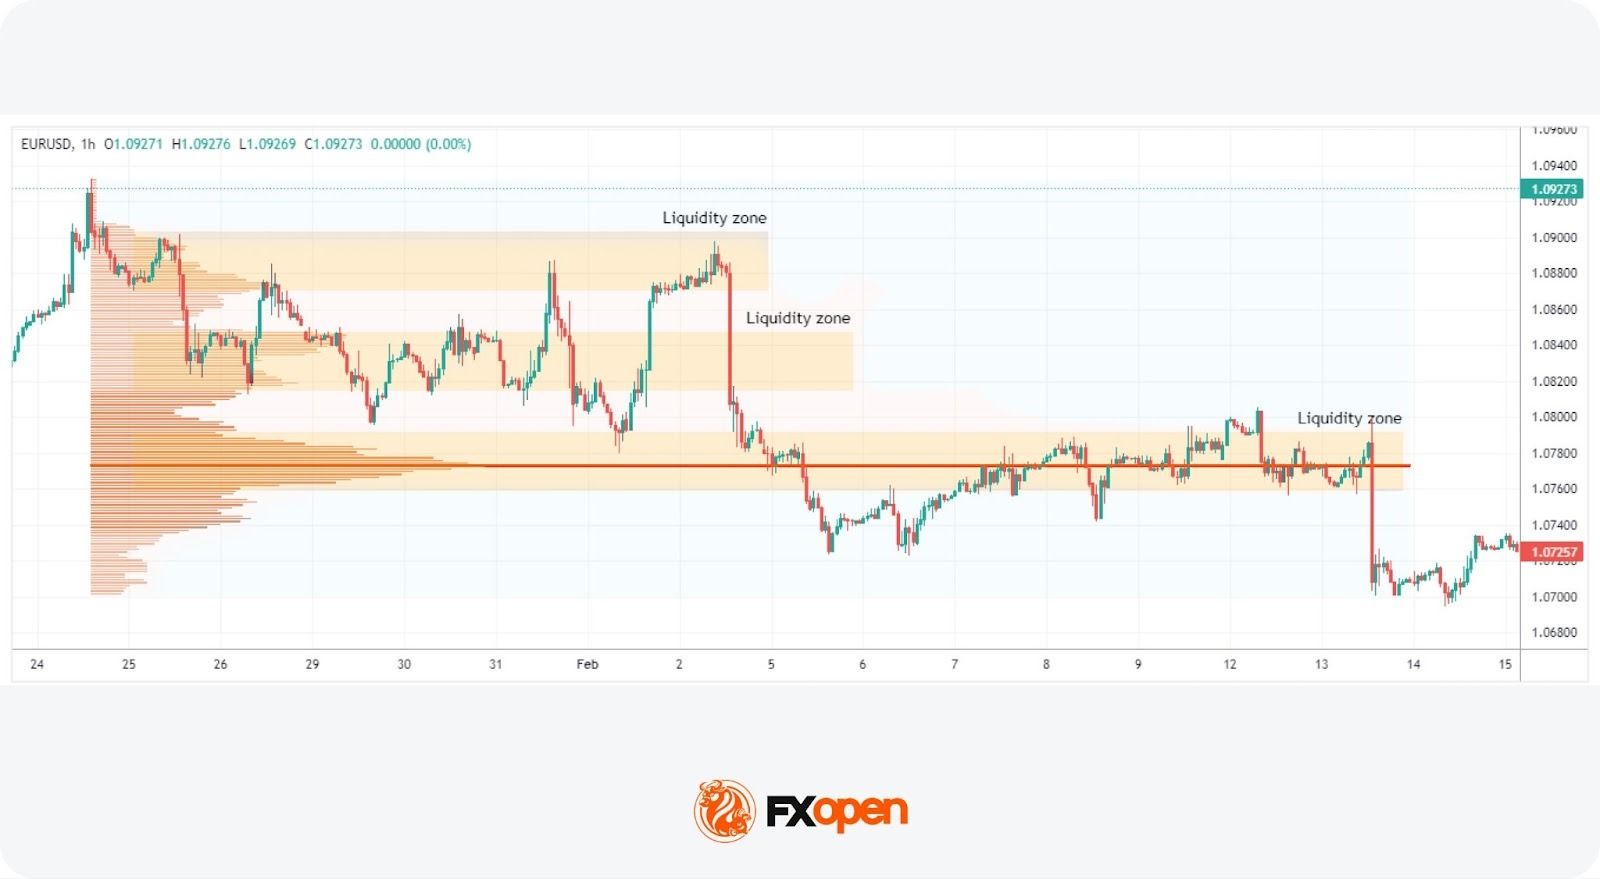
Volume Profile
This approach uses the volume profile to show where most trading activity has occurred.
Unlike traditional indicators that display volume over time, the volume profile shows volume at specific price levels. This may help traders identify peaks in volume, highlighting areas of significant liquidity.
To use the volume profile tool as we have in the picture above, you can head over to FXOpen’s TickTrader trading platform and search for “Volume Profile Fixed Range” under the Indicators tab.
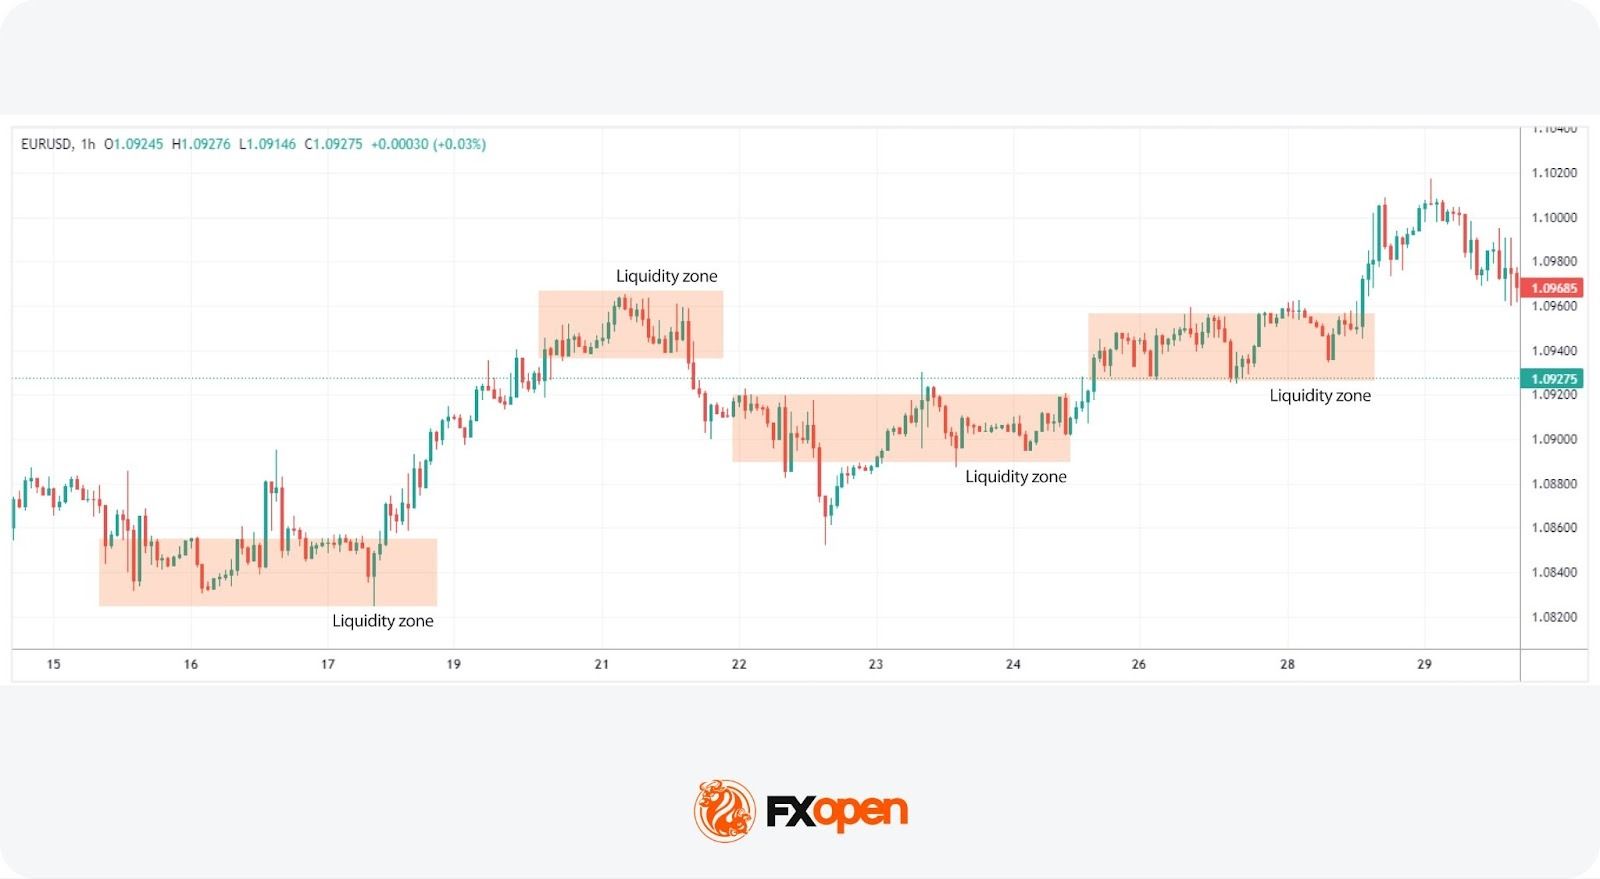
Price Consolidation Areas
Recognising zones where the price has consolidated for a notable period is another method. These areas represent a tug-of-war between buyers and sellers, resulting in a high volume of trades. Such levels often act as magnets for future price action, making them critical for liquidity area trading.
Previous Support and Resistance Levels
Historical support and resistance levels are invaluable for spotting zones. These are levels at which significant reversals or pauses in trend have occurred, indicating areas where large volumes of orders may accumulate. When price approaches these levels again, it often does so with increased trading activity, making them prime candidates for liquidity areas.
What Is a Liquidity Void (Imbalance)?
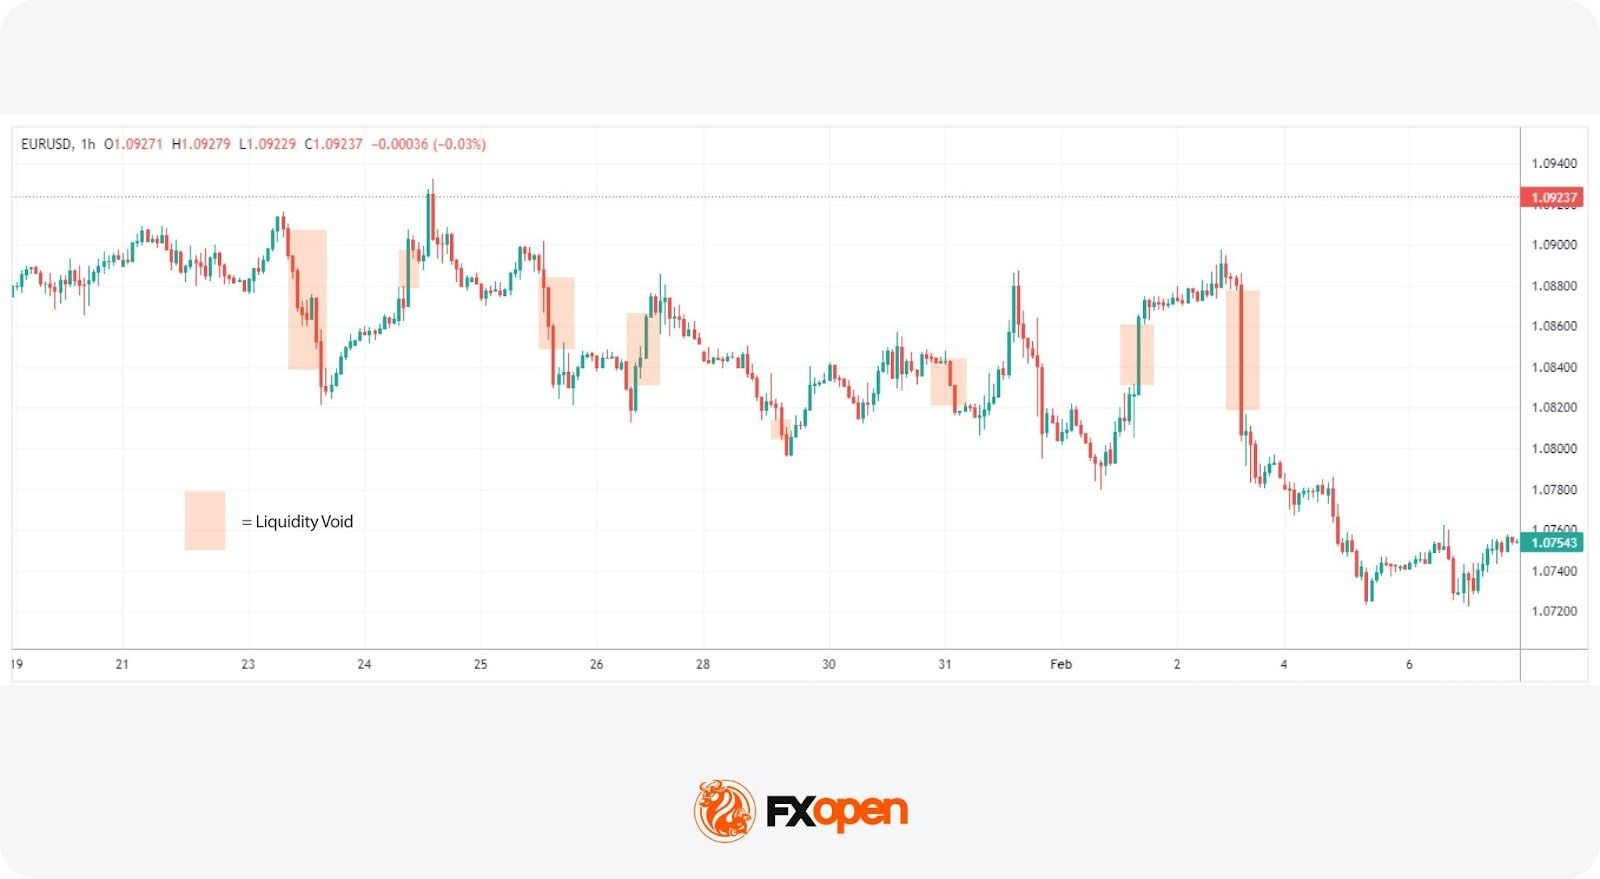
Liquidity voids (imbalances) are rapid price movements where little trading activity occurs between two levels. These gaps can lead to abrupt price changes and are often visible as sharp moves on a chart.
A liquidity void in forex signals an imbalance between buyers and sellers, causing prices to move quickly. This can result in sharp price movement as the market seeks a new equilibrium. These voids often occur after major news releases, during low-liquidity periods, or due to large institutional trades.
Their impact extends beyond the initial move. They represent areas where the market has not established a consensus price, which may lead to increased volatility later. Prices often return to these areas to “fill” the imbalance and restore balance in the market.
Traders navigate the increased volatility and unpredictability associated with these gaps but can also strategise to take advantage of the potential return to equilibrium.
How Traders Spot Liquidity Voids (Types of Liquidity Voids)
Liquidity voids can be classified based on where they appear in a trend. Liquidity voids in the forex market manifest in various forms, each with distinct characteristics and implications for traders. Understanding the different types of voids may support traders in navigating these challenging areas. Some notable types of liquidity voids are common, exhaustion, breakout, and runaway. Let’s take a look at them:
Common Liquidity Voids
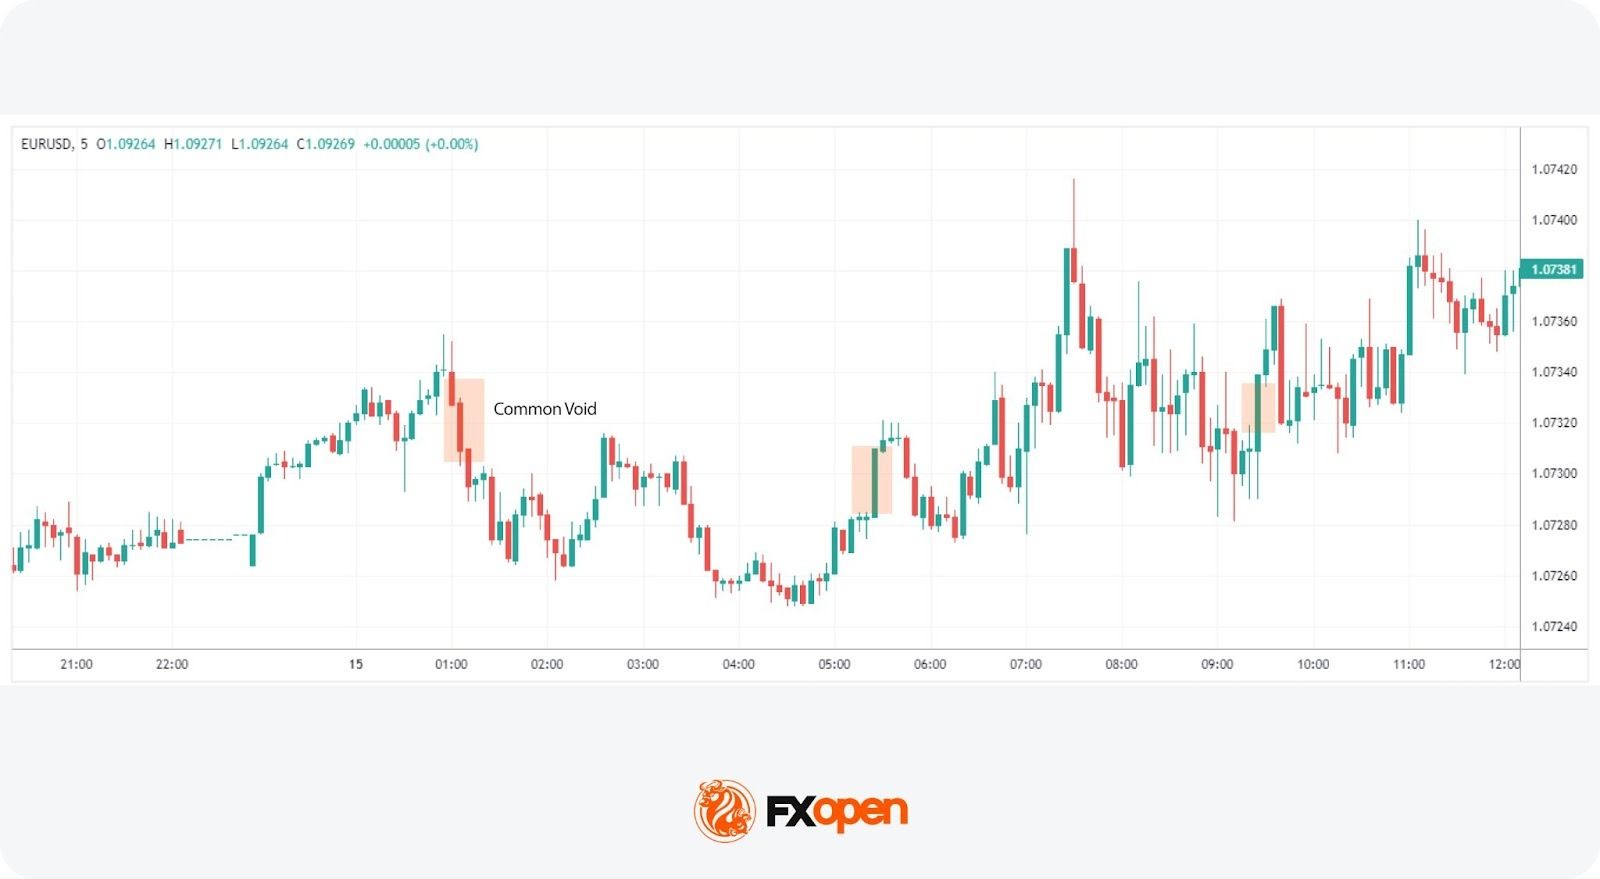
Common voids appear randomly across charts without any news or event trigger, forming from natural market ebb and flow. They don’t always carry significant analytical value but are still worth monitoring for risk management purposes.
Exhaustion Liquidity Voids
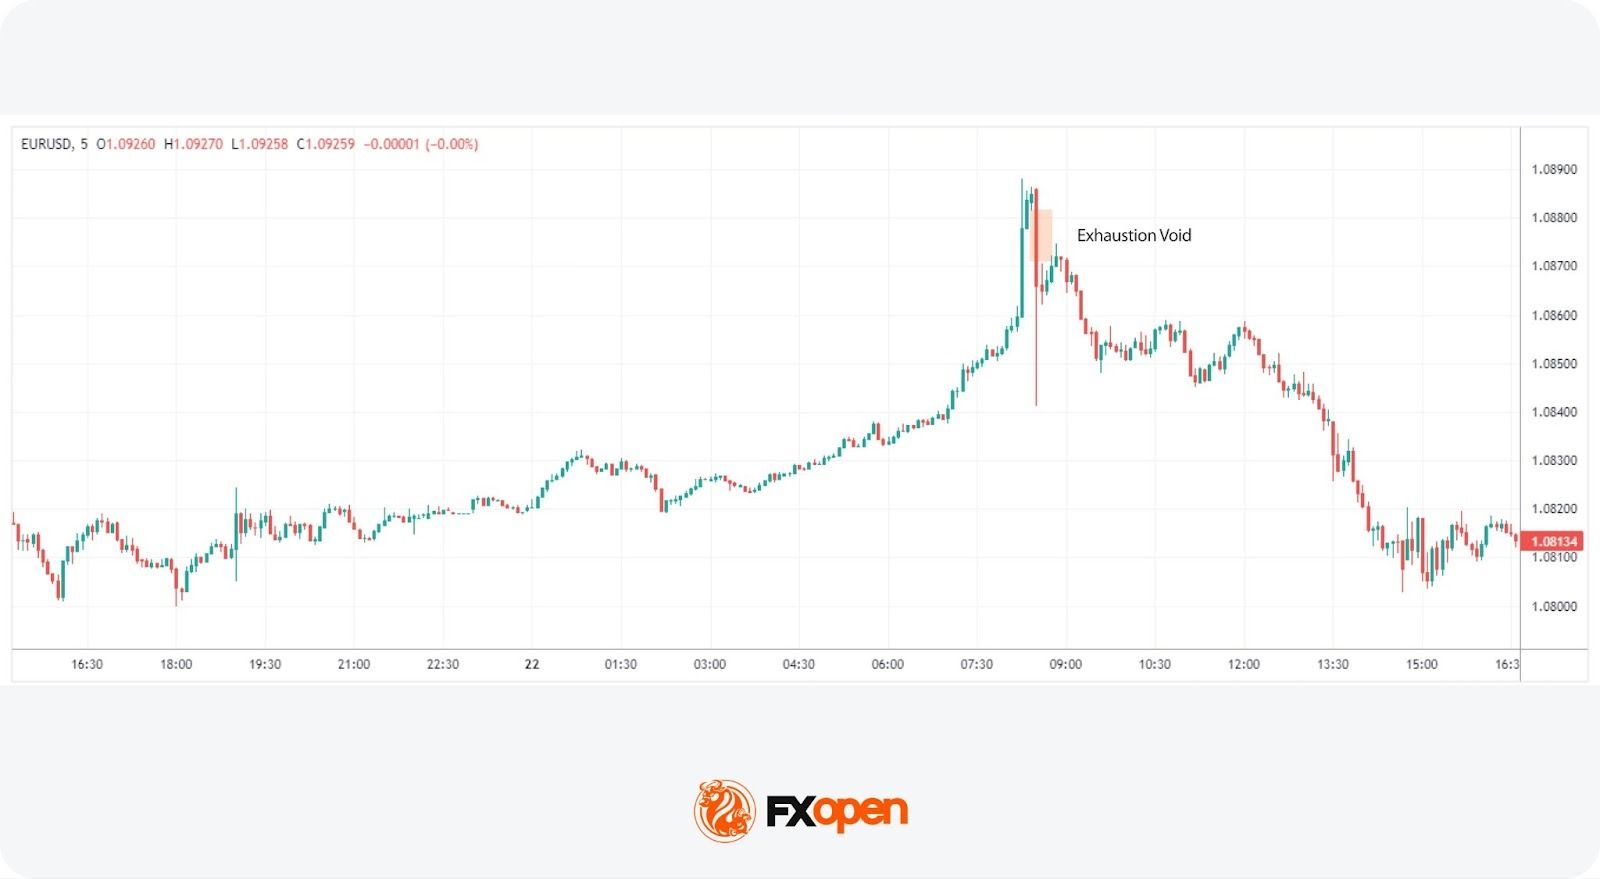
Exhaustion liquidity voids appear at the end of a trend when momentum fades and price makes a final push before reversing. Traders often watch for them as potential signals of a trend reversal.
Breakout Liquidity Voids
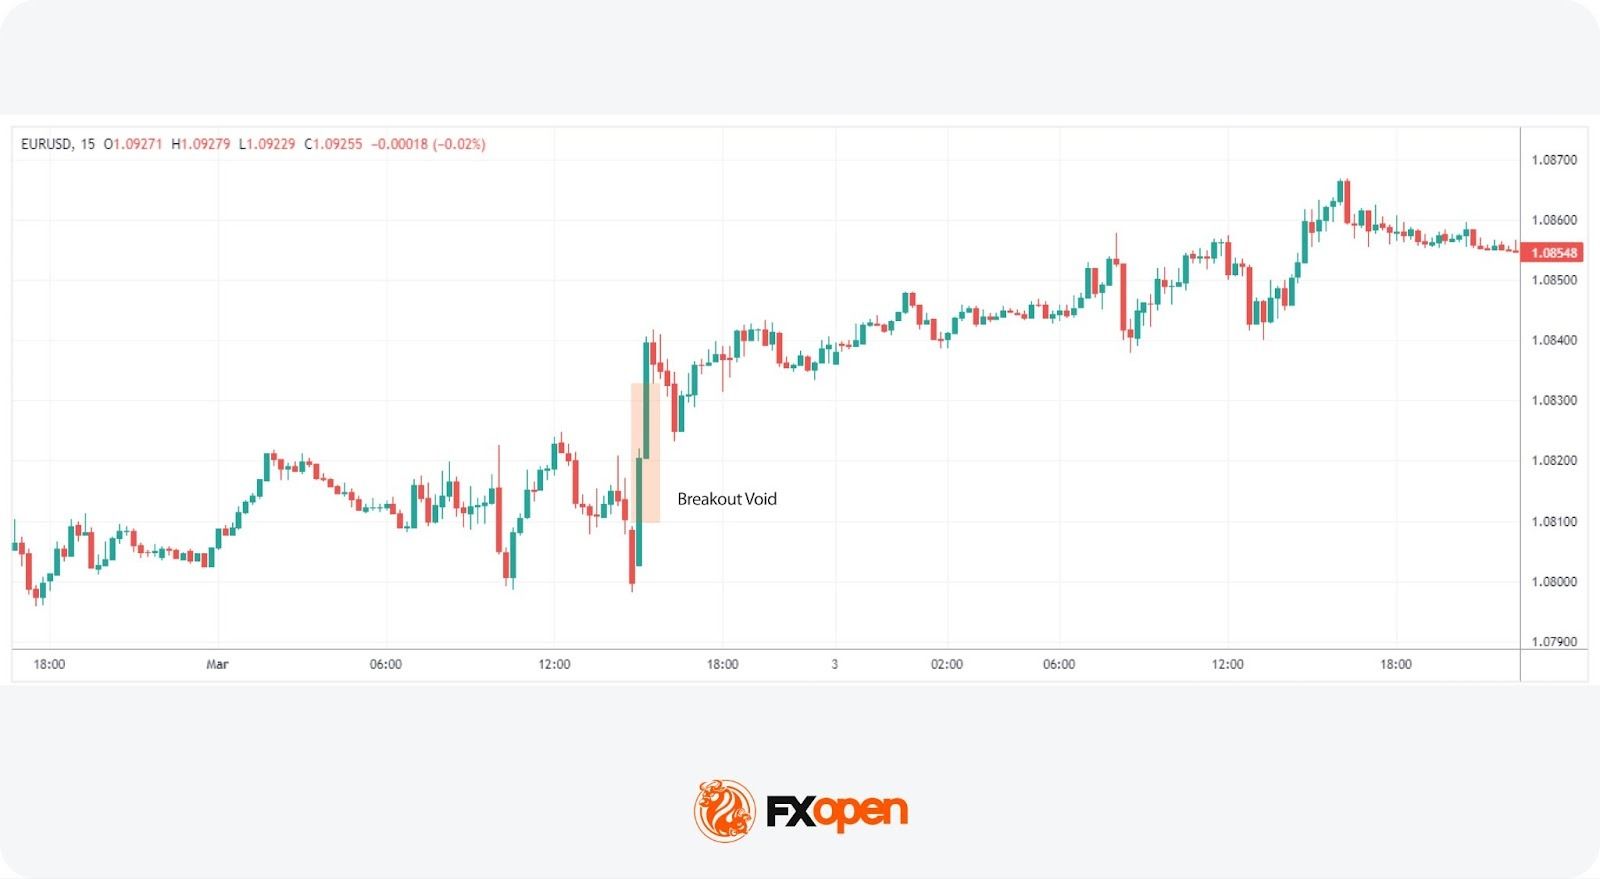
Breakout voids form when price breaks through a key support or resistance level with enough force to leave behind an imbalance. They often signal the beginning of a new trend.
Runaway Liquidity Voids
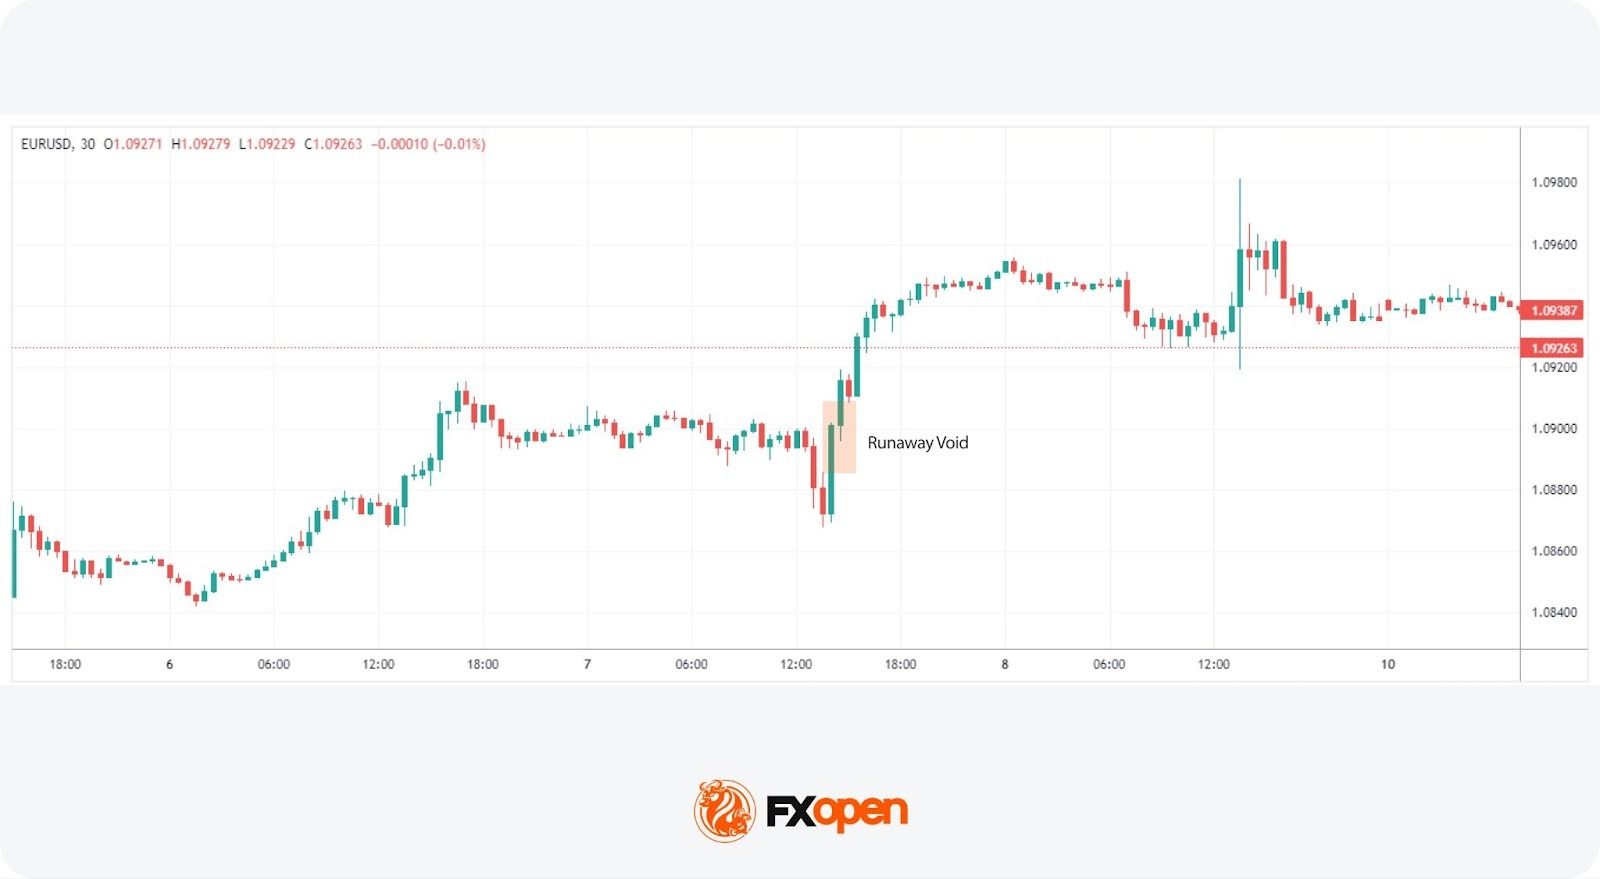
Runaway voids occur within an existing trend and signal its continuation. Price moves sharply in the trend’s direction, bypassing levels where liquidity would normally sit, which may support trend strength confirmation.
How Traders Use Liquidity Zones and Voids
Liquidity zones and voids form the basis of several common trading approaches. Here’s how traders typically work with them.
Step 1: Identify a Liquidity Zone
Traders start by locating areas where price has repeatedly reacted, such as support and resistance levels or high-volume nodes on a volume profile. These clusters of resting orders act as magnets for price.
Step 2: Wait for a Price Reaction
Rather than acting immediately, traders watch how price behaves when it reaches the zone. Does it stall? Reverse? Push straight through? The reaction tells the story.
Step 3: Look for Confirmation
A reaction alone isn’t enough. Traders look for confirmation through candlestick patterns (like pin bars or engulfing candles) or a shift in market structure, such as a break of a recent swing high or low.
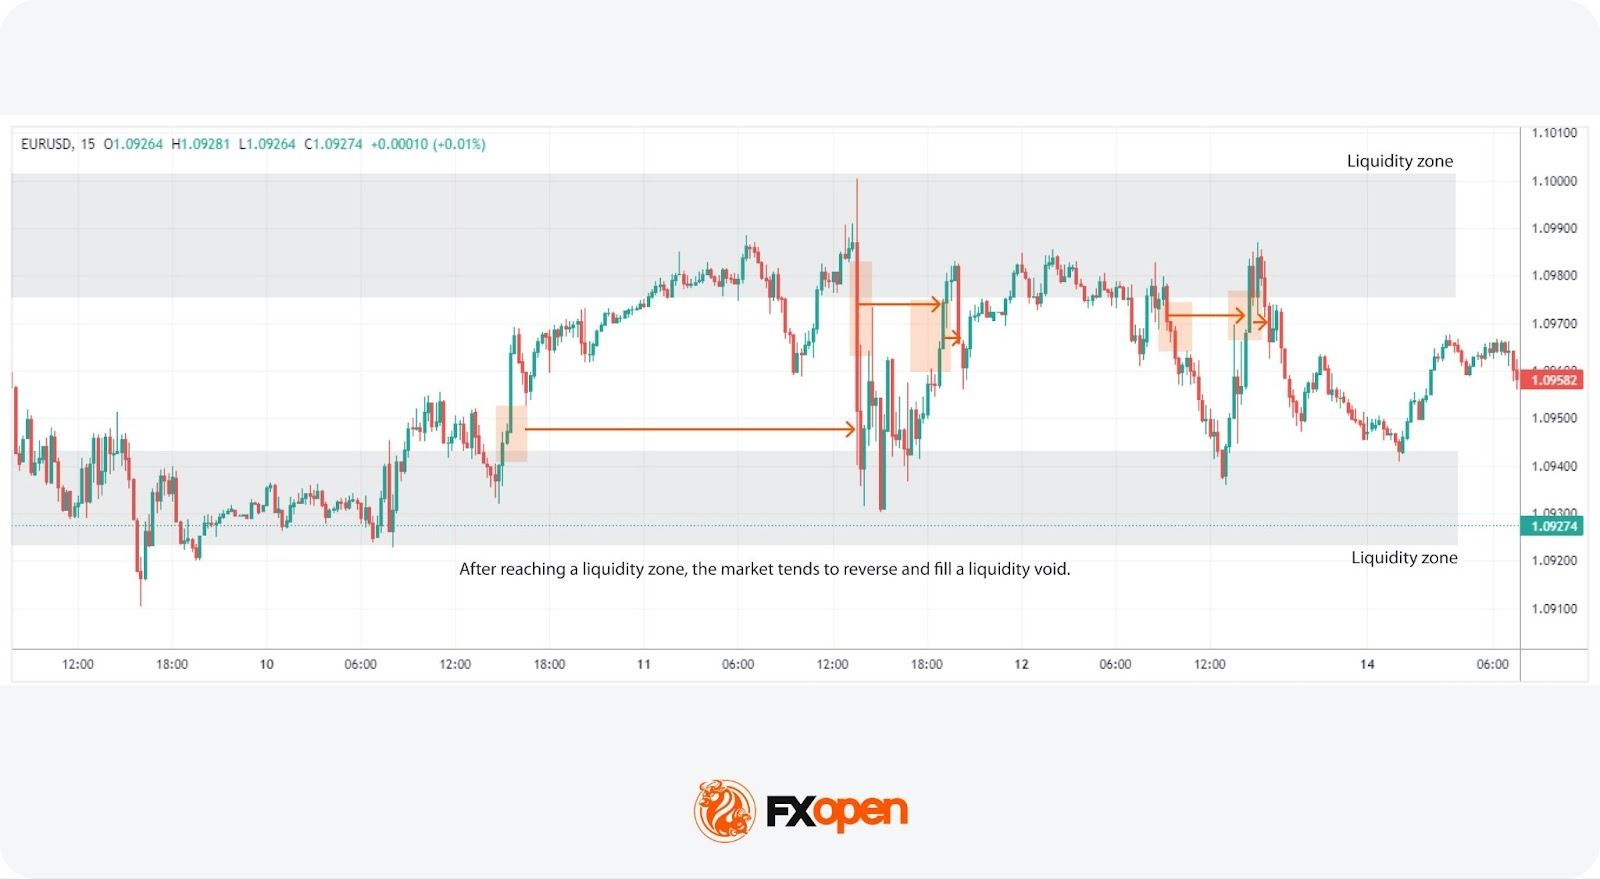
Step 4: Target Nearby Liquidity or a Void
Once confirmed, traders typically set targets at the next liquidity zone or unfilled void. Voids act as areas price is likely to move toward, since they represent unfinished business on the chart.
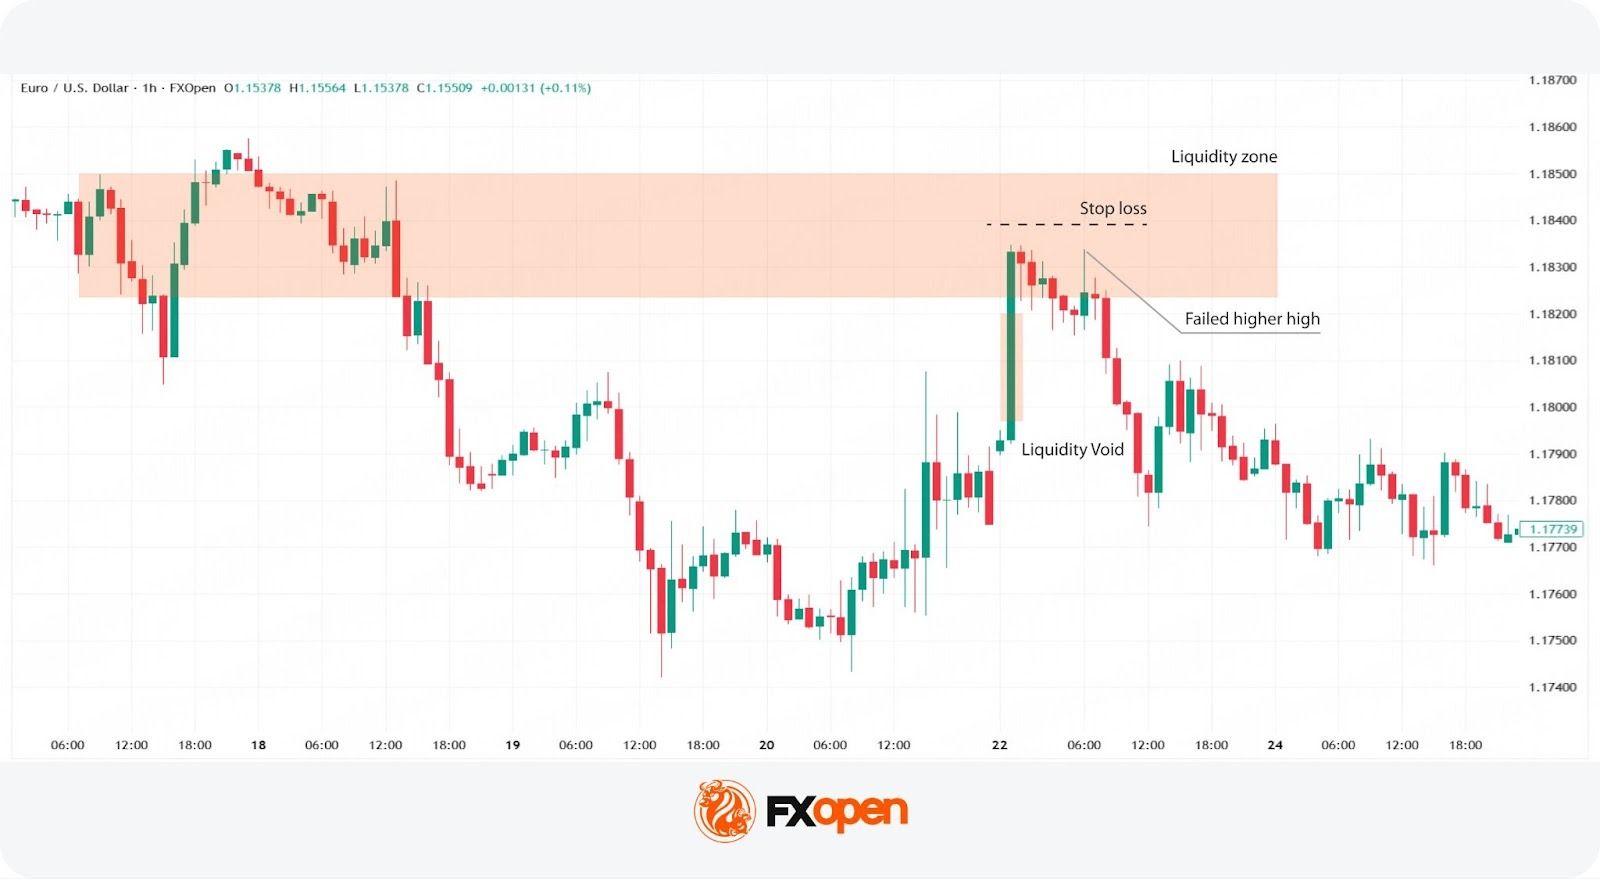
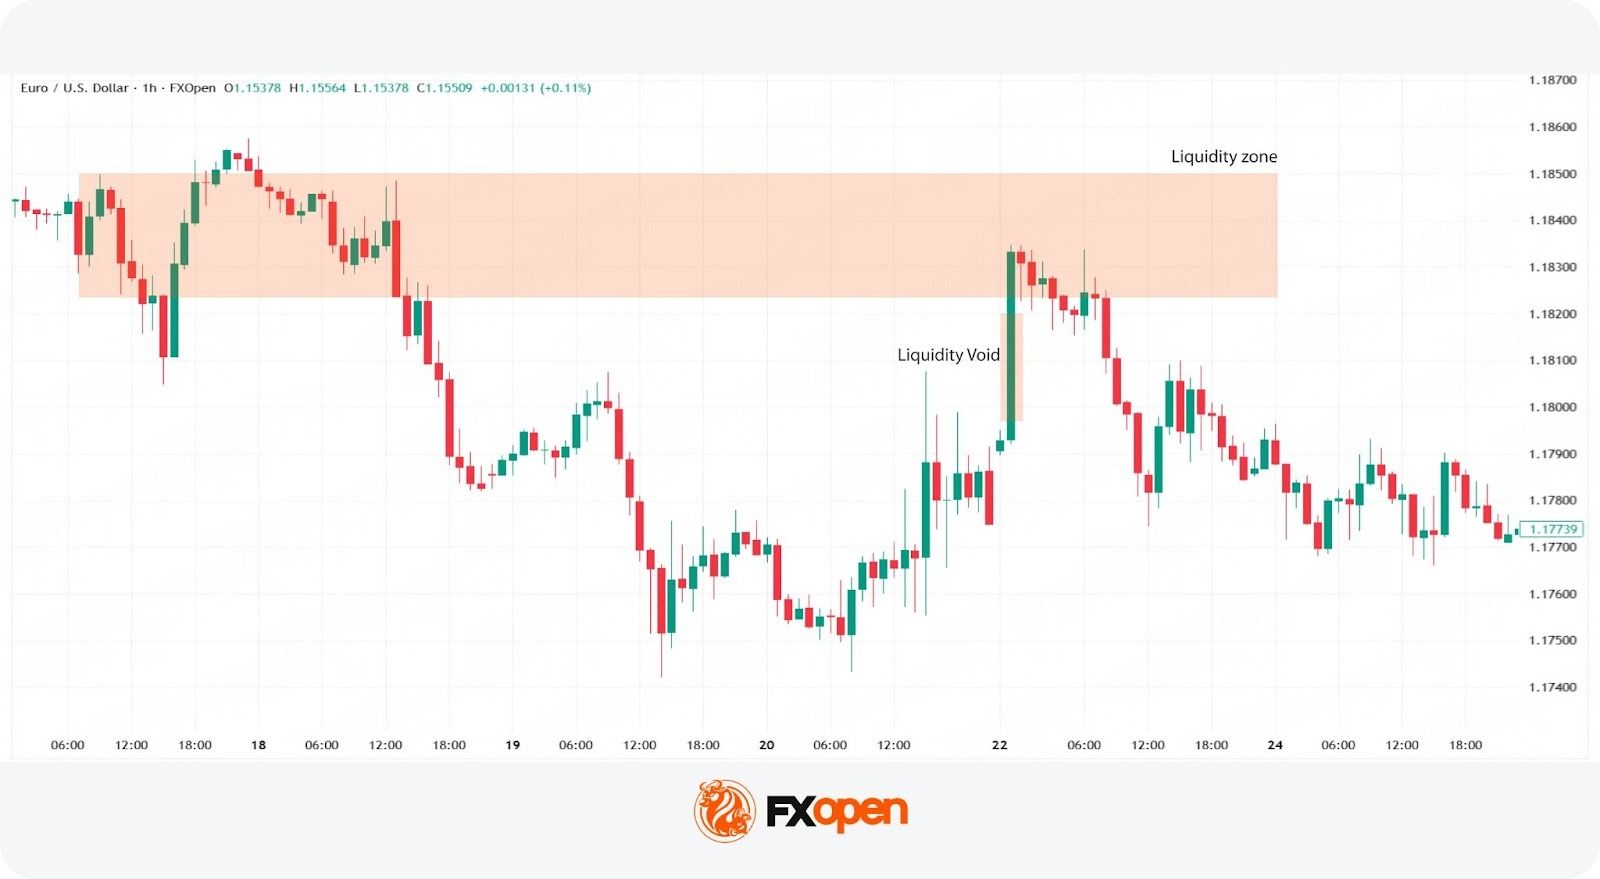
In this example, price moves into a liquidity zone, leaving a void behind it. Buyers attempt to push higher but fail, printing a long upper wick and signalling weakening momentum. Price then breaks below the established low and drops to fill the liquidity void left on the way up. A trader could have opened a sell position after the price broke below the low, set a stop-loss level above the nearest swing high, and closed the trade once the liquidity void was filled.
Limitations of Liquidity Zones and Voids
Understanding liquidity zones and voids provides traders with valuable insights into market dynamics, yet relying solely on these concepts comes with limitations. Here are some specific challenges to consider:
- Market Volatility: Market volatility can disrupt liquidity patterns, making historical levels less reliable.
- Influence of External Events: External events such as economic announcements can override expected behaviour.
- Timeframe Sensitivity: The relevance of zones and voids varies across timeframes, which may affect analysis.
- False Signals: These patterns can also produce false signals, leading to premature decisions.
The Bottom Line
Liquidity zones and voids may help explain how price moves within the forex market. They highlight areas of trading activity and imbalance, offering insight into potential price behaviour.
However, traders use them alongside other tools due to their limitations.
For traders seeking to apply these insights, opening an FXOpen account could provide a practical platform to explore and leverage the dynamics of liquidity in their trading across hundreds of tradable assets.
FAQs
What Are Liquidity Zones?
Liquidity zones are areas on a chart where buy and sell orders are concentrated, often acting as support or resistance. Traders monitor these levels to identify potential entry and exit points.
How Are Liquidity Zones Identified in Trading?
Liquidity zones are identified using tools such as volume profile, price consolidation, and historical support and resistance. These methods highlight areas where trading activity is concentrated.
How May Liquidity Zones Be Traded?
Liquidity zones are commonly used to identify potential entry and exit points. Traders monitor price reactions at these levels and may combine them with other tools to refine trading decisions.
What Are Liquidity Voids?
Liquidity voids are areas where price moves quickly due to low trading activity, creating an imbalance. Price often returns to these areas to “fill” the gap and restore market balance.
This article represents the opinion of the Companies operating under the FXOpen brand only. It is not to be construed as an offer, solicitation, or recommendation with respect to products and services provided by the Companies operating under the FXOpen brand, nor is it to be considered financial advice.

Crypto World
Wall Street giants are triggering a massive fee war that could crush crypto exchange margins


Immediately after Morgan Stanley announced it was rolling out E*Trade, charging a mere 50 basis points undercutting established rivals Coinbase, Robinhood and Schwab, Bloomberg analyst Eric Balchunas said “crypto exchanges should be scared.”
Others were less blunt, saying the Wall Street giant’s “isn’t entering crypto to complement Coinbase—it’s entering to replace it…”
The battle for cheap crypto trading resembles the trading fee race when spot ETFs launched in 2024, which saw providers begin high, offering 50 basis points before Morgan Stanley undercut them all with a 14 basis point offering.
In the long run, this means that trading crypto will be cheaper, where the clear winners will be retail traders, while crypto exchanges see their margins significantly trimmed, potentially affecting the likes of Coinbase, who recently cited financial issues as a reason for to reduce its workforce by 14%.
When announcing E*Trade, Jed Finn, Morgan Stanley’s head of wealth management, suggested the move was more about dominance than control. “This is much bigger than trading crypto at a cheaper rate.
“In a way, the strategy is disintermediating the disintermediators.” He added: “It’s going to be very competitive in the next couple of years,” explaining the move is aimed at ensuring its 8.6 million clients remain within its banking system instead of resorting to other platforms as the demand for crypto increases.
In his X post last week, Balchunas echoed Finn’s sentiment, framing the Wall Street giant’s move as a “SHOTS FIRED” moment. “Morgan Stanley is rolling out crypto trading on its E*Trade platform for 50bps per trade, undercutting Schwab’s 75bps (who undercut Coinbase).”
He said that based on his knowledge of how Schwab works, it will “likely won’t let this stand. Others will probably undercut too.” He also said that “by the time the dust settles it’ll be pretty dirt cheap to trade crypto everywhere.” Before concluding by saying “this is why (traditional financial) TradFi is no joke and crypto exchanges should be scared.”
However, crypto-native leaders rebuffed the “doom and gloom” narrative as U.S.-centric.
“While we respect Eric Balchunas’s insights on TradFi’s push into crypto, the perspective feels somewhat localized to the U.S. market and oversimplified for quick engagements on X,” said Kevin Lee, chief business officer at Gate, which ranks seventh on Coingecko with a 24 hour volume of nearly $2 billion.
Lee also told CoinDesk that Balchunas’ comments do not “fully capture the mature, global evolution of the crypto industry.”
The Gate CBO explained that the recent moves by the Wall Street giants to cut spot trading fees reflects the ongoing reduction of commissions that is normal to see when competition intensifies.
“This mirrors long-established patterns in equities markets, where fierce competition naturally compresses fees,” Lee said. “Smart platforms moved on long ago from fee-only models to diversified revenue streams including staking, structured products, institutional services, and ecosystem growth.”
Georgii Verbitskii, derivatives trader and founder of TYMIO, a non-custodial decentralized finance (DeFI) protocol, told CoinDesk he believes Morgan Stanley’s move into crypto trading is a good sign.
“This is clearly positive for crypto adoption overall,” Verbitskii said. “Morgan Stanley bringing crypto trading to millions of brokerage users is another sign that digital assets are becoming part of mainstream investment infrastructure, although the 50 bps fee itself is not especially competitive.”
Keneabasi Umoren, a crypto market analyst and Web3 researcher, recently told CoinDesk, he does not believe Wall Street will “kill exchanges, but it will squeeze U.S. spot-trading and custody revenue and push exchanges further into derivatives, DeFi and global markets.”


Anchorage Digital, the first federally chartered crypto bank in the U.S., says it will take a back seat to the Global Dollar stablecoin (USDG) consortium, which includes Robinhood and Kraken.
USDG, which has a circulating supply of around $3 billion, is issued by Paxos Digital Singapore and supervised by the Monetary Authority of Singapore. Other members include Galaxy Digital, OKX, Visa, Worldpay and Bullish (the owner of CoinDesk).
“We’re still supportive of it, and want to see it succeed, and are still part of the thing,” said Anchorage Digital co-founder and CEO Nathan McCauley in an interview. “But maybe not as up-front of a role as before.”
McCauley said that previously, Anchorage might have been boosting USDG specifically, but now the firm will take a more neutral approach. “I think one of the things you’re gonna see from us is increased neutrality on the stablecoins. It just makes sense to be neutral and not specifically be pushing any one stablecoin.”
Anchorage recently mentioned as many as 20 banks and tech giants are currently looking to issue stablecoins with the San Francisco-based custody firm. In April, Anchorage said it would partner with stablecoin issuance platform M0, which works with MetaMask and Bridge.
“With us becoming a white-label stablecoin issuer for so many different groups, you start to think about what’s the incentive structure, and is everything still aligned,” McCauley said.
Paxos did not respond to requests for comment by press time.

Michael Saylor’s business intelligence software giant, which turned into a massive bitcoin buyer, missed the mark last week but promised to return with more BTC accumulation.
It made it official minutes ago, announcing the latest substantial acquisition of 535 BTC for $43 million. The total stash has grown to 818,869 BTC, acquired for almost $62 billion.
It’s worth noting that Strategy’s position has turned green as the average acquisition price stands at $75,540, and its holdings’ current value is up to over $66 billion as of press time.
Strategy has acquired 535 BTC for ~$43.0 million at ~$80,340 per bitcoin and has achieved BTC Yield of 9.4% YTD 2026. As of 5/10/2026, we hodl 818,869 $BTC acquired for ~$61.86 billion at ~$75,540 per bitcoin. $MSTR $STRC https://t.co/qScHXi2BBJ
— Michael Saylor (@saylor) May 11, 2026
Today’s announcement comes shortly after Strategy’s Q1 results from last week, which outlined a substantial $12.5 billion loss mostly due to bitcoin’s declining price in that period.
Separately, the firm’s former CEO and co-founder, Michael Saylor, attracted some controversy earlier this month when he hinted that Strategy could sell some BTC to cover operational costs or pay dividends to shareholders.
It was a bit of a surprise for most investors as he had previously sworn not to sell any BTC. The topic went viral, and many industry participants weighed in. Some, such as Samson Mow, believe Strategy has the right to sell to fulfill its obligations to investors.
Agne Linge, Advisor to the Board at Wefi, told CryptoPotato that if Saylor and his company decide to sell, it would be a “calculated decision” rather than issuing new shares to fund dividend payments.
“I think the market for Bitcoin is rather mature, considering the players that are involved now- institutionals, seasoned long-term traders, therefore they understand that Mr. Saylor is running strategies for his corporation,” Linge added.
The post Strategy’s Bitcoin Buying Spree Resumes With Fresh 535 BTC Accumulation appeared first on CryptoPotato.
Sui’s native cryptocurrency has outperformed all top 10 digital assets over the past week after its valuation surged by double digits.
While optimism is running high on crypto X that the uptrend is far from over, some technical indicators suggest that a downside move could also be approaching.
What Sparked the Rally?
Several hours ago, SUI briefly pushed above $1.40, marking its highest level since January. The bears, though, quickly stepped in and trimmed part of the gains, bringing the price back to around $1.27 – still an impressive 35% jump on the week. SUI’s market capitalization surged past the $5 billion milestone, making it the 23rd-biggest cryptocurrency.
The main catalyst behind the upswing seems to be Sui Group Holdings’ decision to stake 108.7 million SUI tokens (worth over $140 million), thus removing almost 3% of the coin’s circulating supply from the market.
The analytics platform Santiment Intelligence added two more factors that could have also positively impacted the valuation. The first is the upcoming launch of CME Group SUI futures (scheduled for May 29) and the partnership with Paga, which focuses on cross-border African payments.
Paga is a leading settlement platform that allows millions of people to send, receive, and manage money across Africa. The collaboration with Sui aims to bring the Sui Dollar (USDsui) to the continent, giving users access to faster, cheaper, and more reliable digital payments.
Numerous analysts believe the asset’s valuation may reach new peaks soon. X user OxNeena noted the “massive breakout attempt” on the daily chart, envisioning an explosion above $2.50 should the price make a “clean flip” of the $1.30 zone.
For their part, CoinForge said they dismiss 98% of altcoins, but SUI isn’t among those. They argued that the asset’s price trajectory repeats the pattern seen last cycle, suggesting it could be gearing up for a major bull run in the coming months.
The Pre-Correction Signs
Contrary to the prevailing optimism among market observers, SUI’s Relative Strength Index (RSI) suggests a pullback may be the next move in the short term. The technical analysis tool measures the speed and magnitude of recent price changes and is used by traders to spot potential price reversal points.
It ranges from 0 to 100, where anything above 70 signals that the valuation has risen too much in a short period, which could be a precursor to a cool-off. Conversely, ratios below 30 hint that the asset is oversold and could be on the verge of a pump. Currently, SUI’s RSI stands at nearly 75.

In the meantime, exchange inflows have outpaced outflows over the past few days, indicating that investors have abandoned self-custody in favor of centralized platforms. This, in turn, increases the immediate selling pressure.

The post Sui (SUI) Soars 35% Weekly: What Fueled the Pump and What’s Next? appeared first on CryptoPotato.
The top 3 meme coins on the weekly radar split into very different technical paths. BUILDon (B) extends a breakout, MemeCore (M) loses key support, and Siren (SIREN) coils below a descending trendline that has capped price since March.
Daily charts show BUILDon pressing the 0.618 Fibonacci level at $0.48, MemeCore correcting toward $3.27 after rejection near $4, and SIREN testing the 0.786 Fibonacci retracement at $1.07 with expanding volatility.
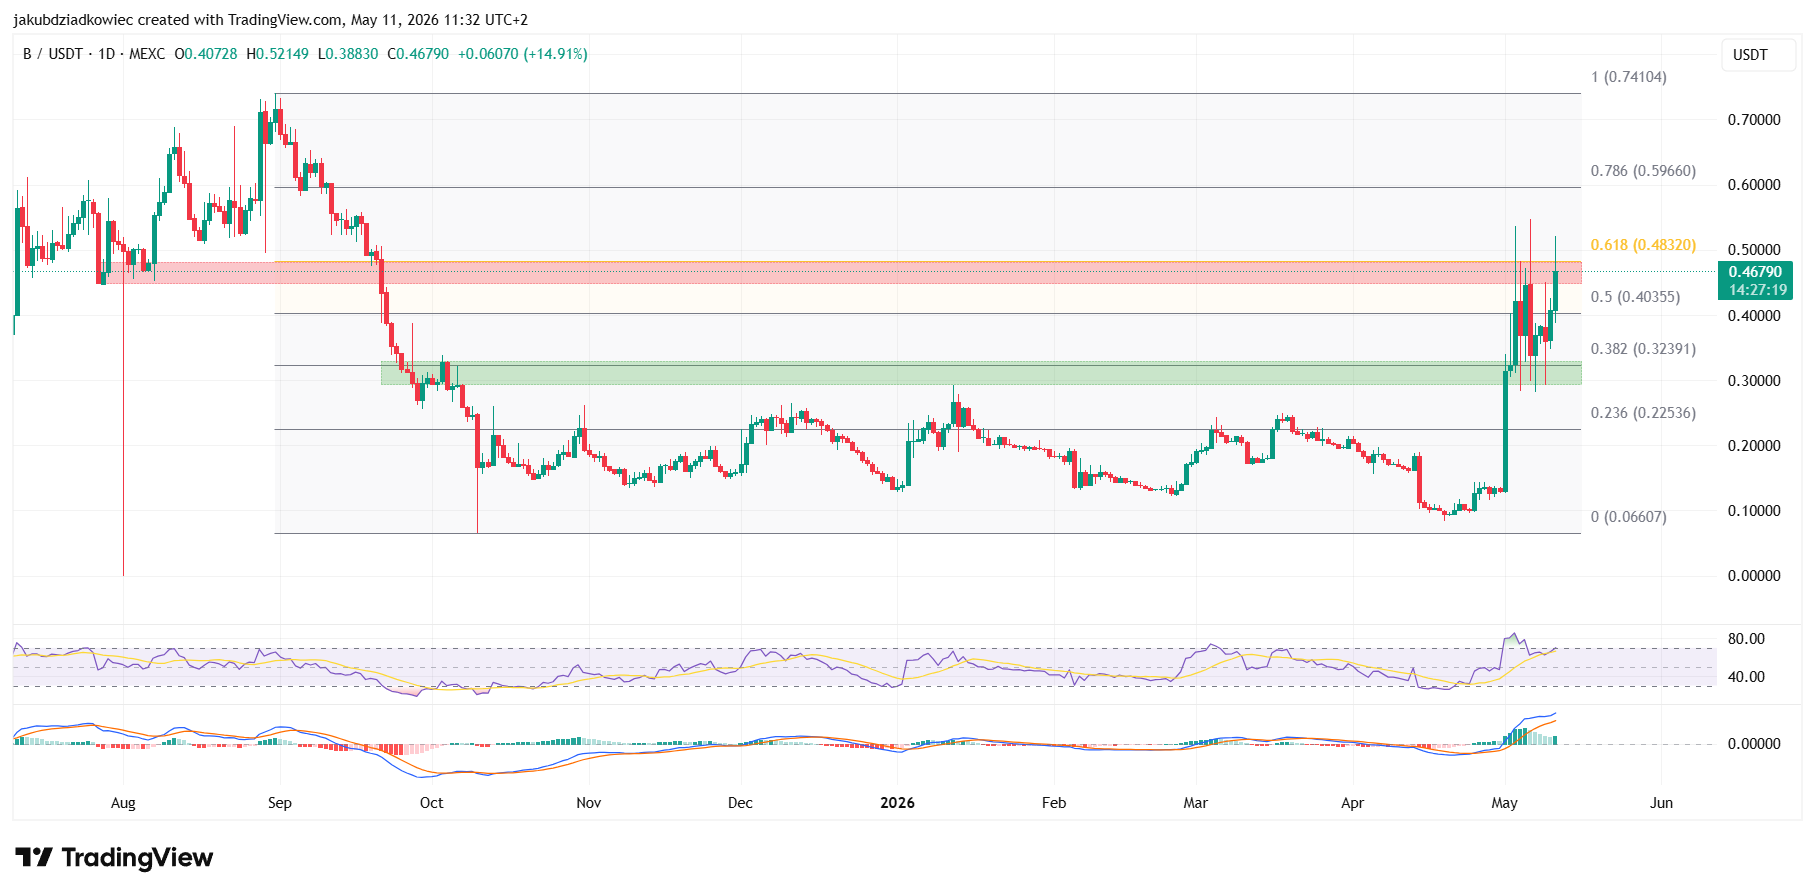
BUILDon (B) Bulls Press the $0.48 Resistance for a Third Time
BUILDon trades close to $0.4679 after a 14.91% daily gain, with intraday highs near $0.52 and lows at $0.38. The coin spent months inside a wide accumulation zone between $0.09 and $0.30 that reached back to September 2025.
Price broke out of that range on May 1 and confirmed the 0.382 Fibonacci retracement at $0.32 as fresh support. However, the 0.618 level at $0.48 has rejected B on three separate attempts so far in May.

The Relative Strength Index (RSI) sits close to 70, deep inside bullish territory. Meanwhile, the Moving Average Convergence Divergence (MACD) prints another taller green histogram bar after a short pause, which signals renewed upside momentum.
A confirmed daily close above $0.48 would open a path toward the 0.786 Fibonacci level near $0.60. Failure to clear that resistance could send the price back toward the $0.32 support shelf.
MemeCore (M) Slides Back After Losing Curved Support
In contrast to BUILDon, MemeCore trades at $3.27 after a 1.24% daily drop and shows clear technical weakness. The price action lost its exponential support curve at the end of April, which ended a steady advance that had held since February 1.
After that breakdown, M corrected to the 0.618 Fibonacci retracement at $2.59 before bouncing higher. The recovery retested the broken curve as resistance on May 7, then stalled around $4 at the 0.236 Fibonacci level.

The MACD now prints taller red histogram bars, which point to expanding bearish momentum. The RSI hovers in the neutral zone but trends lower, which warns that selling pressure has not yet been absorbed.
A second visit to $2.59 remains the base case if the current pullback continues. On the upside, bulls would need to reclaim $4 to invalidate the bearish setup, with the prior high near $4.85 the next major hurdle.
Siren (SIREN) Coils Under the Trendline as Volatility Returns
Siren offers a different setup again, with price compressing under a descending trendline that goes back to March 23. The line was confirmed as resistance on April 17 and tested once more on May 9.
SIREN currently trades at $1.17, close to the 0.786 Fibonacci retracement at $1.07, which has acted as a near-term magnet. Volatility, measured by the Bollinger Band Width Percentile (BBWP), recently sat at very low readings consistent with a contraction phase.

However, from May 6 through May 8, price activity began to expand again, with volatility ticking higher even though readings have not yet reached extreme zones. The RSI sits near 60 and slopes upward, which reinforces the building momentum.
A breakout above the trendline would extend gains toward the 0.618 Fibonacci retracement at $1.85 and then $2.40. The long-term support sits near $0.75, and a daily loss of $1.07 would put that floor back in play.
The post Top 3 Meme Coins to Watch This Week as BUILDon Targets $0.60 Breakout appeared first on BeInCrypto.
Crypto World
MoneySkills launches AI quantitative trading platform for 2026, enabling new users to easily earn daily returns

Disclosure: This article does not represent investment advice. The content and materials featured on this page are for educational purposes only.
MoneySkills unveils AI trading platform with automated execution and no-code crypto strategy tools.
Summary
- MoneySkills simplifies quantitative crypto trading with one-click automated strategy deployment.
- Built for beginners, MoneySkills removes coding and manual setup barriers through AI automation.
- With round-the-clock execution and AI optimization, MoneySkills aims to make automated trading more accessible in 2026.
One-click deployment, round-the-clock automated execution, and zero software costs redefine how ordinary investors access complex cryptocurrency strategies.
MoneySkills, a platform built specifically for AI-driven quantitative trading and automated strategy execution, announced today that its intelligent trading platform will go fully live in 2026.
MoneySkills aims to make complex algorithmic trading easy for mainstream users. It combines advanced AI-driven optimization models with a streamlined no-code interface, eliminating barriers such as traditional technical expertise, continuous market monitoring, and high software costs.

To celebrate the launch of its new platform and lower the barrier to entry for new users, MoneySkills is offering all newly registered users a sign-up bonus worth $15, along with $50 in free trial credits — enabling users to explore the platform’s full range of features without any upfront financial investment.
Breaking down the barriers to algorithmic trading
Historically, quantitative trading has been the exclusive domain of institutional investors and highly skilled individuals, requiring sophisticated programming skills, complex strategy design, and substantial infrastructure investment.
MoneySkills challenges this status quo with its unique “One-Click Activation” feature, allowing users to immediately deploy pre-configured AI trading strategies upon completing registration.
No programming knowledge, parameter configuration, or quantitative trading experience is required. Once activated, the platform automatically handles market monitoring, trade execution, and strategy optimization — freeing users from the tediousness of manual trading while ensuring uninterrupted, round-the-clock market participation.
The main advantages of one-click activation include:
- Zero Manual Setup: No programming, no parameter adjustment, and no prior experience required.
- Executes without manual intervention: The system automatically places orders and manages trades based on built-in strategic logic.
- Deploy immediately: A strategy can go live within minutes of registration.
- Save Time: Users no longer need to monitor screens or react to market fluctuations in real time.
AI optimization is the core
At the core of MoneySkills lies an advanced AI optimization engine that continuously analyzes market data and executes trades based on a clearly defined set of rules. Unlike manual trading, which is susceptible to emotional decision-making, fatigue, and time constraints, MoneySkills‘ automated approach ensures that its strategies operate stably within the 24/7 global cryptocurrency market.
This model is particularly well-suited for users seeking to enhance their trading discipline, alleviate operational stress, and save time, while still actively participating in the digital asset market. The platform’s AI layer continuously optimizes trade execution based on ever-changing market conditions, providing a smarter and more flexible trading experience — without user intervention.
How to get started
Getting started with MoneySkills takes just a few minutes:
1. Visit the official MoneySkills website and complete the registration process.
2. After registering, users can receive a registration bonus of $15 and $50 in free trial credits. The bonus will be automatically deposited into their account (click here to complete the registration).
3. Activate an AI trading strategy with a single click — no configuration or technical setup required.
4. Monitor strategy performance anytime via the web or mobile app. Users can get started without any fees, there are no complicated registration requirements, and no trading experience is needed.
Completely free: No hidden fees
MoneySkills is completely free of charge. There are no subscription fees, software licensing costs, or requirements to purchase any auxiliary trading tools. For new users, this zero-cost entry point minimizes the financial risk associated with exploration; for long-term participants, it ensures that the value generated by intelligent strategies remains undiminished by administrative overheads.
This reflects MoneySkills‘ broader mission: to make AI-driven quantitative trading truly accessible to a wider audience, regardless of their technical background or capital size.
Safety, transparency, and stability emphasized from the very beginning of the design
Security and operational transparency are MoneySkills’ top priorities. The platform employs robust security safeguards at every level, ranging from account protection and data integrity to the predictable, compliance-driven execution of automated strategies. Far from operating as a “black box,”
MoneySkills maintains clear and transparent processes, enabling users to stay fully informed at all times regarding the performance of their strategies and the allocation of their funds.
This commitment to stability is also reflected in operational performance. The platform is designed to ensure reliable and uninterrupted trade execution across diverse market environments, thereby guaranteeing that user-activated strategies continue to perform as expected — whether the market is trending, experiencing high volatility, or undergoing a consolidation phase. For users who entrust their trading activities to automated systems, the combination of security, transparency, and consistency serves as the cornerstone of their confidence.
Looking ahead: AI-powered trading will become the new standard
The cryptocurrency market is maturing rapidly, and users’ expectations for trading tools are changing accordingly. As manual trading is gradually supplanted by automated, AI-driven approaches, platforms like MoneySkills are spearheading a significant structural shift in how retail investors engage with the digital asset market.
MoneySkills boasts a rapidly growing user base, featuring a product architecture centered on ease of use and automation, alongside a clear commitment to eliminating the traditional cost and complexity barriers associated with quantitative trading. Entering 2026, MoneySkills will not only be a platform designed for experienced traders, but also for anyone ready to use their money more intelligently.
About MoneySkills
MoneySkills is an AI-driven quantitative trading platform dedicated to making automated cryptocurrency trading strategies easily accessible to everyone. Upholding core principles of security, efficiency, simplicity, and cost-free access, the platform enables users of all experience levels to deploy smart trading strategies and generate returns without any technical barriers or upfront investment.MoneySkills supports both web and mobile access, ensuring that users can manage their trading strategies anytime, anywhere.
For more information, visit the official MoneySkills website.
Disclosure: This content is provided by a third party. Neither crypto.news nor the author of this article endorses any product mentioned on this page. Users should conduct their own research before taking any action related to the company.
XRP (XRP) rallied 9% over the weekend to $1.50 as several technical and onchain indicators suggested it was due for a “full-scale” upward breakout.
Key takeaways:
- XRP’s funding rates and Bollinger Bands indicator warn of volatility in the coming days.
- XRP’s symmetrical triangle breakout targets $2.05.
XRP bullish reversal signals emerge
Data from TradingView showed XRP/USD remained 60% below its multiyear high of $3.66 reached in July 2025 and traded 21% below its yearly open of $1.83.
Despite this drawdown, several price indicators hinted at a potential upward breakout ahead.
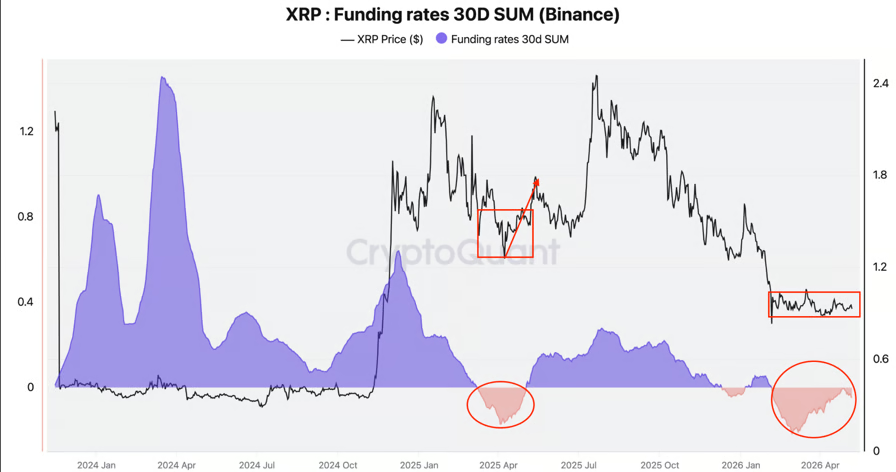
Analyzing XRP’s funding rates on Binance, analyst Darkfost flagged a key bullish signal, setting XRP/USD up for an upward run.
Related: XRP price copies 2025 chart fractal that last time sparked 66% gains
The funding rates 30-day sum on Binance have “maintained a bearish bias for nearly three months, even as XRP has posted a 27% gain over the same period,” the analyst said in a recent post on X, adding:
“When such a strong consensus forms, especially after a correction exceeding 60%, it is often a sign that a potential reversal may be developing.”

XRP/USD funding rates. Source: CryptoQuant
Previous instances show that XRP tends to rise sharply when funding rates recover after prolonged periods of being negative.
This notably happened in April 2025, when XRP reached $1.25, before a “bullish recovery eventually triggered a rally that led to a 126% advance,” the analyst added.
Meanwhile, the Bollinger Bands indicator, used by traders to assess price momentum and volatility within a certain range, reached its tightest point in 10 months, signaling that a significant price move could be underway.
The two-day XRP Bollinger Bands have slipped to their tightest level since July 2025, as shown in the chart below.
The XRP/USD pair surged about 90% in July 2025 to its multi-year high at $3.66, after breaking above the upper boundary of the Bollinger Bands. The gains were 72% in July 2024.

XRP/USD two-day chart. Source: Cointelegraph/TradingView
Analyst Seth said XRP has printed the “tightest Bollinger Band squeeze in years” on the daily time frame, adding:
“History says this kind of setup resolves with force.”

XRP/USD daily with tightening Bollinger Bands. Source: X/Seth
As Cointelegraph reported, multiple technical indicators suggested that XRP/USD is bottoming out, pointing to a possible rally to as high as $12.
XRP symmetrical triangle breakout is underway
The XRP/USD pair has broken above a symmetrical triangle on the daily chart, a setup typically associated with bullish reversals after prolonged consolidation.
The price has been compressing between two converging trend lines since February, with the upper boundary now acting as key support near the $1.40 psychological level.
A daily candlestick close above this level could open the way for a run toward the bullish target of the prevailing chart pattern at $2.05, roughly 41% above the current price.

XRP/USD daily chart. Source: Cointelegraph/TradingView
Meanwhile, the moving average convergence divergence (MACD) indicator is trading above the zero line and has produced a bullish cross, indicating rising buying momentum. Historically, similar MACD crossovers have preceded strong rebounds in XRP.
Analyst CW8900 said a “full-scale rise for $XRP is imminent,” after the price bounced off a multi-year support line on the three-day chart.

XRP/USD three-day chart. Source: X/CW8900
As Cointelegraph reported, buyers must break and sustain the XRP price above the $1.40- $1.61 seller congestion zone on the daily chart to signal a long-term trend shift.
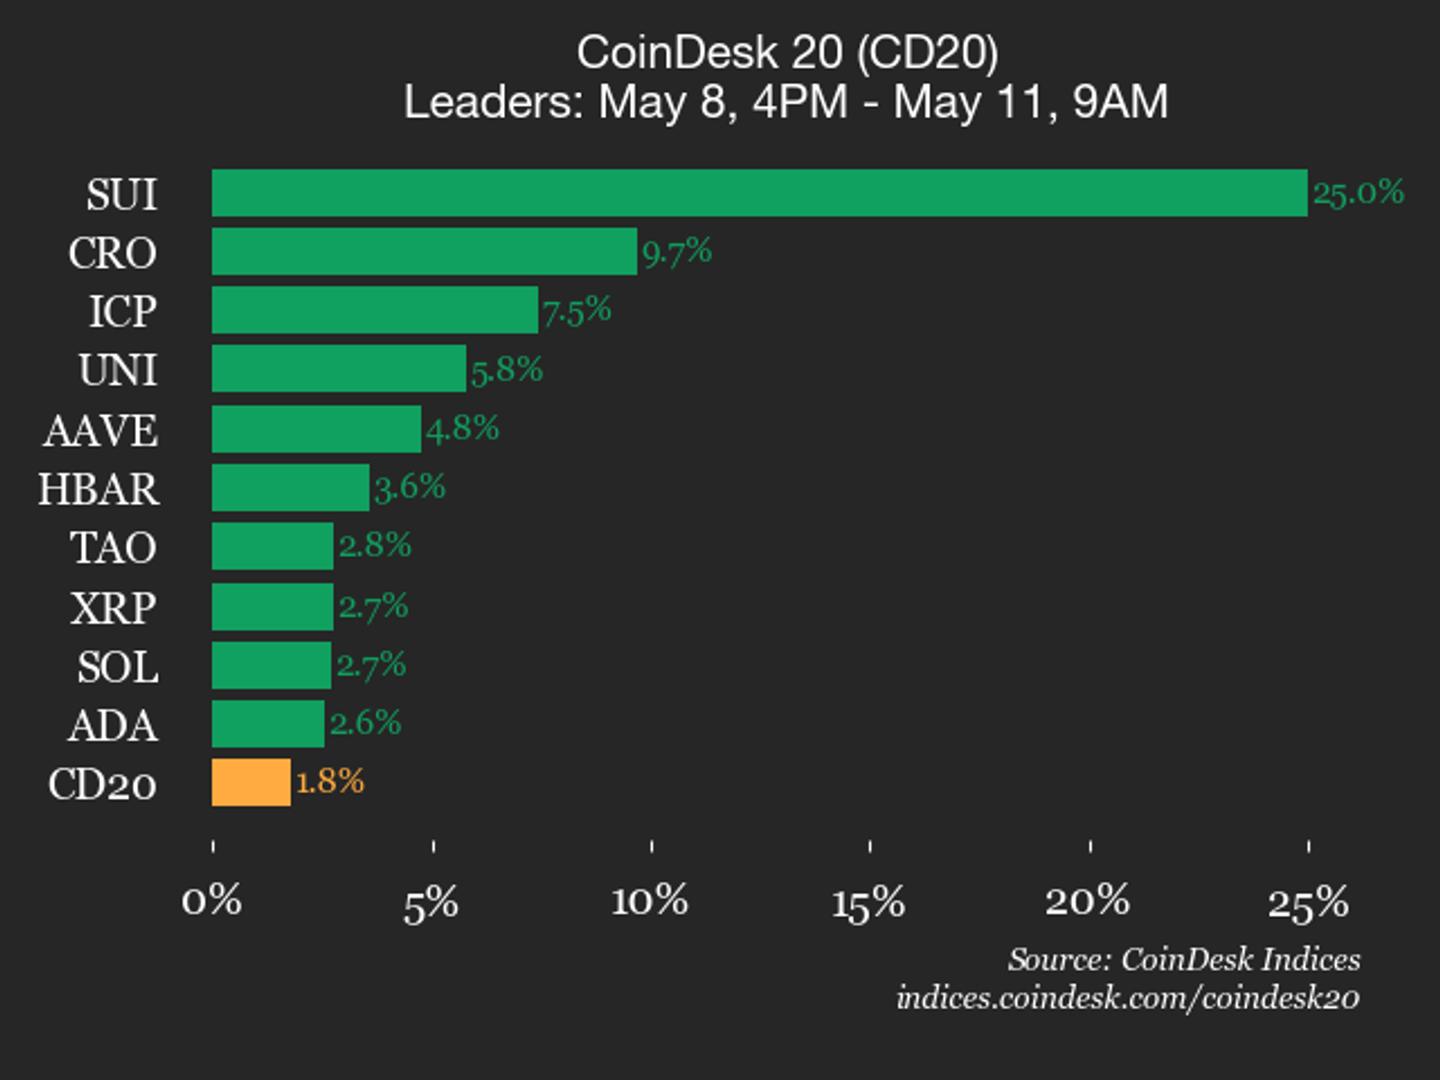

Cronos (CRO), up 9.7% from Friday, joined Sui (SUI) as a top performer.

xBubble allows users to complete specific tasks with simpler prompts by automatically building and dispatching task-specific AI agents.
Today, DAPPOS is launching xBubble, a low-prompt AI agent designed for users who want results, not prompt-tuning sessions.
With xBubble, users can turn short requests into deliverable work across creating image/video, websites, documents, and scheduled solutions, without testing models, assembling tools, building solutions, or vibe coding skills themselves.
xBubble is built around two core systems: Bubble Engine, which generates and tests task-specific SOPs that can be executed by AI agents, and Bubble Pilot, which reads a user’s request and dispatches it to the best available AI solution.
“Powerful AI no longer requires users to learn AI,” said the DAPPOS team. “xBubble inverts the relationship. We have AI learn AI, and we have AI use AI, so users don’t have to. The system evolves faster than any user can, and leverages AI more effectively than they can.”
Why low-prompt AI
AI capability is improving rapidly, and access is no longer the constraint. But as models grow more powerful, the gap between users who know how to operate AI and users who don’t is widening, not closing. The same model that produces professional results for power users often returns disappointing output for everyone else — and the gap compounds with every model release.
Closing that gap takes real work. Power users study how each model behaves across different task types, research which combinations of tools and skills chain together for a given workflow, and run repeated debugging cycles before outputs become reliable. They build internal playbooks of what works on which task, and re-learn the operating manual every time a new model launches — the know-how rarely transfers cleanly to the next release.
The bottleneck has shifted from model capability to model usability. The question is no longer only whether AI can complete a task. The question is whether ordinary users can reliably turn their goals into the right AI solution.
xBubble is designed to close that gap by inverting the relationship. Instead of users learning AI, xBubble has AI learn AI. Instead of users figuring out how to use AI, xBubble has AI use AI on their behalf. Bubble Engine does the learning. Bubble Pilot does the using. Users only state the goal.

The low-prompt approach
Dispatch task-specific AI solutions
Most AI products give users a blank box and a set of powerful tools. The user has to decide which model fits the task, which tools to chain, how to format the output, and how to recover when the result misses — and to re-learn that decision tree every time a new model arrives.
xBubble takes a different approach. It gives users a dispatch layer.
A short request is not sent to a general AI agent, but passed to a specified agent who can best understand and execute it. Bubble Pilot reads the user’s intent, identifies the task type, and routes the request to a solution that Bubble Engine has already built and tested.
This is what xBubble means by low-prompt AI. The goal is not to remove user intent. Users still describe what they want. The goal is to remove the burden of operating AI. Model choice, prompt structure, skills writing, tool selection and result testing move from users into the system.
Bubble Engine: A system that builds AI solutions for users
Bubble Engine is the part of xBubble that learns AI on the user’s behalf. It is the solution factory behind the system.
For a specified task, Bubble Engine uses AI coding agents to generate solution variants, build test harnesses, combine candidate models and tools, and evaluate outputs against task examples and quality criteria. The strongest route becomes an SOP (Standard Operating Procedure): a reusable solution that can be dispatched whenever a similar request appears.
Instead of relying on a fixed prompt template, Bubble Engine can generate task logic, test different execution paths and revise the solution for specified tasks. Bubble Engine will also test how versatile the SOP is before publishing it into xBubble’s dispatch layer.
This changes the unit of progress. A generic AI agent takes time and effort to deliver reliable results. xBubble starts from solutions that have already been designed for specific task types.
Bubble pilot: AI for using AI
Bubble Pilot is the part of xBubble that uses AI on the user’s behalf. It is the runtime dispatch layer that turns Bubble Engine’s solutions into delivered results.
It reads a short user trigger, identifies the task type, checks whether a matching SOP exists, and routes the request to the best available solution. If a specialized SOP fits, the user gets a task-optimized execution path. If no specialized SOP fits cleanly, Pilot falls back to a general-purpose agent so the user can still complete the task.
The user-facing change is simple. The work of choosing the right model, tool, and solution moves out of the user’s head and into the system.
The user states the goal. Bubble Pilot picks the path. Bubble Engine has already built the path.
Over time, recurring fallback requests can also inform what Bubble Engine builds next. When users repeatedly ask for a task that does not yet have a specialized SOP, that pattern becomes a candidate for solution generation and testing. Each new SOP expands what Bubble Pilot can dispatch. Each dispatch decision gives the system more signal about where low-prompt execution is most useful.
Available today
xBubble launches as a complete AI agent product, not a single-feature preview. It ships with 10+ core capabilities organized into two modes with multiple running environments that mirror how users actually work with AI.
Bubble computer
Bubble Computer is xBubble’s end-to-end project workspace. It unifies xBubble’s full capability stack into a single execution path, so a request that spans research, writing, design, and verification ships as one project rather than as a stitched-together chain of sessions. When Bubble Pilot detects multi-step work, it routes the request to Bubble Computer, where a sandbox spins up, specialized skills load on demand, and the project runs end-to-end without the user managing intermediate steps.
Within a single Computer run, xBubble can research a topic, draft documents, generate visual assets, verify claims, and deliver a final output. The user states the goal once. Bubble Computer handles model selection, tool routing, skill loading, and step coordination. The deliverable is the work product, not a conversation about one.
Bubble Personal
Bubble Personal is xBubble’s local-environment mode. It brings cloud AI home as a secure solution for work that requires access to a user’s own machine, operating across local files, browsers, apps, and schedules. Bubble Personal can automate website operations that need personal accounts, generate morning briefings from a user’s calendar and inbox, organize thousands of photos, or collect market data into a user’s drive overnight.
Bubble Personal runs on a sandboxed execution model. Installations, downloads, and system-level changes happen inside cloud containers and are destroyed once the task completes. On the user’s machine, only explicitly authorized actions execute, with no software installs or environment modifications. Heavy compute and risky operations stay in Bubble Cloud, and clean results flow back to the local workspace, giving users cloud-scale capability without local-environment risk.
Supported tasks
xBubble has two modes: fast and work. Fast mode is designed for simple daily tasks like research while work mode uses SOPs to deliver stable and professional results. Currently, we have supported the following task type:
- Voice Dictation: captures spoken input and turns it into clean text
- Text to Speech: reads xBubble’s responses aloud in natural voices
- Talking Avatar: generates visual content with style, format, and output structure handled by the system
- Deep Research
- Slides Creation
- Docs Creation
- Fact Check
- Scheduled Tasks
- Poster Creation
- Image Creation
- Video Creation
- Website Development
Built for results, save hours spent on learning AI
xBubble is built for users who know what they want but do not want to learn how AI is operated or spend time on multiple rounds of conversations with AI.
The core product thesis behind xBubble is simple: AI should learn AI. AI should use AI. Users just need to state goals.
Bubble Engine handles the learning. It studies how models behave, tests which tools and skills chain together, and builds reusable execution paths. Bubble Pilot handles the using. It reads each request and dispatches it to the right path. Users ask for outcomes and receive results.
Looking forward
DAPPOS will continue to improve Bubble Engine’s ability to build AI solutions for more complicated tasks. This leads to better performance for more tasks. As more SOPs are built by Bubble Engine, xBubble can also route more requests away from generic agents and toward task-optimized execution, making performance better with less response time.
The goal is simple: users should spend less time operating AI and more time using the results.
About DAPPOS
DAPPOS is an artificial intelligence company focused on building low-barrier AI products for general users and professionals. The company has secured over $20 million in funding from leading investors, including Polychain, Binance Labs, Sequoia China, IDG Capital, and OKX Ventures.
Learn more: https://medium.com/@dappos.com
The AI and crypto industries have made headlines over the past year thanks to the impressive war chests amassed by corporate political action committees (PACs).
Profligate spending during the last federal elections in the US has led to unprecedented policy changes favoring the crypto industry, with indications that a full legislative framework in the form of the CLARITY Act is on its way to becoming law.
But this hasn’t endeared the crypto industry to voters. Recent polls from Politico show distrust of the crypto industry, and the electorate isn’t sold on the benefits of AI.
“Voters across the ideological spectrum are raising concerns,” Michael Beckel, director of money in politics reform at Issue One, told Cointelegraph. “Some candidates on both sides of the aisle are trying to harness that frustration and outrage.”
Voters don’t trust crypto and don’t believe AI benefits them
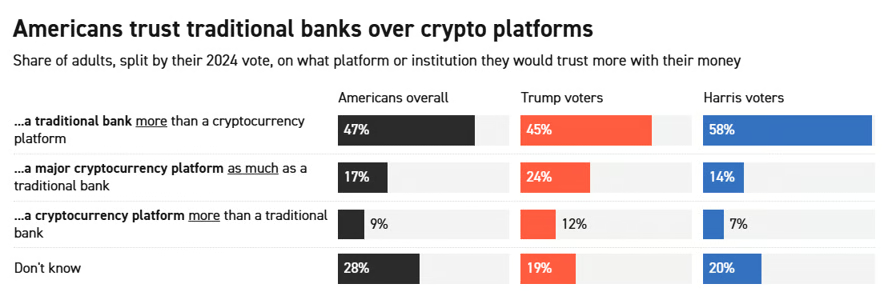
According to the recent poll by Public First for Politico, most Americans don’t trust crypto and don’t believe in the benefits of AI.

Source: Politico
While Republican voters are somewhat more likely to trust crypto, 47% of Americans overall trust a traditional bank over a crypto platform, while 17% trust a crypto platform as much as a traditional bank.
The numbers for AI aren’t great either. Some 43% of Americans overall believe that the risks outweigh the benefits, while 33% believe the inverse.

Source: Politico
Related: Crypto PACs secure massive war chests ahead of US midterms
Currently, most people haven’t heard about the major crypto and AI lobbies. According to Politico, only nine percent have heard of AI Super PAC Leading the Future. Only three percent have heard of pro-crypto PAC Fairshake.
That’s not much compared to public awareness of large lobbies like the National Rifle Association or the Planned Parenthood Action Fund, which are practically household names.
Still, association with crypto could be a problem. Ohio Republican Representative Jim Renacci told Politico, “I do think if they see somebody is backed by crypto, that’s always going to be a problem, because, let’s face it, the people that I talk to in Ohio, they don’t understand crypto, and most say they’re not comfortable with [it].”
Improving awareness around crypto lobbies may not help them much. Rick Claypool, research director at Public Citizen, told Cointelegraph:
“Generally speaking, voters are against corporate money influencing politics.”
“Even after Citizens United, the norm had been for big, brand-name corporations not to engage directly. Or when they did engage, they would often contribute through dark money groups that obscure their funding source.”
In this regard, the crypto industry’s spending spree in 2024 was somewhat unusual. Major contributors like Coinbase or a16z weren’t shy about the millions of dollars they put into campaigns.
But even then, “the voter-facing message from Fairshake was never about crypto, which voters never really cared about.” Mailers and ad buys reflected the supported candidates’ positions more broadly, or sometimes attacked those of the perceived anti-crypto candidate.
Overall, “candidates who are seen as not beholden to corporate interests have an electoral edge,” said Claypool. This was true for populist candidates like US Senator Bernie Sanders and even US President Donald Trump, who claimed during his 2016 campaign that “he was so rich he could not be bought, which is laughable in hindsight.”
If awareness about crypto — and crypto’s concerted efforts to influence policy — increases among the electorate, it may not shake out well.
Issue One’s Beckel said, “If voters view an industry as toxic, that can have serious implications for candidates who don’t want to be perceived as too close to a controversial company or industry.”
Grassroots organize against AI, crypto gets its day in Washington
Voter dissatisfaction with a certain industry has translated into real action.
Beckel noted a recent example when voter attitudes about the oil and fossil fuel lobby were enough to get some Democratic candidates to swear off any contributions. Beckel said that some organizations are already urging lawmakers to forswear any contributions from AI lobbies.
Indeed, there has been a grassroots movement growing against the AI industry more directly, namely the construction of the highly expensive and resource-intensive data centers. Local movements in seven states have blocked or delayed over $64 billion in data center investment. One state, Maine, is poised to introduce a state-wide ban.

Municipalities in California, Oregon, Arizona, Texas, Missouri, Indiana and Virginia have banned or delayed projects. Source: Data Center Watch
According to Claypool, this could prove a great opportunity for Congressional candidates “to seize the grassroots momentum against data centers and Big Tech for Democrats in particular, but not exclusively, since the tech sector has so fully enmeshed itself with the Trump administration.”
This increasing partisan alignment could also affect how voters perceive these industries.
Jason Thielman, former executive director of the National Republican Senatorial Committee, said that the crypto industry has attempted to “maintain a degree of bipartisanship and identify people whom they think will be champions on these issues.”
But even as the lobby claims to be bipartisan — Coinbase CEO Brian Armstrong called crypto “the most bipartisan issue” in DC — its priorities like deregulation and withdrawn enforcement lean mostly, but not exclusively, Republican, said Claypool.
Claypool said that “crypto billionaires have tried to present themselves as scrappy underdogs against Wall Street.”
“But that’s a less compelling argument now that crypto allies run, in addition to the White House, the DOJ, SEC, CFTC, the Treasury Dept., and the Commerce Dept.”
Furthermore, the sector has become deeply tied to Trump himself after the president’s full embrace of the industry in 2024, as well as pardons for convicted crypto execs and his use of crypto for his own personal enrichment.
With Trump’s popularity sliding due to geopolitical bungles, an unpredictable economic outlook and controversial policies at home, having ties to him and his party may carry political risk.
In a Democratic Illinois Senate primary, Illinois Lieutenant Governor Juliana Stratton accused her opponent Representative Raja Krishnamoorthi of being backed by big money from “MAGA-backed crypto bros.” She won by seven points.
It could also influence future policymaking. Said Beckel, “If an industry is viewed as a friend of one party and enemy of another, it may be more likely to be in the crosshairs or under the microscope when the other party is in power.”
For crypto and AI, that moment may come as soon as Nov. 4.
Magazine: XRP ‘probably going to $12,’ Bitcoin ETFs add $1B: Market Moves

Wall Street giants are triggering a massive fee war that could crush crypto exchange margins
Emily B Addresses Emmy’s Reaction To Taina’s Mother’s Day Gift

Old Money
Manchester United reach agreement with Casemiro over contract clause amid transfer speculation

US brings back mandatory military draft registration

Steven Gerrard disagrees with Gary Neville over ‘shock’ Chelsea and Arsenal claim | Football


-
 Crypto World3 days ago
HarrisX Poll Found 52% of Registered Voters Support the CLARITY Act
-

 Fashion3 days ago
Weekend Open Thread: Marianne Dress
-

 Crypto World4 days ago
Upbit adds B3 Korean won pair as Base token gains Korea access
-

 Tech7 days ago
Image AI models now drive app growth, beating chatbot upgrades
-
 NewsBeat4 days ago
NCP car park operator enters administration putting 340 UK sites at risk of closure
-

 Tech1 day ago
Auto Enthusiast Carves Functional Two-Stroke Engine from Solid Metal
-

 Politics2 days ago
Politics Home Article | Starmer Enters The Danger Zone
-
 Business2 days ago
Ignore market noise, India’s long-term story intact, say D-Street bulls Ramesh Damani and Sunil Singhania
-

 Crypto World6 days ago
UAE Free Zone Deploys Blockchain IDs to Verify Registered Firms
-

 Tech10 hours ago
GM Agrees To Pay $12.75 Million To Settle California Lawsuit Over Misuse Of Customers’ Driving Data
-

 Crypto World5 days ago
BlackRock CEO Larry Fink Discusses a New Asset Class
-

 Crypto World5 days ago
Robinhood says Wall Street is building onchain
-
Entertainment7 days ago
Serena Williams hits Met Gala in metallic dress after GLP-1 reveal
-

 Tech6 days ago
Apple and Samsung are dominating smartphone sales so thoroughly that only one other company makes the top 10
-

 Tech6 days ago
I tested the Xiaomi 17 Ultra’s camera and I don’t think I’ll ever go back to an iPhone
-

 Fashion5 days ago
The Best Work Pants for Women in 2026
-
 Sports7 days ago
Everton v Man City LIVE: Haaland’s two-word response as visitors collapse to hand Arsenal advantage in Premier League title race
-

 Politics6 days ago
Met Gala 2026: Madonna’s Dramatic Red Carpet Look Steals The Show
-
 Tech4 days ago
AI agents are missing all the discussions your team is having. SageOX has an answer: agentic context infrastructure
-
Crypto World4 days ago
The FOMO Is Back: Why Bitcoin’s Latest Rally Has Analysts Flashing Warning Signs
You must be logged in to post a comment Login