
Crypto World
Magnificent 7 Tech Giants Shed $850B in Market Value During Brutal Week

Key Takeaways
- A staggering $850 billion evaporated from the market capitalization of the “Magnificent Seven” tech behemoths within one trading week.
- Meta experienced its sharpest weekly decline since October 2025, plummeting over 11% following a major social media platform lawsuit defeat.
- Microsoft headed toward its weakest quarterly performance in 16 years, sliding 6.5% during the five-day period.
- Bitcoin trades around the $65,000 level while the S&P 500 has surrendered more than 7% year-to-date, as market participants now anticipate potential rate increases rather than cuts.
- Among the Magnificent Seven, Apple stood alone with positive weekly returns, bolstered by speculation around expanding Siri’s AI partnerships beyond OpenAI.
The world’s largest technology companies, collectively known as the “Magnificent Seven” megacap stocks, endured a devastating week that eliminated more than $850 billion from their total market capitalization. The massive selloff reverberated throughout financial markets, impacting everything from equities to digital currencies.
Meta suffered an 11% weekly plunge, marking its steepest decline since October 2025. The social media giant’s shares tumbled after a jury verdict determined both Meta and Alphabet, Google’s parent entity, were negligent in safeguarding young users on their respective platforms. Alphabet shares declined nearly 9% during the same period.
Microsoft recorded a 6.5% weekly loss. The software titan is currently tracking toward its poorest quarterly showing since the 2008 financial crisis. Technology software companies have experienced particularly acute selling pressure.
Nvidia and Amazon both experienced approximately 3% weekly declines. Tesla shares retreated nearly 2% over the same timeframe.
What Triggered the Tech Stock Selloff
Bond yields climbed significantly throughout the week as market participants incorporated expectations for elevated inflation levels, partially driven by accelerating oil prices. This shift has completely eliminated forecasts for Federal Reserve interest rate reductions. Financial markets currently assign greater probability to a 2026 rate increase than a rate decrease.
This macroeconomic backdrop proves particularly damaging for growth-oriented equities, which typically depend on accessible capital and future profit projections that diminish in value during rising rate environments.
Chip manufacturers also experienced turbulence mid-week following Alphabet’s publication of new research outlining an algorithm capable of decreasing AI memory requirements. This development hammered memory semiconductor producers including Sandisk and Micron Technology on Thursday. While both companies finished the week with losses, the sector experienced partial recovery Friday.
The S&P 500 has now surrendered over 7% since the beginning of the year. The Nasdaq has entered correction territory. The VIX volatility index, commonly referred to as Wall Street’s fear gauge, surpassed 30 — reaching its highest reading in twelve months.
Cryptocurrency and Traditional Safe Haven Performance
Bitcoin currently hovers around $65,000, significantly beneath its previous peak levels. Gold has similarly retreated approximately $500 from its January all-time high.
The current market landscape has provided investors with limited refuge options. International equity markets are also trailing their domestic counterparts.
Torsten Sløk, chief economist at Apollo, expressed his belief that markets are demonstrating excessive reaction and predicted the current turbulence should persist for approximately four to six weeks before conditions normalize. Keith Lerner, chief investment officer at Truist Wealth, advised clients this week that “measured cash deployment is warranted.”
Apple emerged as the sole positive performer among the Magnificent Seven, concluding the week with modest gains. Reports surfaced suggesting the technology giant plans to expand its Siri voice assistant platform to accommodate AI services beyond its existing OpenAI partnership.
As of the latest market close, the S&P 500 registered 6,368, representing a 1.67% Friday decline.


Ether’s (ETH) grip on the cryptocurrency market’s number-two spot is weakening, not because it is getting any closer to overtaking Bitcoin (BTC), but because the stablecoin economy is booming.
Key takeaways:
Ethereum’s No. 2 ranking at risk in 2026
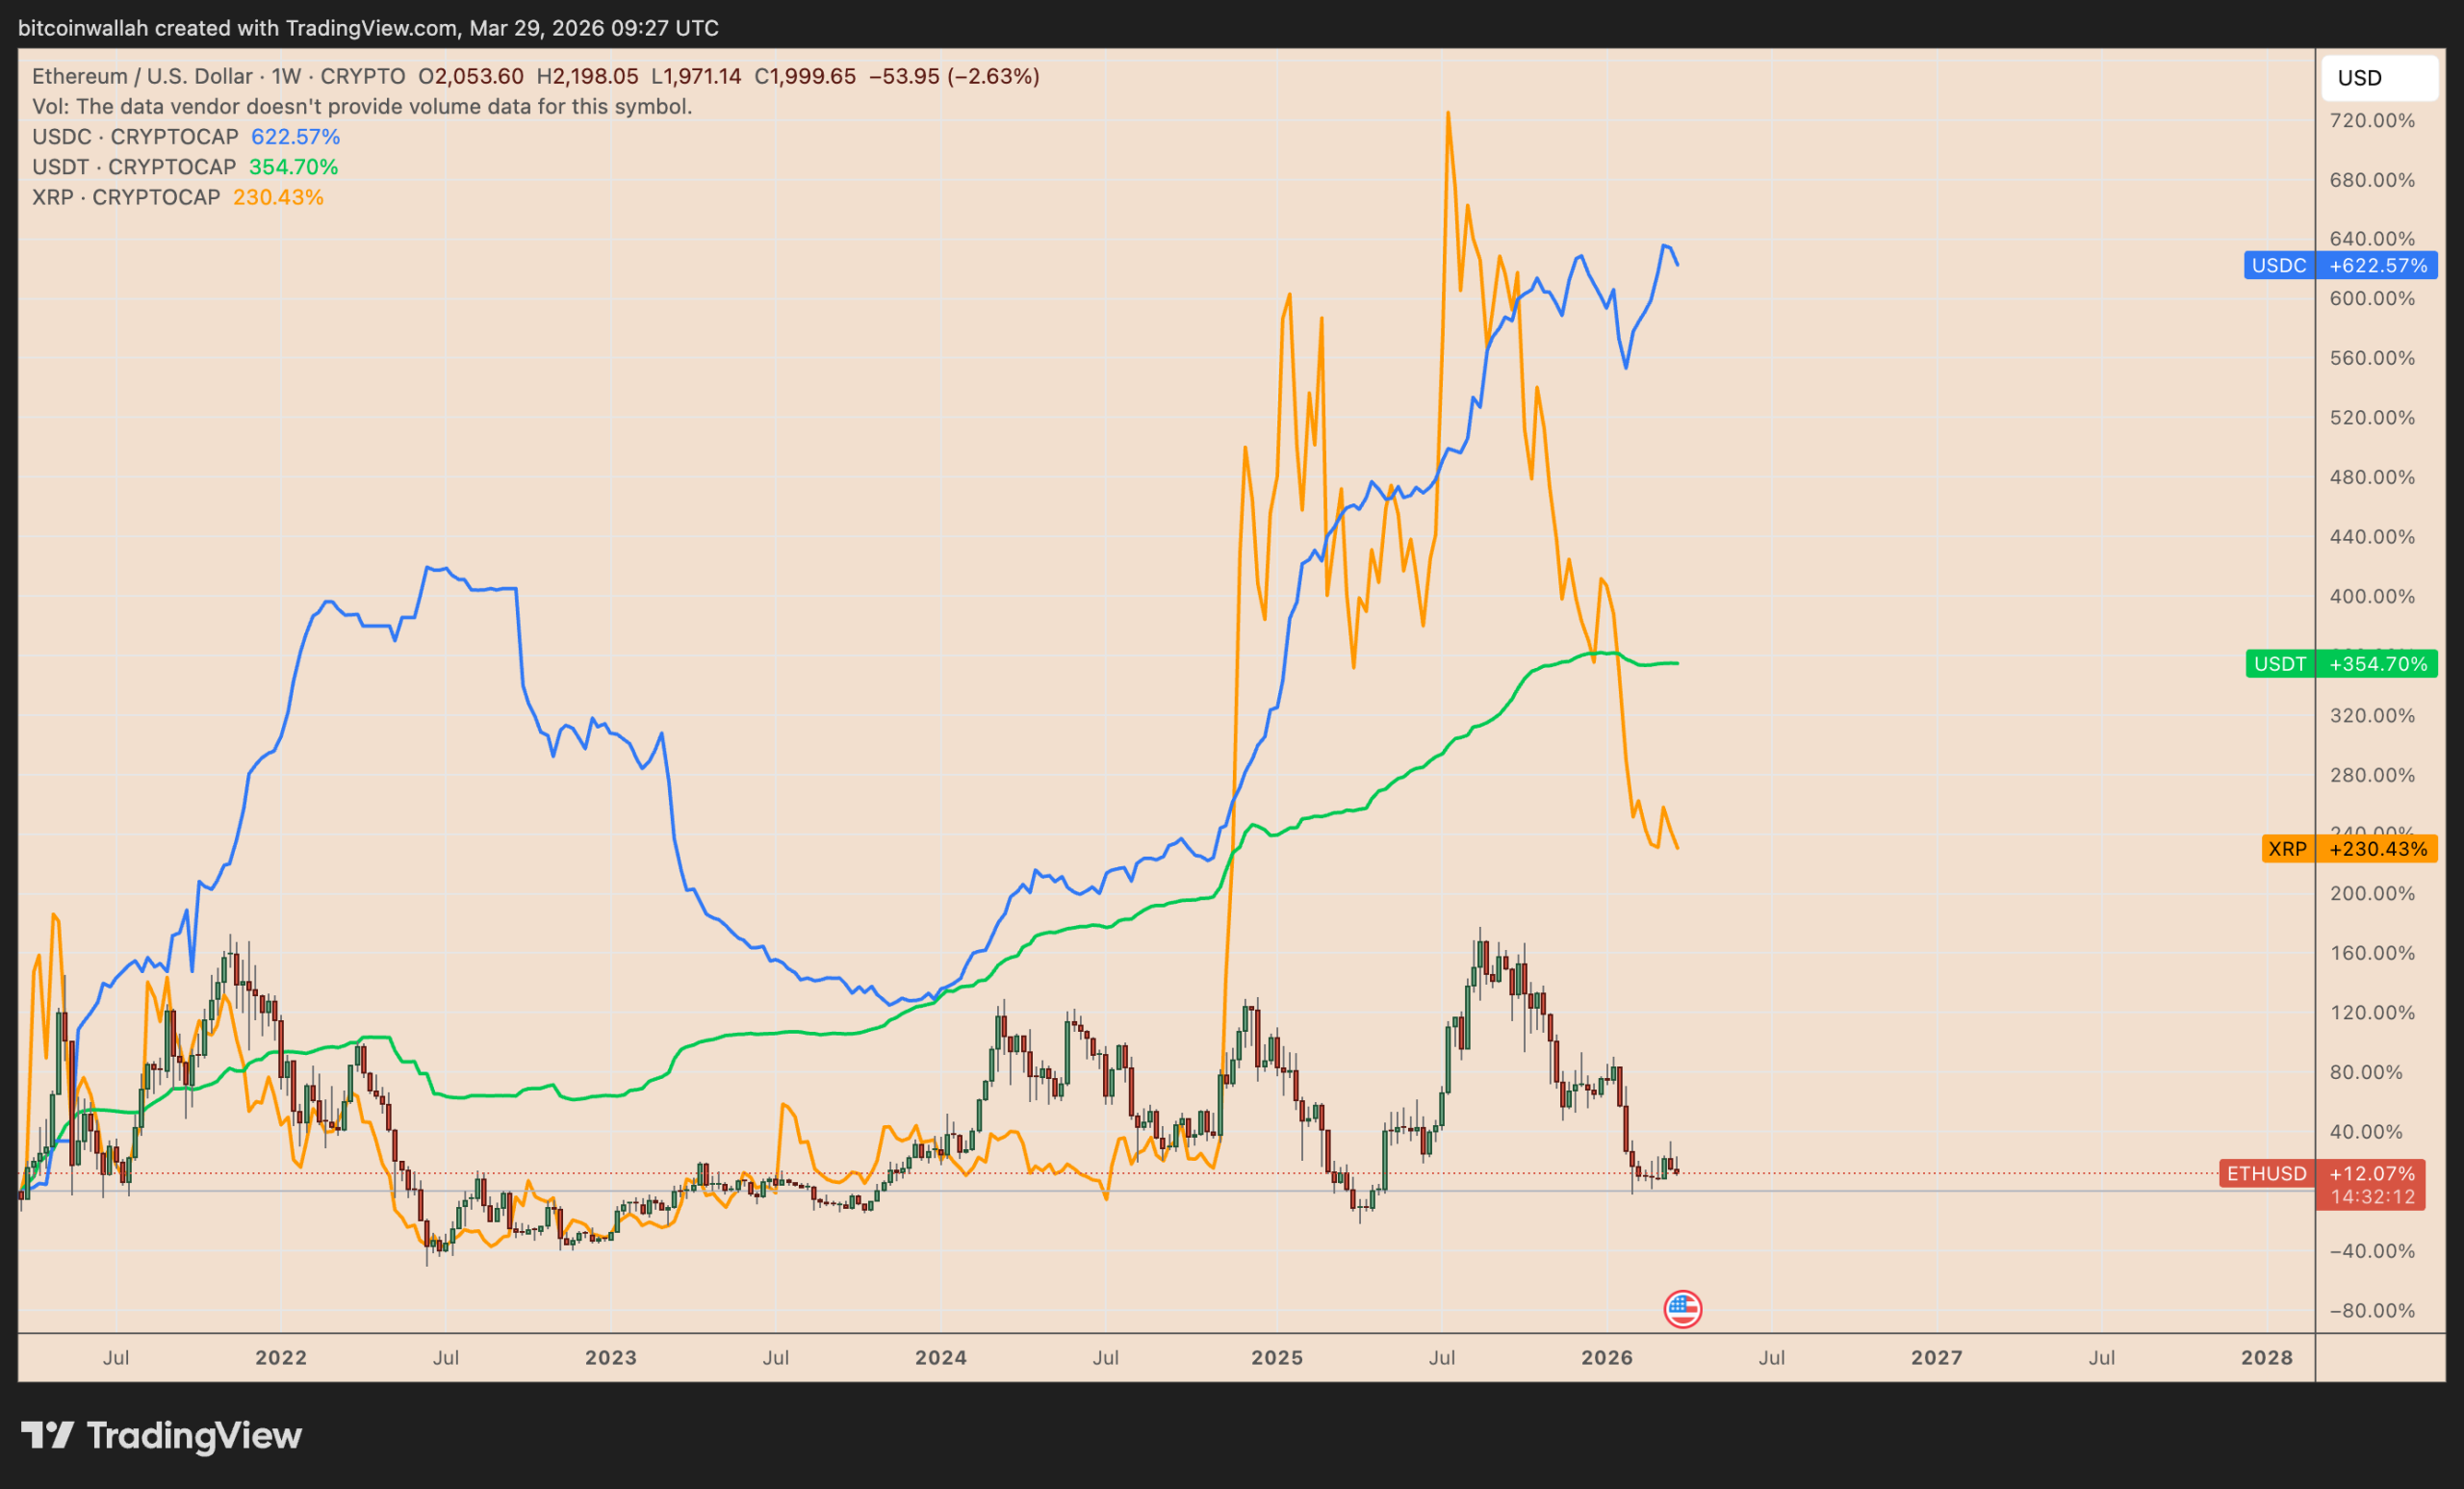
In the past five years, Ether has vastly underperformed its top competitors for the no. 2 spot, primarily Tether’s stablecoin USDT (USDT).
On a five-year rolling basis, ETH’s market capitalization grew by roughly 11.75% to around $240 billion.

In comparison, USDT, the third-largest cryptocurrency, grew 622.50% in the same period, with its market cap reaching over $184 billion. Even XRP (XRP) and USD Coin (USDC) have outperformed Ether’s growth.
As a result, more traders are betting on Ethereum’s flippening in 2026.
On Polymarket’s betting platform, for instance, over 59% of punters placed bets in favor of Ether losing the number-two spot in 2026. These odds were just 17% at the year’s beginning.

Why has Ethereum lagged behind Tether?
Ethereum and Tether grow differently because one is crypto, the other is fiat.
Ethereum’s market value depends largely on ETH’s price rising, and that has been difficult to sustain in 2026 as crypto markets come under pressure from macro headwinds such as US tariffs, the US and Israel vs. Iran war, and fading expectations for Federal Reserve rate cuts.
That weakness has also been reflected in institutional demand. US spot Ethereum ETFs saw assets under management fall by about 65%, dropping to $11.76 billion in March from $31.86 billion in October last year, underscoring how the appetite for ETH has decreased over the past few months.

Tether, by contrast, grows when capital flows into stablecoins and investors buy “crypto dollars.” That tends to happen when traders want safety, liquidity, or flexibility instead of exposure to volatile assets like ETH.
Related: AI and stablecoins are winning despite 2026 crypto market slump
The total stablecoin market is now worth $310 billion, compared to around $5 billion in 2020, with Tether’s share at 58%.

Demand for this kind of “dry powder,” capital parked in a dollar-pegged asset while investors wait for better crypto entry points, usually stays firm during risk-off periods.
Ethereum needs a stronger risk appetite to lift ETH’s price, while Tether benefits when investors turn defensive. That helps explain why ETH market cap growth has lagged behind USDT despite remaining one of crypto’s core infrastructure assets.
Can the ETH price fall further in 2026?
From a technical perspective, Ether faces risks of further price declines in 2026.
As of Sunday, it was trading inside what appears to be a “bear flag” pattern, which increases the odds of resolving to the downside, given the price breaks decisively below the structure’s lower trendline.

ETH price risks falling toward the flag’s measured downside target at around $1,250 by June if the breakdown below the lower trend line persists.


Opinion by: Kevin Loaec, CEO of Wizardsardine
For decades, institutions have followed a familiar pattern when managing assets. They choose a large, regulated custodian. Then, institutions transfer responsibility. Institutions rely on the assumption that scale, compliance and insurance equate to safety.
In traditional finance, this approach holds. Transactions are reversible, central banks provide backstops and regulators can intervene. When something breaks, there are mechanisms to absorb, unwind or redistribute the damage.
Bitcoin changes those assumptions completely because it is a bearer asset. Control is defined by cryptographic keys, and not account credentials. Every single transaction is final. There is no authority that can freeze, reverse, or recover funds once they move onchain. Yet, many institutions still approach Bitcoin using the same mental model they apply to more traditional assets.
The result is a quiet contradiction. Institutions pay custodians large fees for the appearance of safety. They also accept the risks that Bitcoin was designed to mitigate.
When control is outsourced, risk concentrates
Custodial models are built on delegation. Assets are pooled. Keys are shared, abstracted or held behind layers of internal controls. Governance lives offchain. It’s enforced through policies, approvals and service agreements rather than the asset itself.
From an organizational perspective, this can feel sensible because responsibility is externalized. Liability appears contained and insurance is cited as a backstop.
Bitcoin does not recognize delegation. If keys are compromised, lost or misused, there is no external authority that can intervene. Insurance coverage is often partial, capped or conditional.
As a result, in a systemic failure, clients face the same bottleneck. There is a single custodian holding assets for many parties, with limited ability to make everyone whole.
This is not a theoretical concern. Concentrated custody creates honeypots. Honeypots attract failure. Failures can occur through technical compromise, internal error, regulatory action or operational breakdown. In Bitcoin, concentrating control does not reduce risk. It does the opposite: Risk is amplified.
The industry has already seen how this plays out. Large, centralized custody models have failed before. They’ve left consumers, businesses and counterparties tied up in lengthy recovery processes. Limited visibility, with uneven outcomes.
Governance cannot live outside the asset
The core misunderstanding is not technical. It is organizational. Institutions are accustomed to enforcing governance through accounts, permissions, emails and internal workflows. That approach works when assets themselves are controlled by intermediaries. In Bitcoin, governance that lives outside the asset is, at best, advisory.
If an institution does not control the keys, it does not control the asset. Boards and auditors are right to be wary of fragile set-ups. A model where one individual can move funds is indefensible. Regulators are also right to push back against unclear control structures.
The choice is not between a single-key wallet and full custodial outsourcing. Bitcoin allows governance to be enforced directly at the protocol level. Spending conditions, approval thresholds, delays and recovery paths can be encoded into the wallet. Control becomes structural rather than procedural. The network enforces the rules, not a vendor’s backend or a support desk.
Policy-driven custody changes the risk model
Modern Bitcoin scripting makes it possible to design custody around real organizational needs.
An institution can require multiple stakeholders to approve transactions. It can enforce time delays. It can define recovery paths if keys are lost or personnel change. It can separate day-to-day operations from emergency controls. These rules are enforced onchain, deterministically, every time. All of this fundamentally alters the risk profile.
Related: The crypto events that reshaped the industry in 2025
Instead of trusting a custodian to behave correctly under stress, institutions rely on systems that behave predictably by design. Instead of outsourcing risk to insurance policies, they reduce the likelihood of catastrophic failure in the first place. It is a matter of engineering.
The insurance narrative deserves scrutiny
Custodial insurance is often presented as the ultimate safeguard when in practice, it is frequently misunderstood. Several high-profile custody failures have shown that insurance coverage often falls short of client expectations, either due to coverage caps, exclusions or prolonged claims processes.
Large custodians insure pooled assets, and coverage limits rarely scale linearly with assets under custody. Exclusions are also common and payouts depend largely on the nature of the incident, and the custodian’s internal controls. In a systemic event, insurance does not eliminate risk, it distributes a fraction of it.
By contrast, individually controlled, policy-driven Bitcoin wallets are far easier to underwrite. Risk is isolated, controls are transparent and failure scenarios are bounded. For insurers, this is a simpler and more predictable model. The process of insurance works best when it complements strong controls, not when it compensates for their absence.
Sovereignty is operational, not philosophical
Vendor dependence introduces another layer of institutional risk that is not often known. Custodial outages, policy changes, or regulatory interventions can leave funds temporarily inaccessible. Exiting a custodian relationship can be slow, expensive and operationally complex, particularly for organizations operating across jurisdictions.
In practice, this has already happened through withdrawal freezes, compliance-driven access restrictions and service outages that left clients unable to move assets precisely when timing mattered most.
With onchain, open-source custody systems, the software provider is not the gatekeeper. If a service disappears, the institution retains control. Interfaces can change and providers can be replaced. The asset remains accessible because control lives on the blockchain, not inside a company’s infrastructure. This is not an argument against service providers but an argument for removing them from the critical path of asset control.
Trust the protocol, not the promise
Bitcoin offers institutions something rare: the ability to hold a high-value asset with rules that are transparent, enforceable and independent of any single counterparty.
Yet many institutions still prefer familiar narratives over structural safety. Log-in screens feel safer than scripts. Brands feel safer than math, and insurance sounds safer than prevention.
This level of comfort can come at a huge cost.
Institutions should not pay for the illusion of safety while absorbing unnecessary counterparty risk. Bitcoin allows governance, recoverability and control to be built directly into how assets are held. The technology is mature. The tools exist.
What remains is the willingness to abandon custody models that belong to a different financial system.
Opinion by: Kevin Loaec, CEO of Wizardsardine.
This opinion article presents the author’s expert view, and it may not reflect the views of Cointelegraph.com. This content has undergone editorial review to ensure clarity and relevance. Cointelegraph remains committed to transparent reporting and upholding the highest standards of journalism. Readers are encouraged to conduct their own research before taking any actions related to the company.


Bitcoin held above $66,000 through most of the weekend, even as some traders expected sharper moves.
Summary
- Bitcoin stayed above $66,000 for 36 hours after rebounding from Friday’s four-week low near $65,500.
- Major altcoins showed limited movement, while Bitcoin dominance slipped to 56% and market cap stalled.
- SIREN surged 13% to $1.80, while PI rebounded above $0.18 after recent weakness.
The steady action followed a volatile week that pushed the asset from near $72,000 to a four-week low before it recovered.
Most large-cap altcoins tracked Bitcoin’s calmer pace. Ethereum, XRP, Solana, and BNB posted only small moves, while a few smaller tokens recorded wider swings.
Bitcoin entered the weekend after several quick moves during the week. It traded above $70,000 last weekend, then dropped toward $67,500 on Monday as broader market tension returned.
The asset then climbed close to $72,000 after US President Donald Trump said the United States had reached a “de-escalation deal” with Iran. That move faded after Iran denied the claim, which pushed Bitcoin back toward $69,000.
Buyers lifted Bitcoin again to the $72,000 area on Wednesday morning. That rebound did not last, and another rejection followed later in the week.
By Friday, Bitcoin had fallen to around $65,500, its lowest level in four weeks. It then recovered and stayed above $66,000 for roughly 36 hours, showing a more stable pattern than some weekend forecasts had suggested.
Market cap and dominance stay under pressure
Despite the recovery from Friday’s low, Bitcoin’s market capitalization remained near $1.330 trillion. Its share of the total crypto market also slipped, with dominance standing at 56% on CoinGecko data.
The broader crypto market showed little change during the same period. Total market capitalization stayed near $2.370 trillion, which pointed to a pause in momentum across major digital assets.
Large-cap altcoins mostly moved in a narrow range. ETH, XRP, SOL, and DOGE posted small losses, while BNB, TRX, BCH, XMR, and HYPE recorded modest gains.
That price action suggested traders remained cautious after the earlier swings. The market did not show strong follow-through in either direction by Sunday.
SIREN surges while PI posts a modest rebound
Among smaller tokens, SIREN remained one of the most active names. The token gained another 13% over the past 24 hours and traded around $1.80.
Its recent trading range has been wide. SIREN had climbed to $3.60 earlier in the week before falling to $1.00, then rebounding again over the following days.
Pi Network’s PI token also moved higher, though at a slower pace. It rose more than 3% on the day and traded near $0.18 after slipping below $0.175.
Disclosure: This article does not represent investment advice. The content and materials featured on this page are for educational purposes only.


Onchain commodity trading is drawing more attention as traders look for round-the-clock access to oil, gold, and index products.
Summary
- Hyperliquid recorded $5.4 billion in macro perpetual volume as silver, oil, gold and indices led.
- Weekend access kept onchain markets open while traditional commodity venues stayed closed to active traders.
- Thin liquidity and wider spreads still keep onchain commodity trading below institutional size and execution.
Recent volume data shows that demand is rising, but limited liquidity still keeps traditional markets ahead in scale and execution.
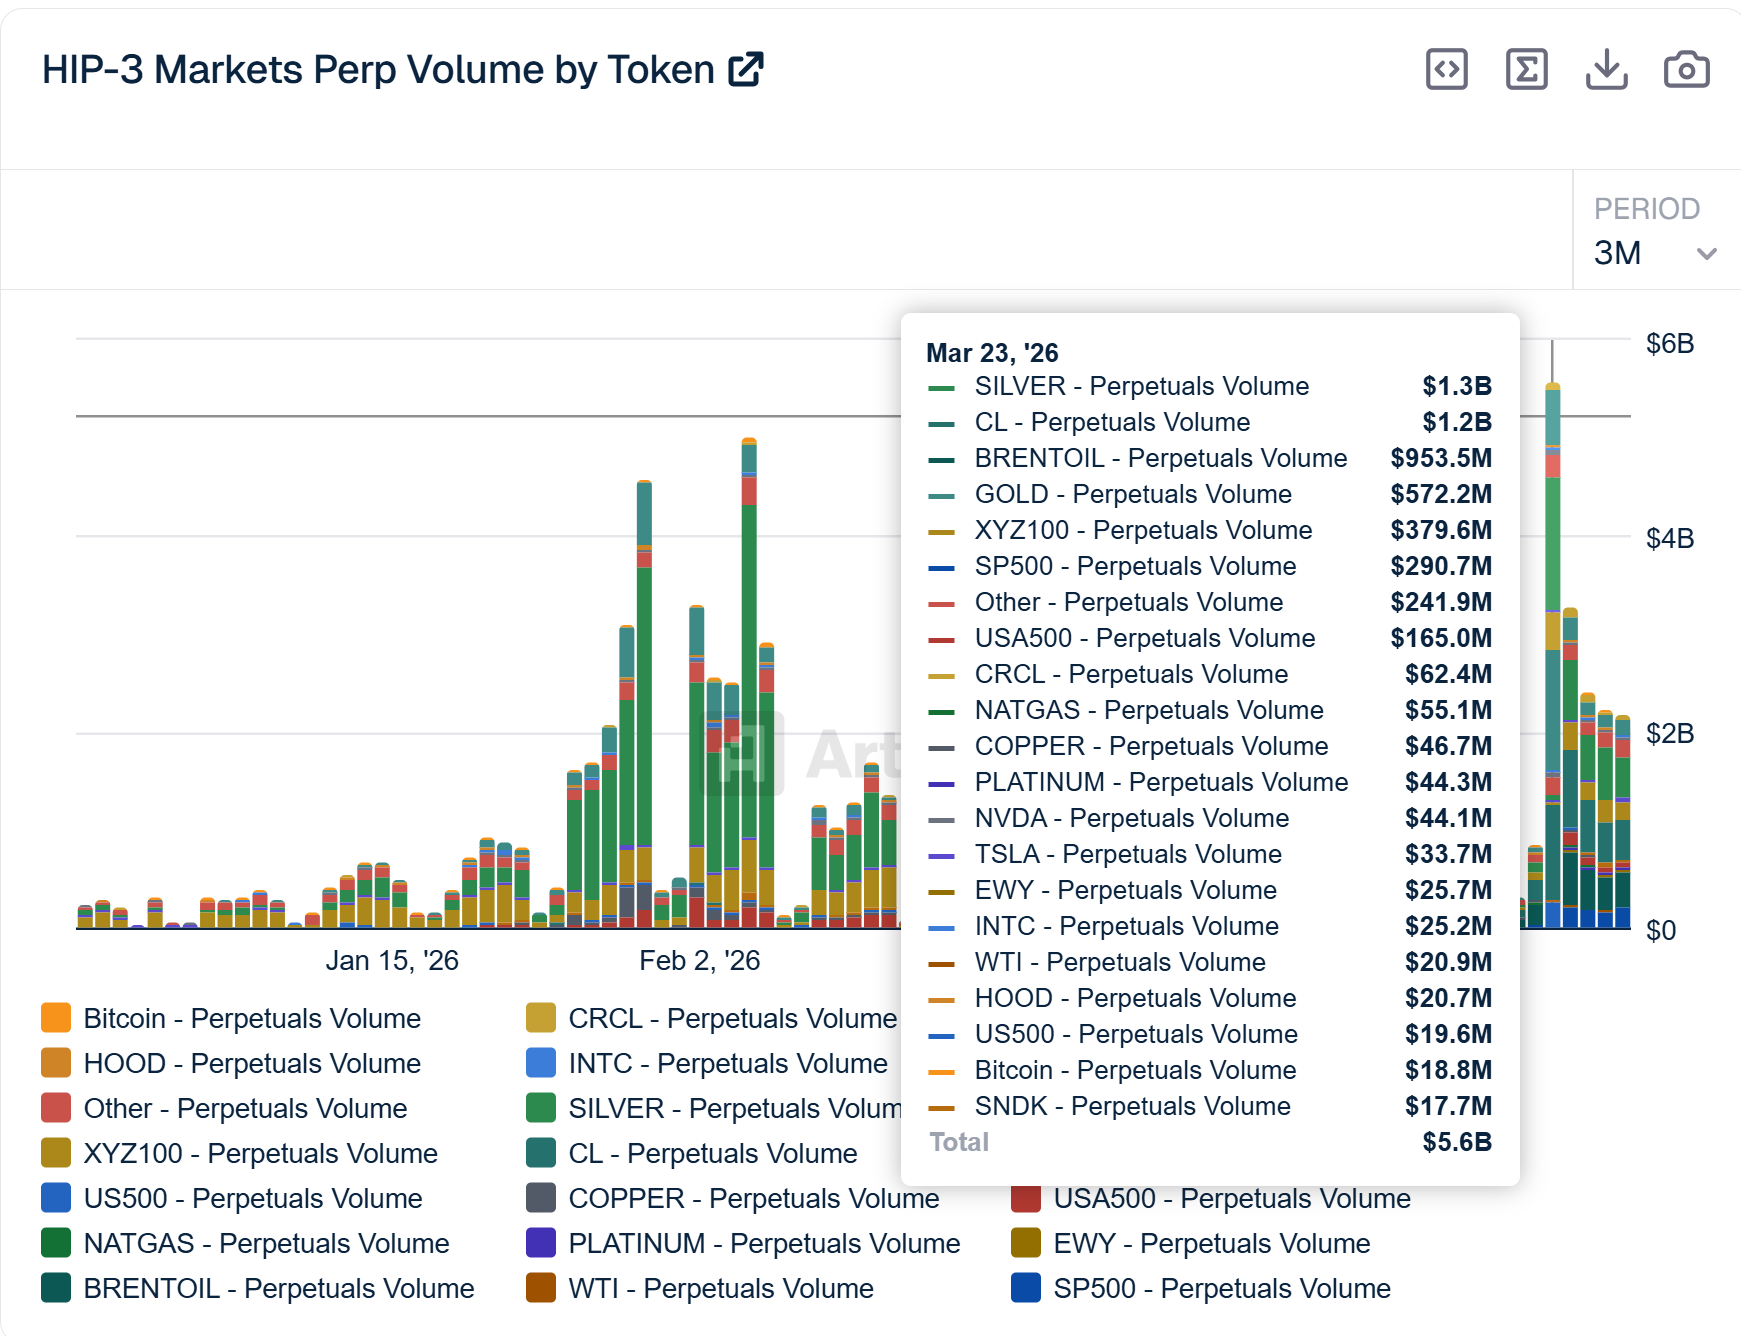
Hyperliquid’s HIP-3 market reached a new record on March 23. The platform posted about $5.4 billion in perpetual futures volume across commodities and macro assets. Silver led activity with $1.3 billion, while WTI crude oil reached $1.2 billion. Brent crude oil recorded $940 million, and gold posted $558 million.
The rise in volume points to broader interest in onchain macro trading. Equity indices such as the Nasdaq and S&P 500 also drew activity. This shows that traders are using decentralized markets for more than crypto-linked positions.
One of the main strengths of onchain trading is constant market access. Traditional exchanges close for part of the weekend, but decentralized platforms remain open. That gap gives traders a way to respond to geopolitical events and macro news in real time.
Theo chief investment officer Iggy Ioppe said the market is changing. He said,
”Previously, onchain commodity futures were mostly a venue for crypto-native investors, that is no longer the whole story.”
He also said weekend oil futures volume has moved above $1 billion per day while traditional markets remain closed.
This shift has started to shape how prices form outside normal market hours. Traders can react before legacy venues reopen. That creates a role for onchain markets during off-hours, even if most large volume still sits elsewhere.
Despite higher activity, liquidity remains a core issue. Traditional venues still offer deeper order books, tighter spreads, and better execution for large trades. That makes it harder for onchain platforms to handle institutional-sized orders without moving prices.
1inch co-founder Sergej Kunz said traditional venues still lead in liquidity and execution quality. MEXC Research chief analyst Shawn Young also said the sector remains in an early stage, with gaps in price aggregation and market structure still unresolved.
Growth continues as traders test macro exposure onchain
Market participants still expect further growth. Gold and oil have led the current push, but other asset classes may follow as traders grow more comfortable with onchain access to macro products.
Ioppe said trust in weekend pricing may support more activity over time. As more traders use these markets during off-hours, volume and open interest can grow together. That process may help onchain commodity trading expand, even while traditional markets remain the main source of depth.
Onchain commodity trading is proving it’s more than a short-term spike, but limited liquidity continues to hold the market back from competing with traditional venues.
Hyperliquid’s HIP-3 market recorded a new all-time high on March 23, with roughly $5.4 billion in perpetual futures volume across commodities and macro assets. Silver led the activity at $1.3 billion, followed by WTI crude oil at $1.2 billion, Brent crude at $940 million and gold at $558 million. Equity indices, including the Nasdaq and S&P 500, also saw notable volumes.

Industry participants say the spike shows growing demand for macro exposure onchain. “Previously, onchain commodity futures were mostly a venue for crypto-native investors, that is no longer the whole story,” said Iggy Ioppe, chief investment officer at Theo. “The real tell is not just the volume, it’s when the volume shows up and who is showing up to trade.”
Ioppe noted that onchain oil futures markets are now processing more than $1 billion in daily volume over weekends, when traditional exchanges are offline. He said the shift is being driven in part by individual traders from traditional finance, who are accessing these markets through personal accounts. “Geopolitics does not stop on Friday afternoon, and markets are starting to adapt to that fact,” he said.
Related: S&P Dow Jones licenses S&P 500 perpetual futures for Hyperliquid
Weekend gap gives onchain markets an edge
The ability to trade around the clock has emerged as a defining advantage for onchain venues. With a roughly 49-hour gap between the close of traditional markets on Friday and their reopening on Sunday, decentralized platforms have become one of the few places where traders can react to macro developments in real time.
That dynamic is starting to influence how prices are formed outside regular trading hours, even if the bulk of liquidity still sits in traditional markets. “For now, onchain is the price discovery layer when the rest of the market is asleep,” Ioppe said. “TradFi is still the depth layer when size matters most.”
On the CME, oil futures alone regularly see between 1 million and 4.5 million contracts traded daily, equivalent to roughly $100 billion to $300 billion in notional volume.

“Traditional venues still dominate when it comes to liquidity, execution quality, and institutional-scale pricing depth,” Sergej Kunz, co-founder of 1inch, said. He noted that deeper liquidity and tighter spreads remain the main barrier. Without them, onchain markets struggle to handle large trades without moving prices, limiting institutional participation.
Additional challenges include pricing reliability, market structure maturity and regulatory clarity, according to Shawn Young, chief analyst at MEXC Research.
Young said commodity tokenization shows “signs of real behavioral changes” but remains in an early phase, with gaps in liquidity and price aggregation still to be addressed.
Related: Perp DEXs become the latest battleground for blockchains
Onchain macro trading expands beyond commodities
Despite certain constraints, activity continues to build. “The broader direction is clear: traders are becoming more comfortable accessing macro-style exposure onchain,” Kunz said.
Gold and oil have led the current wave, but market participants expect similar patterns to emerge in other asset classes as volatility shifts.
Ioppe concluded that trading activity on onchain futures markets is likely to persist as trust builds around weekend pricing. As more traders begin to rely on these markets during off-hours, volume starts to follow. That, in turn, supports growing open interest, reinforcing confidence in the prices being formed. Over time, this creates a self-reinforcing cycle, where higher participation strengthens market credibility and draws in even more flow.
Magazine: Bitcoin’s ‘biggest bull catalyst’ would be Saylor’s liquidation — Santiment founder

Key Takeaways
- Jefferies identifies Coca-Cola’s fairlife protein line as a major catalyst for future growth
- Production capacity for fairlife is projected to jump 25% throughout 2026, unlocking new distribution opportunities
- The fairlife brand may boost North American organic revenue by more than 2% in 2026 alone
- Four out of five Wall Street analysts maintain positive ratings on KO with an $86 average target
- Warren Buffett’s Berkshire Hathaway generates approximately $848 million yearly from KO dividends
Coca-Cola (KO) shares are currently hovering in the mid-$70 range, registering approximately 12% growth year-over-year, despite experiencing a modest 6% decline during the last 30 days.
Jefferies has positioned Coca-Cola among its premier selections within the protein sector, emphasizing fairlife as the primary catalyst. According to the firm, consumers are increasingly gravitating toward accessible, economically viable, protein-dense products — a trend that fairlife capitalizes on effectively.
The investment bank projects that Coca-Cola’s extensive distribution infrastructure will accommodate a 25% surge in fairlife production capacity during the current year. This expanded manufacturing capability should enable deeper penetration into convenience retail locations and food service establishments, channels that represent significant growth opportunities for the brand.
From a financial perspective, Jefferies anticipates fairlife will add upward of 2 percentage points to Coca-Cola‘s North American organic revenue expansion in 2026. This impact is projected to strengthen by an additional percentage point when 2027 arrives.
Collectively, the analyst firm maintains that fairlife positions Coca-Cola to achieve its published organic sales growth target range of 4% to 6% annually.
Broad Analyst Support for KO Stock
Jefferies represents just one voice in a broader chorus of support. According to data compiled through March 24, 2026, approximately 80% of equity analysts tracking Coca-Cola maintain optimistic ratings. The collective price target stands at $86, suggesting potential appreciation exceeding 15% from present trading levels.
Morgan Stanley analyst Dara Mohsenian recently reaffirmed his bullish stance on Coca-Cola with an $87 valuation target. His confidence stems from robust 2026 earnings projections, resilient demand throughout North America, and fairlife’s continued market penetration.
Bank of America Securities similarly maintains a Buy recommendation alongside an $88 price objective.
The stock has retreated approximately 3% to 4% during the most recent trading week. Nevertheless, the prevailing Wall Street sentiment remains largely unchanged.
Berkshire’s Coca-Cola Position Generates Massive Dividend Flow
Warren Buffett’s Berkshire Hathaway has maintained ownership of 400 million Coca-Cola shares since the early 1990s. In 1994, Berkshire received approximately $75 million annually in dividend payments from this holding. Currently, that annual distribution has expanded to roughly $848 million.
Coca-Cola boasts an impressive 64-year streak of consecutive dividend increases, securing its designation as a Dividend King. The stock currently offers a yield approaching 3%, though Berkshire’s yield calculated against its original investment basis now exceeds 60%.
This exceptional dividend history explains why KO continues attracting income-oriented investors, particularly during periods of market turbulence.
Based on assessments from 15 analysts, the consensus rating classifies the stock as a Strong Buy, with a mean price target of $85.07.

Advocates warn that failing to pass the CLARITY Act could leave the door open for a future, less industry-friendly US government to crack down on crypto policies, according to Peter Van Valkenburgh, executive director of Coin Center.
In a Friday post on X, Van Valkenburgh argued that rejecting protections for developers in legislation like the CLARITY Act and the Blockchain Regulatory Certainty Act in favor of “short-term business interests” could lead to a grim future for the industry.
“The point of passing CLARITY is not to trust this administration. It is to bind the next one,” he said, adding that “A world without CLARITY’s statutory protections for developers is a world governed by prosecutorial discretion, political fashion, and fear.”
The CLARITY Act stalled in the Senate after banks, crypto firms, and lawmakers failed to agree on key provisions — including whether to allow stablecoin yields. The bill covers a range of measures, including frameworks for registering crypto intermediaries, regulating digital assets and classifying tokens.
During the previous administration, former SEC Chair Gary Gensler drew heavy criticism from the crypto industry for allegedly crafting policy through enforcement actions and legal settlements with crypto firms rather than formal rulemaking.
Nothing set in stone without legislation
Van Valkenburgh also predicts that, without legislative clarity, a future administration’s Department of Justice could ramp up prosecutions of privacy-tool developers as unlicensed money transmitters, and that existing regulatory interpretive guidance could be revoked.
Related: Crypto investor sentiment will rise once CLARITY Act is passed: Bessent
Since Gensler resigned on Jan. 20, 2025, crypto proponents have noted a regulatory shift by the SEC, including the dismissal of several long-running enforcement actions against crypto firms and friendlier guidance on how the agency will treat crypto.
“If we lose this moment because we thought we’d have a bit more revenue and a bit more latitude under the short-term friendly discretion of the current administration, then we lose our way,” Van Valkenburgh said, urging supporters to press for statutory protections that withstand political change.

BNP Paribas is expanding its investment lineup in France by launching six crypto-linked exchange-traded notes (ETNs) that track the prices of Bitcoin and Ether. The regulated notes will be available to retail clients from Monday through standard securities accounts and Hello bank!, the group’s digital platform, with a potential extension to wealth-management clients outside France in the future.
According to the bank, these ETNs provide a regulated way to gain exposure to crypto price movements without owning the underlying assets. They are described as carrying issuer credit risk (if BNP Paribas were to fail, investors could lose money), but offer no tracking error and certain tax advantages compared with direct crypto ownership. The move underscores BNP Paribas’ broader push into digital assets and its ongoing exploration of blockchain-enabled finance.
Key takeaways
- BNP Paribas launches six crypto-linked ETNs in France, tracking BTC and ETH, accessible via standard securities accounts and Hello bank!.
- ETNs provide regulated crypto price exposure without direct asset ownership, but entail issuer credit risk and potential tax advantages relative to holding crypto directly.
- The rollout aligns with BNP Paribas’ broader digital-asset strategy, including past milestones in tokenization and blockchain collaborations.
- European adoption of crypto-linked ETNs is accelerating, with ING Germany expanding its lineup and the UK reintroducing crypto ETNs to retail investors after regulatory changes.
A regulated path to crypto exposure
The six ETNs are indexed to Bitcoin and Ether, offering investors a way to track the digital assets’ price movements without custodying the coins themselves. BNP Paribas stated the notes will be available from Monday via standard securities accounts and Hello bank!, and the offering is open to individual investors, entrepreneurs, private banking clients and Hello bank! users. The bank indicated the rollout could later extend to wealth-management clients outside France.
BNP Paribas framed the products as a regulated gateway to crypto exposure, contrasting with direct purchases from crypto exchanges. While ETNs carry issuer credit risk—a default by the issuer could impact principal—the notes are described as having no tracking error and certain tax advantages compared with holding crypto directly, according to the issuer’s description.
BNP Paribas’s broader digital-asset push
The launch sits within BNP Paribas’ broader strategy to integrate digital assets into its operations. In 2024, the bank arranged and placed Slovenia’s first digital sovereign bond, marking the European Union’s debut in blockchain-based government debt issuance. The move signaled a continued push into tokenization and blockchain-enabled finance across public and private markets.
BNP Paribas has also deepened its participation in the Canton ecosystem. The bank joined the Canton Foundation, alongside HSBC, to govern the Canton Network—a blockchain-focused initiative aimed at institutional finance and real-world asset tokenization. In parallel, BNP Paribas Asset Management supported Digital Asset’s Canton-driven initiatives and, more recently, launched a tokenized share class of a money-market fund on the Ethereum blockchain to explore fund tokenization using public infrastructure. The bank’s broader activity in tokenization extends from public networks to earlier private blockchain issuances in Luxembourg.
Europe’s growing appetite for crypto ETNs
The appetite for crypto-linked ETNs is broadening across Europe. In Germany, ING began adding new products from Bitwise and VanEck to its investment lineup, expanding access to regulated notes that provide crypto exposure through traditional channels. In the United Kingdom, crypto ETNs re-entered the retail market in October 2025 after the Financial Conduct Authority reversed a ban it had imposed in 2021, signaling a shift toward regulated access for retail investors.
As major banks expand regulated crypto offerings and public-blockchain pilots, observers are watching how these products scale beyond domestic markets and how evolving regulatory guidance shapes investor protections, tax treatment, and product design. The path forward will likely hinge on issuer risk management, cross-border distribution, and the degree to which traditional financial infrastructure can accommodate evolving crypto assets at scale.
Keep an eye on whether BNP Paribas expands the ETN rollout beyond France, how European regulators refine rules around crypto-linked notes, and what these developments imply for wider adoption of regulated crypto access across the region.

Key Highlights
- Johnson & Johnson (JNJ) delivers a 2.17% yield with a conservative 47% payout ratio and an impressive 64-year dividend growth history
- Procter & Gamble (PG) boasts the longest dividend increase streak among the group at 70 consecutive years, offering a 2.96% yield
- Coca-Cola (KO) receives unanimous positive analyst coverage — achieving a Buy rating without any hold or sell recommendations
- Exxon Mobil (XOM) stands as the sole Hold-rated stock with a sell rating, highlighting concerns about its exposure to volatile commodity markets
- Walmart (WMT) features the group’s lowest yield at 0.81% but maintains the most sustainable payout ratio of 36%, offering significant dividend expansion potential
Among the most popular dividend-generating equities available to investors are Johnson & Johnson, Procter & Gamble, Exxon Mobil, Coca-Cola, and Walmart. Each presents a unique value proposition for income-focused portfolios — varying in yield percentages, financial stability, and sector-specific risks. Below is a detailed examination of these five stocks using current MarketBeat analytics.
Johnson & Johnson
Johnson & Johnson provides shareholders with a 2.17% dividend yield while maintaining a payout ratio of 47.06%. With the payout ratio remaining under the 50% threshold, the pharmaceutical and consumer health giant distributes less than half of its earnings to shareholders. The company has consistently increased its dividend for 64 straight years.
According to MarketBeat consensus data, the stock receives a Moderate Buy rating, comprised of 1 strong buy recommendation, 17 buy ratings, and 9 hold ratings. Notably, zero analysts recommend selling. Wall Street views it as a reliable blue-chip investment, though price target analysis indicates modest near-term appreciation potential.
For those prioritizing dividend income, the pairing of a below-50% payout ratio with six decades of uninterrupted growth represents an exceptional combination rarely found in today’s markets.
Procter & Gamble
Procter & Gamble delivers a 2.96% yield to shareholders while operating with a payout ratio of 62.52%. The consumer goods titan has achieved 70 consecutive years of dividend increases — establishing the longest track record among these five companies.
The Procter & Gamble Company, PG
MarketBeat data shows a Moderate Buy consensus supported by 13 buy recommendations and 8 hold ratings. The stock currently has no strong buy or sell ratings assigned by analysts.
The remarkable 70-year dividend growth streak positions it as an ideal holding for investors seeking reliable, long-term income generation. Analysts acknowledge its predictable performance but generally classify it as a stable compounder rather than a high-growth opportunity.
Exxon Mobil
Exxon Mobil currently yields 2.41% with a payout ratio of 61.58% and has delivered 42 consecutive years of dividend growth. As the sole energy sector representative in this analysis, it faces greater volatility tied to oil and natural gas price fluctuations compared to its consumer-focused counterparts.
MarketBeat assigns Exxon a Hold consensus reflecting 9 buy ratings, 9 hold ratings, and 1 sell rating. This represents the most tepid analyst enthusiasm among the five stocks examined.
While the dividend track record spans more than four decades, the inherent cyclicality of energy sector earnings introduces uncertainty that the remaining four companies largely avoid.
Coca-Cola
Coca-Cola offers a 2.80% yield with a payout ratio of 69.74% and 64 years of uninterrupted dividend increases. Its payout ratio matches Procter & Gamble as the highest in this comparison, though it remains within acceptable parameters for dividend sustainability.
The beverage giant enjoys exceptional Wall Street support. MarketBeat data reveals a Buy consensus featuring 1 strong buy and 15 buy ratings. Remarkably, zero analysts assign hold or sell ratings — representing the most unified positive sentiment in this entire group.
This universal analyst backing underscores Coca-Cola’s standing as a straightforward, resilient dividend investment that consistently delivers predictable results to shareholders.
Walmart
Walmart presents the group’s lowest yield at merely 0.81%, yet it simultaneously maintains the lowest payout ratio at 36.13%. The retail behemoth has increased its dividend for 53 consecutive years.
MarketBeat assigns Walmart a Moderate Buy consensus derived from 1 strong buy, 30 buy ratings, and 4 hold ratings — representing one of the broadest positive analyst coverages in this analysis. No sell ratings exist.
The exceptionally low payout ratio provides Walmart with substantially greater flexibility for future dividend growth compared to many established dividend payers. The investment thesis centers less on immediate income generation and more on dividend security and long-term growth trajectory.
Final Thoughts
Johnson & Johnson and Procter & Gamble emerge as the most well-rounded selections, delivering an optimal combination of current yield, disciplined payout management, and extensive dividend growth histories. Coca-Cola captures the most favorable analyst sentiment across Wall Street. Exxon carries elevated risk due to energy sector volatility and remains the only stock receiving a Hold consensus alongside a sell rating. Walmart completes the analysis with the most conservative payout structure, prioritizing dividend sustainability over immediate yield generation.

The World Foundation, the organization supporting the digital identity project Worldcoin (WLD), has completed a $65 million over-the-counter (OTC) token sale.
According to a March 28 statement, World Assets Ltd, a subsidiary of the foundation, executed the block trades with four private counterparties over the past week. The transactions, with initial settlements beginning March 20, were priced at an average of $0.2719 per token.
World Foundation Sold WLD Tokens to Fund Orbs Manufacturing
The foundation stated that the off-ramped capital will be deployed toward core operational expenses. This includes intensive research and development, ecosystem expansion, and the continued manufacturing of its proprietary iris-scanning hardware, known as “Orbs.”
To mitigate immediate secondary-market impact, $25 million of the sold WLD is subject to a six-month lockup. This would restrict those specific tokens from entering circulation until late September.
However, blockchain analytics indicate this major capital raise is not an isolated event.
Data tracked by Lookonchain reveals a sustained pattern of structural divestment by World-affiliated entities. Over the past two years, the project has systematically offloaded WLD tokens through prominent market makers, including Flow Traders and Wintermute, creating a persistent overhang on the market.
This continuous supply expansion comes at a precarious time for the asset. The latest OTC sale coincides with WLD plunging to an all-time low before staging a modest recovery to its current level of approximately $0.27.
Despite this slight rebound, the token remains severely depressed. It is trading more than 97% below its peak of $11.72 reached in March 2024.
Compounding the project’s market struggles is a rapidly deteriorating regulatory environment.
Worldcoin’s core narrative centers on providing a “proof of humanness” network to combat the increasing proliferation of sophisticated AI bots online.
However, this positioning has largely failed to appease cautious regulators. As a result, regulators across the globe have consistently sounded the alarm about the mass collection and storage of biometric data.
Hence, the project continues to navigate severe legal challenges and ongoing privacy investigations in multiple international jurisdictions.
The post Sam Altman’s World Foundation Sells $65 Million in Worldcoin appeared first on BeInCrypto.

Arizona reaches its first Final Four in 25 years, beating Purdue

BST: Stuck Between QQQ And SOXX, Delivering Neither (NYSE:BST)

Ethereum May Get ‘Flipped’ in 2026 Without Bitcoin’s Involvement


-
 NewsBeat4 days ago
Manchester United reach agreement with Casemiro over contract clause amid transfer speculation
-

 News Videos3 days ago
Parliament publishes latest register of MPs’ financial interests
-

 Sports6 days ago
Remo Stars and Kano Pillars Strengthen Survival Hopes in NPFL
-

 Sports6 days ago
Gary Kirsten Accuses Pakistan Cricket Board Of ‘Interference’, Mohsin Naqvi Responds
-

 Business7 days ago
No Winner in March 21 Drawing as Prize Rolls to $133 Million for Next
-

 Tech7 days ago
Give Your Phone a Huge (and Free) Upgrade by Switching to Another Keyboard
-

 Tech7 days ago
AI enters the chat: New Seattle dating app relies on tech to facilitate meaningful human connections
-

 Business3 days ago
Instagram, YouTube Found Responsible for Teen’s Mental Health Struggle in Historic Ruling
-

 News Videos6 days ago
Ch 9 Financial Management Part 1 | Detailed One Shot | Class 12 Business Studies Boards 2026
-

 NewsBeat2 days ago
The Story hosts event on Durham’s historic registers
-
 NewsBeat4 days ago
Tesco is selling new Cadbury Dairy Milk bar and people can’t wait to try it
-

 Sports6 days ago
2026 Kentucky Derby horses, odds, futures, preview, date: Expert who hit 12 Derby-Oaks Doubles enters picks
-
 Entertainment15 hours ago
Lana Del Rey Celebrates Her Husband’s 51st Birthday In New Post
-
 NewsBeat7 days ago
Update on Wisbech river crash as search for teenage boy enters fifth day
-

 Tech6 days ago
Samsung will soon let you control smart home devices from your car’s dashboard
-
 Entertainment6 days ago
Cynthia Bailey Dishes on ‘RHOA’ Season 17, Discusses Kandi
-
 NewsBeat6 days ago
Colombian military plane with 110 soldiers onboard crashes following takeoff
-

 Fashion5 days ago
Does It Matter What You Wear When You’re Laid Off and Looking?
-

 Business5 days ago
More women enter wealth management, but few in advisory roles: study
-

 Sports4 days ago
Fantasy Baseball Week 1 Preview: Top sleeper hitters for both five- and 12-day period led by Munetaka Murakami
You must be logged in to post a comment Login