
Crypto World
March 25 Price Outlook for Top Crypto Assets

Bitcoin has again pressed up against a formidable wall near the $72,000 level, with bulls showing persistent demand despite ongoing macro and geopolitical uncertainty. Analysts say a sustained move above that resistance is required to renew a broader up leg toward the $80,000s, while traders watch for on‑chain signals that could confirm genuine accumulation rather than a mere short-term bounce. Notably, market participants have faced a backdrop of mixed sentiment as growth and risk assets digest recent shocks.
Market activity in March showed notable exchange outflows for BTC, a sign some observers interpret as cautious accumulation rather than immediate selling pressure. Analysts highlighted that while this flow does not yet establish a definitive uptrend, it underscores a shift in demand from sellers at lower price levels. That dynamic, combined with a valuation argument some investors are making, suggests a potential foundation for a longer-term rally if key levels are cleared. In that context, some observers point to the Yardstick metric as a narrative thread worth watching: in February, Yardstick readings dipped below the bear-market low seen in 2022, prompting discussions about whether BTC is entering a deep-value phase despite the ongoing price action.
Against that backdrop, traders and researchers are looking at the top few coins for clues about broader market health. The emphasis remains on whether risk appetite can reassert itself after recent volatility and whether the cryptocurrency complex can sustain a constructive bid at resistance levels that have repeatedly resisted breakthrough.
Key takeaways
- Bitcoin (BTC): The price action is forming an bullish ascending triangle, but a decisive move above $74,508 is needed to signal a fresh leg higher toward $84,000. A break below the current support line could expose BTC to a slide toward a $60,000–$62,500 zone.
- Ether (ETH): ETH bounced from the 50-day simple moving average and sits near a balance point. A sustained move above $2,400 would indicate the start of a new uptrend, with potential targets near $2,600 and then $3,050. Conversely, slipping back below the 50-day SMA would tilt the outlook toward $1,900–$1,750 in a deeper pullback.
- BNB (BNB): The pair remains range-bound roughly between $570 and $687 as buyers test higher levels. A breakout above $687 could target $730 and then $790, while a break below $600 risks a drop toward $570.
- XRP (XRP): Bears are defending the moving averages, but a sustained breakout above them could open a path to $1.61 and the downtrend line. A breakdown below $1.27 would reframe the setup toward the lower end of its channel.
- Solana (SOL): SOL has been confined between the 50-day moving average near $86 and resistance near $95. A breakout above $95 could lift prices toward $117, while a move below the 50-day SMA could drag the pair back into a $76–$95 range.
Bitcoin price outlook: a pivotal test above resistance
BTC is tracing an ascending triangle pattern on the daily chart, a classic setup that traders watch for a bullish breakout. The 20-day exponential moving average sits around $70,303, with the RSI hovering near midpoint, signaling a lack of a clear cross‑currents favoring either side in the near term. For the bulls to reclaim upside momentum, a sustained push above the $74,508 barrier would be a strong signal, potentially paving the way for a run toward the $84,000 mark as early as the next few sessions.
On the flip side, a break below the defining support line could tilt sentiment toward a deeper retracement, potentially drawing BTC down to the $60,000s. The balance between risk and opportunity remains delicate, as fundamental concerns mingle with price action in a market still digesting shocks from global tensions and evolving regulatory narratives.
Ether price compass: eyes on the $2,400 level
ETH has managed a modest rebound after testing lower levels, with the price turning higher after testing the 50-day SMA. The current setup suggests a wavering balance between supply and demand. A clear move above $2,400 would be a meaningful bullish cue, opening the door to a faster ascent toward $2,600 and ultimately toward $3,050 if momentum builds.
However, if selling pressure intensifies and ETH fails to sustain above the midline, the market could re-enter a softer phase. A drop through the $2,000–$1,900 zone would likely recalibrate expectations toward deeper support near $1,750, challenging any near-term upside.
BNB in a price‑range limbo: will it break out?
BNB has been clinging to a narrow corridor between roughly $570 and $687. The chart suggests a tepid, consolidative tone with the 20-day EMA flattening and the RSI hovering around the midpoint. A sustained climb above $687 would be a bullish signal, potentially targeting $730 and then $790 as the next milestones. Conversely, a breakdown below $600 would shift the balance toward the $570 level and could invite a further retreat toward the $500s if selling accelerates.
XRP: near-term path depends on how it handles moving averages
The XRP setup resembles a tug-of-war around the moving averages, with bulls pressing to extend gains beyond those technical levels. A sustained advance above these averages could push the price toward the $1.61 resistance level and the associated downtrend line, a zone that would likely attract fresh selling pressure from bears. If the price slips below $1.27, the downside could extend toward the channel’s lower boundary, where buyers are expected to re-enter.
Solana: a cautious bounce within a defined band
SOL has traded within a modest corridor, with the 50-day SMA near $86 acting as a critical line in the sand. A move past $95 could unleash a faster ascent toward $117, while failure to sustain the breakout would renew the range-bound dynamic between $76 and $95. The pattern suggests buyers remain tentative but capable of seizing control if they push through the overhead resistance.
Other notable coins in focus
Beyond the big three, several marquee tokens are reflecting similar themes of consolidation and selective breakouts. Cardano remains confined within a descending channel but shows attempts to stabilize near $0.25, while Cardano’s recovery would hinge on a decisive close above the moving averages to target the downtrend line and potential bullish extensions toward $0.39 and $0.44. Bitcoin Cash has inched above the 20-day EMA but faces a challenge to sustain momentum above the 50-day moving average; a move above that level could spark a relief rally toward $520, while a breakdown could bring the bears back into the frame. Chainlink has been tracing an ascending channel, with a potential breakout signaling a broader recovery toward the $11.61 hurdle and the $14.98 target if buyers gain the upper hand.
In aggregate, the market is balancing on a knife-edge: sentiment remains reactive to macro headlines while on-chain signals hint at underlying demand that could underpin a broader recovery if key resistance levels give way. The coming sessions will be telling as traders weigh whether this is a temporary pause within a longer ascent or a setup for a renewed phase of range-bound churn before the next decisive move.
For investors, the critical takeaway is to monitor the reaction at the major inflection points: $72,000 for BTC, $2,400 for ETH, and the nearby resistance bands across the top altcoins. Breakouts above those levels could reframe the risk/reward, while sustained closures below critical supports may extend the current consolidation. In a market that has proven prone to sudden shifts, preparation and disciplined risk management remain essential as the narrative around price discovery continues to evolve.
What to watch next: as on-chain signals, exchange flow data, and macro cues continue to evolve, traders will be watching for clear confirmation of breakouts or breakdowns at the levels highlighted above. The next few weeks could help determine whether this period is a temporary pause within a larger bull phase or a precursor to deeper consolidation across the market.


The White House on Friday launched a smartphone app that gives users direct access to administration updates, social posts, photos and policy pages tied to President Donald Trump’s second term.
Summary
- White House app offers policy pages, curated news, social feeds, media tools and contact options.
- Users can send tips to ICE while viewing affordability claims and border-focused administration messaging sections.
- The app promised live video, but Trump’s Friday remarks were not streamed in real time.
The administration said the app would deliver information “straight from the source, no filter” after several teaser videos on official social media accounts pointed to a coming launch.
The White House said the app offers breaking news alerts, live video, a media library and direct feedback tools. In its release, the administration described the product as a way to keep users informed and engaged with the Trump administration through real-time updates and push notifications.
The rollout followed a short teaser campaign on social media that drew public attention before the launch. People reported that one video showed a woman asking whether something was “launching soon,” while a White House spokesperson later replied, “I wonder what’s launching soon!” before the app went live.
The app includes tabs for news, livestreams, social feeds and photo galleries. The Verge reported that much of the content mirrors existing White House web pages rather than adding a separate service built only for the app.
Coverage of the launch also said the app directs users to policy and achievements pages that were already live on the White House website. Daily Voice reported that the product also pulls in curated news coverage and material focused on Trump’s policy priorities and record in office.
A “Get in Touch” option in the social section includes a path for users to submit tips to U.S. Immigration and Customs Enforcement through the agency’s official form. The same menu also offers options to text the president, contact the White House and sign up for a newsletter.
The app also includes an affordability page built around selected consumer prices. Daily Voice reported that the section uses a limited set of grocery items and leaves out other goods and energy costs that have moved higher, while another border page states that “0 Illegals Released in Past 10 Months.”
Some promised features were not visible at launch
The White House release said users would be able to watch speeches and briefings as they happen. Yet Daily Voice reported that Trump’s Friday remarks to farmers at the White House were not available in real time on the app during the afternoon event.
The launch came as the administration continued to frame rising costs as temporary. Daily Voice reported that Treasury Secretary Scott Bessent described recent price pressure as “short-term volatility,” while the app itself focused on selected price declines and investment pledges from foreign governments and large companies.

TLDR:
- Coinbase now lets buyers use BTC or USDC as down payment collateral without selling crypto holdings first.
- Better services the crypto loan separately while the main mortgage stays within standard Fannie Mae rules.
- No margin calls apply if borrowers stay current, even during sharp Bitcoin price declines.
- Rising home costs make crypto-backed liquidity a new route for buyers locked out by cash requirements.
Coinbase is moving deeper into consumer finance with a new product that lets U.S. homebuyers use crypto as down payment collateral.
The company has partnered with Better Home & Finance to offer separate loans backed by Bitcoin or USDC held in Coinbase accounts. The structure allows buyers to keep their digital assets while securing funds for one of the costliest parts of a home purchase.
The rollout marks one of the clearest attempts yet to connect crypto wealth with the traditional mortgage market.
Coinbase Crypto-Backed Down Payments Enter Housing Finance
A buyer can now borrow against Bitcoin or USDC for a home down payment instead of liquidating holdings. Better will originate and service the loan, while the main mortgage remains separate.
The mortgage itself still follows the standard Fannie Mae-backed structure described in the Reuters report. That means the crypto-backed portion sits alongside, rather than inside, the primary home loan.
According to Reuters, the arrangement aims to preserve crypto exposure for buyers who expect long-term upside. It also allows them to delay taxable sale events tied to liquidating digital assets.
Coinbase said the product keeps the same legal protections as a conventional mortgage process. The company also noted that the mortgage rate itself does not change once the loan becomes active.
Reuters further reported that pledged crypto price swings will not trigger margin calls. As long as borrowers continue payments, falling Bitcoin prices alone will not force liquidation.
Crypto Utility Expands as Homeownership Costs Rise
The launch lands as homeownership remains difficult for first-time buyers. Reuters cited National Association of Realtors data showing the median first-time buyer age has climbed to 40 from 32 in 2000.
Higher rates, limited inventory, and elevated home prices have tightened access across the U.S. housing market. This backdrop gives crypto-rich buyers another way to unlock liquidity without leaving the market.
Coinbase framed the product as a practical use case for digital assets beyond trading and custody. Reuters noted the company sees it as a way to widen access for users whose wealth sits in crypto rather than bank accounts.
The policy backdrop also matters. Reuters linked the move to a more crypto-friendly U.S. regulatory environment that has recently lowered barriers around mainstream financial products.
The report also tied that shift to broader Washington efforts to expand alternative investments, including crypto, into retirement products. That easing has helped firms explore new bridges between digital assets and legacy finance.

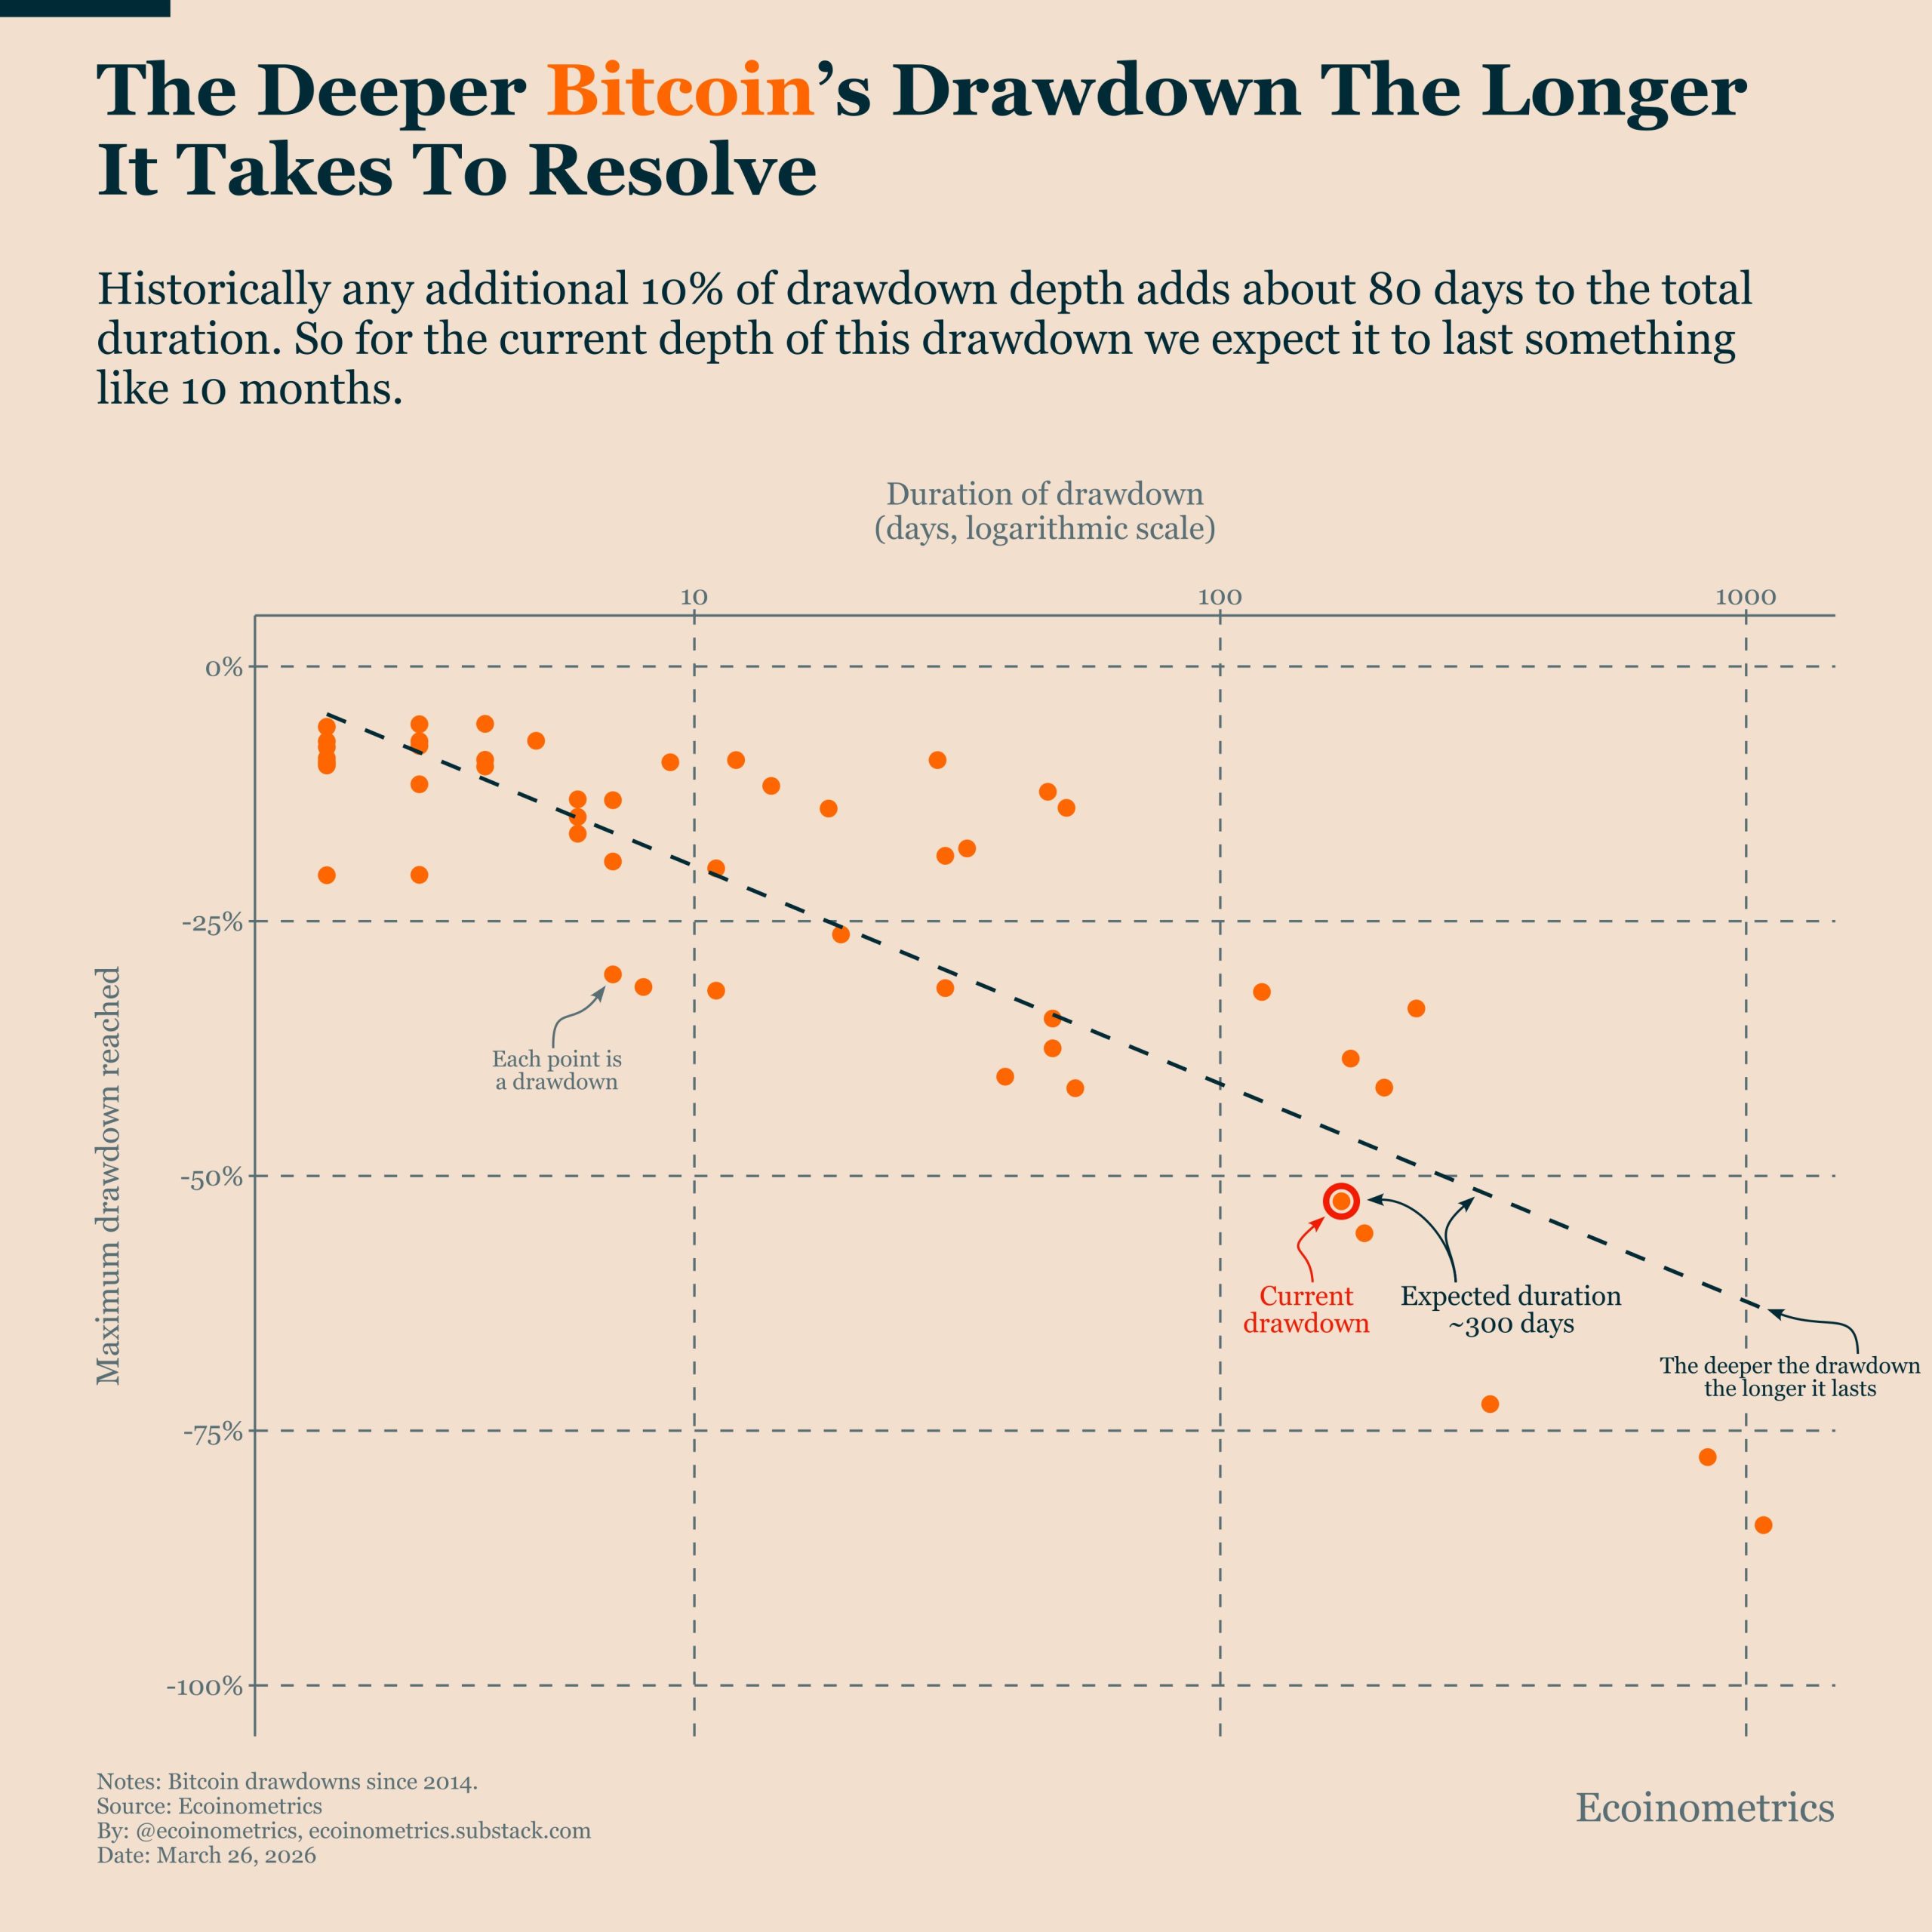
Bitcoin (BTC) has shed all its March gains, currently down 1.40% on the monthly chart and 24.6% for the first quarter of 2026. Bitcoin’s longer-term performance aligns with a deep drawdown cycle for BTC, which may extend until the end of 2026 and many analysts expect another 40% drop in price.
This scenario pushes Bitcoin’s recovery into Q2 2027, as a deeper BTC price drop tends to take longer to recover from.
Bitcoin drawdown depth extends the recovery timeline
Ecoinometrics data shows a clear link between the drawdown depth and recovery duration. Each additional 10% decline has historically added about 80 days to the time required to reclaim the prior highs.
At the current 48% drawdown, the full recovery cycle is estimated to be near 300 days from the October peak of $126,000 in 2025.

Currently, roughly 172 days have passed, leaving about 125 to 130 days if the cycle low is already confirmed at $60,000. However, the cycle lows might not have been tagged yet, with BTC potentially looking at further downside in the coming weeks.
The Bitcoin Combined Market Index (BCMI), which combines market-value to realized-value (MVRV), net unrealized profit/loss (NUPL), spent output profit ratio (SOPR) and market sentiment, currently sits near 0.27.
This level is notably above the 0.15 threshold that has marked the cycle bottoms in every major downturn since 2018.

In the 2018 cycle, BCMI reached 0.15 as Bitcoin fell to $3,100 from its $20,000 peak. In 2020, the index dropped to 0.147 when the price was $5,100. Similarly, in November 2022, BCMI fell to 0.12 as BTC formed its cycle lows at $15,880.
With the index still elevated relative to these historical bottom zones, a move toward 0.15 in 2026 likely requires further downside in BTC’s price. Such a scenario aligns with a deeper capitulation phase for BTC, consistent with the prior cycle resets.
Related: Bitcoin dips under $66K as oil sparks ‘unsustainable’ US inflation risk
Deeper BTC lows extend the recovery window to Q2 2027
Crypto trader Ardi noted that the whale delta vs retail delta reached its most aggressive sell level at -22.13 since October 2024. The chart illustrates the BTC price breaking below a rising trendline, while underlying flows show consistent distribution from the larger participants. Ardi said,
“Larger players are selling into this structure harder than they have in 18 months. That does not mean price has to collapse immediately. But it does mean this level is being tested with real sell pressure pressing into it.”

From a liquidity standpoint, CMCC Crest managing partner Willy Woo outlined a similar weakness for BTC’s price. Woo accurately mapped out last month that BTC would rebound to the mid-$70,000 region in March, before aligning with the bearish trend as “the broader regime is heavily bearish with both spot and futures liquidity deteriorating.”
From a cycle perspective, Woo expects a deeper reset before a confirmed bottom forms. Woo identified the $40,000–$45,000 range as a typical bear market floor, with timing skewed toward Q4 for the end of the bearish phase.
The framework places the return of a stronger bullish momentum into early 2027.

If Bitcoin extends its decline toward the $40,000–$45,000 range, the drawdown from the $126,000 peak deepens to roughly 64–68% from all-time highs. Based on Ecoinometrics’ model, the additional downside significantly stretches the recovery timeline.
At a 60%+ drawdown, the total recovery period historically expands to around 440 days from the cycle peak. In this scenario, a potential reclaim of the prior all-time high is expected to fall sometime after Q2 2027.
It is important to note that these timelines are based on historical drawdown patterns and do not represent predictions. The current macroeconomic conditions may alter that recovery path as well.
The Kobeissi Letter noted that the rate cuts are now expected only by December 2027, with a 51% chance of a rate hike by March 2027. This unexpected development may impact Bitcoin’s recovery pace relative to past cycles.
Related: Bitcoin gained 655% the last time this supply in profit metric dropped to 50%
This article does not contain investment advice or recommendations. Every investment and trading move involves risk, and readers should conduct their own research when making a decision. While we strive to provide accurate and timely information, Cointelegraph does not guarantee the accuracy, completeness, or reliability of any information in this article. This article may contain forward-looking statements that are subject to risks and uncertainties. Cointelegraph will not be liable for any loss or damage arising from your reliance on this information.
TLDR:
- Ethereum activity and stablecoin balances are shifting back from Layer 2 networks to the base layer
- Stablecoin supply and tokenized assets on Ethereum are approaching previous all-time high levels
- Ethereum’s execution density and composability continue to attract high-value on-chain transactions
- ETH has outperformed major Layer 2 tokens since October 2025, signaling renewed market strength
Ethereum comeback narratives are gaining traction as new data points to renewed activity on the network. Insights shared by Coinbase Institutional indicate a measurable shift in user behavior and capital flows.
Stablecoin balances and tokenized assets on Ethereum are approaching historical highs. At the same time, ETH has outperformed major Layer 2 tokens since October 2025, suggesting a change in market structure.
Activity Returns to Ethereum’s Base Layer
Recent observations show that users are gradually returning to Ethereum’s main network. Coinbase Institutional reported that both activity levels and stablecoin balances have tilted back toward Layer 1. This marks a shift from earlier periods when Layer 2 solutions captured a larger share of transactions.
The same update noted that stablecoin supply on Ethereum is nearing record levels. Tokenized asset values are also rising toward previous peaks. These movements point to increased reliance on Ethereum for settlement and liquidity functions.
Metrics tracking organic activity further support this trend. Execution density on Ethereum remains strong, reflecting higher economic value processed within limited block space. This indicates that users continue to prioritize efficiency and depth over lower transaction costs.
Coinbase Institutional also stated that ETH has outperformed major Layer 2 tokens since October 2025. This relative strength aligns with growing on-chain activity and sustained liquidity inflows.
The data was shared through its official X post, which framed the discussion around Ethereum’s evolving role.
Infrastructure Strength Supports Comeback Narrative
Ethereum’s composability continues to serve as a core advantage in the current market. Applications built on the network interact seamlessly, allowing complex financial operations across protocols. This structure supports the use of stablecoins and tokenized assets at scale.
Execution density remains another defining factor. Ethereum processes high-value transactions within its base layer, maintaining efficiency despite higher fees. In contrast, Layer 2 networks distribute activity across multiple chains, often focusing on cost reduction.
The Coinbase Institutional update also pointed to ongoing developments in stablecoin regulations. These changes are drawing attention to the infrastructure supporting digital assets. Ethereum remains a primary base layer for stablecoins due to its liquidity depth and established ecosystem.
At the same time, Layer 2 solutions continue to play a complementary role. They provide scalability and lower transaction costs, especially for retail users.
However, recent data suggests Ethereum is regaining ground in areas requiring composability and capital concentration.
The Ethereum comeback narrative continues to develop as market dynamics shift. Rising activity, growing stablecoin balances, and ETH’s relative performance indicate renewed focus on the base layer.
As conditions evolve, the relationship between Layer 1 and Layer 2 remains central to Ethereum’s positioning.

Spot Bitcoin exchange-traded funds (ETFs) shifted gears this week, snapping a four-week streak of inflows and posting a net outflow of $296.18 million for the period ending Friday. The reversal comes after a sustained run that had drawn more than $2.2 billion into spot BTC ETFs over the prior four weeks. Data from SoSoValue shows inflows of roughly $787.31 million, $568.45 million and $767.33 million in early March, followed by a smaller $95.18 million the previous week before the tide turned to red this week.
The weekly outflow was amplified by consecutive daily withdrawals on Thursday and Friday totaling more than $396 million, including a Friday print of $225.48 million—the largest single-day withdrawal since March 3, when outflows reached $348 million. Despite the shift this week, investors have not exited the BTC ETF space entirely; cumulative inflows to spot BTC ETFs remain robust, with total net inflows measuring $55.93 billion.
On the asset side, total net assets tied to spot BTC ETFs slipped to $84.77 billion, down from just over $90 billion a week earlier. Trading activity also cooled, with combined weekly ETF volume dropping to $14.26 billion from $25.87 billion earlier in March. The pattern mirrors a broader, cautious mood among crypto traders as macro headlines stabilize, but momentum remains elusive.
For context, the shift comes amid a wider debate about the pace of institutional adoption and how ETF mechanics interact with liquidity cycles. A related note from market observers highlights that even a period of macro calm can mask undercurrents of risk, influencing how investors position around the next potential regime shift in cryptos and traditional markets.
Ethereum ETFs followed the broader risk-off tone, registering $206.58 million in weekly net outflows. This marked a second straight week of declines for spot Ether ETFs, reversing a brief inflow stretch seen earlier in March. Daily data shows withdrawals throughout the week, with the largest single-day outflow on Thursday at $92.54 million and another $48.54 million pulled on Friday. The pattern underscores a more cautious stance among holders as investors reassess near-term catalysts for Ethereum’s spot and ETF exposure.
Beyond the ETF desk, the market backdrop remains a balance of surface stability and underlying frictions. In a note shared with Cointelegraph, a Bitunix analyst described the current macro environment as defined by “surface stability, internal imbalance.” Geopolitical tensions persist, while policymakers aim to project calm. Developments such as an ongoing US–EU trade framework and a cooling of tensions in other hot spots have helped ease near-term stress, but the analyst cautioned that the underlying risks have not vanished.
Against that backdrop, Bitcoin’s price action is increasingly seen as a read on liquidity conditions rather than a clear directional consensus. The asset has traded within a defined range, roughly between $65,000 and $72,000, with evidence of demand absorption but limited upside follow-through. “Capital is not exiting the market, but neither is it willing to take directional risk,” the analyst observed, suggesting that volatility may persist within established bands until macro conditions align for a clearer trend.
Investors may find it instructive to compare the current cycle with earlier episodes of ETF-driven participation. The current week’s outflows come after a period of strong inflows that underscored a phase of renewed institutional interest in BTC exposure through regulated vehicles. For market watchers, the key question remains: will macro catalysts—policy signals, liquidity shifts, or geopolitical developments—provide the spark needed to re-ignite sustained ETF inflows, or will liquidity constraints continue to weigh on trend formation?
Key takeaways
- Spot Bitcoin ETFs posted a weekly net outflow of $296.18 million for the period ending Friday, reversing a four-week inflow streak that totaled more than $2.2 billion.
- Cumulative net inflows into spot BTC ETFs stand at $55.93 billion, while total net assets fell to $84.77 billion from just over $90 billion a week earlier; weekly ETF volume dropped to $14.26 billion from $25.87 billion.
- Ether exposure followed a similar pattern, with spot ETH ETFs recording $206.58 million in weekly outflows—a second consecutive weekly decline; the largest daily outflow was $92.54 million on Thursday, followed by $48.54 million on Friday.
- Macro dynamics remain mixed: analysts describe a surface-stable but internally imbalanced environment, with Bitcoin trading range-bound as market participants weigh liquidity conditions against uncertain geopolitical and policy developments.
Spot BTC ETFs retreat after a four-week inflow run
The week’s outflow marks a notable shift after BTC ETFs enjoyed a multi-week surge in demand. SoSoValue’s data shows that inflows for BTC-focused ETFs aggregated to more than $2.2 billion across four consecutive weeks earlier in March, with the standout single-week inflows reaching as high as approximately $787 million. The reversal this week followed a run of daily redemptions culminating in a Friday outflow of $225.48 million—significant in magnitude and the largest single-day drain since the early-March period.
While the net number for the week is negative, the broader trajectory remains positive in aggregate terms. The cumulative $55.93 billion of net BTC ETF inflows illustrates a persistent appetite for regulated BTC exposure among institutional participants, even as near-term liquidity concerns cap momentum. On the surface, fund flows appear to be moderating as traders digest macro cues and position for potential regime shifts in the broader crypto market.
Trading activity, a useful lens into market participation, also cooled noticeably. The week’s combined ETF volume of $14.26 billion sits well below the March peak, a reminder that current appetite for ETF-based BTC exposure is sensitive to shifting liquidity environments and risk tolerance among investors.
For readers tracking industry benchmarks, an adjacent development remains the ongoing discussion around ETF fee structures and product design. Related coverage this week highlighted Morgan Stanley’s anticipated ultra-low-fee BTC ETF filing, pegged at a 0.14% fee if approved, illustrating how major players are calibrating cost structures to attract a broader investor base.
Source: SoSoValue
Ethereum ETFs extend outflow streak
In parallel with Bitcoin, Ethereum ETFs posted meaningful redemptions. SoSoValue data shows spot ETH ETFs recording $206.58 million in weekly outflows, marking the second consecutive week of declines after a prior period of modest inflows. The week-long trend was driven by daily withdrawals, with Thursday accounting for the bulk at $92.54 million and Friday contributing another $48.54 million.
The ETH ETF dynamic underscores a broader caution among crypto asset holders, where even marquee assets like Ethereum face selling pressure in tandem with BTC. As with Bitcoin, macro momentum and liquidity considerations appear to be the primary drivers behind these ETF flows, rather than a singular ETH-specific catalyst.
As investors weigh the path forward, market participants will be looking for signs of stabilization in ETF demand for Ether alongside BTC. The data points to a cautious stance, with redemptions outpacing new inflows for multiple weeks as traders assess risk, regulatory environments, and potential macro-driven liquidity shifts.
Related commentary continues to explore how ETF design and pricing could influence future demand, as well as how early adopters and index designers might respond to evolving market structure. For readers seeking additional context, Morgan Stanley’s ongoing ETF discussions and related reporting offer a useful backdrop to the evolving landscape of regulated crypto exposure.
Source: SoSoValue
Macro calm masks deeper risks
A recurring theme in this week’s flow analysis is the tension between apparent macro calm and underlying fragilities. A Bitunix analyst, speaking to Cointelegraph, framed the current environment as “surface stability, internal imbalance.” While geopolitical frictions and policy tensions have cooled somewhat, the risk built into the system remains unresolved, creating a environment where traditional and crypto markets co-move in nuanced ways.
Bitcoin, in this setting, is behaving less like a breakout asset and more as a proxy for liquidity conditions. The asset has largely traded within a defined band, roughly between $65,000 and $72,000, with demand showing intermittent strength but lacking sustained follow-through. The analyst emphasized that while capital is not fleeing the sector, there is a clear reluctance to embrace directional bets in the near term, signaling that volatility will likely persist until macro catalysts align with a more decisive trend.
In the larger discourse, the ETF flows fit into a broader narrative about adoption, regulation, and liquidity. As investors watch for catalysts—ranging from policy shifts to shifts in macro liquidity—the market will stay sensitive to incoming data and cross-asset dynamics. The interplay between favorable regulatory signals and risk-on/risk-off cycles will likely shape the next leg of ETF-driven participation in BTC and ETH exposure.
Related coverage this week also touched on other ETF developments, including flexible fee structures and the race among traditional banks and asset managers to offer regulated, low-cost access to top crypto assets. The unfolding story remains a test of how fast the market can translate incremental regulatory clarity into sustainable inflows, even as near-term risk sentiment remains cautious.
What comes next for ETF demand and crypto liquidity?
Looking ahead, the key questions center on whether macro conditions will align with a renewed appetite for regulated crypto exposure. If liquidity improves or volatility sharpens in a favorable way, BTC and ETH ETF inflows could resume, reinforcing the role of ETFs in institutional portfolios. Conversely, persistent macro uncertainty and continued outflows could extend the current pause, shaping a market in which price moves hinge on liquidity rather than conviction-driven catalysts.
Readers should monitor notable policy developments, central bank signals, and geopolitical headlines as potential inflection points. The ETF data, while informative, is one lens among many for assessing where crypto markets stand in relation to traditional financial markets—and what it might take to spark a fresh wave of institutional participation.

Key Takeaways
- ETH breached the $2,000 threshold with a 5% decline over 24 hours and 6% weekly loss
- Institutional ETH ETFs experienced a sustained outflow streak spanning seven days, totaling $392 million
- Market demand for Ethereum reached its weakest point in 16 months
- Critical support zones identified at $1,911 and $1,750 by technical analysts
- Centralized exchange reserves dropped from 22 million ETH in 2023 to approximately 15 million ETH currently
Ethereum pierced the psychological $2,000 barrier on Friday, March 27, 2026. The breakdown resulted in more than $111 million worth of leveraged long positions being liquidated within 24 hours, based on data compiled by Coinglass.
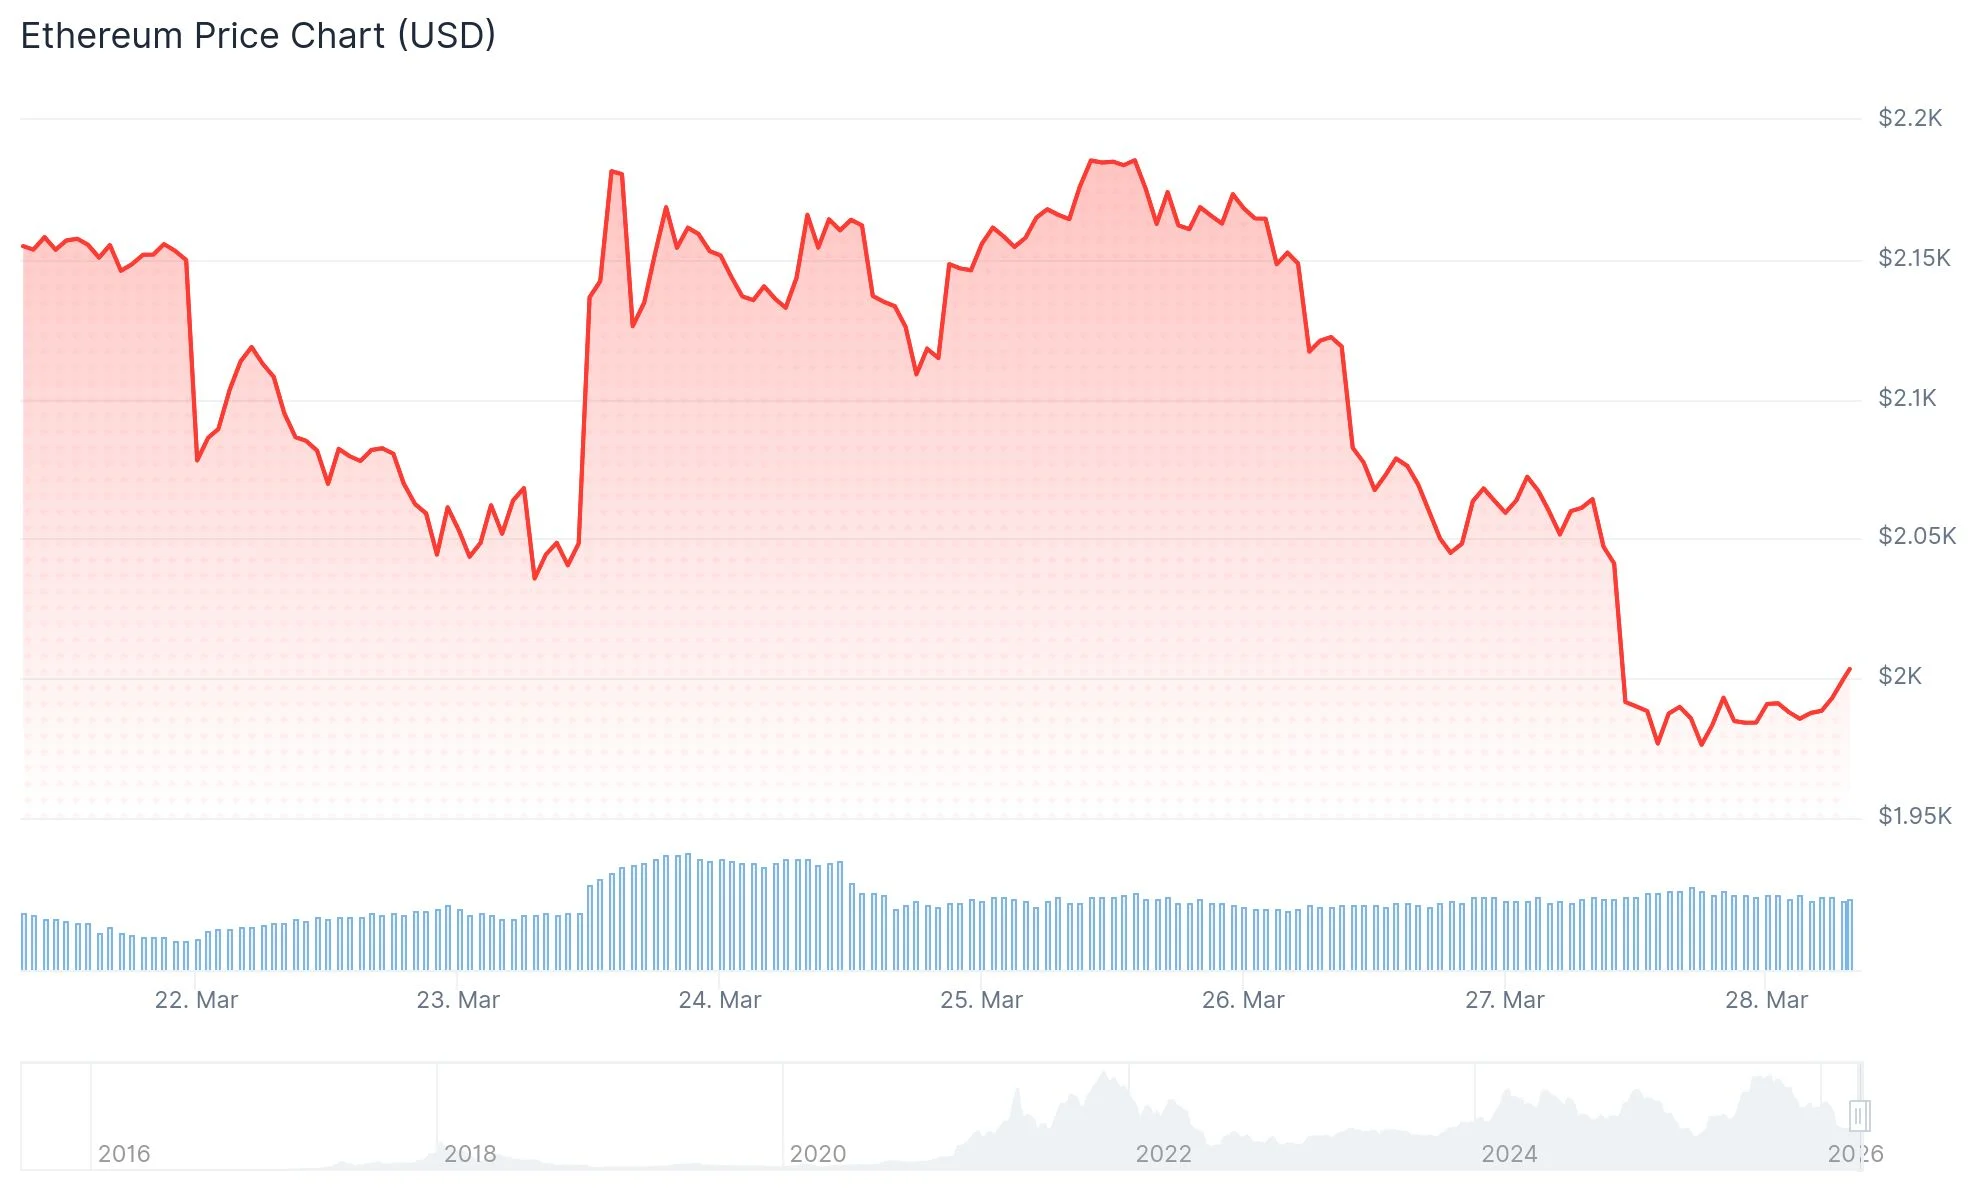
The decline compounded ETH’s weekly losses to 6%, driving monthly performance into negative range.
Geopolitical tensions contributed to the market downturn. Iran’s Islamic Revolutionary Guards Corps delivered warnings to personnel at industrial facilities across Israel and Gulf nations regarding an impending retaliatory operation. These developments followed coordinated US and Israeli strikes targeting Iranian industrial infrastructure, amplifying risk-off sentiment across financial markets.
Institutional appetite for Ethereum has evaporated rapidly. Spot Ethereum ETFs witnessed an unbroken seven-day stretch of net withdrawals, accumulating approximately $392 million in outflows. The institutional capital that previously supported price appreciation has vanished.
Market analyst Ted Pillows shared on X that ETH ETF redemptions hit $92.5 million in one trading session alone, with BlackRock accounting for $43.2 million in Ethereum sales.
Retail participation has similarly weakened. The Coinbase Premium Index descended deeper into negative territory, indicating American traders are either liquidating positions or remaining inactive.
Research from Capriole Investments reveals that observable demand for ETH has remained negative throughout March, plummeting to its lowest reading in 16 months.
Chart Analysis Suggests Further Downside
On the daily timeframe, ETH is positioned beneath its 20-day exponential moving average. The 50-day and 100-day EMAs remain elevated at $2,180 and $2,430 respectively, confirming the prevailing trend is corrective.
Market analyst CryptoWZRD observed that closing below $2,200 earlier this week served as an initial alert before “additional declines.” With both $2,100 and $2,000 levels now compromised, attention shifts to the $1,750–$1,850 zone.
Analyst CyrilXBT published a chart illustrating ETH trading significantly below its 200-day EMA near $2,766. He cautioned that a breakdown beneath the $1,750 floor could drive ETH toward the $1,400–$1,500 region.
On-Chain Metrics Present Mixed Signals
One divergent indicator involves exchange holdings. CryptoQuant data highlighted by analyst James Easton shows Ethereum balances on centralized exchanges have contracted from over 22 million in 2023 to roughly 15 million ETH. Easton characterized large holders as “stacking and staking.”
Nevertheless, declining exchange balances independently do not guarantee price reversal. The metric demonstrates coins exiting platforms but fails to validate actual accumulation behavior.
Regarding institutional accumulation, BitMine Immersion wallets acquired 117,111 ETH across a three-day window, according to Lookonchain. The entity had previously disclosed a separate purchase of 65,341 ETH.
ETH open interest climbed to 14.72 million ETH, despite funding rates shifting negative.
The nearest support level rests at $1,911, with secondary support at $1,741. A decisive move below $1,741 would validate continuation of the existing bearish trajectory.
Key Highlights
- Morgan Stanley’s proposed spot Bitcoin ETF (MSBT) features a 0.14% management fee, establishing a new low benchmark for US-listed Bitcoin funds
- The pricing strategically beats Grayscile’s Bitcoin Mini Trust (0.15%) and significantly undercuts BlackRock’s iShares Bitcoin Trust (0.25%)
- Morgan Stanley’s extensive network of approximately 16,000 financial advisors oversees $6.2 trillion, creating substantial distribution capabilities for MSBT
- Regulatory approval would mark a historic milestone, making Morgan Stanley the first traditional Wall Street bank to offer a spot Bitcoin ETF
- Industry analysts from Bloomberg project a potential launch window as soon as April 2026
Wall Street powerhouse Morgan Stanley has submitted regulatory documentation to introduce a spot Bitcoin exchange-traded fund carrying an exceptionally competitive 0.14% annual fee structure, positioning it as the most affordable Bitcoin ETF available to American investors upon approval.
The fee structure appeared in an updated S-1 registration statement filed with the Securities and Exchange Commission late Friday. This pricing sits just one basis point beneath Grayscale’s Bitcoin Mini Trust, which previously held the distinction of offering the market’s most economical option at 0.15%.
By comparison, BlackRock’s iShares Bitcoin Trust—currently commanding the largest asset base among Bitcoin ETFs—imposes a 0.25% annual fee. Morgan Stanley’s proposed offering creates an 11 basis point advantage over this category leader.
James Seyffart, a Bloomberg ETF analyst, characterized the pricing strategy as a “big move,” projecting that the fund is “likely to launch in early April.”
The investment vehicle will operate under the name Morgan Stanley Bitcoin Trust, designated by the ticker MSBT. The New York Stock Exchange has already published a listing notification for the product, suggesting that trading operations could commence rapidly following regulatory clearance.
For cryptocurrency custody responsibilities, Morgan Stanley has designated Coinbase alongside Bank of New York Mellon to safeguard the fund’s Bitcoin holdings.
The Strategic Importance of Fee Compression
Spot Bitcoin ETFs function on a fundamentally similar basis—they acquire and hold Bitcoin while mirroring its market valuation. This operational similarity elevates the management fee to a primary differentiating factor among competing offerings.
Financial professionals can seamlessly transition client positions from higher-cost products to more economical alternatives through straightforward transactions, maintaining identical market exposure. This dynamic intensifies fee-based competition throughout the sector.
Eric Balchunas, another Bloomberg ETF specialist, highlighted that Morgan Stanley’s extensive advisor workforce of approximately 16,000 professionals manages an impressive $6.2 trillion in client wealth. He emphasized that the competitive fee structure eliminates potential conflicts when advisors recommend the product to their clients.
This distribution infrastructure represents a critical competitive advantage. Even modest portfolio adjustments across this vast advisor ecosystem could channel billions of dollars into the newly launched fund.
Grayscale’s original Bitcoin Trust commanded roughly $29 billion in assets when spot Bitcoin ETFs debuted in January 2024. Current holdings have contracted to approximately $10 billion, with fee-related redemptions contributing significantly to this decline.
Morgan Stanley’s Expanding Digital Asset Strategy
The financial institution submitted its spot Bitcoin ETF application in early January 2026, coinciding with a separate filing for a Solana-based ETF. Within the same week, the bank expanded its digital asset ambitions by filing for a staked Ether ETF.
February saw Morgan Stanley pursue a national trust banking charter, enabling the institution to provide digital asset custody services and staking capabilities for institutional and individual clients.
To spearhead its cryptocurrency initiatives, Morgan Stanley elevated Amy Oldenburg—a veteran executive with extensive tenure at the firm—to direct its digital assets division in January.
Prior to this institutional expansion, the bank had established cryptocurrency allocation guidelines recommending 2% to 4% portfolio exposure and authorized its advisors to incorporate crypto investment products within retirement account strategies.
The aggregate US spot Bitcoin ETF marketplace has reached approximately $83 billion in total assets. Morgan Stanley’s entrance at an unprecedented fee level intensifies competitive dynamics for every established fund operating in this rapidly evolving sector.

Key Highlights
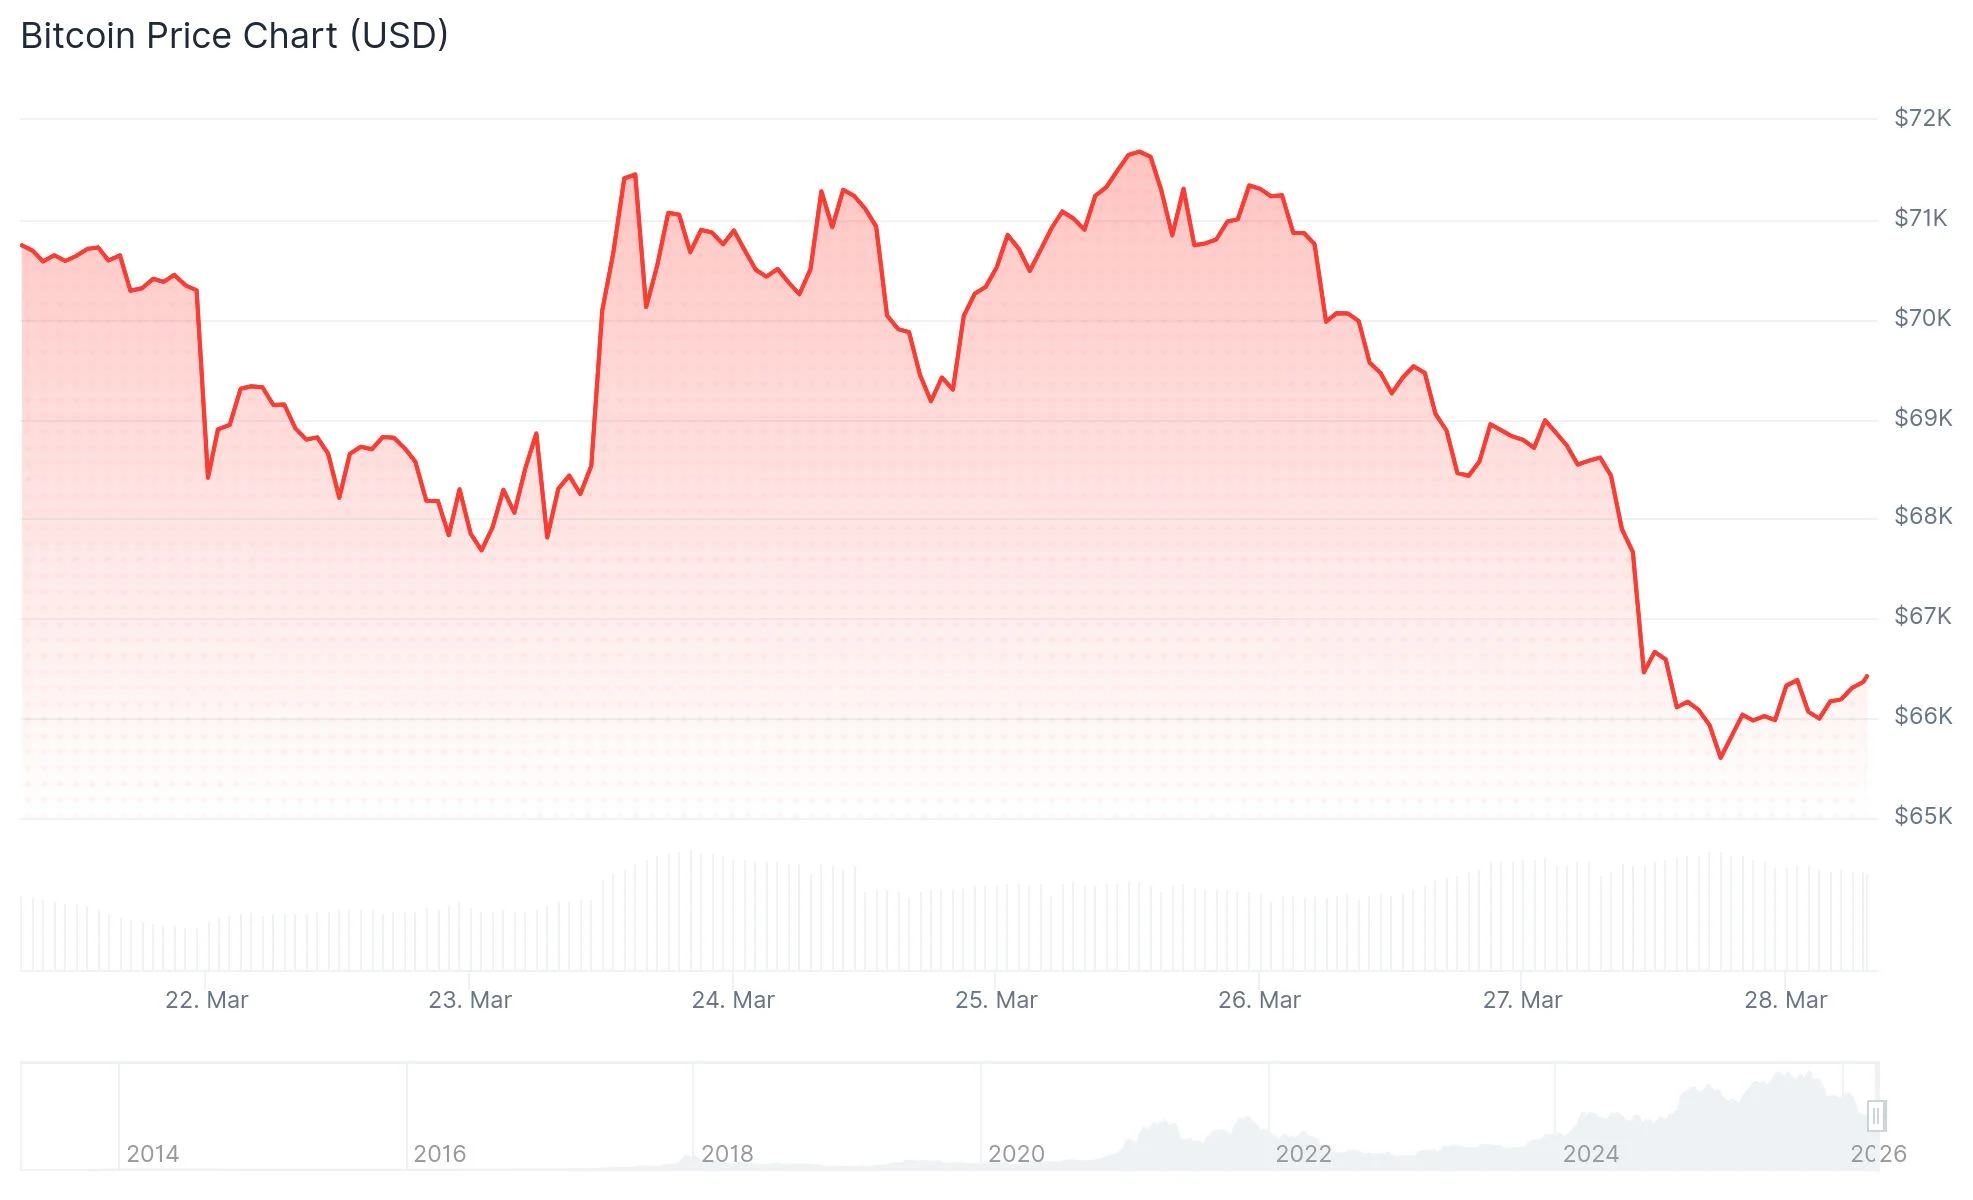
- Bitcoin plummeted from $75,000 to $66,000 throughout the week; Ethereum breached critical $2,000 support
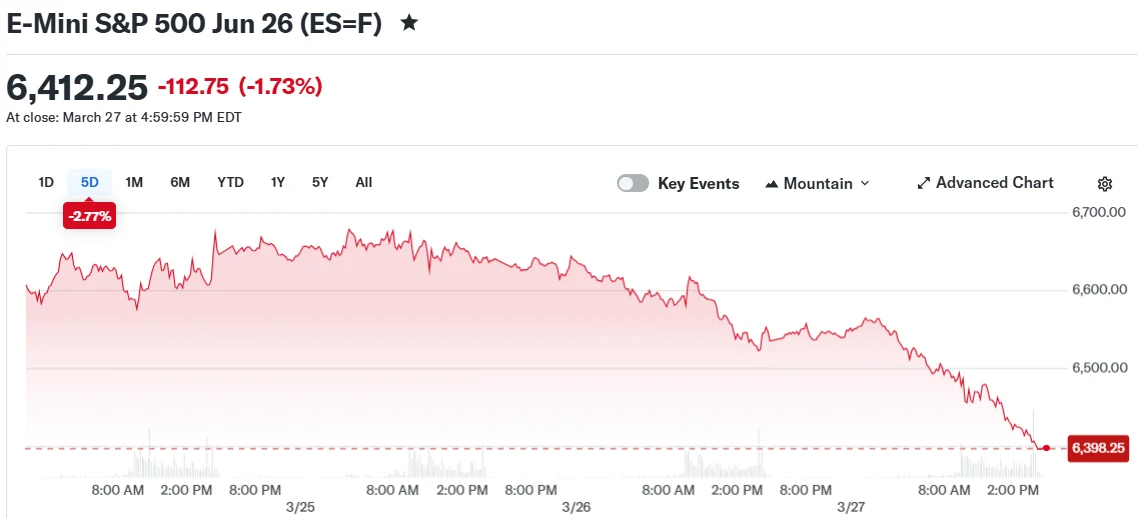
- Major U.S. equity benchmarks all slipped into correction mode, with the S&P 500 recording its most extended decline since 2022
- Crude oil prices climbed above $100 per barrel amid escalating Middle Eastern tensions, triggering widespread risk aversion
- Coinbase introduced cryptocurrency-collateralized home loans, while Tether engaged KPMG for comprehensive financial review
- David Sacks departed his position as White House Crypto Czar following a 12-month tenure
Financial markets experienced a challenging week characterized by widespread selling pressure. Both digital assets and traditional securities suffered substantial losses as energy prices climbed and market participants retreated from riskier investments.
Bitcoin experienced a notable decline, sliding from its weekly peak of $75,000 down to $66,000 by the close of trading on Friday, March 27. Ethereum retreated beneath the psychologically important $2,000 threshold, a price point closely monitored by market participants.
Both Solana and XRP concluded the trading week with significant losses. The cryptocurrency market as a whole mirrored the downturn observed in equity markets as anxiety permeated the financial landscape.
Traditional markets fared no better. The S&P 500 registered its fifth consecutive weekly decline, marking the index’s most prolonged losing period since 2022. The Dow Jones Industrial Average officially entered correction territory, falling more than 10% from its most recent peak.
The technology-heavy Nasdaq suffered a 2.1% decline on Friday alone, pushing deeper into correction territory. The so-called “Magnificent Seven” technology giants collectively shed more than $330 billion in valuation during a single trading session.
Oil prices emerged as a primary catalyst behind the market turbulence. Brent crude futures climbed above $106 per barrel while West Texas Intermediate exceeded $100, as heightened conflict throughout the Middle East fueled concerns that instability could persist through April.
President Trump announced a 10-day extension of his ultimatum to Iran, pushing the deadline to April 6 for compliance with American demands before potential strikes on Iranian energy infrastructure. Despite the extension, market uncertainty persisted.
Significant Cryptocurrency Sector Developments
Coinbase revealed plans to offer home mortgages backed by cryptocurrency holdings across the United States. The digital asset exchange is collaborating with Better Home & Finance to enable homebuyers to utilize Bitcoin for down payments, with the program receiving government support.
Tether, the issuer behind the USDT stablecoin, appointed accounting giant KPMG to conduct an audit of its $185 billion in assets. This strategic decision represents Tether’s broader initiative to establish a stronger presence in the American market. Following the announcement, Circle Internet Group shares tumbled 24% over the five-day period.
Intercontinental Exchange, the corporation that operates the New York Stock Exchange, committed $600 million to prediction platform Polymarket. The substantial investment provides Polymarket with resources for expansion as traditional financial institutions increasingly venture into this emerging sector.
Regulatory and Political Developments
David Sacks resigned from his position as White House Crypto Czar after serving for one year. During his tenure, Sacks guided initial cryptocurrency policy initiatives from the administration, including shepherding the GENIUS Act through Congress, and has transitioned to the President’s Council of Advisors on Science and Technology. The administration has not yet designated a successor.
Prediction marketplace Kalshi experienced a valuation surge to $22 billion in its most recent capital raise, doubling from $11 billion just three months earlier in December. The funding round coincided with Arizona prosecutors filing 20 criminal charges against Kalshi, alleging the platform operates as an unlicensed gambling enterprise.
Approximately $15 billion worth of Bitcoin options contracts reached expiration on the Deribit platform on March 27, accounting for 40% of the exchange’s total outstanding positions. A comparable $19 billion expiration event last September has been identified as a potential trigger for Bitcoin’s ongoing downturn, which has now reached a 40% decline from its October highs.
TLDR:
- Iran’s IRGC warned on March 28 that critical undersea cable infrastructure in Hormuz will not be spared from attack.
- Cables like FALCON, AAE-1, and 2Africa Pearls carry nearly all global internet traffic through contested waterways.
- Google and Meta activated contingency rerouting plans after the threat, raising costs across cable insurance markets.
- Starlink’s 9,500-satellite LEO network is gaining traction on rerouted tankers, with SpaceX eyeing a $1.75T IPO valuation.
Undersea internet cables connecting Asia, Europe, the Middle East, and Africa face serious threats. Iran’s Islamic Revolutionary Guard Corps issued a stark warning on March 28.
The statement said critical infrastructure in the Hormuz and Red Sea corridors would not be spared. The cables at risk carry nearly all global internet traffic.
No cable has been cut yet, but Google and Meta have already activated contingency rerouting plans in response.
Cable Networks at the Center of the Standoff
The cables at risk include FALCON, Gulf Bridge International, Europe India Gateway, SEA-ME-WE 6, AAE-1, and FLAG. These run through the Hormuz corridor.
In the Red Sea, EIG, AAE-1, Seacom, SMW-4, SMW-5, SMW-6, IMEWE, and 2Africa Pearls are also exposed. Together, they form the backbone of global digital commerce.
Analyst Shanaka Anslem Perera noted the full scope of what flows through these cables. “Your bank transfers. Your stock trades. Your cloud computing,” he wrote.
The data connects every financial market on earth to every other. Past events show how quickly disruptions can escalate.
In 2008, eight cables were severed off the Egyptian coast. Between 70 and 80 percent of Middle East-to-Europe traffic went dark after that.
Repairs stretched from three to eight weeks. In 2024, Houthi-related anchor drag damaged four cables in the Red Sea, with repairs lasting months.
Both past incidents were likely accidental. A deliberate, state-sponsored cut has never been carried out. Iran’s own connectivity runs through these same cables.
Any confirmed attack would also trigger immediate naval retaliation from the US, UK, and French fleets already in the region.
Satellite Connectivity Gains Ground as Threat Persists
The threat alone is creating real friction in global financial systems. Cable operators are rerouting traffic, and that process carries real costs. Insurance pricing on submarine cable infrastructure is also shifting.
Institutions relying on sub-40-millisecond latency between Asian and European markets are now running new contingency scenarios.
Starlink’s low-earth orbit constellation of over 9,500 satellites is emerging as a direct alternative. The service delivers broadband through phased-array terminals that electronically steer beams to counter jamming.
Iran has used GPS spoofing and radio-frequency noise against Starlink since January. Packet loss spiked to between 30 and 80 percent during those episodes.
Starlink responded with firmware updates and beamforming adjustments. Packet loss then dropped back to workable levels.
Starlink maritime terminals are already active on tankers rerouting around the Hormuz corridor. Speeds range from 100 to 220 megabits per second at low latency.
SpaceX is reportedly preparing an IPO prospectus this week, per Bloomberg, Reuters, and The Information. The target valuation sits between $1.5 and $1.75 trillion.
The filing arrives at a moment when its service directly addresses a gap exposed by geopolitical tension. The Strait of Hormuz carries oil, gas, helium, and a large share of global internet traffic. Markets have not yet fully priced this convergence.


US Senator Cynthia Lummis rejected claims that the Digital Asset Market Clarity Act leaves decentralized finance developers exposed to legal risk.
Summary
- Lummis said recent Title 3 changes would create the strongest DeFi developer protections in law.
- Jake Chervinsky warned non-custodial software developers could still face money transmitter liability under current language.
- Senate talks continue as lawmakers revise the CLARITY Act before an expected committee markup.
Her response came after crypto lawyer Jake Chervinsky said Title 3 of the latest Senate draft could still place some non-custodial software builders under money transmitter rules.
Lummis said the current criticism does not reflect the latest work on the bill. In a post on X, she wrote, “Don’t believe the FUD,” and said recent bipartisan changes to Title 3 would make the measure “the strongest protection for DeFi and developers ever enacted.”
She also said lawmakers must pass the CLARITY Act for those protections to take effect. Her comments came as Senate negotiations continued over the market structure bill and as the wider crypto industry kept close watch on the next version of the text.
Chervinsky said his main concern is that non-custodial software developers could still be misclassified as money transmitters. He argued that this issue remains unsettled and said that point is “non-negotiable for DeFi.”
The debate centers on how Title 3 interacts with the Blockchain Regulatory Certainty Act. The BRCA, introduced by Lummis and Senator Ron Wyden in January, says developers and infrastructure providers who do not control user funds should not be treated as money transmitters under federal law.
Moreover, the DeFi Education Fund said the January Senate draft included the BRCA in Section 604 and self-custody language in Section 605. At the same time, it said the same draft added a new Title 3 with illicit finance provisions that could still affect DeFi technology and developers.
That concern has grown after recent enforcement actions in the United States. The Justice Department said Tornado Cash co-founder Roman Storm was convicted on August 6, 2025, of conspiracy to operate an unlicensed money transmitting business.
Senate talks continue as bill remains under review
The Senate Banking Committee had planned to mark up digital asset market structure legislation on January 15. Chairman Tim Scott then said on January 14 that the markup would be postponed while bipartisan negotiations continued.
Reuters later reported that the bill still faced disputes in March, with banks opposing stablecoin reward features that could draw deposits away from traditional lenders. That wider fight has kept the CLARITY Act under review as lawmakers work on the next step.

SEGA Music To MODfile, (Semi)Automatically

Pope Leo XIV uses visit to Monaco to urge it to use its wealth for good

Service charges coming under government scrutiny

Smart energy pays enters the US market, targeting scalable financial infrastructure

Why Israel is blocking foreign journalists from entering

Bitcoin: We’re Entering The Most Dangerous Phase

bus | ticket | busticket | money | attack

26 March| NY Session | Forex and Crypto Live Market Analysis | #ForexLive #SwappyTrading #ICT

Global recession if oil price hits $150, boss of financial giant BlackRock warns | BBC News
-
 NewsBeat3 days ago
Manchester United reach agreement with Casemiro over contract clause amid transfer speculation
-

 News Videos2 days ago
Parliament publishes latest register of MPs’ financial interests
-

 Crypto World6 days ago
Best Crypto to Buy Now: Strategy Just Spent $1.57 Billion on Bitcoin During Fear While Early Investors Quietly Enter Pepeto for 150x Potential
-

 Crypto World6 days ago
Bitcoin Price News: Bhutan Sells $72 Million in BTC Under Fiscal Pressure, but the Smart Money Entering Pepeto Sees What the Market Does Not
-

 Sports5 days ago
Remo Stars and Kano Pillars Strengthen Survival Hopes in NPFL
-

 Sports5 days ago
Gary Kirsten Accuses Pakistan Cricket Board Of ‘Interference’, Mohsin Naqvi Responds
-

 Business6 days ago
No Winner in March 21 Drawing as Prize Rolls to $133 Million for Next
-

 Tech6 days ago
Give Your Phone a Huge (and Free) Upgrade by Switching to Another Keyboard
-

 Tech5 days ago
AI enters the chat: New Seattle dating app relies on tech to facilitate meaningful human connections
-

 News Videos5 days ago
Ch 9 Financial Management Part 1 | Detailed One Shot | Class 12 Business Studies Boards 2026
-

 Tech6 days ago
Today’s NYT Connections Hints, Answers for March 22 #1015
-

 Business1 day ago
Instagram, YouTube Found Responsible for Teen’s Mental Health Struggle in Historic Ruling
-

 Business6 days ago
Will Duke Basketball Win It All? Duke Basketball Enters Second Round as Third Favorite to Claim NCAA Title
-

 Sports5 days ago
2026 Kentucky Derby horses, odds, futures, preview, date: Expert who hit 12 Derby-Oaks Doubles enters picks
-

 NewsBeat11 hours ago
The Story hosts event on Durham’s historic registers
-
 NewsBeat6 days ago
Update on Wisbech river crash as search for teenage boy enters fifth day
-
 Entertainment5 days ago
Cynthia Bailey Dishes on ‘RHOA’ Season 17, Discusses Kandi
-

 Tech6 days ago
SteamOS update adds support for Steam Machine and other non-Valve hardware
-

 Tech5 days ago
Samsung will soon let you control smart home devices from your car’s dashboard
-

 Business4 days ago
More women enter wealth management, but few in advisory roles: study
You must be logged in to post a comment Login