
Crypto World
Markets Shift From Fed Pause Bets to CPI Focus


Bitcoin opened the week by printing fresh August highs as traders digested incoming U.S. inflation figures and renewed attention on global rate expectations. With the latest month-to-date strength pushing price toward the mid-$60,000s, market participants are now focusing on whether key technical levels can hold—especially with volatility risk rising ahead of CPI and PPI releases.
At the same time, the macro backdrop remains complicated: markets are still recalibrating the path for Federal Reserve policy into 2026, while the Japanese yen has moved back toward the widely watched 160-per-dollar area after recent U.S.-linked intervention. The mix of macro drivers and onchain positioning is helping shape a market debate that’s increasingly split between large holders and smaller retail addresses.
Key takeaways
- U.S. CPI and PPI data land this week, arriving after mixed-but-cooler inflation and labor signals that have shifted rate-hike odds.
- The Japanese yen is back near the 160 level following earlier intervention dynamics that traders link to broader risk-asset liquidity.
- BTC bulls are centered on the $65,800 region, framed by multiple traders and order-book-derived liquidation focus.
- CryptoQuant data points to a multi-month high in accumulation among large Bitcoin wallets (addresses holding >10,000 BTC).
- Despite pockets of strength, onchain “cycle” indicators still suggest the bear market phase may not be over—particularly in the second half of 2026.
Inflation data and the Fed’s tightening/pausing calculus
This week’s market attention is firmly on the release schedule for the Consumer Price Index and Producer Price Index. The July CPI is due on Wednesday and the July PPI on Thursday, milestones that often move expectations around the Federal Reserve’s future interest-rate path.
Recent inflation signals have been uneven, and the new prints arrive amid additional uncertainty tied to the U.S.-Iran conflict. According to Reuters, oil prices have remained sensitive to developments around the Strait of Hormuz—an exposure that can feed through to CPI depending on whether shipping conditions deteriorate or reopen. SS WealthStreet founder Sugandha Sachdeva told Reuters that crude oil remains “caught between opposing forces” as markets weigh the possibility of a breakthrough over the strait versus Iran’s conditions for reopening.
Beyond oil, the immediate context for traders is the direction of prior U.S. macro releases. Cointelegraph previously noted that last month’s CPI and PPI results surprised to the downside, with CPI posting its largest monthly decline since April 2020. Labor-market data also contributed to a cooler tone: after nonfarm payrolls fell short of expectations, Cointelegraph reported weaker-than-expected labor conditions and rising odds of a more dovish Fed.
Those changes have mattered for rate pricing. As reflected in CME Group’s FedWatch Tool, the probability of the Fed pausing at its Sept. 16 meeting stood at 56% as of Monday, after earlier market pricing leaned more heavily toward a hike. In the latest edition of its newsletter, Mosaic Asset Company wrote that a week earlier implied odds favored a September rate hike, but now pricing “slightly favor[s] the Fed keeping rates on hold,” with just one hike before pausing well into next year.
Yen dynamics return to the center of risk-asset debate
While U.S. data drives part of the narrative, traders are also monitoring currency flows that can alter liquidity across global markets. The Japanese yen has remained a focal point after a rare episode of U.S.-Japanese coordination—the first joint intervention since the late 1990s.
After USD/JPY weakened to its lowest levels since 1986 earlier in August, the New York Fed—acting on behalf of the U.S. Treasury—purchased yen using euros via the Exchange Stabilization Fund. U.S. Treasury Secretary Scott Bessent indicated at the time that further interventions were possible, arguing the U.S. strongly supports Japan’s steps to correct what he characterized as the yen’s “substantial undervaluation.”
In the days since, the yen’s trajectory has been mixed. It initially strengthened toward around 156 per dollar, but has since weakened again and is back above 158.50, edging toward the key 160 level.
Brookings Institution senior fellow Robin Brooks cautioned that intervention mechanics alone may not reverse the underlying trend. In a Substack post, he compared the effectiveness of the move to prior “rate check” dynamics around Japan’s Feb. 8 general election, arguing that price action didn’t show meaningful reversal and suggesting the intervention is unlikely to stop the yen’s weakening trend.
Earlier Cointelegraph reporting also flagged how the yen carry trade can influence liquidity conditions for crypto and other risk assets. QCP Capital similarly emphasized that the larger issue is whether higher Japanese yields change incentives for investors to allocate capital overseas.
BTC technical focus shifts to $65,800 while traders watch liquidity
Bitcoin’s price action during the week has been defined by a blend of breakout expectations and resistance from widely watched moving averages. Into Sunday’s weekly close, BTC printed month-to-date highs around $65,420, then consolidated as traditional markets reopened.
TradingView data continued to show BTC/USD stuck in a range, with the 50-month exponential moving average (EMA) acting as overhead resistance near $65,827. Still, trader Michaël van de Poppe argued that three breakout signals are forming based on traditional momentum indicators. He reported “strong” bullish divergences in both MACD and RSI across three-day and one-week time frames—an approach that looks for confirmation even when price temporarily stalls.
In van de Poppe’s framework, the pivotal line is $65,800. He suggested that if the $65,800 weekly level breaks, a “volatile move upwards” could follow due to short-side liquidity being forced to exit after consolidation. Separately, CoinGlass order-book-derived liquidation mapping also highlighted $65,800 as a key area where liquidations could cluster if price turns decisively.
At the time of reporting, cross-crypto short liquidations over the prior 24 hours were $53 million, indicating that while the market is not in a full-scale expansion phase, traders are positioned enough for moves around key levels to have feedback effects.
Other technical commentary from CryptoQuant contributor Andrew Kamsky pointed to a falling wedge pattern on the daily chart and described a potential “decision window” for the range by Aug. 17. He framed scenarios where rejection between $66.4K and $66.8K followed by higher lows could build toward an ascending triangle, while a move back inside the wedge would weaken the bullish setup and a break below support would invalidate it. As an upside possibility, Kamsky cited $72,000 as a “possible scenario.”
Onchain signals: large-wallet accumulation rises as smaller holders reduce
The most constructive onchain development comes from growing activity among large Bitcoin investors. CryptoQuant’s analysis points to a sharp shift toward accumulation among addresses holding more than 10,000 BTC. On a 60-day rolling basis, that cohort’s balance increased by 46,420 BTC on Aug. 9, which CryptoQuant described as the largest uptick since March 15.
CryptoQuant also emphasized that the latest reading nearly doubled the 23,238 BTC accumulation peak recorded in mid-March. In other words, the acceleration has not merely continued—it has intensified.
Just as importantly, CryptoQuant described a divergence between large holders and smaller addresses. After accumulating through July, wallets holding between 0.1 BTC and 1 BTC distributed roughly 9,700 BTC over the same 60-day window through Aug. 9. The implication is that large holders are adding exposure while smaller participants are trimming, a positioning split that matters because it can influence how quickly demand absorbs sell pressure if price tests lower support levels.
This week’s accumulation narrative also fits into a broader backdrop of participation concerns. Cointelegraph previously cited CryptoQuant-era observations of strong accumulation between $62,000 and $65,000 alongside order-book and market-structure debates. Glassnode cofounder Rafael Schultze-Kraft added another angle in social commentary: he described spot markets as “virtually dead,” pointing to a daily spot turnover ratio of 0.32% (the lowest level in his data) and a roughly 64% year-over-year decline in dollar volume.
Cycle indicators still warn that the bear market may be lingering
Even with accumulation data and bullish divergences on short-term charts, some analysts argue the market remains in a late-stage bear-market condition. Schultze-Kraft discussed a record “capitulation” phase in a basket of 45 indicators tracked via Glassnode’s Bitcoin Cycle Position Heatmap. In his description, the market is in its coldest stretch since FTX—late in the bear cycle but not yet in the most definitive “deep blue” stage that previously marked a floor.
CoinGlass offers a similar framing through its Bull Cycle Peak Indicators compilation, which it reports as sitting 32% toward an ideal “sell” zone. Taken together, these approaches suggest that while selective accumulation and liquidity dynamics may support short-term upside attempts, structural reversal confirmation may still require more broad participation than what spot metrics currently indicate.
Trader and analyst Rekt Capital added a historical lens by comparing the current chart structure to the 2022 bear market. In a weekend post, he argued that Bitcoin was forming lower highs relative to a July upside wick in 2022, while August produced a higher high in that earlier cycle. He also reiterated that Bitcoin has yet to reclaim the 50-month EMA around $65,827—presenting the same technical ingredient that often precedes a deeper bear-market capitulation phase.
For traders and investors, the next decision points are likely to converge: how CPI and PPI shift Fed expectations, whether the yen’s approach to 160 changes global liquidity incentives, and whether BTC can turn $65,800 into a confirmed support level rather than another range boundary. Watch whether onchain accumulation broadens alongside spot activity—or whether the market continues to show strength dominated by a smaller set of large holders.

Ripple’s XRP remains under sustained selling pressure, with the latest price action pushing the asset back into a critical support area around $1.01-$1.04. Although this zone has attracted buyers before, the broader structure continues to favor sellers, making the current reaction particularly important for the next directional move.
Ripple Price Analysis: The Daily Chart
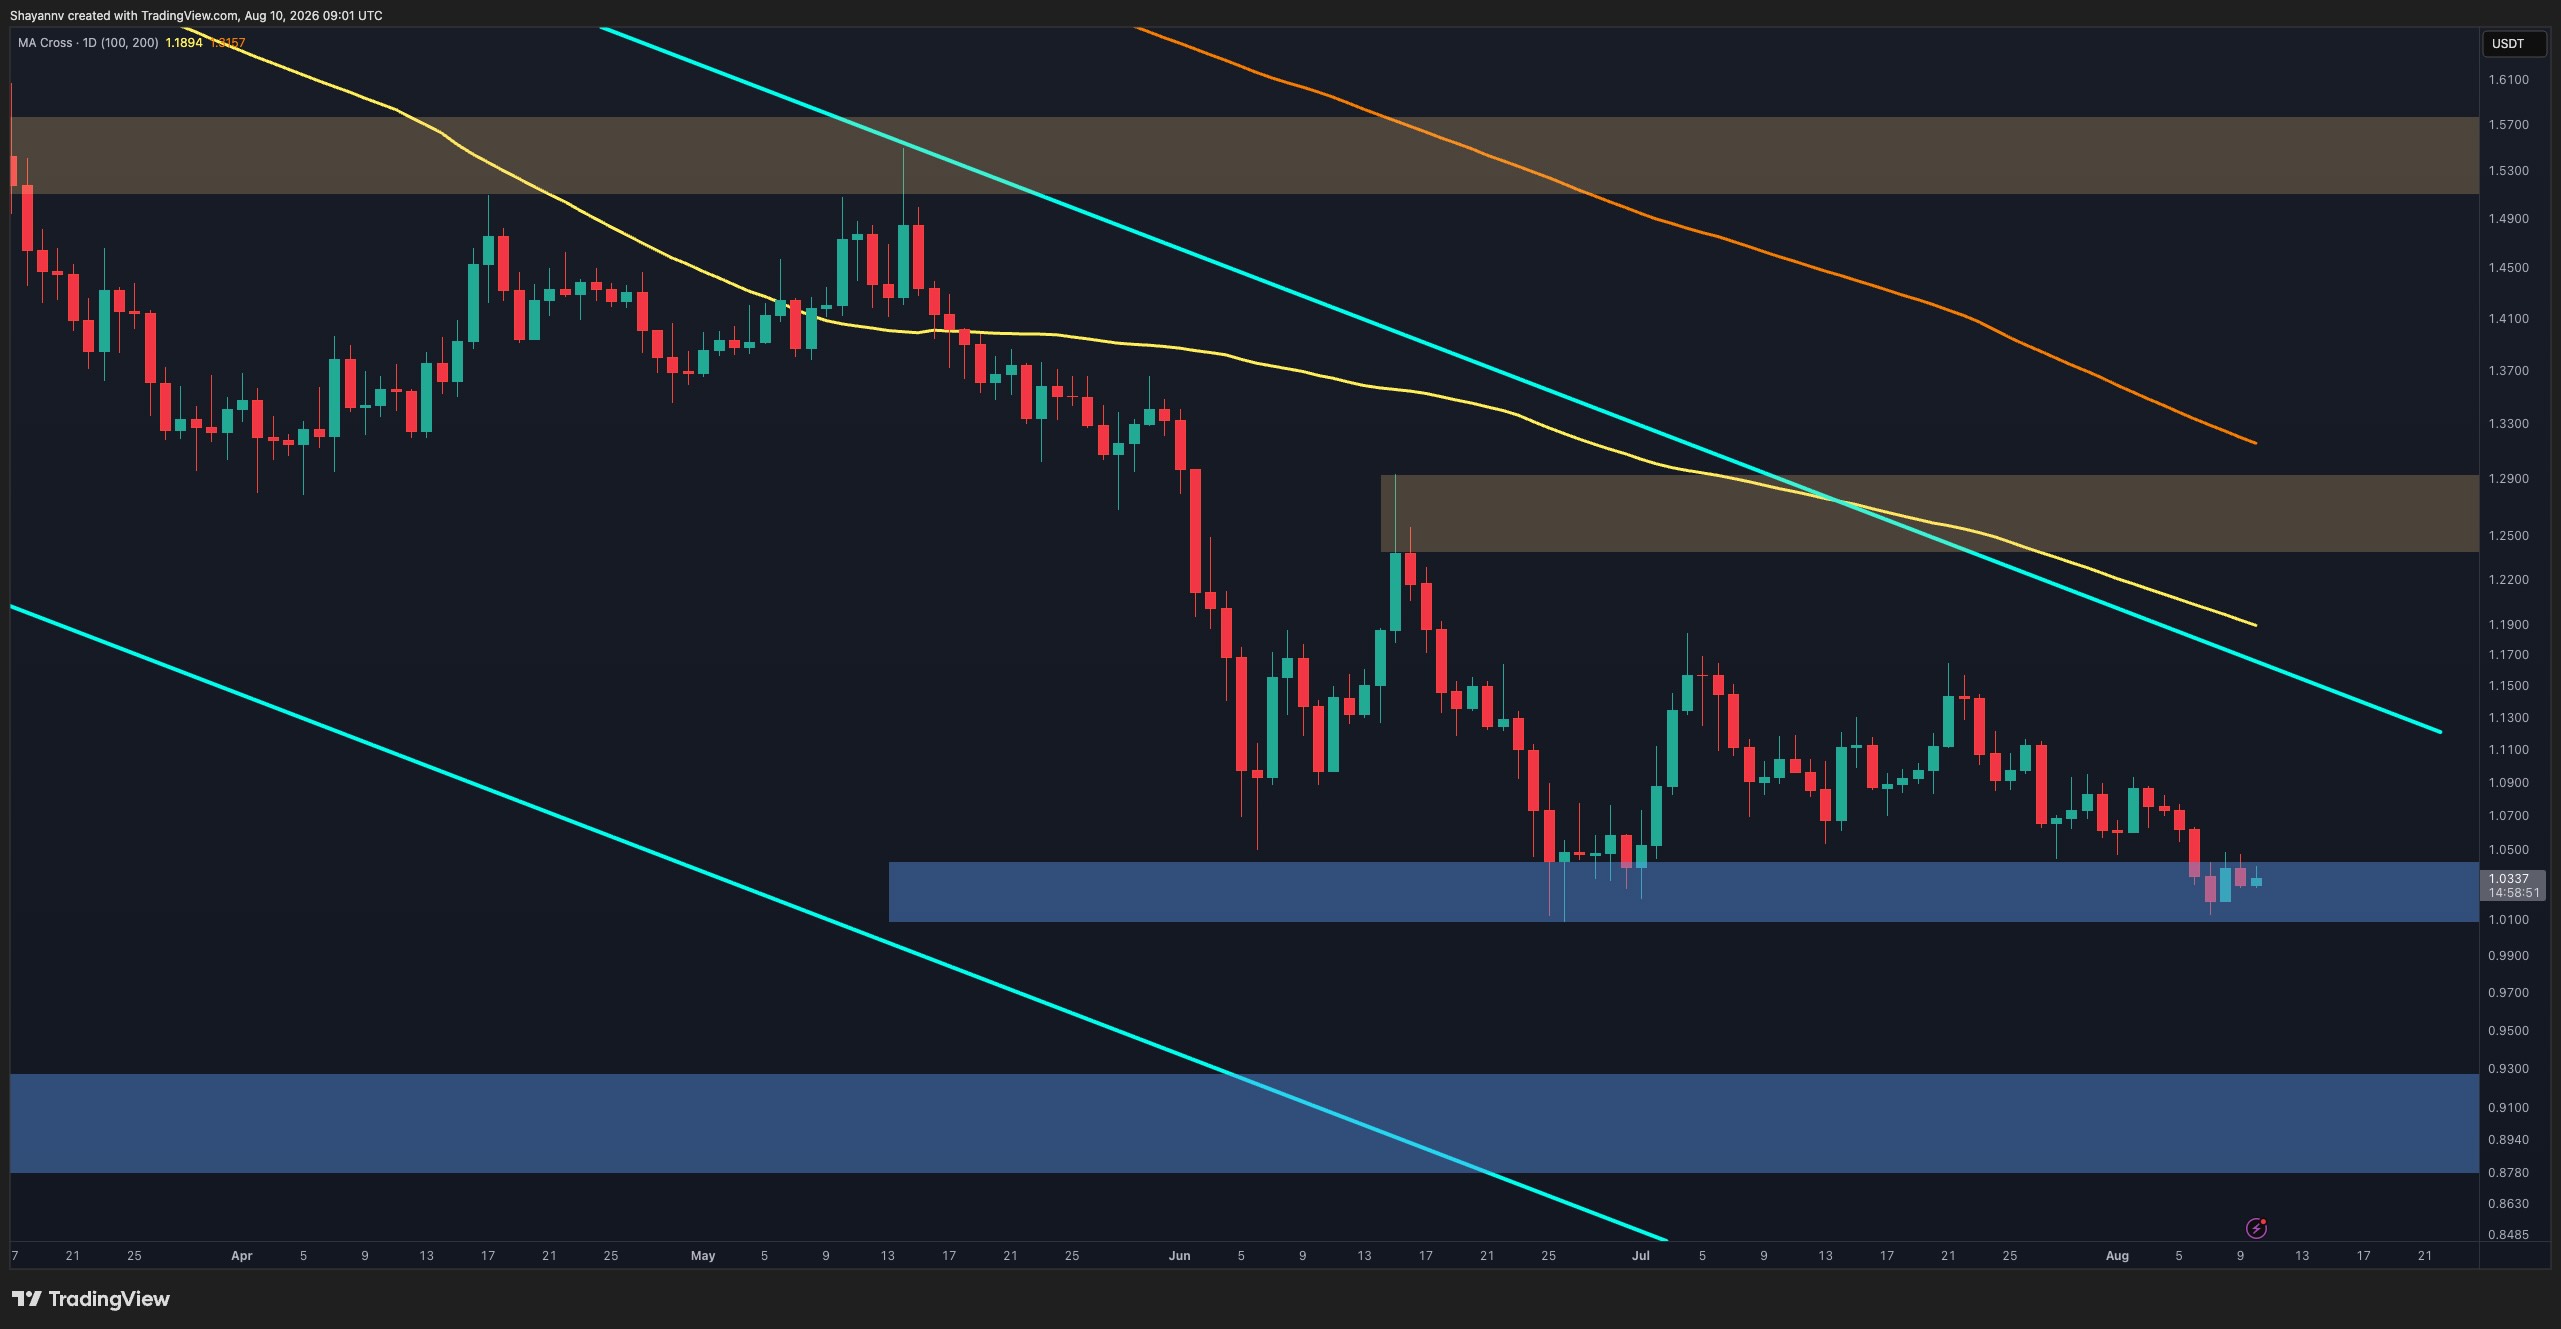
On the daily timeframe, XRP is trading near $1.03 after gradually declining back into the $1.01-$1.04 support zone. This marks another test of an area that already produced notable reactions in late June, yet the latest approach is occurring with relatively weak bullish momentum.
More importantly, the broader trend remains decisively bearish. The price continues to trade inside the large descending channel and well below all moving averages shown on the chart.
The recent sequence of lower highs also remains intact. The previous rebound was rejected around $1.14-$1.15, well before XRP could challenge the more important $1.24-$1.29 resistance zone. Therefore, buyers are increasingly dependent on the $1.01-$1.04 support area holding.
A convincing breakdown below $1.01 would weaken the structure further and could expose the lower $0.88-$0.93 demand zone, which also sits closer to the descending channel’s lower boundary. Conversely, defending current support could produce another relief rebound, but the asset would still need to reclaim higher resistance levels before the broader bearish outlook materially changes.
XRP/USDT 4-Hour Chart
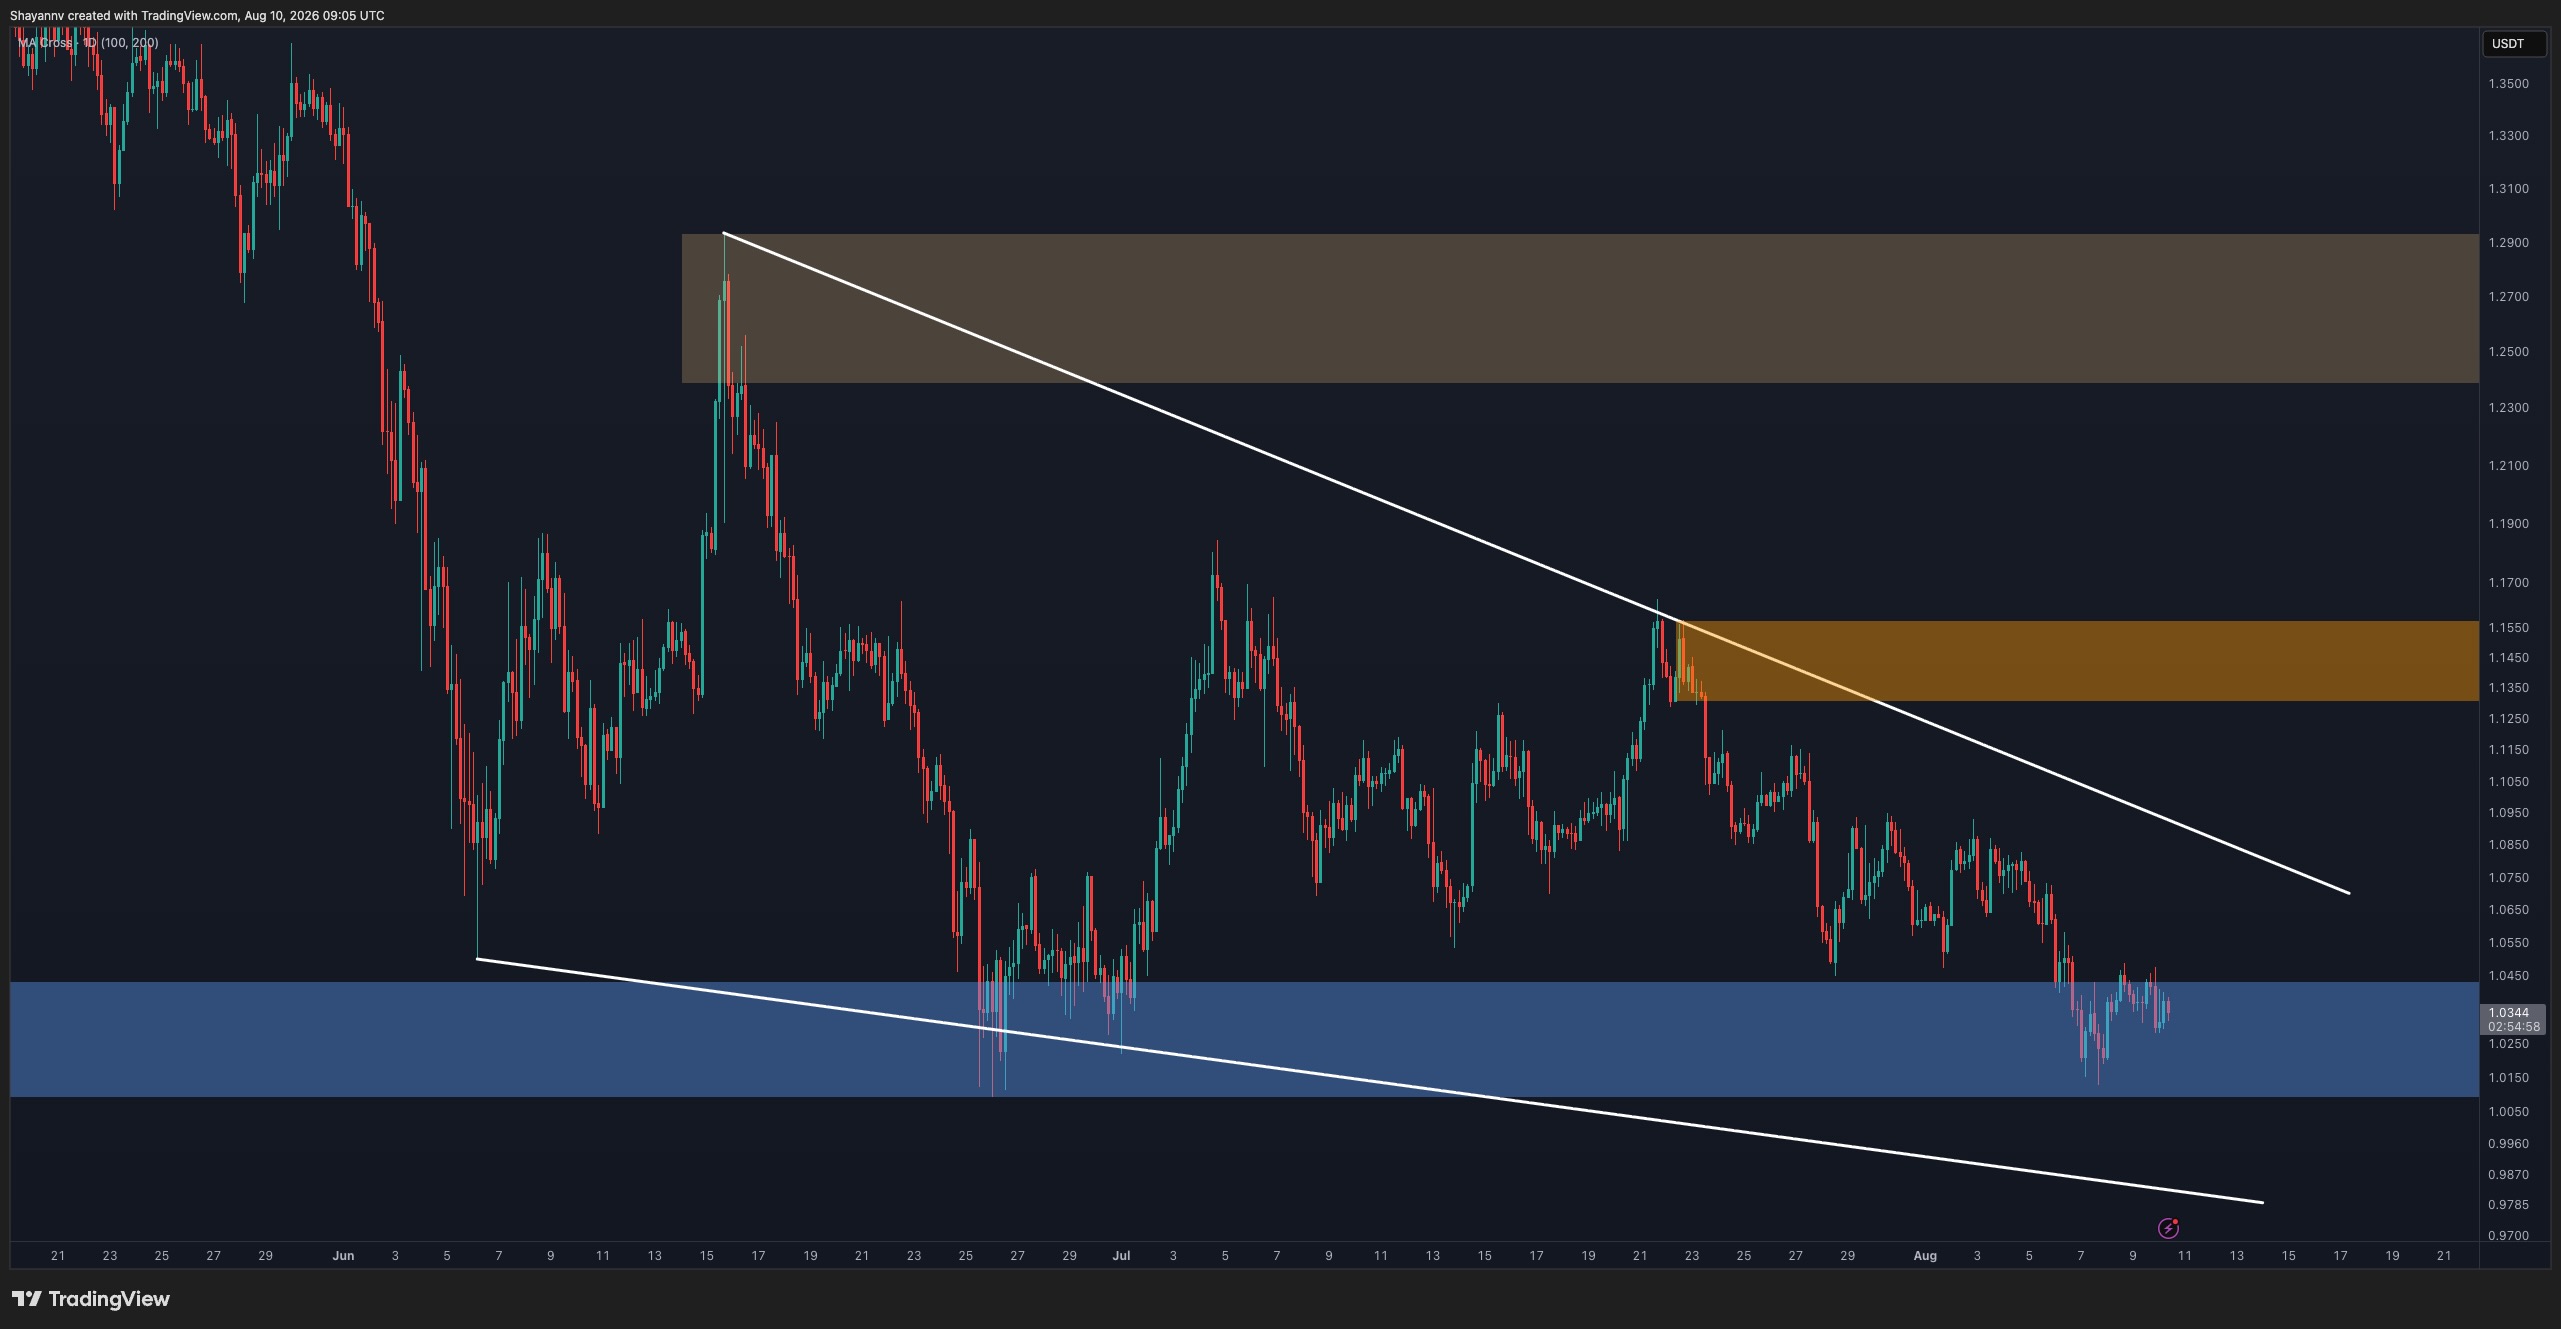
The 4-hour chart highlights the immediate pressure more clearly. Since the late-July rejection, XRP has continued printing lower highs beneath the descending trendline, while successive rebounds have become increasingly shallow.
Most recently, the price broke into the $1.01-$1.04 support zone and briefly dipped toward roughly $1.02 before attempting to stabilize. However, the response has so far been modest, with XRP consolidating near $1.03 rather than producing an impulsive recovery. This suggests buyers are defending the area, but have not yet demonstrated enough strength to shift short-term momentum.
The first meaningful improvement would require price to reclaim the descending trendline, currently approaching the $1.07 area. Beyond that, the $1.13-$1.15 resistance zone represents the more important hurdle, as the previous rally was rejected at this region.
Until these levels are reclaimed, the possibility of another liquidity sweep below the recent lows remains elevated. A decisive loss of the $1.01-$1.04 support zone would confirm renewed bearish continuation and shift attention toward sub-$1 levels. Alternatively, a strong rejection from the current support followed by a breakout above the descending trendline could initiate a more substantial recovery toward $1.13-$1.15.
The post Ripple Price Analysis: What Are XRP’s Next Targets if $1.00 Support Cracks? appeared first on CryptoPotato.
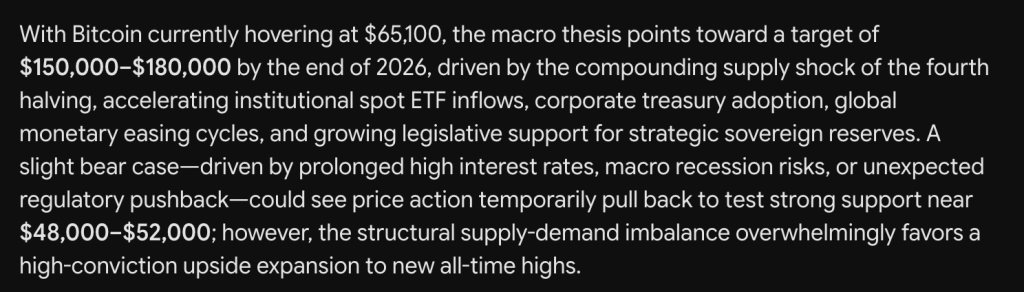
Forget the daily noise for a moment and look at the supply side. Gemini AI predicts a compounding shock from the fourth halving carries Bitcoin from $65,100 upward, and the price prediction lands at $150,000 to $180,000 by the close of 2026.
That halving effect sits at the center of the argument. Issuance keeps shrinking while demand channels multiply around it.
Institutional spot ETF inflows are accelerating alongside it. Corporate treasury adoption adds a second buyer category that does not sell easily.
Global monetary easing cycles supply the macro backdrop. Cheaper money historically flows into scarce assets first.
Growing legislative support for strategic sovereign reserves completes the picture. Gemini treats the combination as a structural supply and demand imbalance rather than a trade.
The downside is described as slight. Prolonged high interest rates would delay every part of the easing thesis.
Macro recession risks form the second concern. Unexpected regulatory pushback is the third.
Any of those could pull price back to test strong support near $48,000 to $52,000. Gemini still frames that as temporary and favors high-conviction expansion to new all-time highs.

Discover: Everyone’s Got a Take. Get Free $25 to Actually Trade Yours
Bitcoin Price Prediction: Scarcity Math Versus A Chart That Has Gone Nowhere
The daily view shows a market well past its peak. Bitcoin traded near $126,000 in October before the trend broke. November started the decline toward $88,000. February brought the sharpest leg, cutting price from $92,000 to roughly $59,000.
Spring staged a real recovery to about $84,000 by May. June reversed it completely, returning Bitcoin near $57,000. July and August have been quieter. Price has built a slow grind higher with a steady sequence of higher lows.
The close reads $65,042, up 0.29% and $185 on the day. The session traded between $64,780 and $65,333.
Support sits at $62,000 first, then $57,000 at the June low. Resistance stacks at $68,000, $72,000 and $80,000. RSI reads 55.37 against a signal line at 50.45. That gap of roughly 5 points leans bullish, showing buyers with a modest advantage.
Both lines sit above the midline now. Momentum has improved without becoming stretched.
Gemini is describing a supply squeeze the chart has not priced. A push through $68,000 would be the first sign the market is starting to agree.
Discover: Your Market Calls Are Worth Something. Start With Free $25 on Kalshi
Everyone’s Got a Predicts Even Claude AI, Yours Can Carry a Price And Make You Money.
Reading the chart is free. Backing the call costs something, which is exactly why the odds on Kalshi tend to move before the headlines do.
It’s a CFTC-regulated exchange for event contracts: the Fed, inflation, crypto price levels, resolved against a defined source. Being right on a slow timeline still loses if the contract expires first, so mind the dates.
→ Get up to $25 to trade your first market on Kalshi
Don’t Miss Out on Our $1,000 USDT Airdrop on ByBit
The post Google Gemini AI Predicts a Bitcoin Price Swing Nobody Is Pricing In appeared first on Cryptonews.

Strive has added 147 Bitcoin to its corporate treasury, lifting its total holdings to 20,167 BTC. The purchase strengthens the company’s Bitcoin reserve as it continues expanding its digital asset strategy. Meanwhile, Strive reported strong Bitcoin yield figures, retired its debt, and maintained substantial cash reserves.
Bitcoin Treasury Reaches 20,167 BTC
Strive purchased 147 BTC between August 3 and August 7 at an average price of $64,812 per Bitcoin. Consequently, the latest purchase increased the company’s total Bitcoin holdings to 20,167 BTC. Based on current valuations, Strive’s Bitcoin treasury now carries a value of roughly $1.3 billion.
The latest acquisition continues a buying trend that accelerated throughout 2026. Strive purchased 1,109 BTC in May and added another 2,500 BTC during June. The company then continued its accumulation with additional Bitcoin purchases during July and early August.
Strive now ranks among the largest public companies holding Bitcoin in their corporate treasuries. BitcoinTreasuries.NET listed the company as the seventh-largest public Bitcoin holder. Therefore, the latest purchase further strengthens Strive’s position within the growing corporate Bitcoin market.
Bitcoin Yield Supports Treasury Strategy
Strive reported a Bitcoin yield of 24% during the second quarter of 2026. The company also recorded a Bitcoin yield of 38% during the first half of the year. Strive calculates the metric by comparing changes in Bitcoin holdings against diluted shares outstanding.
Meanwhile, the company fully retired its debt during the second quarter. Strive also held approximately $155 million in cash reserves after completing its debt reduction. Together, the cash position and Bitcoin holdings provide the company with two major treasury assets.
Strive has also introduced SATA, a preferred stock product that pays daily dividends. In addition, the company launched a Bitcoin treasury dashboard and website on August 10. The new tools provide regular updates about its Bitcoin holdings and treasury activity.
Bitcoin Expansion Follows Semler Merger
Strive significantly increased its Bitcoin reserves after completing its all-stock merger with Semler Scientific in September 2025. The transaction raised Strive’s Bitcoin holdings from about 5,000 BTC to approximately 10,900 BTC. Since then, the company has continued adding Bitcoin through regular treasury purchases.
The company’s 2026 acquisitions have pushed its holdings well above the level recorded after the merger. The May and June purchases accounted for 3,609 BTC before the latest acquisition. With the additional 147 BTC, Strive has continued building its reserve at a faster pace.
Tracking services estimate Strive’s average acquisition cost at about $94,700 per BTC across its entire treasury. However, the latest purchase price of $64,812 remained below that estimated average. As a result, the new acquisition added Bitcoin at a price below the reported cost basis of its broader holdings.
Strive’s growing Bitcoin reserve now forms a major part of its corporate financial strategy. The company continues combining Bitcoin accumulation with its asset management operations and treasury products. Meanwhile, its debt repayment and cash reserves provide additional financial resources as the strategy expands.

Settling for hand sanitizer
Hand sanitizer isn’t a lazy or inferior choice in every situation. “A lot of people ask, ‘Well, can I just use the hand sanitizer?’” Roberts says. “And sure—they’re very effective.”
She keeps it within reach when soap and water aren’t convenient, especially before eating on the go. “Just pop one of those things into your bag, and hit that hand sanitizer before you pick up a hamburger,” she says.
There are exceptions. Alcohol-based sanitizer doesn’t work well against norovirus, Griffin says. If someone nearby is vomiting or has diarrhea, he makes a point of washing thoroughly with soap and water. Sanitizer also isn’t ideal when your hands are visibly dirty. But for ordinary use when you’re out and about, there’s no reason to feel guilty about reaching for it.
Eliminating every possible risk
Torres knows how easily learning about infectious diseases can send someone spiraling. “You can end up wanting to live in a bubble and never go outside—and that’s just impossible,” she says. “If you go too far down the rabbit hole, you get a little depressed.”
Solstice Finance rolled out a Solana-based product that gives decentralized finance (DeFi) users structured exposure to the dividend income and price risk of Strategy’s (MSTR) preferred stock (STRC).
The Zug, Switzerland-based firm, a DeFi yield infrastructure protocol built on Solana, said its new product splits the indirect STRC exposure into a senior and junior tranche, the firm said in a press release shared via Telegram.
Strategy disclosed it sold 1,690 bitcoin for $108.6 million on Monday, using the proceeds to repurchase 1,152,020 shares of its variable-rate preferred stock, STRC, for $108.6 million. The bitcoin sale reduced Strategy’s holdings to 840,447 BTC.
The product, called strcUSX, does not tokenize or give users ownership of STRC shares. Instead, users deposit USX, Solstice’s dollar-linked settlement token, into a vault and receive one of two Solana tokens tied to the economics of a portfolio holding the Nasdaq-listed preferred stock.


The LINK token may see a 25-fold increase to $200 by the end of 2030, as the growing real world asset market increases demand for the industry’s largest oracle services provider, according to Standard Chartered.
The Chainlink (LINK) token may see an more than 25-fold increase by the end of the decade, as tokenized real world assets (RWA) will reach $4 trillion by the end of 2028, according to a forecast by Geoff Kendrick, the global head of digital asset research at Standard Chartered.
Kendrick said that the growth in tokenized assets will require more external data to come securely onchain, which may increase Chainlink’s fee generation and push its LINK token to $200 by the end of 2030, up from $8 today, according to a Monday report shared with Cointelegraph.
The report also forecast a 37-fold rise in tokenized and crypto-native assets deployed in decentralized finance, pushing these assets to $2.7 trillion by the end of 2030. Kendrick said these assets will require trusted data, interoperability between networks, privacy-preserving compliance and integrations with existing financial systems, which “only Chainlink is currently equipped to provide.”
The report follows growing demand for tokenized assets. Tokenized RWA trading on decentralized exchanges (DEXs) reached a new all-time high of $141 billion in July, marking a 19.5% monthly rise largely driven by public equities, according to data provider CryptoRank.
Chainlink is the blockchain industry’s leading decentralized oracle provider for crosschain communication, with $34.4 billion in total value secured. Chronicle ranks second with $7.36 billion, according to data aggregator DefiLlama.
Standard Chartered’s Kendrick said that potential risks to its Chainlink price forecast include slower-than-expected institutional tokenization initiatives, competition from specialist oracle providers and potential technical setbacks.
Magazine: What NYSE’s exploration of onchain systems means for financial markets

BTC USD is trading at $64,950, up a modest +0.2% on the day, after briefly punching through $65,400 in early August 10 trading. That’s not a breakout yet, as it’s already lost the $65,000 level. The bigger question is whether Wednesday’s inflation print turns this into a real move or sends BTC back toward the low $64,000s. As things stand, Bitcoin is holding steady above $64K and until $64,500 is lost, there is no real reason to panic.
The setup is straightforward on paper, messier underneath. Friday’s payroll data showed the US economy shed 23,000 nonfarm jobs in July, with unemployment holding at 4.1% and a combined 103,000 jobs erased from May and June revisions, according to the Bureau of Labor Statistics.
Weak hiring cooled expectations for further Fed tightening, and BTC gained nearly 2% on the initial reaction. That move has held for three sessions now, but $65,000 hasn’t converted into firm support; it’s still a coin flip level.
Institutional flows are backing the bid. CoinGlass clocked $854M in net spot ETF inflows from Aug. 3–7, with BlackRock’s IBIT pulling in roughly $694M of that. Farside’s daily figures over the same window total closer to $865M, a minor discrepancy but not one that changes the direction of travel. The next macro catalyst lands Wednesday at 8:30 a.m. ET, when the July CPI report either confirms the disinflation narrative or forces traders to reprice rate-cut odds.
Can BTC USD Price Hit $66,300 This Week if $64K Holds?
— CoinMarginalX (@CoinMarginalX) August 9, 2026
 THIS WEEK: Bitcoin topped $65,000 after a shockingly weak July jobs report (-23,000 jobs) slashed September Fed rate-hike odds to 40%.
Next test: the July CPI print drops Aug. 12.
A cool number locks in the dovish shift. A hot one could revive hike bets before the Sept.… pic.twitter.com/2aP2txERZi
BTC’s current range sits between support near $64,700–$64,800 and resistance stacked at $65,300–$66,300. Coinlore places the intraday band at $63,790–$66,325, with $65,469 as first resistance, then $67,081, then a stretch target near $78,085 if momentum actually builds.
TradingView notes BTC has been range-bound for roughly two months, with the monthly open sitting near $62,700, a reminder that this “recovery” is still inside a broader sideways channel, not a new trend.
Bull case: A soft CPI print extends the payroll-driven rally, ETF inflows continue, and BTC clears $65,469 to test $67,000.
Base case: CPI comes in mixed, BTC oscillates $64,000–$66,000 into next week.
Bear case: Hot inflation data revives rate-hike chatter; three Fed officials already favored a hike in July, per the Fed’s own statement, and BTC slips back under $64,700. For longer-range targets, see this 2026 Bitcoin forecast breakdown.
Discover: Get Paid to Be Right, $25 to Start on Kalshi
Bitcoin Hyper Targets Early Mover Upside as Bitcoin Tests Key Levels
A $65,000 BTC USD holding steady on ETF demand is bullish confirmation for anyone already positioned. But at a $1.3 trillion-plus market cap, a move to $67,000 is a 3% gain, not the kind of asymmetric return that rebuilds a portfolio.
That math is exactly why traders keep rotating capital into Bitcoin’s own infrastructure layer while the base asset consolidates. Some are also weighing near-term technical setups covered in this breakout-level analysis.
Bitcoin Hyper ($HYPER) is billing itself as the first Bitcoin Layer 2 with native SVM integration, smart contracts running faster than Solana itself, and settlement under Bitcoin-grade security.
The presale has raised $33,018,140.08 at a current token price of $0.0136844, with staking APY on offer (rate undisclosed, but live).
Core features include a Decentralized Canonical Bridge for BTC transfers and low-latency L2 execution designed to fix Bitcoin’s two oldest problems: fees and programmability.
Discover: Everyone’s Got a Take. Get a Free $25 to Actually Trade Yours on Kalshi
The post BTC USD Price Prediction: Can Bitcoin Hold $64,000 Before Wednesday’s CPI Data Drop? appeared first on Cryptonews.

SpaceX rivals Rocket Lab and AST SpaceMobile will both report earnings after the close on Monday. On Monday morning, Rocket Lab (RKLB) stock rose as much as 3% before paring gains, while AST SpaceMobile (ASTS) fell 2%, according to MarketSurge. Both stocks hit historic highs earlier in Q2, as the broader space industry experienced sectorwide excitement in the lead up to…
Copyright ©2026 Investor’s Business Daily, LLC. All rights reserved. 87990cbe856818d5eddac44c7b1cdeb8
Strategy, which holds the largest corporate Bitcoin treasury, sold BTC for the second week in a row to repurchase its STRC preferred stock.
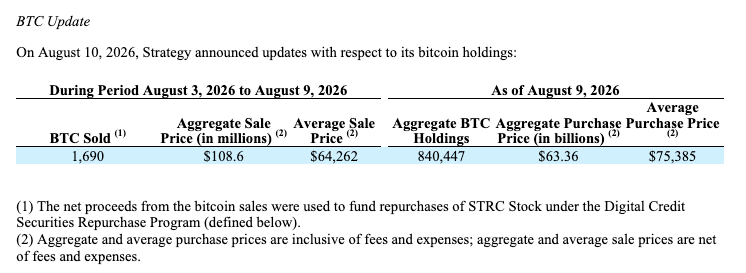
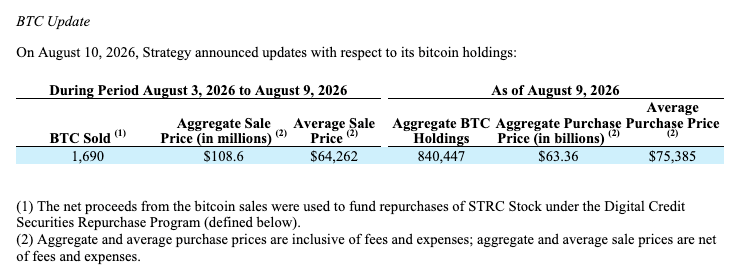
The company sold 1,690 Bitcoin for $108.6 million between Aug. 3 and Aug. 9, according to a Monday 8-K filing with the US Securities and Exchange Commission (SEC).
Strategy used the proceeds to buy back 1.15 million shares of its STRC preferred stock for $108.6 million. STRC is a variable-rate preferred stock designed to pay monthly dividends.
The transaction marked Strategy’s fourth disclosed Bitcoin sale of 2026, bringing its total Bitcoin sales for the year to 6,948 BTC, while the company still holds 840,447 BTC purchased for an aggregate $63.36 billion.
Bitcoin becomes part of the funding engine
Strategy sold the latest batch at an average net price of $64,262 per Bitcoin, while its total holdings carry an average purchase price of $75,385 per BTC, including fees and expenses.
Strategy’s prior disclosed sale involved 1,638 BTC for $104.73 million between July 27 and Aug. 2, when it also used Bitcoin sale proceeds to fund STRC repurchases.
Source: SEC
The latest filing shows that Strategy has $785.2 million remaining under its digital credit securities repurchase program, which covers its preferred stock, while another $1 billion remains available under its Class A common-stock repurchase program.
$4.65 billion reserve cushions preferred dividends
Strategy also continued building its US dollar reserve, reporting a balance of $4.65 billion as of Sunday, up from roughly $4 billion in the previous weekly update.
The company said $650 million of the $653.1 million in net proceeds from recent MSTR stock sales went toward the reserve, while the latest figure also includes expected proceeds from at-the-market (ATM) sales that had not yet settled.
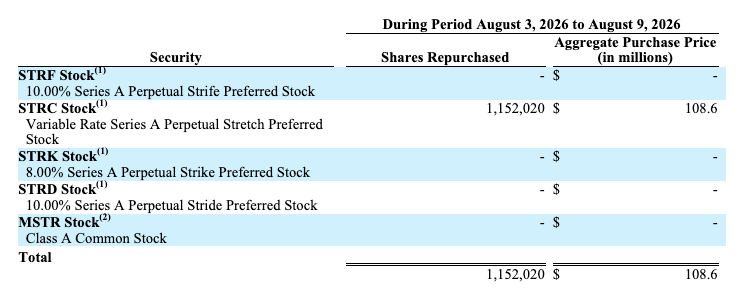
Source: SEC
STRC shares have also rallied during Strategy’s recent buybacks, retaking $90 on Aug. 3 after rebounding 24% from their June lows.
STRC was up 0.46% at $95.45 in premarket trading Monday after closing Friday at $95, while MSTR gained 0.25% to $100.26, according to Yahoo Finance.
Magazine: Strategy became a symbol of the dot-com crash: Could history repeat?
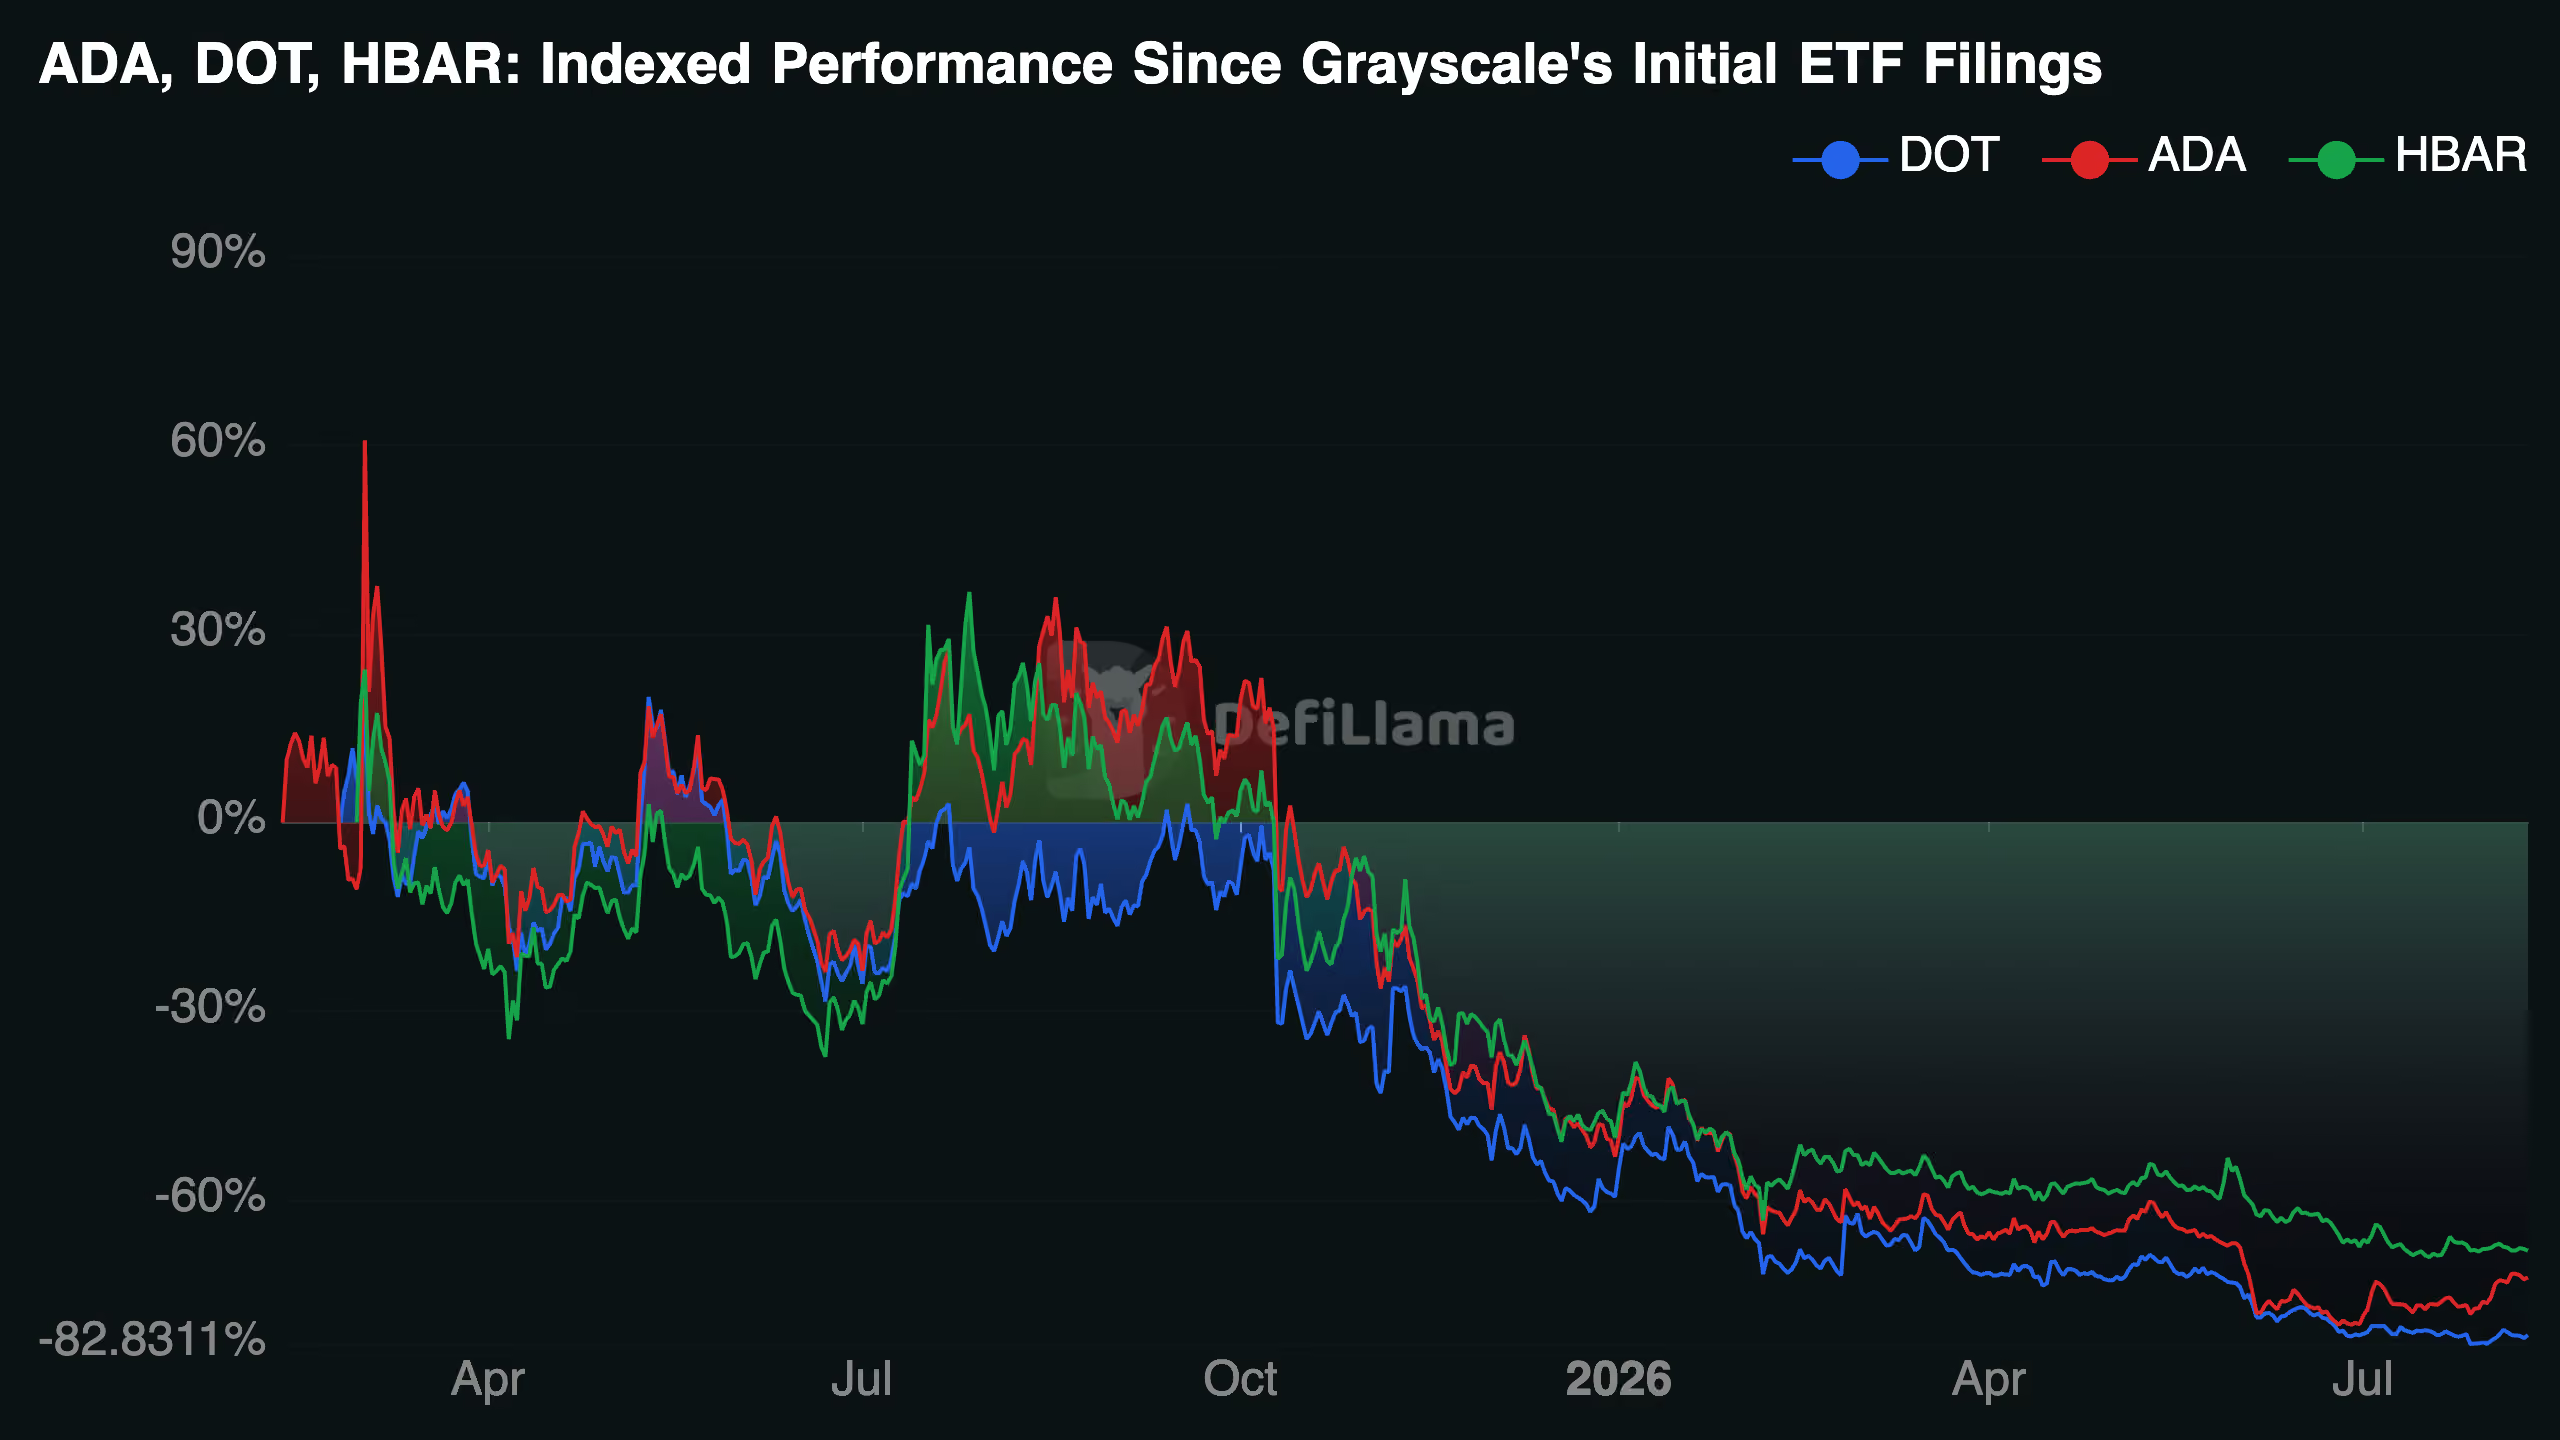
Crypto asset manager Grayscale Investments has dropped plans for exchange-traded funds tied to Cardano’s ADA, Polkadot’s DOT and Hedera’s HBAR, withdrawing three registration statements from the U.S. Securities and Exchange Commission (SEC) late Friday.
Through three separate requests with the regulator, Grayscale told the SEC it “does not intend to proceed with the planned distribution” of the shares of each trust.
The withdrawals were initiated by Grayscale and weren’t SEC rejections.
Grayscale’s initial Cardano ETF proposal came in February 2025, and its Polkadot filing later that month. Grayscale filed the corresponding ADA and DOT registration statements on Aug. 29, followed by its HBAR registration on Sept. 9.
The proposed funds were designed as passive vehicles that would track the value of their respective tokens after fees and expenses. Grayscale said it had not sold securities or distributed preliminary prospectuses under the registrations.
All three tokens have been losing value over the last few months. Year-to-date, ADA is down more than 41%, while DOT lost 54% of its value and Hedera’s HBAR lost 35%.

Since late February 2025, when the filings came in, performance has been worse. ADA endured a 70% drawdown, while DOT saw an 80% downward move. HBAR also dropped more than 70%.

Madonna And Kylie Minogue’s Love Sensation On Course For Chart Success

West Ham legend lays down Harry Kane challenge to ‘centre-forward we have been craving’

Lotus to invest in three Biscoff facilities


-

 Fashion3 days ago
Weekend Open Thread: Mattifying Sunscreen
-

 Fashion3 days ago
Frugal Friday’s Workwear Report: Cap-Sleeve Pointelle Crewneck Sweater
-

 Sports5 days ago
Jordan Coyle & Cordiamo take Laya Arena Stakes at RDS
-

 News Videos2 days ago
Can Astrology Help Find Gold and Silver Trends? A Financial Astrology Guide
-
 Business5 days ago
US stocks: Dow closes at record on Mideast optimism; SpaceX, AMD drag Nasdaq
-
 Crypto World7 days ago
US Tech Stocks See Largest 5-Week Inflow in History: Can Nasdaq Break Its Downtrend?
-

 Politics4 days ago
Reform UK And Greens Sink To Lowest Favourability Ratings To Date
-

 Business6 days ago
Nvidia Stock Climbs 2.5% as Chip Sector Rally Builds Ahead of AMD Earnings, Nvidia’s Own Report Looms
-

 Crypto World6 days ago
Polymarket targets $20 billion valuation as competition heats up in prediction market sector
-

 Tech6 days ago
OpenAI, Anthropic AI agents targeted real people and systems in cyber tests
-

 Business5 days ago
Supply chain issues impact Ingredion
-
 Crypto World6 days ago
CLARITY Act Senate Vote Locked In, But 60-Vote Hurdle Looms Large
-

 Tech3 days ago
Rinn Pharma & Biopharma to join NordicPharmaTrain network
-

 Crypto World7 days ago
The Senate has one week: CLARITY’s last August window
-
 Crypto World6 days ago
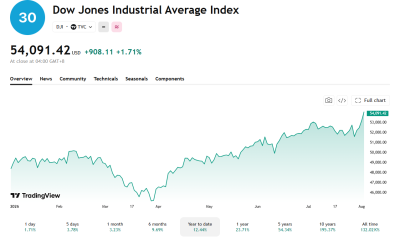
Dow and S&P 500 Hit Records on AI Earnings: When Will the Bubble Burst?
-
 Crypto World7 days ago
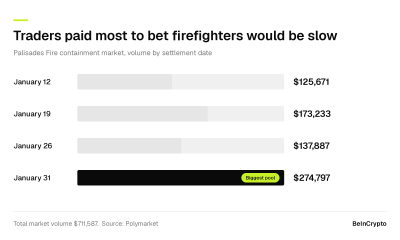
California Wildfire Bets Expose Polymarket’s Dark Side
-

 Business2 days ago
How to Start a Cleaning Business: A Step-by-Step Guide
-

 Business1 day ago
Datadog: Best Of Breed For Multiple Reasons
-

 Business7 days ago
CNH Industrial Shares Jump Over 15% After Beating Estimates and Raising Full-Year Earnings Guidance
-

 Business2 days ago
BDC Weekly Review: Private BDC Q2 Numbers Are Strong
You must be logged in to post a comment Login