

Crypto World
Revolut Confirms Bitcoin Price Glitch After App Briefly Shows BTC Near Zero
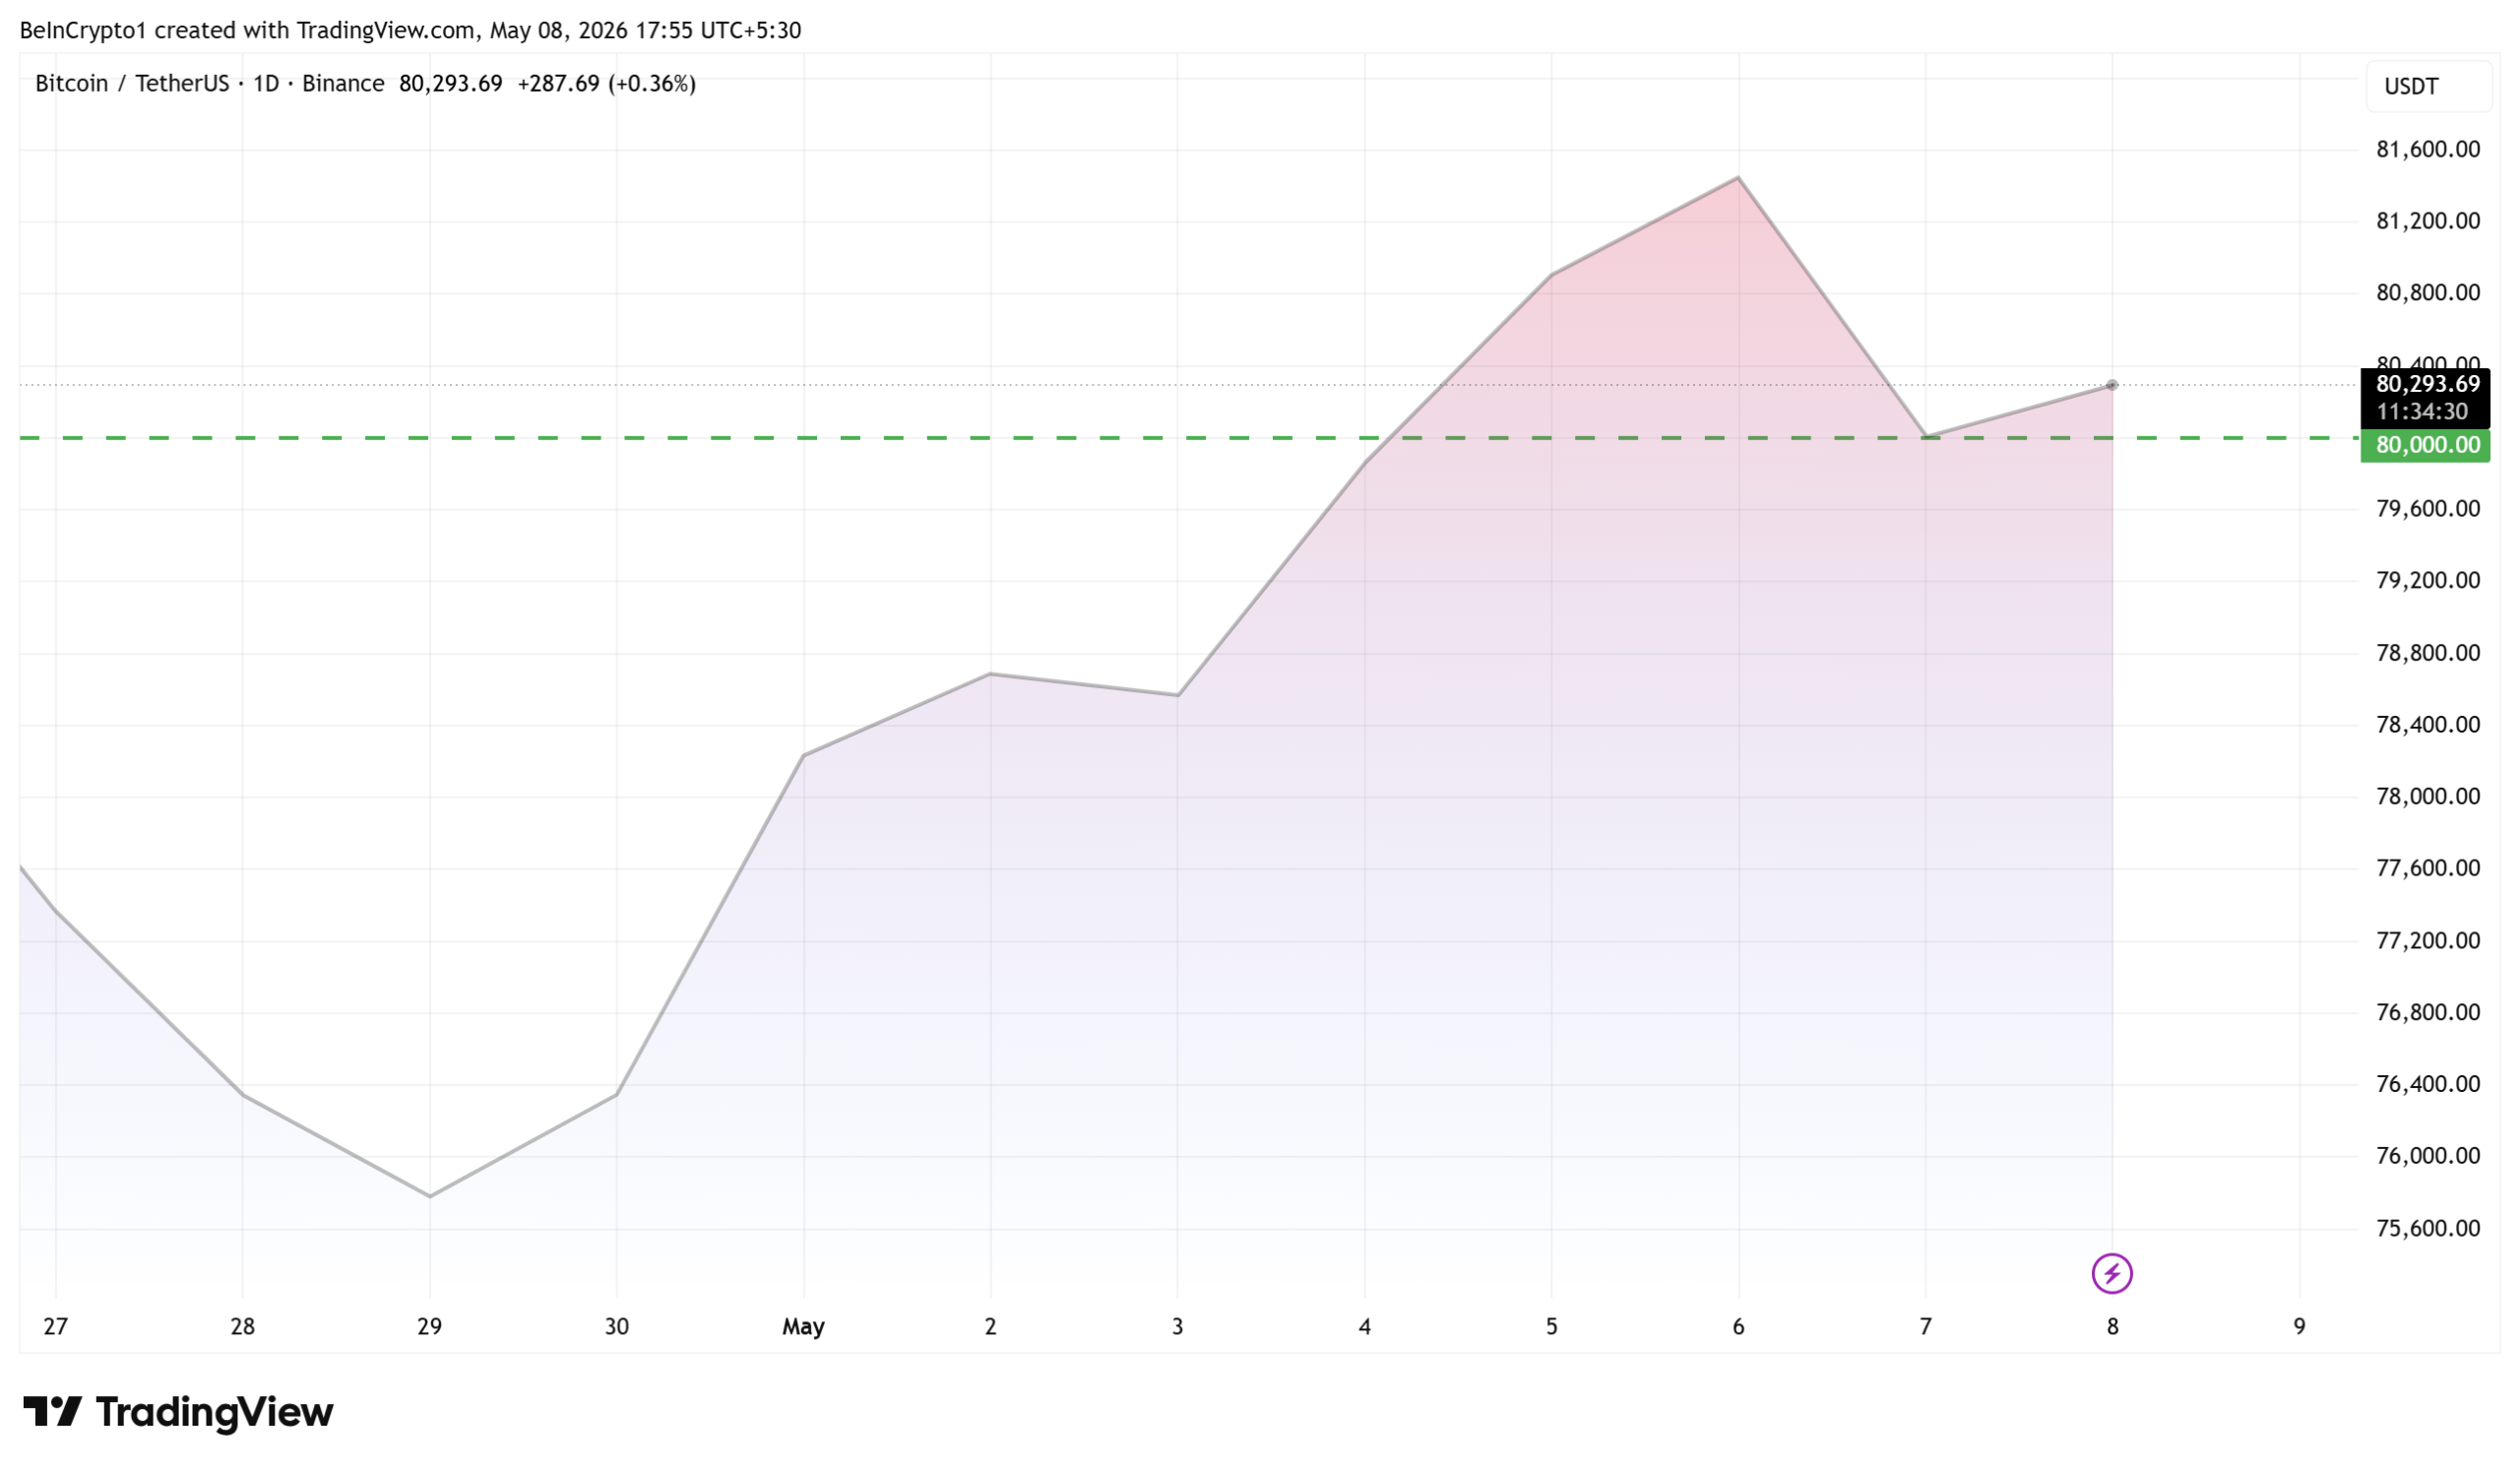
Revolut users worldwide saw Bitcoin (BTC) briefly displayed at $0.02 on Friday after a chart glitch in the fintech app, before the price snapped back within seconds.
The display problem surfaced through the app’s chart and push notifications, sparking widespread confusion across X (Twitter) and Reddit. Bitcoin continued trading above $80,000 on every major exchange during the incident.
What Happened on the Revolut App
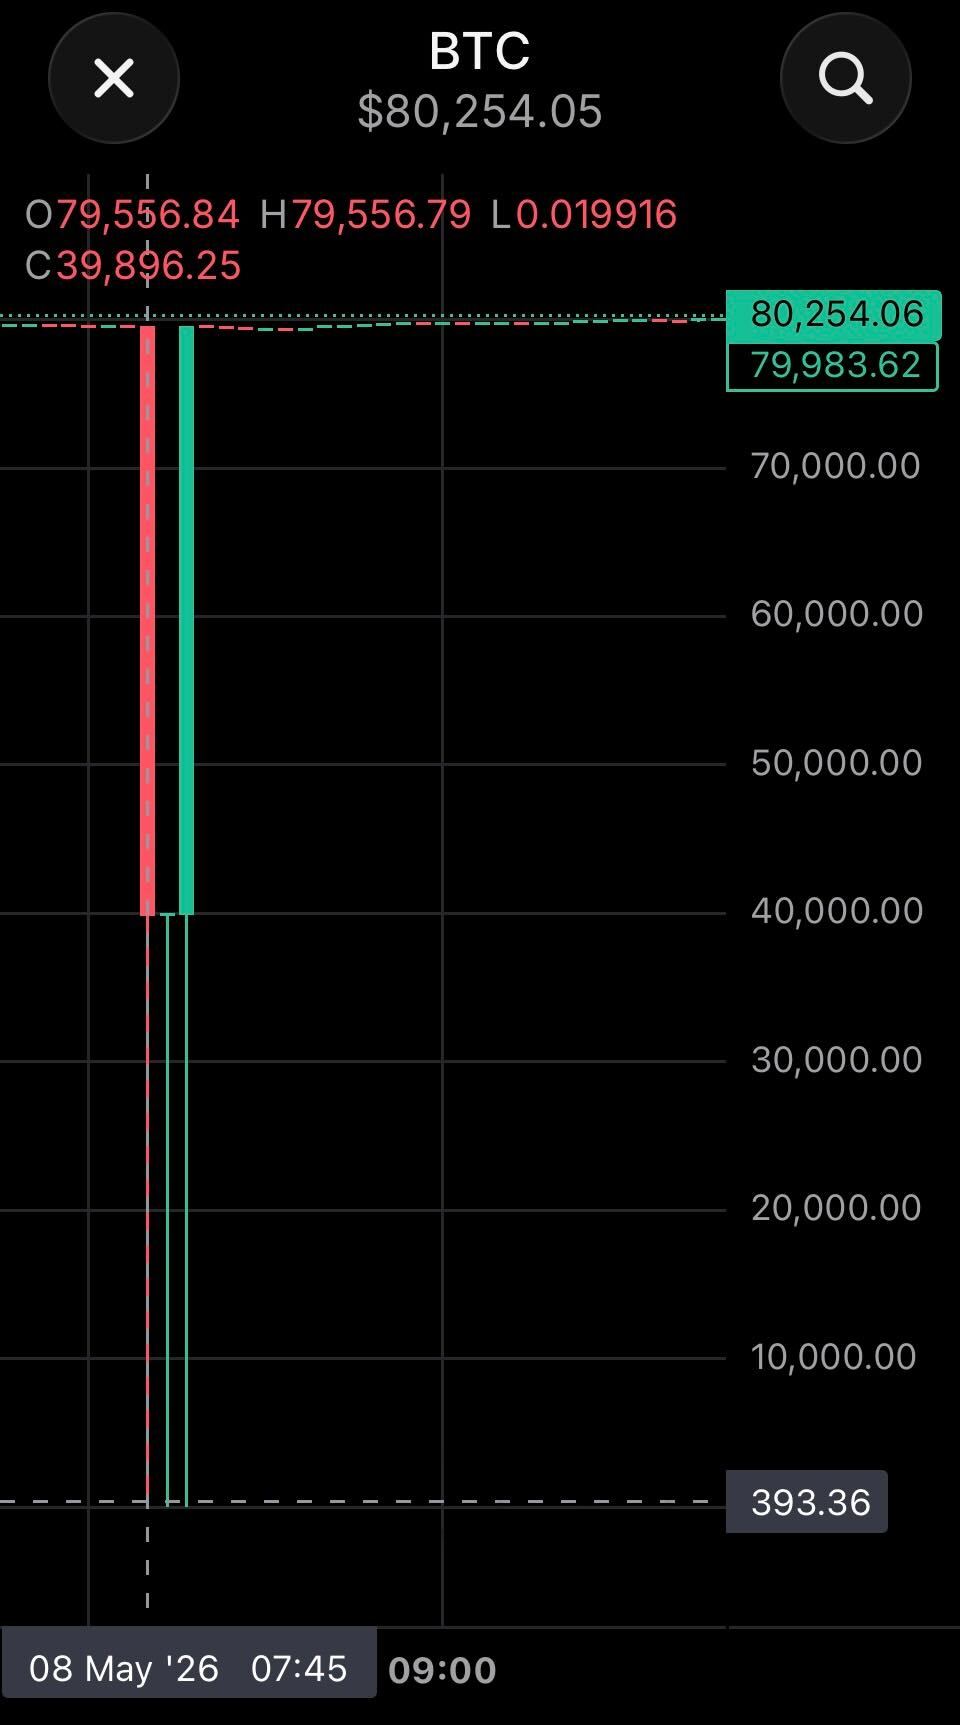
Screenshots circulating on social media showed Bitcoin candles dropping to as low as $0.019916 on Revolut’s in-app chart, with similar anomalies appearing for Solana (SOL), XRP, and several other tokens.
“For 3 seconds, I thought I was about to buy the entire supply and become Satoshi’s final boss. Then I remembered: it’s probably just a Revolut chart glitch. Crypto never sleeps. Neither do bugs,” one user remarked.
Some users received push alerts claiming BTC had hit a 52-week low. The disruption lasted only a few seconds for most affected accounts.
Follow us on X to get the latest news as it happens
CoinGecko and CoinMarketCap showed no matching price action on tracked exchanges, indicating the issue was confined to Revolut’s display layer rather than any underlying market move.
Revolut Confirms Bitcoin Price Glitch
Revolut Support said the company was experiencing technical issues affecting some crypto functionalities, and that engineers were actively investigating the root cause.
The fintech, which holds a MiCA license through Cyprus and serves more than 68 million customers across 40 markets, has not detailed what triggered the faulty data feed.
The flash on screens arrived during a softer trading day for Bitcoin, which almost slipped below $80,000 after a modest correction that triggered almost $300 million in futures liquidations.

No user reports have confirmed any orders filling at the displayed glitch price.
Affected European and global users say balances and pending orders went unaffected, though the episode renewed concerns about how centralized apps handle third-party price feeds during volatile sessions.
Revolut has continued expanding its crypto footprint, including stablecoin settlement on Polygon, even after delisting some altcoins last year.
The post Revolut Confirms Bitcoin Price Glitch After App Briefly Shows BTC Near Zero appeared first on BeInCrypto.

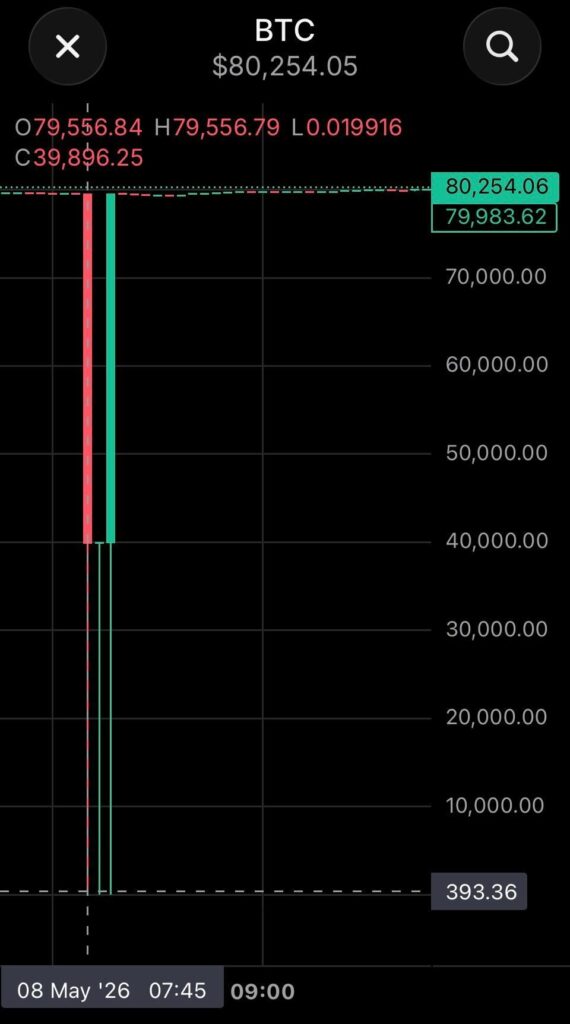
Bitcoin’s (BTC) briefly slipped from $79,000 to just $0.019 today on UK online banking platform Revolut. Mercifully, the dip lasted just a few seconds before it returned to its original price.
Using Google Chrome, Revolut displays the low between 7:45/50 GMT+1 as $73,000. However, the platform’s mobile app mobile displays the BTC drop as low as $0.019.
Revolut told Protos that the inaccurate pricing was caused by “a service disruption at a third-party provider.” It said the issue has since been solved and that it’s still “in the process of evaluating the details of the disruption.”
There was a flurry of confusion from onlookers on X this morning as they wondered whether or not a flash crash had taken place.
Many received a push notification from Revolut on their lock screens claiming that BTC had reached a 52-week low, and that the price was now $0.02. This would be closer to an all-time low.
Read more: Hot air at AWS causes Coinbase outage
All Revolut told users at the time through its support account is that it’s “currently experiencing technical issues affecting some crypto functionalities.”
However, it’s still unclear if this third-party disruption, leading to BTC’s brief cratering, was the result of a visual glitch or liquidity issues. Neither CoinGecko nor Coinbase are displaying such BTC crashes.
Visual glitches and flash crashes aren’t uncommon
Similar visual glitches aren’t uncommon in the crypto world. Binance, for example, displayed a glitch in people’s wallets last year that dropped everybody’s balance to $0.
This was caused by “network congestion,” which followed a $400 billion crash in the global crypto market just days beforehand.
In 2021, crypto exchange PDAX briefly listed BTC for $6,000, almost 90% cheaper than it was at the time. Users rushed to buy at the low price, and PDAX began suspending accounts.
The exchange then began to exchange legal threats with buyers. The listing in the end was a visual glitch.
Read more: Explained: How bitcoin market sell orders cause flash crashes
Other flash-crashes involved a sudden 10% BTC dip on South Korean crypto exchange Bithumb. The platform accidentally rewarded a user 2,000 BTC (worth $134 million at the time), who then sold it afterwards, causing the dip.
UK banks also experienced a weird visual glitch earlier this year that displayed the transactions and bank account details to random users.
People were reporting that they could see other people’s transactions, and the issue was widespread across Lloyds, Halifax, and the Bank of Scotland.
Got a tip? Send us an email securely via Protos Leaks. For more informed news and investigations, follow us on X, Bluesky, and Google News, or subscribe to our YouTube channel.
Toncoin (TON), Zcash (ZEC), and Venice Token (VVV) make up the top 3 altcoins flashing bullish daily structures this weekend. Each token enters Saturday with fresh breakouts on rising volume and clear paths toward the next major Fibonacci targets.
Each coin has cleared a critical resistance level over the past week. Supporting voices on X point to extended legs higher if current consolidations resolve in favor of buyers.
Toncoin (TON) Breaks Out Above $2.74 With Path to $3.10
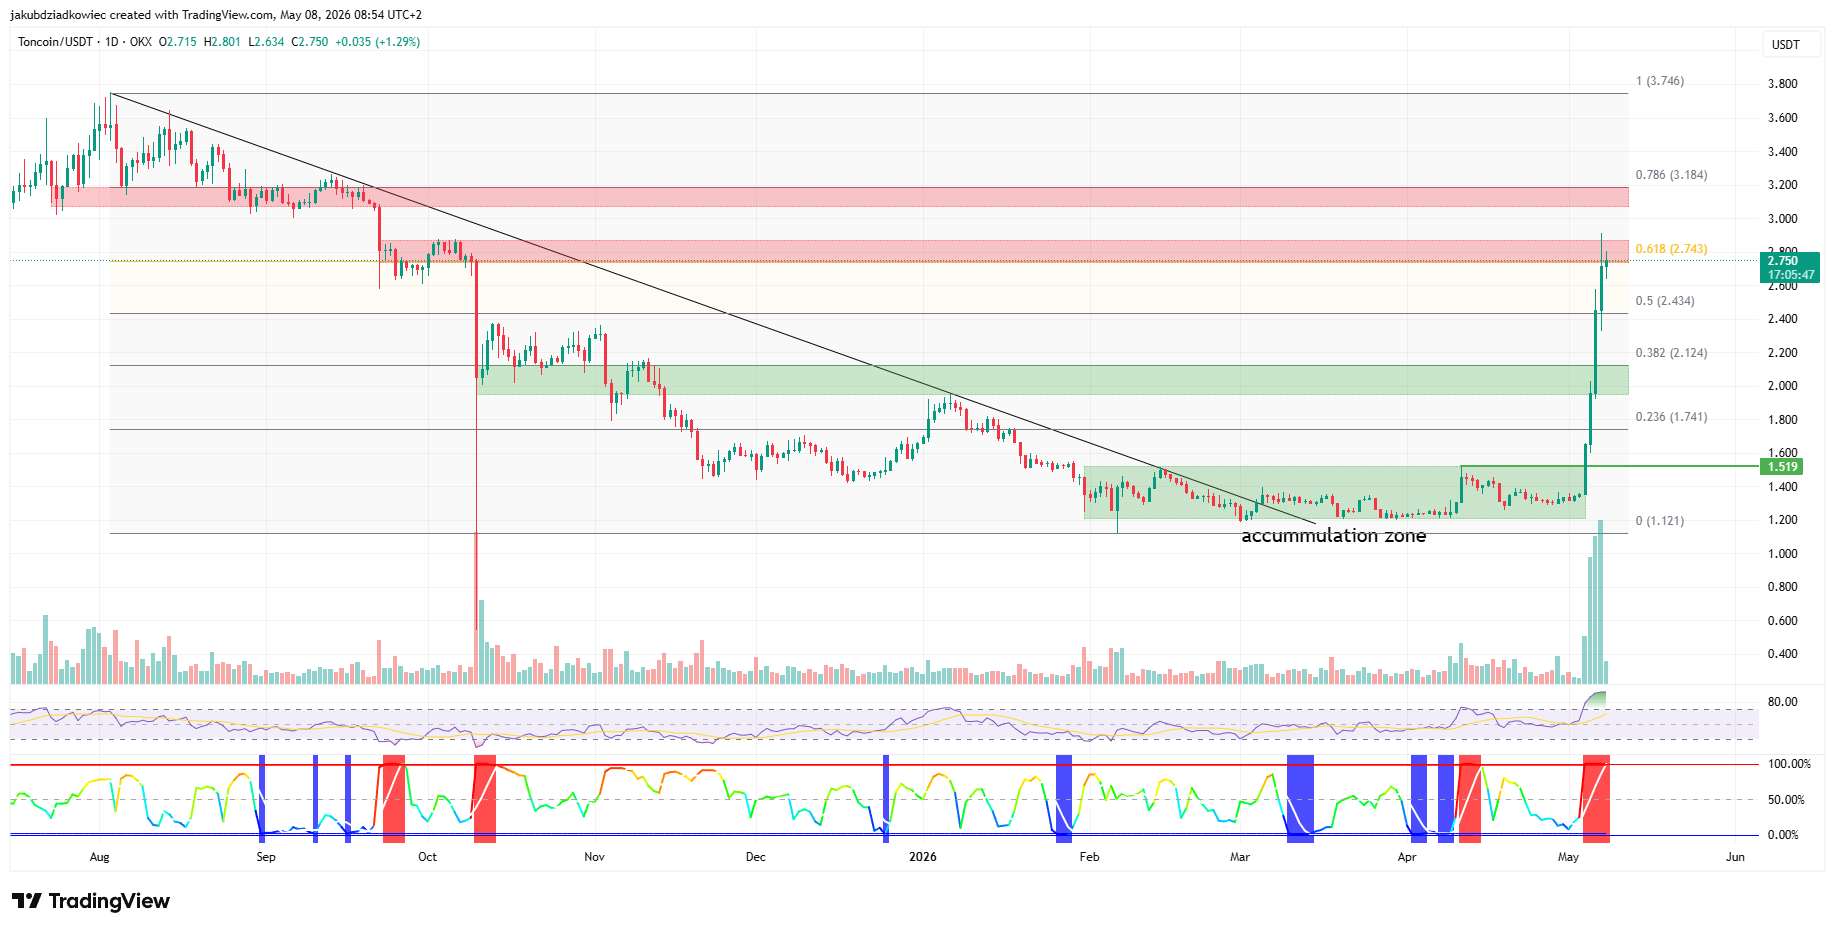
Toncoin (TON) has broken out from a multi-month accumulation zone on May 4. Daily volume on the breakout candle was the largest green print on the chart since October.
Buying volume has continued to expand every session since. Price now trades at the 0.618 Fibonacci retracement at $2.74. The level is drawn from the August 2025 high down to the April low at $1.12.
A daily close above this level opens the path to the 0.786 Fib at $3.10. In the event of a correction, the first major support sits at the 0.382 Fib near $2.12.
Momentum readings have pushed near 93. The Bollinger Band Width Percentile (BBWP) also flashes extreme red readings, signaling stretched conditions. However, no bearish divergence has formed yet, which keeps the immediate trend intact.

The breakout coincides with fresh enthusiasm around the network. Telegram founder Pavel Durov has outlined a roadmap that puts Telegram itself as the largest TON validator.
Trader Zach Humphries sees the move as the start of a textbook expansion phase. He argues that TON is now testing a distribution block at $2.89. A flip of that level into support would open a longer-term path to $6.
“The expansion phase on $TON is playing out exactly as scripted… If we flip this resistance into support the path to $6.00 is wide open for the summer.”

Zcash (ZEC) Breaks $533 Resistance With $628 Next on the Map
Zcash (ZEC) has trended higher since April 13, when the price bounced off the 0.236 Fib at $317. Two days ago, the privacy coin broke through the 0.618 Fib at $533. That level also coincided with the December 29 swing high (blue circle).
The next target sits at the 0.786 Fib near $628. On the downside, the 0.382 Fib at $400 marks the first meaningful support if buyers lose control. The Visible Range Volume Profile (VRVP) shows the last significant resistance node near $690, with thin volume above that pocket.
Momentum is stretched. The 14-day Relative Strength Index (RSI) prints 86, deep in overbought territory, while BBWP also signals extreme volatility expansion.

The breakout has coincided with a sharp burst of institutional interest. Multicoin Capital disclosed a significant ZEC position at Consensus Miami this week. ETF speculation has accelerated alongside a fresh Robinhood listing.
X analyst TheMoonShow shared an hourly chart showing a tight consolidation triangle that resolved to the upside above $580.
“$ZEC looks like it’s getting ready for ATHs. Consolidated after the breakout and now looks ready for another expansion move.”

Venice Token (VVV) Pushes to $13.96 With $17.30 Target
Venice Token (VVV) is the strongest performer of the three. The native token of the Venice AI ecosystem has reached a fresh 2026 high near $13.96. Price has trended higher since the breakout on February 13.
A Fibonacci retracement drawn from the February 13 low to the current swing high reveals two key support zones. The 0.618 Fib sits at $9.30, and the 0.382 Fib rests at $6.42.
Upside targets come from external Fibonacci extensions. The 1.272 extension lands at $17.30 and the 1.618 extension at $21.52.
The 14-day RSI sits at 80 and continues to trend up without any bearish divergence. Volatility, measured by BBWP, also remains in expansion mode.

A move into the $20 zone would sit between the 1.272 and 1.618 external Fib levels. Both extensions are mapped on the daily chart. For traders eyeing the VVV longer-term path, the same structure remains intact as long as $9.30 holds on any pullback.
Top 3 Altcoins Outlook for the Weekend
All three setups remain technically aligned for upside continuation, as long as their respective breakout levels hold. A close below $2.51 (TON), $400 (ZEC), or $9.30 (VVV) would invalidate the immediate thesis. Such a move would shift focus to deeper retracements.
The bullish case rests on momentum staying expanded through Saturday and Sunday. If buyers absorb supply at the current Fib levels, each chart points to an extended leg higher into next week.
The post Top 3 Altcoins Flashing Bullish Setups Heading Into the Weekend appeared first on BeInCrypto.

The CLARITY market structure bill in the United States could be marked up by the Senate Banking Committee as early as next week, according to Kara Calvert, the vice president of US policy at Coinbase. Speaking at the Consensus 2026 crypto industry conference in Miami, Calvert indicated that momentum is building toward a committee vote, but stressed that passage will require broad bipartisan support and a solid 60 votes in the Senate.
“My prediction is that we have a markup next week,” Calvert said at Consensus 2026. “That means you need Democrats. You need a bipartisan bill, and we have all been working really hard to make sure that bipartisanship holds. I think the big question is, how do these votes shape up over the next few days?”
“That means you need Democrats. You need a bipartisan bill, and we have all been working really hard to make sure that bipartisanship holds. I think the big question is, how do these votes shape up over the next few days?”
In context, a HarrisX poll released on Thursday underscored broad appetite for clear federal crypto rules. The survey found that 70% of voters believe the US should already have enacted clear cryptocurrency legislation, and 62% regard the US as pivotal in setting global rules for digital finance.
However, the path forward remains uncertain. The CLARITY bill previously stalled in January after Coinbase withdrew its support, citing concerns including insufficient protections for open-source software developers, a prohibition on stablecoin yield, and certain DeFi regulatory gaps. As Cointelegraph reported, these issues contributed to hesitation among industry participants about advancing the legislation without further refinements.
Related coverage notes that a broader political dynamic may influence timing. A separate report cited a US senator suggesting a vote on crypto market structure could occur by August, signaling ongoing legislative attention to the sector even as specific provisions remain contested.
A key takeaway highlighted by Calvert is that the tax framework surrounding crypto remains a central hurdle to institutional adoption. The prevailing view is that coherent tax policy is often more critical to mainstream participation than the exact contours of market structure legislation. Institutional actors seeking to acquire and hold digital assets face complex tax reporting burdens that add cost and compliance risk.
Tax reporting requirements under current regulations require crypto exchanges to document numerous transactions for IRS purposes, including small-value trades. Calvert described the process as an inefficient burden that undermines the attractiveness of crypto as an asset class for institutions. In this context, several lawmakers have advanced tax reform proposals aimed at simplifying treatment for digital assets, with the Digital Asset PARITY Act among the notable efforts under consideration.
Looking ahead, Calvert estimated that tax reform discussions could gain momentum in 2026, with potential action in both chambers in the coming months. She noted that while market structure legislation remains on the congressional radar, a robust tax policy framework could have a more decisive impact on institutional participation in crypto markets.
Key takeaways
- The CLARITY Market Structure Act could receive a markup in the Senate Banking Committee as early as next week, signaling renewed congressional attention.
- passage hinges on bipartisan support and securing 60 votes in the Senate, a threshold that requires cross-party collaboration.
- Public sentiment strongly favors clear federal crypto rules, with a majority of voters supporting expedited regulatory clarity and leadership in global digital finance norms.
- Past resistance centered on protections for open-source developers, DeFi regulation gaps, and restrictions on stablecoin yields; these concerns may shape ongoing negotiations.
- Tax policy remains a primary barrier to institutional adoption, with proposed reforms toward simplifying crypto taxation and reporting highlighted as critical to broader participation.
Legislative timing and bipartisan dynamics
The forthcoming markup reflects a broader strategy to finalize a coherent federal framework for crypto markets. Calvert’s view underscores the practical challenge: a bipartisan coalition is essential to pass controversial market safeguards that touch on exchanges, developers, and liquidity providers. The Senate’s willingness to engage on a comprehensive package, rather than piecemeal provisions, will likely influence not only the CLARITY bill’s fate but also the pace of related tax and regulatory proposals.
As observers weigh the political calculus, it is clear that the administration and lawmakers are intent on avoiding a regulatory gap that could jeopardize perceived global competitiveness. The balance between investor protection, innovation, and regulatory clarity remains at the center of the debate, with industry stakeholders monitoring committee schedules and drafting discussions closely.
Tax policy and institutional adoption barriers
Beyond market structure specifics, a coherent tax regime is viewed as a pivotal enabler or constraint for institutions. The current framework, which some describe as misaligned with the complexities of digital assets, imposes extensive reporting obligations that increase administrative costs and compliance risk for banks, custodians, and asset managers. Calvert pointed to the volume of 1099-DA-style reporting as an example of how tax rules can hamper efficient participation in crypto markets.
In parallel with package discussions, lawmakers have introduced tax-focused proposals aimed at providing parity and reducing unnecessary friction for legitimate crypto activities. The Digital Asset PARITY Act—among the measures cited by industry participants—illustrates congressional efforts to simplify tax treatment while preserving compliance controls. The ongoing debate over how best to align tax policy with evolving market realities is expected to shape both legislative posture and enforcement priorities in the near term.
From an enforcement perspective, the interplay between tax policy, regulatory oversight, and market structure is material for exchanges, banks, and institutions seeking reliable, lawful access to digital asset markets. Regulatory filings and policy papers indicate a move toward greater clarity on reporting standards, transfer of value, and custody requirements—areas that directly impact licensing, risk management, and internal governance for market participants.
On the regulatory horizon, the CLARITY debate unfolds within a broader ecosystem that includes discussions on stablecoins, DeFi governance, and the scope of permissible activities for non-custodial protocols. As policymakers weigh these elements, the potential for harmonization with international standards—while preserving US innovation and market integrity—remains a central objective.
Regulatory context and market implications
The ongoing debate around the CLARITY Act sits at the intersection of policy design and practical compliance needs. For exchanges and institutions, a clear federal framework can reduce legal uncertainty, facilitate licensing, and streamline cross-border operations. Conversely, if final legislation imposes stringent restrictions on stablecoin yields or imposes expansive DeFi regulations, firms may face higher compliance costs and strategic reconsiderations about product design and market participation.
Industry observers also note that regulatory alignment with federal rules would complement international efforts, including Europe’s MiCA framework, by providing a common baseline for compliance expectations and reporting standards. While MiCA addresses certain aspects of digital asset markets within the EU, the US approach continues to emphasize a combination of specific rules for tokens, platforms, and custodial services, with enforcement priorities determined by agencies such as the SEC, CFTC, and DOJ.
In this context, the poll results indicating broad demand for federal clarity acquire particular significance: if policymakers deliver a comprehensive, bipartisan package, institutions may accelerate due diligence, risk assessments, and governance updates to align with forthcoming requirements. Conversely, protracted negotiations or partial measures could maintain a level of regulatory uncertainty that complicates capital allocation and program design for large firms and financial intermediaries.
According to Cointelegraph, the regulatory debate remains active, with stakeholders watching for signs of how the next weeks’ markup and related tax discussions might translate into concrete policy outcomes. The evolving framework will influence licensing trajectories, reporting obligations, and the risk controls that underpin institutional participation in digital assets.
Closing perspective
The next steps in the CLARITY bill process will be closely watched by market participants, policymakers, and regulators alike. A markup in the near term would signal renewed congressional attention and set the stage for negotiations on a broader policy architecture that could shape institutional access to crypto markets for years to come. While much remains unresolved, the emphasis on bipartisan support and tax policy coherence will likely determine the trajectory of US crypto regulation in the near term.
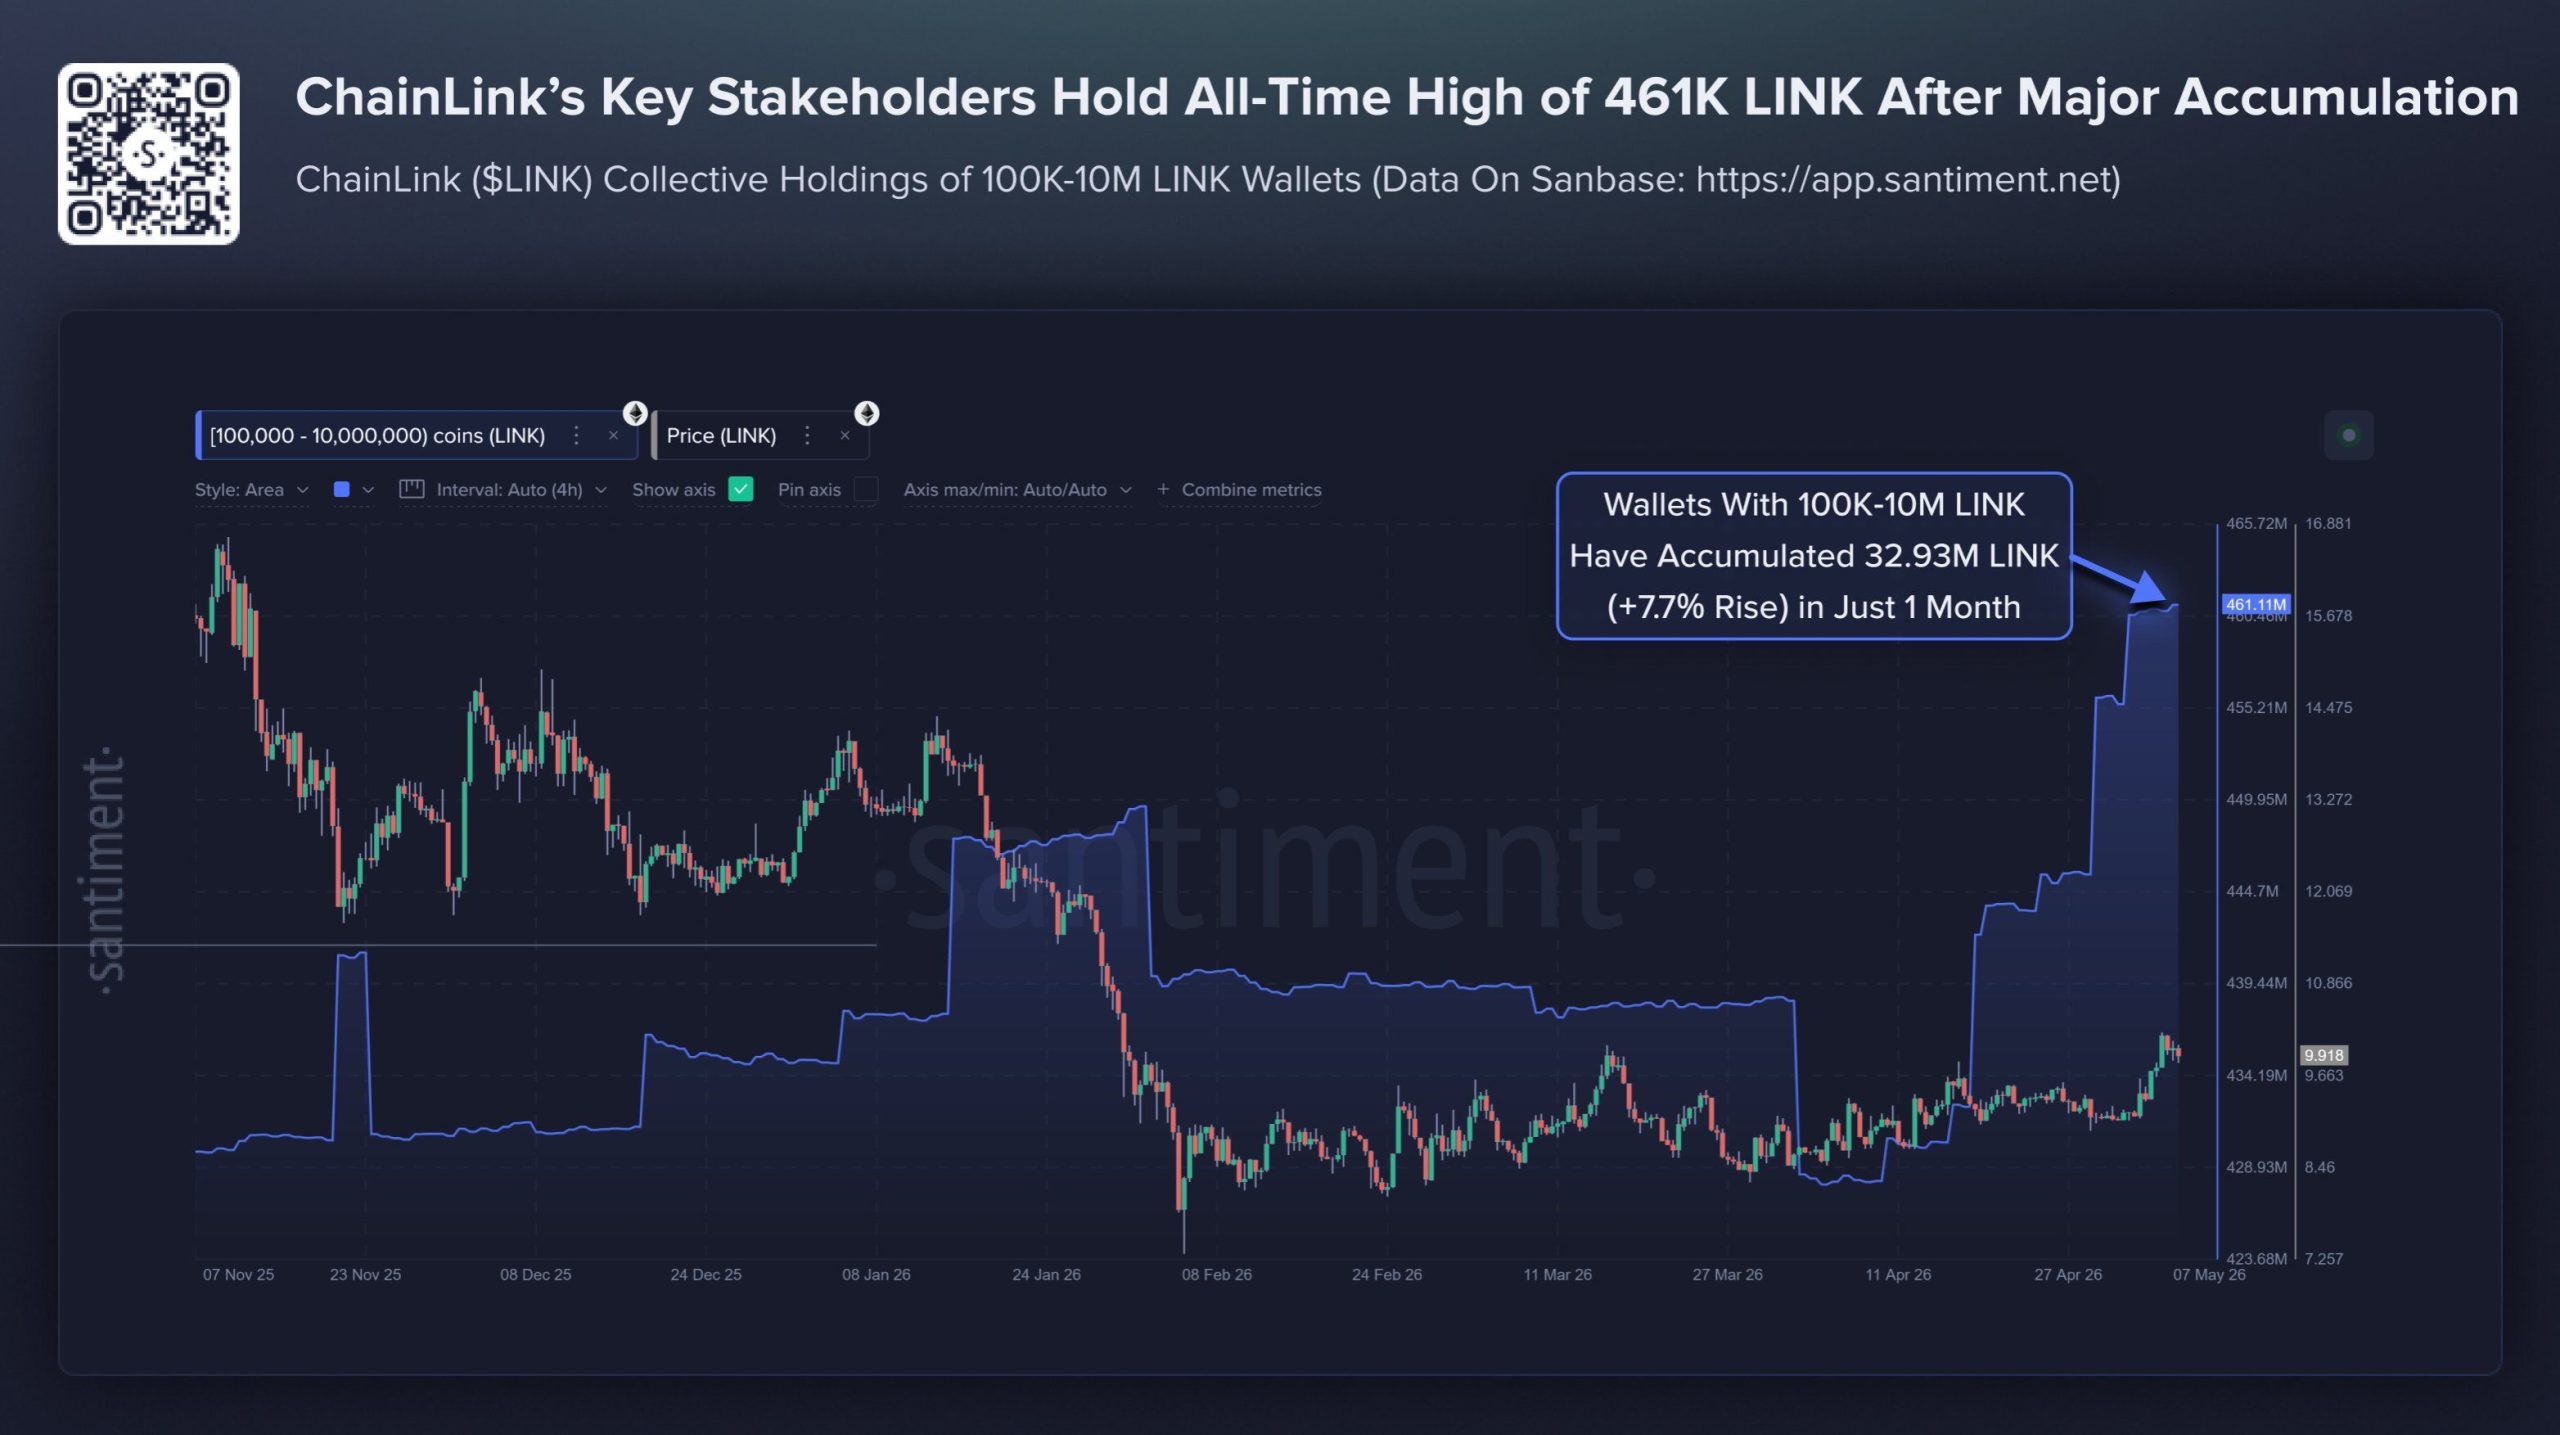
Chainlink (LINK) closes a multi-month accumulation phase as on-chain data shows whales adding 32.93 million tokens in 30 days. The setup positions LINK for a potential push toward $15.
LINK trades near $10 after a 1% pullback, with the daily chart breaking its August 2025 trendline. The four-hour structure still flashes caution after a midline rejection earlier this week.
Whales Stack 32.93 Million LINK in 30 Days
Santiment data shows wallets holding 100,000 to 10 million LINK absorbed 32.93 million coins in one month. That marks a 7.7% rise in 30 days. Collective holdings from this cohort now sit at an all-time high above 461 million LINK across roughly 461,000 wallets.
This tier matters because it sits between retail traders and exchange-controlled custodial accounts. These addresses move meaningful capital but stay non-custodial, making their behavior a cleaner read on conviction. Santiment wrote:
“Historically, when this specific tier accumulates aggressively, it tends to precede rather than react to price appreciation.”
The pattern lines up with the chart. Absorption happened through Q1 2026 while LINK traded sideways near multi-month lows. Reduced exchange supply now sets up what Santiment frames as an early-stage supply squeeze. The setup gains weight if Bitcoin (BTC) sustains its bid.

Chainlink Price Prediction Eyes $15 if $9.40 Holds
The daily chart paints a constructive picture that aligns with the on-chain signal. Chainlink broke its descending trendline drawn from the $28 high on August 22, 2025. The breakout occurred on March 15 and was retested cleanly on March 22 (blue circle).
The Visible Range Volume Profile (VRVP) places the heaviest volume support near $9.40. That zone is now acting as the base. Above the current price, the next significant volume blocks line up near $15 and $17.52.

The first measured target sits at the 0.382 Fibonacci retracement near $15.08. That marks a roughly 50% move from current levels. The next confluence sits at the 0.5 Fibonacci near $17.52, with $19.96 as a stretch target at the 0.618 Fibonacci.
The thesis is reinforced by daily RSI, which has bounced off a descending trendline drawn from July 2025. That trendline acted as resistance throughout 2026 and turned into support in early May. The shift pushed RSI back into bullish territory and printed a higher high.

A daily close below $9.40 would invalidate the bullish setup and reopen the prior consolidation range. With the broader BTC trend holding, whale accumulation combines with broken downtrends to keep LINK biased higher into the volume zones above.
Four-Hour Structure Flashes Near-Term Caution
The on-chain conviction does not translate into immediate momentum on lower timeframes. LINK has been trading inside an ascending parallel channel since February 6, showing a clear behavioral shift mid-stream.
During the first half of that span, price rode the upper portion of the channel. The upper band acted as resistance, and the midline as support. After March 26, that dynamic flipped. LINK started to trade in the lower half.
The midline now acts as resistance, and the lower band as support.

On May 6, the four-hour candle was rejected from the channel midline near $10.40. The price now struggles to confirm prior resistance at $10 as new support. MACD on the four-hour chart points to continued downside pressure.
If sellers extend the rejection, the lower band of the channel sits near $9.30. A reclaim of the midline opens the way to the upper band at $11.46. Sustained acceptance over $10 turns this near-term structure constructive again and aligns the lower timeframe with the daily breakout.
The post Chainlink Whales Add 32.93 Million LINK as Price Targets $15 Breakout appeared first on BeInCrypto.

Key Takeaways
- Daiwa Securities shifted Qualcomm’s rating from Neutral to Outperform, establishing a $225 price objective
- Shares of QCOM climbed 6% during Friday’s session after rising 5.6% pre-market from Thursday’s $202.50 close
- The chipmaker’s stock has surged more than 60% over the last month
- Second-quarter earnings showed EPS of $2.65, topping the $2.56 forecast, though revenue declined 3.5% annually
- Management authorized a $20 billion buyback program; average analyst target stands at $176.54 with a Hold consensus
Shares of Qualcomm experienced a significant 6% surge during Friday’s trading session following an upgrade from Daiwa Securities, which moved the semiconductor company from Neutral to Outperform. The firm established a $225 price objective, suggesting approximately 11% potential appreciation from present trading levels.
After settling at $202.50 on Thursday, the stock showed strength in pre-market activity with a 5.6% advance. The past month has been particularly rewarding for shareholders, with QCOM delivering gains exceeding 60%.
Louis Miscioscia, the Daiwa analyst behind the upgrade, highlighted Qualcomm’s promising revenue expansion trajectory and what he characterized as reasonable current valuation levels.
His research note posed whether the company might become the next chip sector player to experience a price-to-earnings multiple expansion, drawing parallels to Arm Holdings’ recent valuation reassessment.
Miscioscia identified an approaching investor presentation as an important near-term catalyst, where executive leadership is anticipated to detail strategic initiatives in data center processors, physical computing solutions, and edge artificial intelligence applications.
Second Quarter Results: Performance Analysis
The company delivered second-quarter earnings of $2.65 per share, surpassing Wall Street’s $2.56 projection by nine cents. Total revenue reached $10.60 billion, meeting analyst forecasts.
Year-over-year comparisons showed a 3.5% revenue contraction from the prior year period, when the company posted $2.85 per share. Forward guidance for the third quarter called for earnings between $2.10 and $2.30 per share, missing analyst expectations.
Despite the conservative near-term outlook, Miscioscia emphasized that investors should prioritize Qualcomm’s long-range growth opportunities over quarterly fluctuations.
The board of directors greenlit a substantial $20 billion stock repurchase authorization in March, representing approximately 14.5% of shares outstanding.
Analyst Community Remains Split
The broader investment community hasn’t fully embraced the bullish thesis. Wall Street’s aggregate rating on QCOM sits at Hold, with a consensus price objective of $176.54 — substantially beneath current trading levels.
Bank of America maintains an Underperform stance with a $145 target. Morgan Stanley holds an Underweight view at $146. Susquehanna assigns a Neutral rating at $160.
Conversely, TD Cowen elevated its price objective to $200 with a Buy recommendation on April 30th. The analyst community breaks down to nine Buy ratings, sixteen Hold recommendations, and three Sell opinions.
Technical indicators also present a complex picture, with overbought conditions emerging as a potential headwind following the explosive 30-day rally.
Compounding cautious sentiment, Chief Executive Officer Cristiano Amon divested 10,000 shares on May 4th at an average execution price of $180.00, generating proceeds of $1.8 million. The transaction occurred under a predetermined Rule 10b5-1 trading arrangement.
Executive Vice President Heather Ace similarly sold 3,200 shares at $177.82 on the identical date. Corporate insiders have collectively disposed of 19,177 shares worth approximately $3.18 million during the trailing 90-day period.
Qualcomm carries a market capitalization of $213.70 billion, trades at a price-to-earnings multiple of 22.04, and exhibits a beta coefficient of 1.49. The 50-day moving average registers at $138.77, considerably below the present share price.
The stock’s 52-week trading band extends from $121.99 to $223.66, indicating current prices hover near the upper boundary of the annual range.

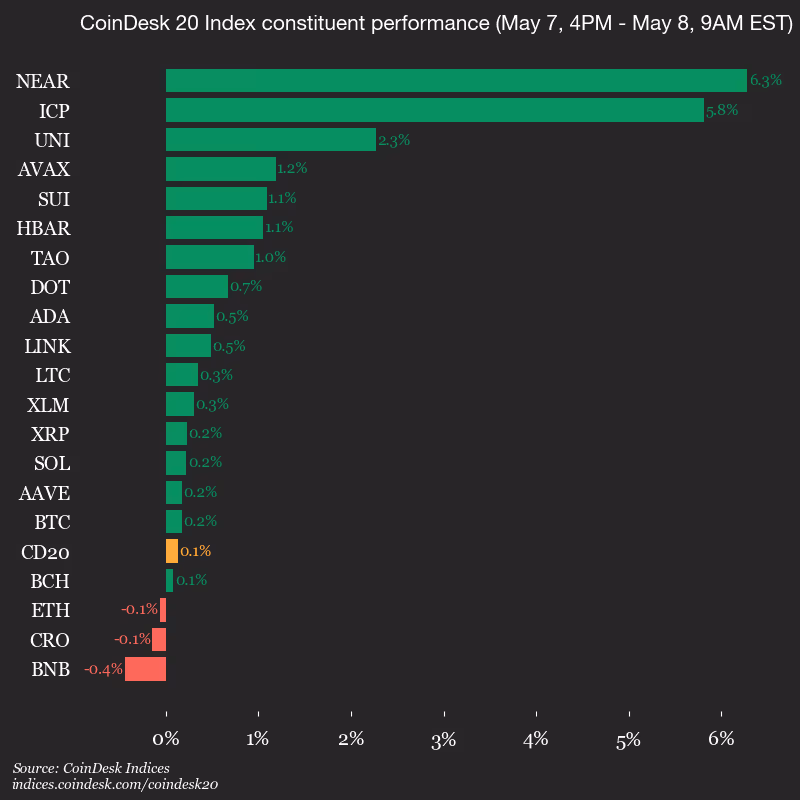
CoinDesk Indices presents its daily market update, highlighting the performance of leaders and laggards in the CoinDesk 20 Index.
The CoinDesk 20 is currently trading at 2142.44, up 0.1% (+2.73) since 4 p.m. ET on Thursday.
Seventeen of 20 assets are trading higher.

Leaders: NEAR (+6.3%) and ICP (+5.8%).
Laggards: BNB (-0.4%) and CRO (-0.1%).
The CoinDesk 20 is a broad-based index traded on multiple platforms in several regions globally.
Crypto World
Bitcoin Price Prediction: Bitcoin Falls to $79.6k as US-Iran Escalation Dents Risk Set for 6th Weekly Gain

Bitcoin price slid to $79,679 Friday as US military strikes against Iranian vessels in the Strait of Hormuz triggered a broad risk-off prediction, yet the world’s largest crypto remains on track for a sixth consecutive weekly gain.
The 1.7% intraday drop looks alarming on the surface, but the weekly chart tells a quieter story. What happens at the weekend close could define whether BTC reclaims $85,000 or gives back the entire week’s advance.
The immediate catalyst: US forces struck back against Iran following attacks on three American warships transiting Hormuz, reigniting a geopolitical flashpoint that markets had largely priced out.
Compounding the pressure, Strategy Inc (NASDAQ: MSTR), the largest corporate Bitcoin holder, signaled it could sell portions of its holdings to fund dividend payments, though the scope and timing remain unspecified.
Despite the intraday weakness, BTC is still up approximately 3% on the week. The macro backdrop, institutional accumulation, improving US regulatory clarity, and residual post-ATH consolidation, remain broadly constructive heading into the weekend session.
Discover: The best crypto to diversify your portfolio with
Bitcoin Price Prediction: Can BTC Price Reclaim $85,000 Before the Weekly Close?
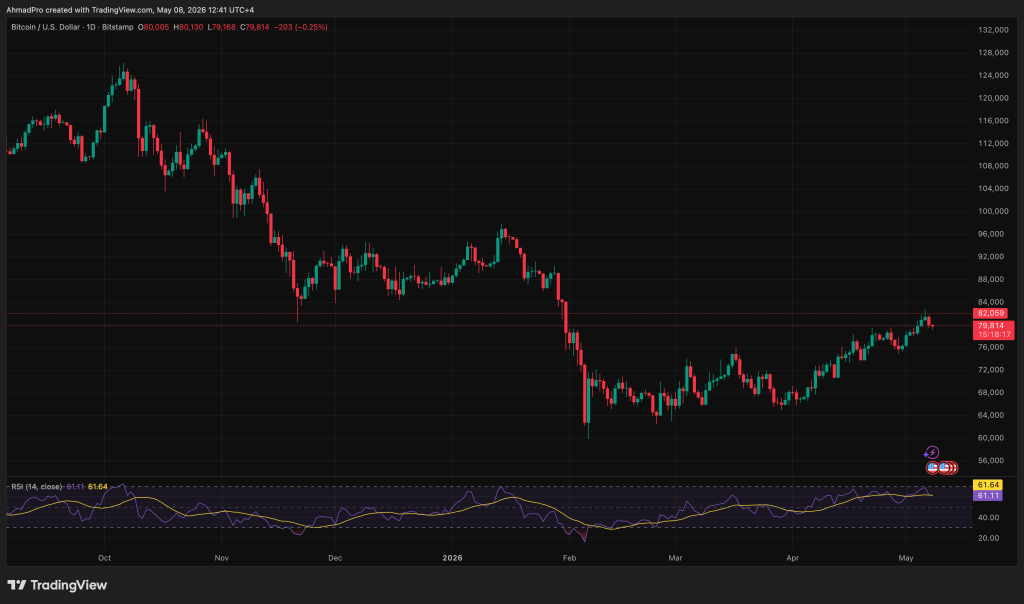
Bitcoin is trading in one of the most important structural zones of this cycle, hovering around $80K while pressure builds between key support and resistance.
The broader setup remains constructive, but only as long as $79K continues holding as the primary daily support floor. That level is doing the heavy lifting right now.
As long as buyers defend it, the post-correction recovery remains intact, with $83K–$85K still functioning as the major upside target and mean reversion zone after October’s sharp pullback.
On-chain data continues to show accumulation rather than broad distribution, which suggests larger players are still absorbing supply at current levels instead of exiting positions.
Resistance overhead remains significant, and Bitcoin needs a decisive break above that $83K–$85K region before any larger breakout narrative gains real credibility.
Until then, the market is essentially coiling. If BTC maintains this structure, the path toward stronger continuation remains open, but a breakdown below $75K would materially weaken the setup and shift focus toward the $69K long-term trendline as the next serious support zone.
Volume conditions also matter here, especially with thinner weekend liquidity increasing the probability of exaggerated moves in either direction.
The honest reality is that Bitcoin still looks structurally stronger than weaker, but this is a conditional setup where support must hold.
Discover: The best pre-launch token sales
The post Bitcoin Price Prediction: Bitcoin Falls to $79.6k as US-Iran Escalation Dents Risk Set for 6th Weekly Gain appeared first on Cryptonews.
Crypto World
XRP Price Could Start Another Rally: $7 Trillion Bank Announces Its Ripple Coin Investment
XRP price might be falling under its $1.40 support, but UBS, a Swiss banking giant managing $7 trillion in assets, has disclosed XRP exposure via a 13F filing with the SEC. The full scope of that filing reveals exactly which instruments the bank used, and why that distinction matters for price structure.
The bank accumulated 197,369 shares in the Volatility Shares XRP ETF and 317 shares in the Grayscale XRP Trust. Meanwhile, U.S.-listed spot XRP ETFs have drawn over $1.3 billion in cumulative inflows in their first 50 days, with 29 consecutive days of positive flows and a single-day peak of $13.59 million.
To put this into perspective, XRP’s exchange balances are simultaneously sitting at six-year lows, compressing available supply just as demand accelerates.
Discover: The best crypto to diversify your portfolio with
XRP Price Could Finally Have Its Awaited Rally
XRP broke out of a multi-week range earlier this week. This has preceded continuation, but instead, it had a short-term rejection. RSI sits at just under 50, after nudging the overbought threshold days ago.
Immediate support, for now, rests at the current price and the 50-period SMA. On a bullish note, a Technical analysis based on a Wyckoff reaccumulation breakout is targeting the $2.60–$2.70 zone, with an interim supply clustered at $2.15–$2.16.
To resume its rally, XRP needs to hold above $1.35, to then clear $$1.50 resistance, and ride institutional inflows toward $2.60–$2.70. Standard Chartered maintains an $8 price target on regulatory clarity.
However, a close below $1.35 would neutralize the current breakout thesis and expose the $1.20 support zone.
Institutional catalysts, including major ETF inflows and bank disclosures, have historically acted as short-term price accelerants for XRP.
Discover: The best pre-launch token sales
LiquidChain Does What XRP Can Only Dream
XRP’s institutional wave is real, but at the current price point, the asymmetric upside has compressed. Traders hunting for early-stage exposure before institutional re-rating are rotating attention toward infrastructure presales, where price discovery hasn’t yet occurred.
LiquidChain ($LIQUID) is a Layer 3 infrastructure project positioning as the cross-chain liquidity layer. It fuses Bitcoin, Ethereum, and Solana liquidity into a single execution environment.
With the 3 United, anything is possible. ⟁ — LiquidChain (@getliquidchain) May 8, 2026
 https://t.co/vqvBcdSQYC pic.twitter.com/50vrM4WX6v
Liquid’s architecture centers on a Unified Liquidity Layer with Single-Step Execution, Verifiable Settlement, and a Deploy-Once structure that lets developers access all three ecosystems without redeployment overhead.
The presale price is currently $0.01457, with more than $700K raised to date. The project is approaching the $750,000 milestone, a threshold that has historically drawn secondary attention from retail aggregators.
Readers researching cross-chain infrastructure exposure at this stage can explore LiquidChain’s presale details here.
The post XRP Price Could Start Another Rally: $7 Trillion Bank Announces Its Ripple Coin Investment appeared first on Cryptonews.


Ether extended a retreat after failing to break above a key resistance zone, with ETH slipping to around $2,275 before attempting to stabilize. The move comes as a cluster of on-chain and market indicators point to softer near-term demand for Ethereum, potentially paving the way for further downside toward the $2,000 level and beyond.
Key takeaways
- On-chain activity is cooling: weekly average transactions declined about 10% to 4.79 million, while active addresses slipped 8% to 2.5 million, accompanied by a roughly 27% drop in network fees and a 47% fall in on-chain revenue over the past week.
- US-driven selling pressure persists: the Ethereum Coinbase Premium has remained negative since late April, signaling downside emphasis from US traders, alongside outflows from U.S. spot Ethereum ETFs totaling about $103 million and roughly $81.6 million pulled from global Ethereum investment products last week.
- Unstaking and liquidity exits accelerate: the Ethereum exit queue surged about 72,000% to 530,985 ETH by May 2, with more than 202,000 ETH queued for redemption by the latest update and an average wait of about three days. Total staked ETH stood at 38.6 million (31.72% of supply), despite a 45-day withdrawal lag.
- DeFi activity and TVL retreat: DefiLlama data show weekly DEX volumes dropping to $1.64 billion on May 8, a 46% decline over three weeks, while Ethereum’s DeFi TVL fell to about $124.7 billion, a level last seen in May 2025.
- Price pattern points to further downside risk: a rising wedge pattern on ETH/USD underpins a potential breakdown, with major support around $2,150–$2,200 and a pivotal threshold near $2,000. A break below $2,000 could target roughly $1,830, with scenarios suggesting $1,750–$1,850 if $2,300 support isn’t reclaimed.
Deteriorating on-chain fundamentals
Ethereum’s network activity has cooled in recent weeks as a measure of on-chain demand softens. Data from Nansen show the weekly average number of transactions dipping to 4.79 million, a 10% reduction from the prior period, while active addresses declined to about 2.5 million, an 8% drop. The ebbing activity coincides with lower fee revenue, as network fees fell roughly 27% over the past seven days, contributing to a 47% shrinkage in on-chain revenue during that span.
Analysts interpret these metrics as signaling weaker user conviction and diminished organic demand for ETH, which can complicate attempts to sustain upside momentum despite broader macro optimism. In parallel, DefiLlama’s weekly snapshot shows a sharp pullback in DeFi activity, with weekly DEX volumes sliding to $1.64 billion on May 8 — a 46% drop over three weeks — and Ether-based DeFi TVL sliding to about $124.7 billion, a level not seen since May 2025.
Liquidity drains and the staking exit queue
One of the more striking recent developments is the surge in the unstaking queue. By May 2, Ethereum’s exit queue had exploded to 530,985 ETH, up roughly 72,000% from the previous pace. By the latest readings, more than 202,000 ETH were queued for redemption, with an expected wait time of around three days. This wave of liquidity outflows has come alongside elevated risk sentiment in DeFi following a spate of hacks and attacks earlier in the year.
In April 2026, DeFi platforms suffered about $625 million in losses across 30 separate incidents, highlighted by the $292 million KelpDAO bridge exploit and a broader trend of deposits fleeing platforms like Aave — moves that intensified the perceived need for liquidity and liquidity preferences among investors. Analyst Pete, writing on X, summarized the risk atmosphere: “DeFi yield on Ethereum is getting crushed by hacks, exploits and increasingly nasty attack surfaces.”
Even as the exit queue surged, the stake base remained sizable. About 3.6 million ETH were queued for staking entry, keeping total staked ETH near 38.6 million and representing roughly 31.72% of circulating supply, despite an ongoing, roughly 45-day wait for stake withdrawal or redemption in many cases.
US flows, ETF dynamics and price follow-through
The near-term price trajectory is being shaped in part by ongoing dissemination of US-centric trading flows. The Ethereum Coinbase Premium Index has stayed negative since late April, implying that US buyers and sellers are driving price disparities relative to other markets. In tandem, spot Ethereum ETF activity reflected continued selling pressure: US-listed Ethereum ETFs logged $103 million in net outflows on a single session, marking the largest withdrawal since mid-March. Across global Ethereum investment products, outflows exceeded $81.6 million last week, underscoring a broader institutional tilt toward liquidity and risk reduction during the period.
On the market microstructure side, taker buy volume for ETH on Binance has dipped into negative territory, with figures as low as -$25 million in recent sessions, indicating a rise in aggressive market sell orders and a potential setup for near-term volatility and a retest of support levels, according to CryptoQuant commentary.
Technical setup: rising wedge and downside risk filters
From a chart perspective, ETH/USD has been trading inside a rising wedge that broke below its lower boundary near $2,300. The immediate hurdle remains at around $2,150–$2,200, where the 100-day and 50-week moving averages cluster, followed by a psychological test near $2,000. A decisive move below this threshold would open a path toward the measured wedge target near $1,830, with some analyses flagging a potential drop to the $1,750–$1,850 zone if the $2,300 level is not reclaimed promptly.
These dynamics align with recent coverage suggesting that a sustained move below critical supports could lead to a prolonged downside phase, even as headlines around DeFi security and ETF flows continue to influence price behavior in the short run. For traders watching the chart, the setup underscores the importance of monitoring both on-chain activity and macro liquidity signals in concert with price action.
Looking ahead, investors should watch how ETH behaves around the $2,000 mark, as well as the flow data from US and global Ethereum products. Ongoing security incidents in DeFi and shifting ETF allocations will likely continue to shape near-term sentiment, even as the broader crypto market narratives evolve.
This article was originally published as Four signs indicate Ethereum’s $2.4K rally is exhausted on Crypto Breaking News – your trusted source for crypto news, Bitcoin news, and blockchain updates.

Key Takeaways
- Anthropic is pursuing funding that would establish a pre-money valuation near $900 billion
- The AI company seeks to secure up to $50 billion to boost its computing capabilities
- Annual revenue projections show the company reaching beyond $45 billion soon, jumping from $9 billion in late 2024
- Major investors like Dragoneer, General Catalyst, and Lightspeed are reportedly interested
- If finalized, this funding would position Anthropic above OpenAI in market valuation
The AI firm Anthropic, creator of the Claude suite of artificial intelligence tools, is currently negotiating a fundraising effort that could bring in as much as $50 billion, the Financial Times reports. Sources indicate the company could achieve a valuation approaching $900 billion on a pre-money basis.
Should this valuation materialize, Anthropic would eclipse its competitor OpenAI in terms of market worth. Industry sources cited by the FT suggest the funding round could reach completion in the next two months.
The company’s valuation stood at $380 billion just months ago in February 2026. A leap to nearly $1 trillion would represent one of the most dramatic valuation accelerations in private technology sector history.
Annualized revenue figures for Anthropic are projected to exceed $45 billion in the near term. This represents a fivefold increase from the $9 billion figure recorded at year-end 2024.
According to the FT’s sources, investment firms including Dragoneer Investment Group, General Catalyst, and Lightspeed Venture Partners have expressed interest in participating in the funding round.
Major Tech Giants Already Invested Billions
Anthropic has previously attracted substantial financial backing from leading technology corporations. Google pledged as much as $40 billion at a $350 billion valuation, structured with $10 billion in immediate funding and an additional $30 billion contingent on hitting specific performance targets.
Amazon put $5 billion into the company with provisions allowing for up to $20 billion in additional investment. These arrangements were both negotiated at the $350 billion valuation established during February’s funding activity.
The new capital injection is earmarked for scaling up computational resources. Strong customer demand for Anthropic’s offerings has accelerated, and company representatives have indicated that supply limitations are currently constraining output capacity.
Strategic partnerships with Amazon Web Services, Google, and Broadcom have been established to guarantee sustained access to computing resources over the long term.
Claude Code and Cowork Fueling Revenue Surge
A significant portion of the demand surge stems from Claude Code, Anthropic’s specialized AI assistant engineered to accelerate software development workflows. Bloomberg’s reporting suggests this product’s explosive growth prompted the company to pursue additional funding on an accelerated timeline.
The company’s Cowork AI agent, targeted at professionals in non-technical departments, has similarly experienced rapid market uptake, company statements indicate.
Founded in 2021 by Dario Amodei alongside former OpenAI team members, Anthropic has emerged as one of the artificial intelligence industry’s most scrutinized players.
The ongoing fundraising discussions underscore the remarkable velocity at which investor interest in AI infrastructure has intensified. Anthropic is positioning itself to capitalize on this momentum through what could become one of the largest private capital raises ever recorded.
This potential funding round arrives as Anthropic continues building out partnerships with cloud computing providers to guarantee sufficient processing power for operating its sophisticated AI models.

Keebler adds to Chips Deluxe cookie lineup

Bitcoin dropped to $0.019 on Revolut today

Justin Baldoni Lawyer Reacts to Blake Lively Seeking Damages
Manchester United reach agreement with Casemiro over contract clause amid transfer speculation

US brings back mandatory military draft registration

Steven Gerrard disagrees with Gary Neville over ‘shock’ Chelsea and Arsenal claim | Football


-

 NewsBeat5 days ago
Channel 5 – All Creatures Great and Small series 7 new post
-
 Crypto World5 hours ago
HarrisX Poll Found 52% of Registered Voters Support the CLARITY Act
-

 Crypto World1 day ago
Upbit adds B3 Korean won pair as Base token gains Korea access
-
 NewsBeat1 day ago
NCP car park operator enters administration putting 340 UK sites at risk of closure
-
 Tech7 days ago
Trump’s 25% EU auto tariff breaches Turnberry Agreement that also covers semiconductors and digital trade
-
 Sports7 days ago
Paul Scholes issues Marcus Rashford reality check as agreement emerges over Man United star
-

 Tech4 days ago
Image AI models now drive app growth, beating chatbot upgrades
-

 Entertainment7 days ago
Met Gala 2026 Rumored Guest List Is Turning Heads
-
Entertainment7 days ago
New on Prime Video in May 2026 — Full List of Movies and Shows
-

 Entertainment7 days ago
Kylie Jenner Hit With Second Lawsuit From Ex-Housekeeper
-

 Sports7 days ago
Cavaliers vs. Raptors Game 6 live score, updates, highlights from 2026 NBA playoffs first-round series
-

 Entertainment5 days ago
Melissa Joan Hart and More Stars Attend 2026 Kentucky Derby
-
 Sports7 days ago
David Benavidez responds to team Canelo saying the fight will never happen
-
Entertainment6 days ago
New Netflix Movies in May 2026 — My Top 3 Picks to Stream
-
 Sports7 days ago
IPL 2026: ‘Love you darling’- Hardik Pandya’s reaction to MS Dhoni steals the show |Watch | Cricket News
-

 Entertainment7 days ago
Young and the Restless Next Week: Cane Arrested & Matt’s Deadly New Scheme!
-

 Tech7 days ago
Mother’s Day 2026 Gift Guide: Audio to Upgrade Mom’s Lifestyle
-
Crypto World6 days ago
Pi Network Mandates Protocol 23 Upgrade for All Mainnet Nodes Before May 15 Deadline
-

 Business5 days ago
Luka Doncic Injury Update: Doncic’s Hamstring Recovery Slows Lakers’ Hopes Against Thunder: Can He Run Yet?
-

 Business7 days ago
Can Victor Wembanyama Bring the NBA Ring to Spurs in 2026? Historic Playoff Run Fuels Title Dreams
You must be logged in to post a comment Login