

Crypto World
MSTR Stock Price Could Dip 40% Despite New Bitcoin Buy?
The MicroStrategy stock started the post-President’s Day session on a weak note. MSTR closed nearly 4% lower compared to its Feb. 13 (last Friday’s) close, reflecting renewed selling pressure despite positive corporate news.
This decline comes even after Strategy, previously MicroStrategy, added more Bitcoin, lowering its average purchase cost. However, charts now show that this latest BTC average drop didn’t mean much for the immediate fate of the MSTR. A much larger downside risk is forming beneath the surface.
Sponsored
Sponsored
MicroStrategy’s Latest Bitcoin Buy Lowers Average Cost Only Slightly
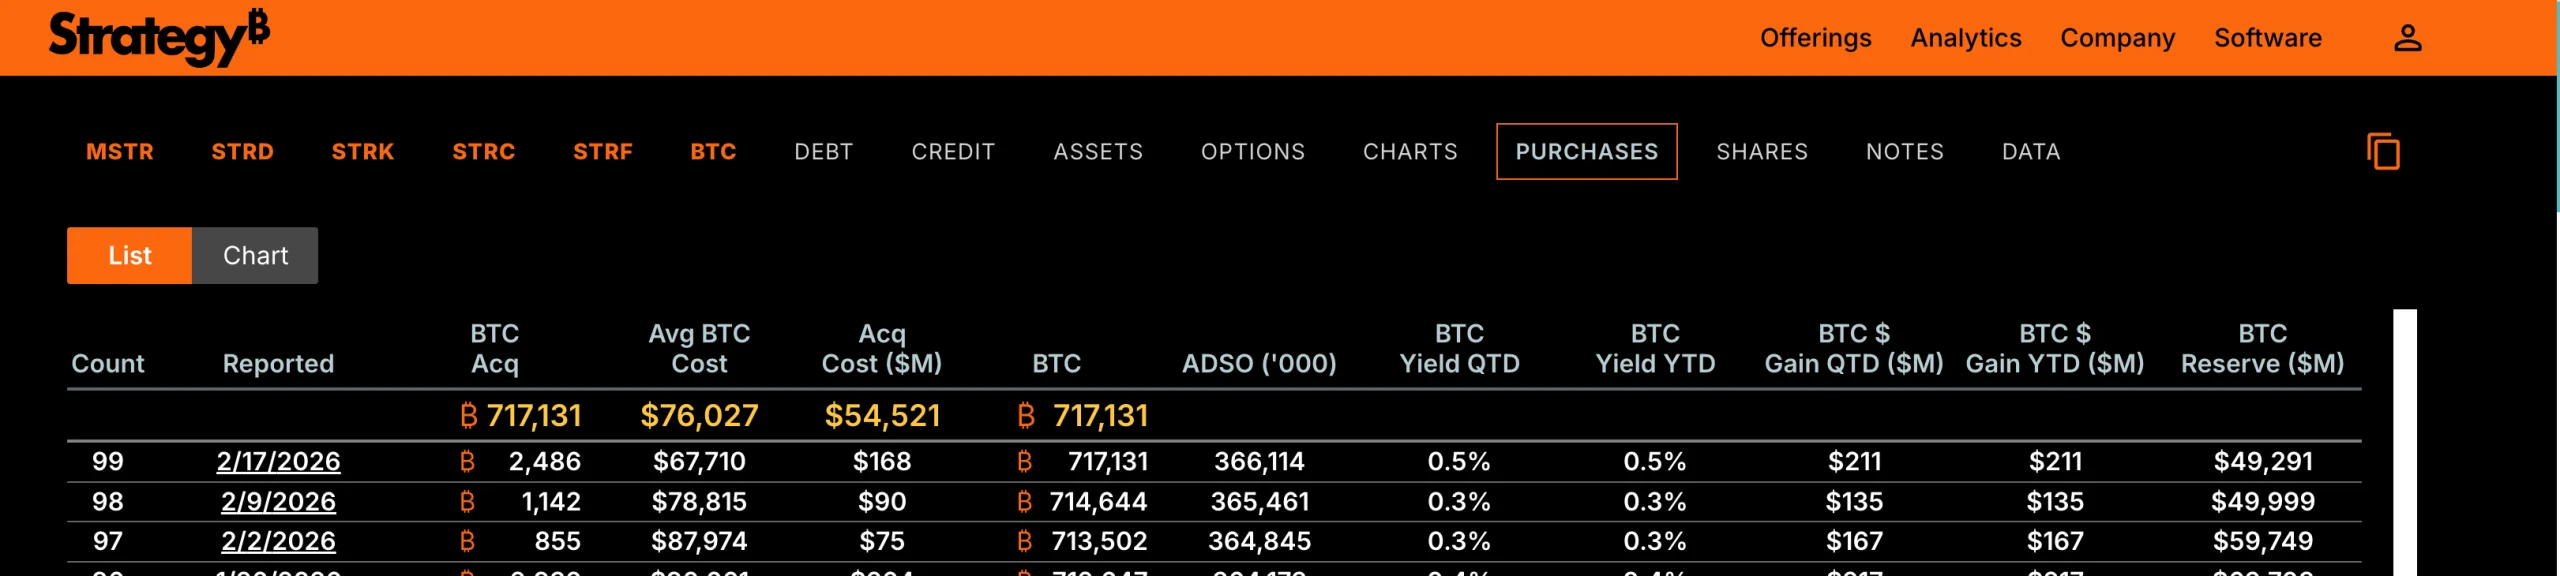
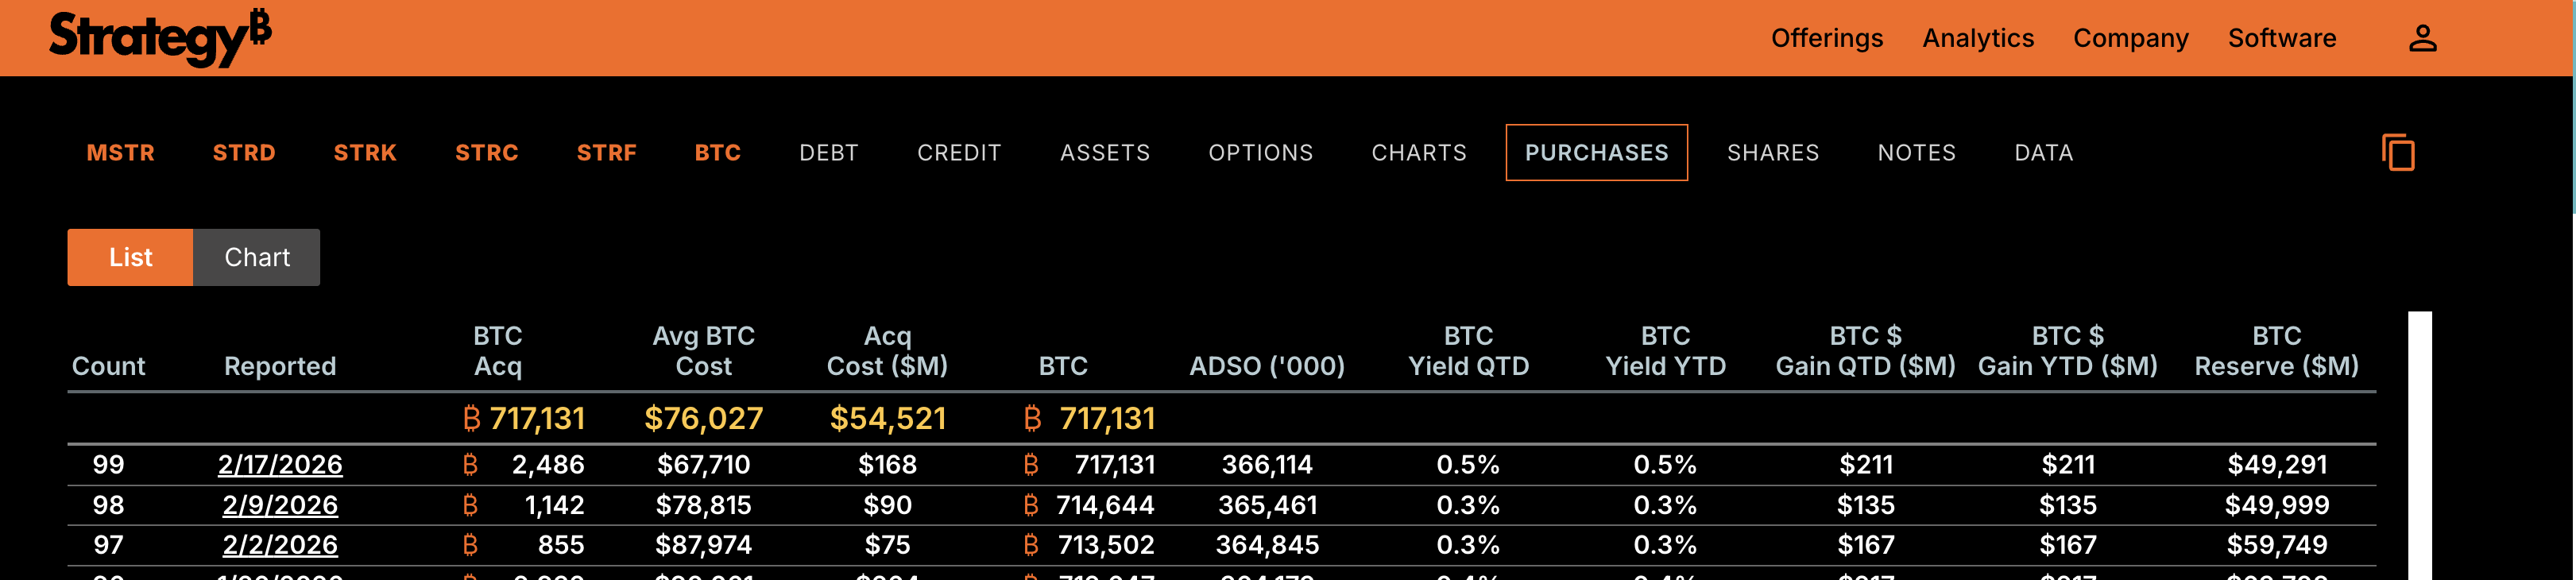
MicroStrategy recently purchased 2,486 Bitcoin at an average price of $67,710. This latest acquisition increased its total holdings from 714,644 BTC earlier this month to 717,131 BTC.
Because this purchase was made below MicroStrategy’s previous average cost, it helped lower the company’s overall Bitcoin cost basis. MicroStrategy’s average acquisition price dropped from $76,052 (early this month) to $76,027 (at press time). This represents a $25 average cost reduction.
Want more token insights like this? Sign up for Editor Harsh Notariya’s Daily Crypto Newsletter here.
While this technically improves MicroStrategy’s balance sheet, the impact remains small relative to its total position.
The company still holds Bitcoin at an average cost above $76,000, which remains significantly higher than many earlier cycle acquisitions. More importantly, market indicators show that big money investors are not reacting positively, even to this development.
Sponsored
Sponsored
Capital Flow Signals Strategy Investors Remain Cautious
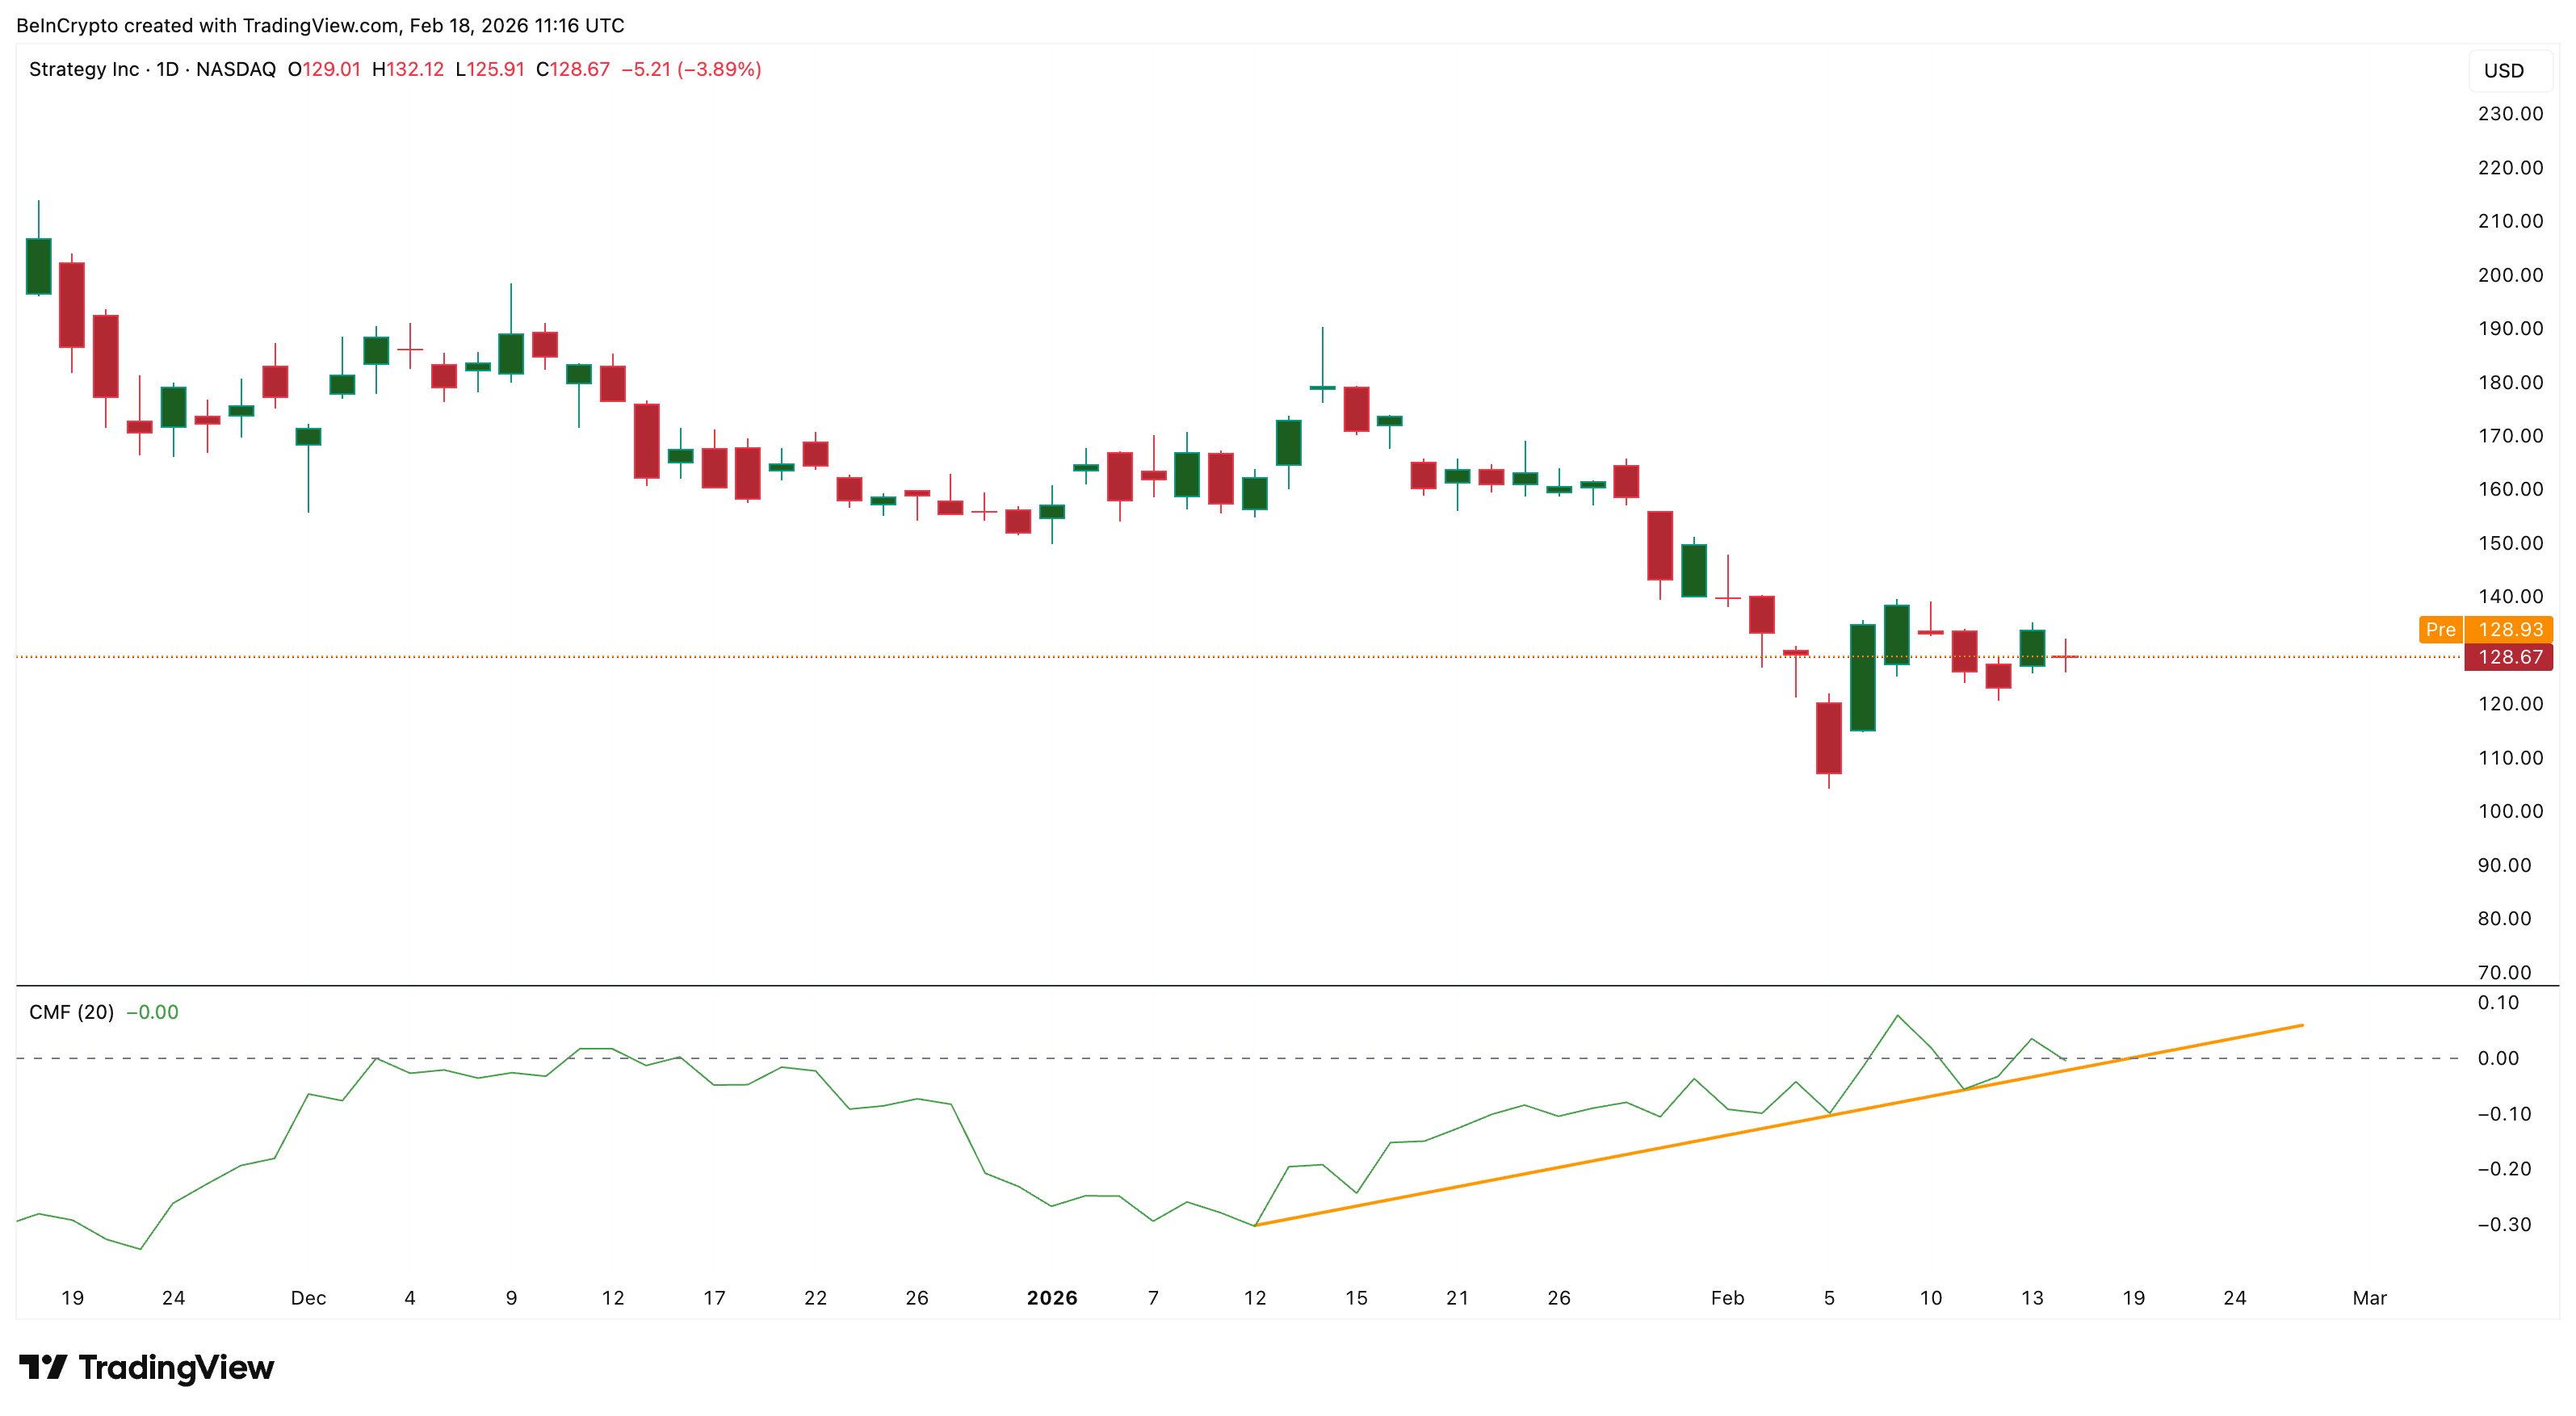
One key indicator explaining investor behavior is the Chaikin Money Flow, or CMF. This metric measures whether large investors are putting money into a stock or pulling money out by combining price and volume data. When CMF stays above zero, it signals net buying pressure. When it falls toward zero or below, it shows capital inflows are weakening.
Strategy’s CMF has been trending lower and is now sitting close to the zero line, on the brink of breaking below. It is also approaching a critical ascending trendline support. This shows that despite the latest Bitcoin purchase, large investors are not aggressively accumulating the MSTR stock. Instead, capital inflows remain weak.
This lack of conviction becomes more concerning when combined with weakening momentum signals.
Sponsored
Sponsored
Hidden Bearish Divergence Warns of Potential Major MSTR Price Correction
Momentum analysis using the Relative Strength Index, or RSI, shows a hidden bearish divergence forming. RSI measures buying and selling strength on a scale from 0 to 100 and helps identify weakening trends.
Between Dec. 9 and Feb. 13, MicroStrategy’s stock price formed a lower high, meaning the price failed to reach its previous peak. However, during the same period, RSI formed a higher high. This pattern is called hidden bearish divergence. It signals that sellers remain in control, and the downtrend is expected to continue. The MSTR stock price is down over 60% on a 6-month timeframe, highlighting the said downtrend.
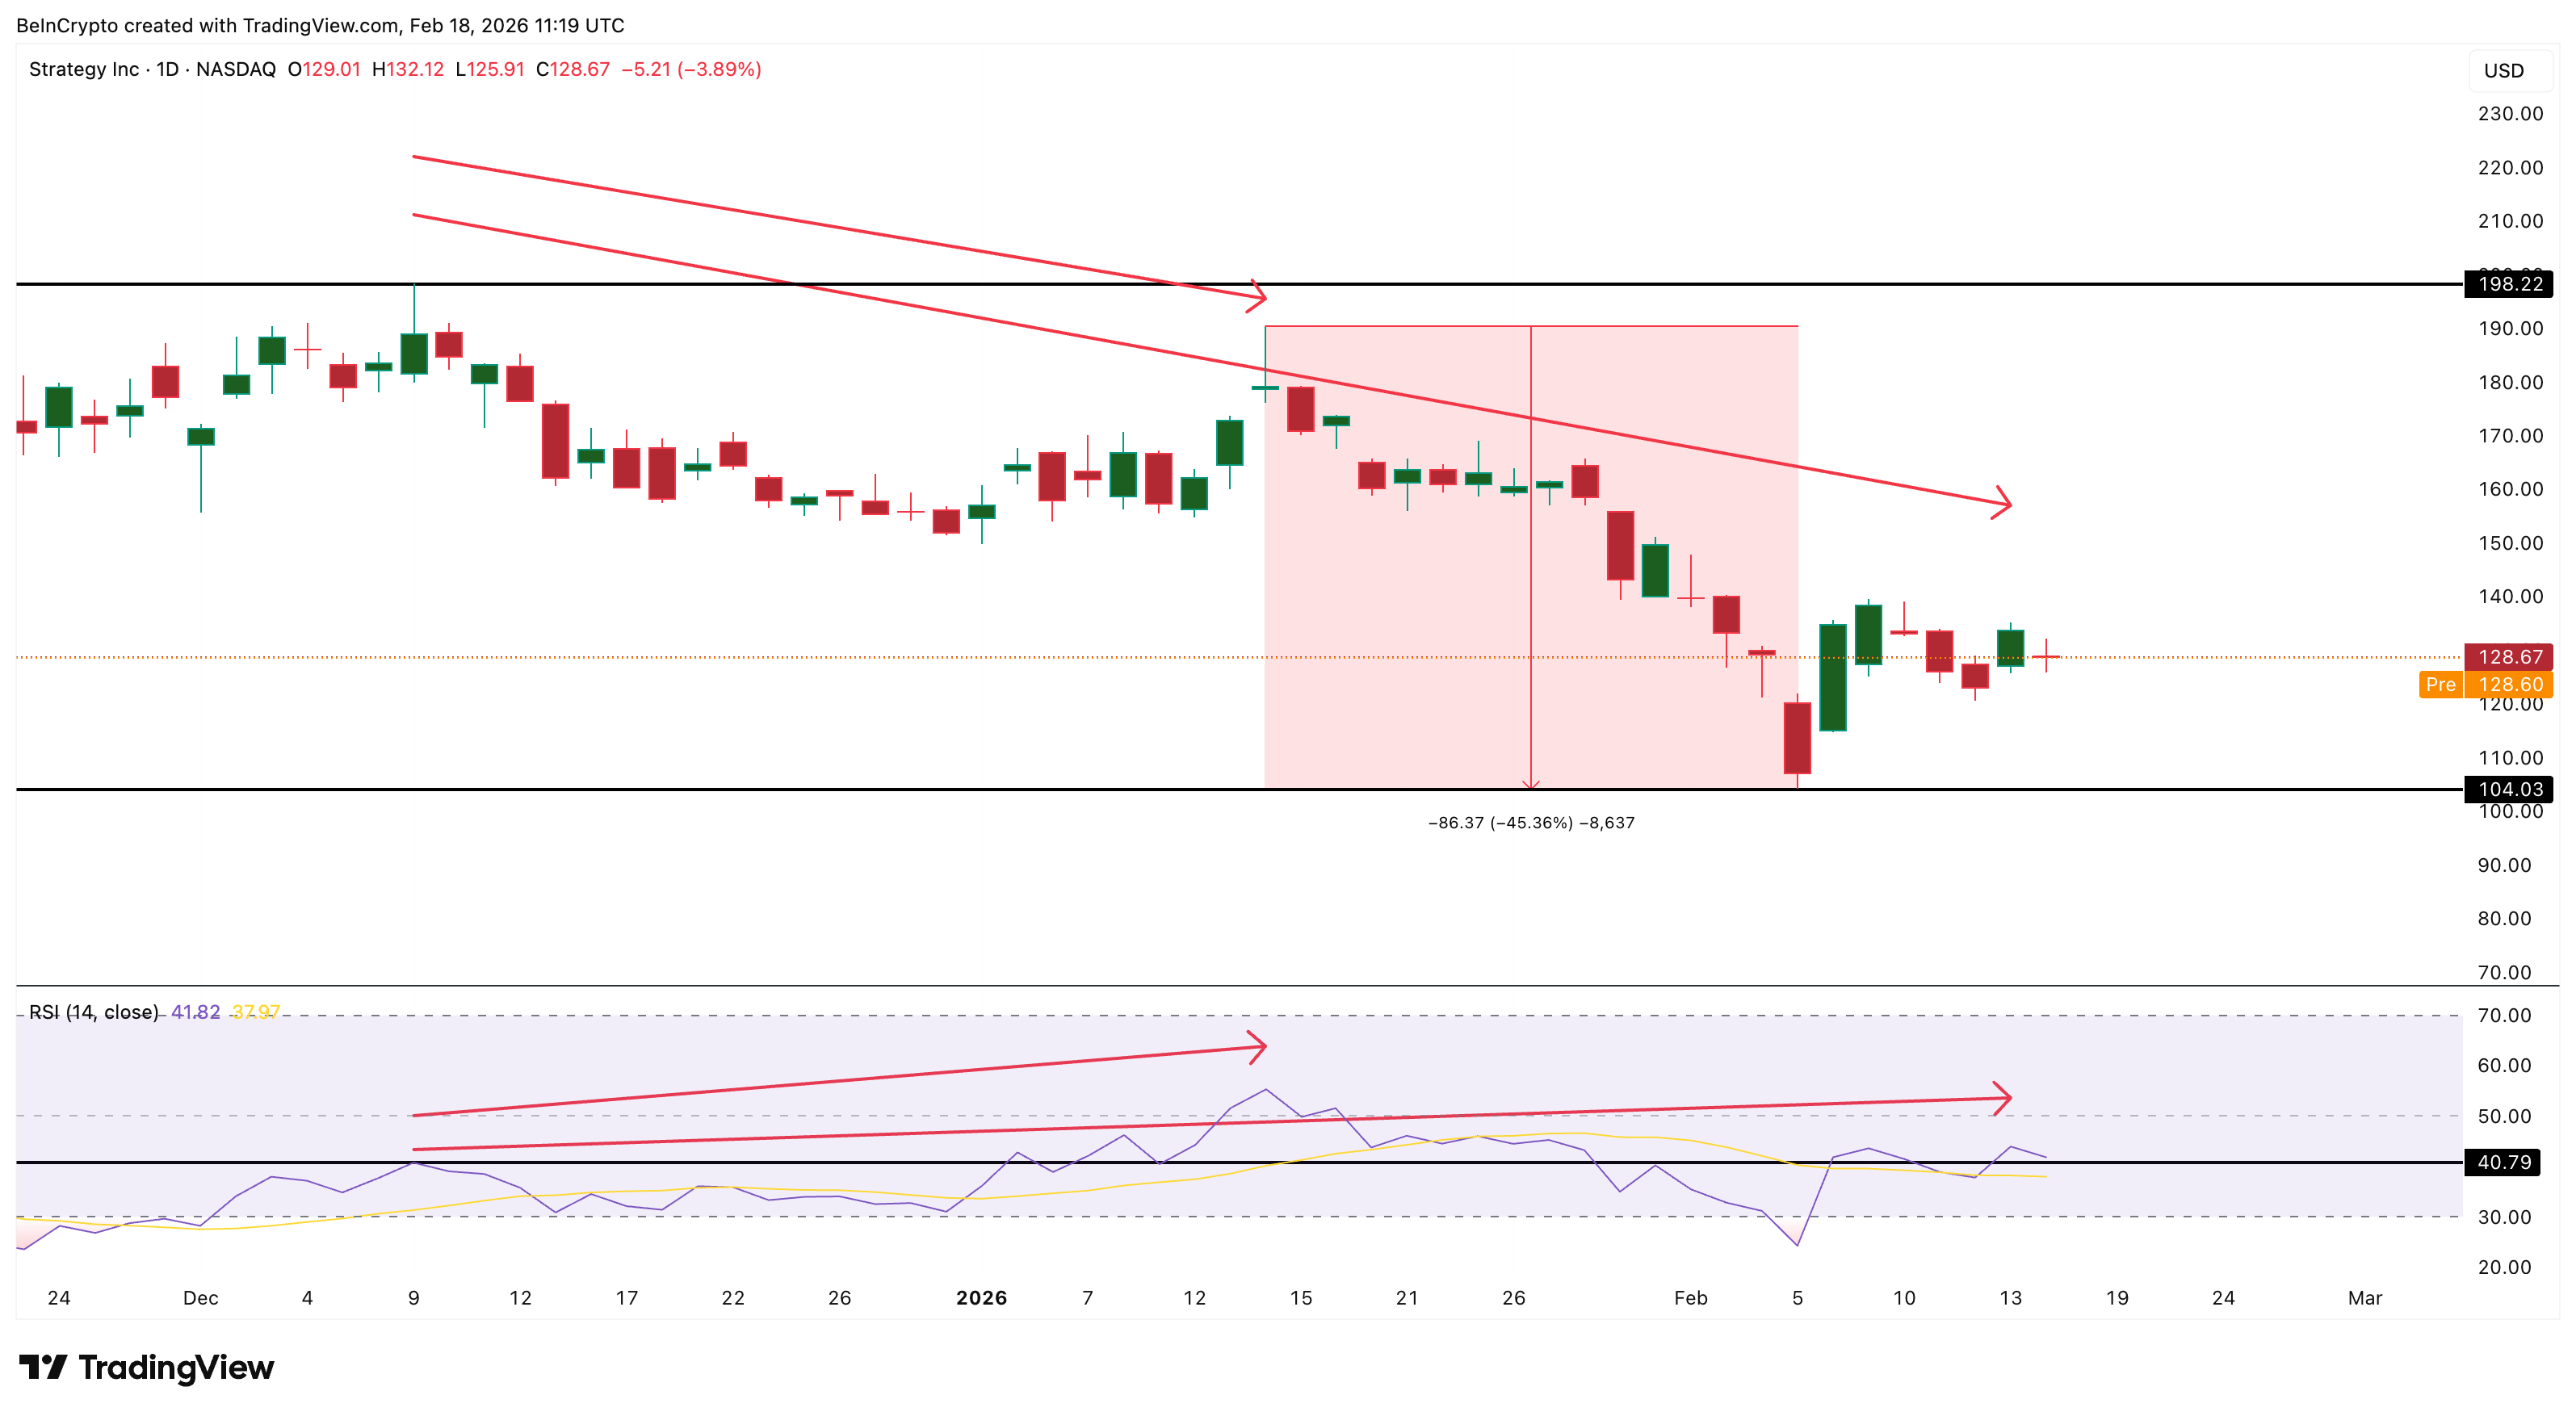
This same signal appeared earlier between Dec. 9 and Jan. 14. After that divergence formed, MicroStrategy stock dropped more than 45%, falling to its recent low near $104. The appearance of a similar structure now suggests another correction could develop if selling pressure continues. But this time the correction can have similar consequences.
Bear Flag Structure Shows MSTR Stock Could Fall Much Further
MicroStrategy’s price structure now shows a bear flag pattern forming. A bear flag is a bearish continuation pattern where the price temporarily moves upward before continuing its larger downtrend. After falling sharply earlier this February, the MSTR stock rebounded. However, this rebound has remained within a rising channel that forms the flag portion of the pattern.
Sponsored
Sponsored
MicroStrategy stock is currently trading near $128, very close to the lower boundary of this structure. If the price breaks below the $124 support level, the bear flag breakdown could begin.
Based on the height of the previous decline, this breakdown could push MicroStrategy stock toward $71, provided support levels at $104 and 86 break. This would represent a decline of more than 40% from current levels.
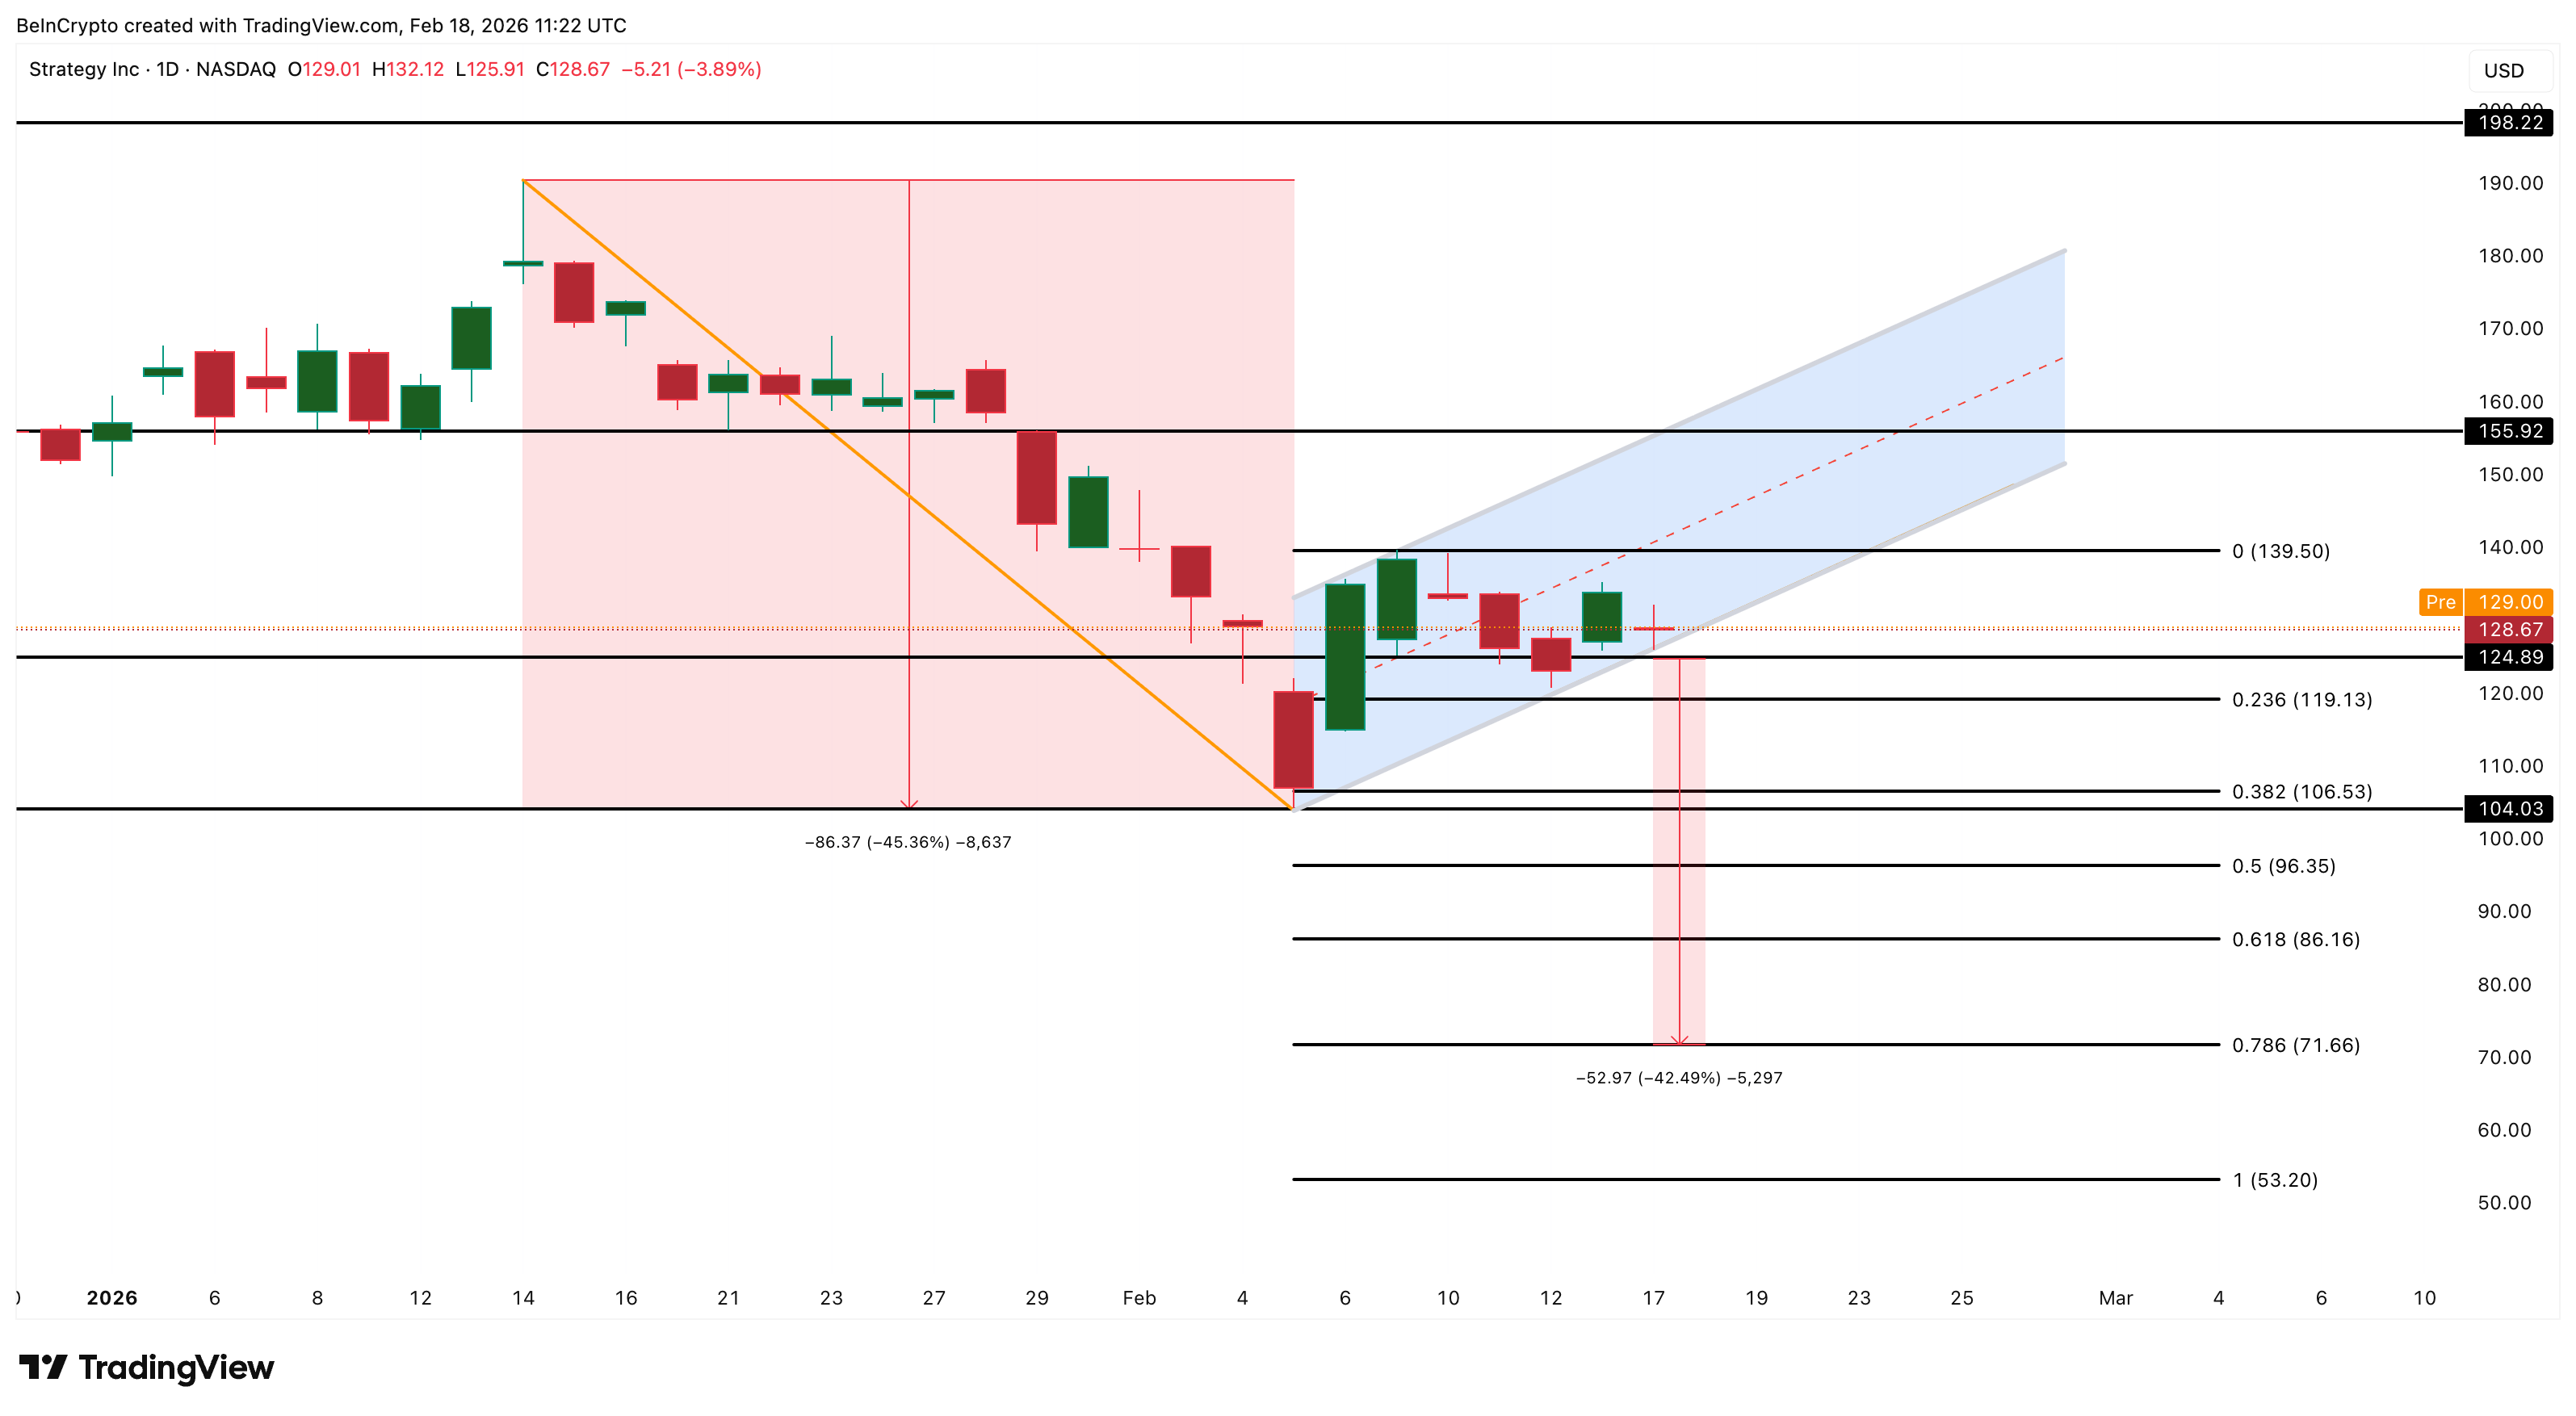
Recovery remains possible if buyers regain control. A move above $139 would weaken the bearish outlook, while a full recovery above $155 would invalidate the bearish structure entirely.
However, the bearish setup could also invalidate even without a sharp breakout. If the price continues rising slowly and the current channel extends beyond half of the original pole’s height, the bear flag would lose its validity. In that case, the structure would shift from a bearish continuation pattern into a broader recovery channel, reducing the immediate downside risk.
For now, MicroStrategy has successfully lowered its Bitcoin cost basis slightly. But capital flow weakness, bearish divergence, and fragile price structure all suggest that this small improvement may not be enough to prevent a larger stock correction.

The deal brings Bailey’s private ventures under a public umbrella, without a new shareholder vote.
A Bitcoin‑focused public company just bought two businesses that its own CEO originally founded, leaving many in the crypto circles scratching their heads over who’s really running the show.
The buyer, recently launched Bitcoin treasury company Nakamoto Inc., said in a Feb. 17 press release that it will merge with BTC Inc., the media and events group behind Bitcoin Magazine and The Bitcoin Conference, and UTXO Management, a Bitcoin-focused investment adviser.
David Bailey, Nakamoto’s chairman and CEO, co-founded BTC Inc. and UTXO Management, meaning he is effectively the buyer, seller, and CEO approving the deal.
“The Transaction is intended to further establish Nakamoto as a diversified Bitcoin operating company with a global brand, established distribution networks, and institutional capabilities across media, asset management, and advisory services,” the press release states.
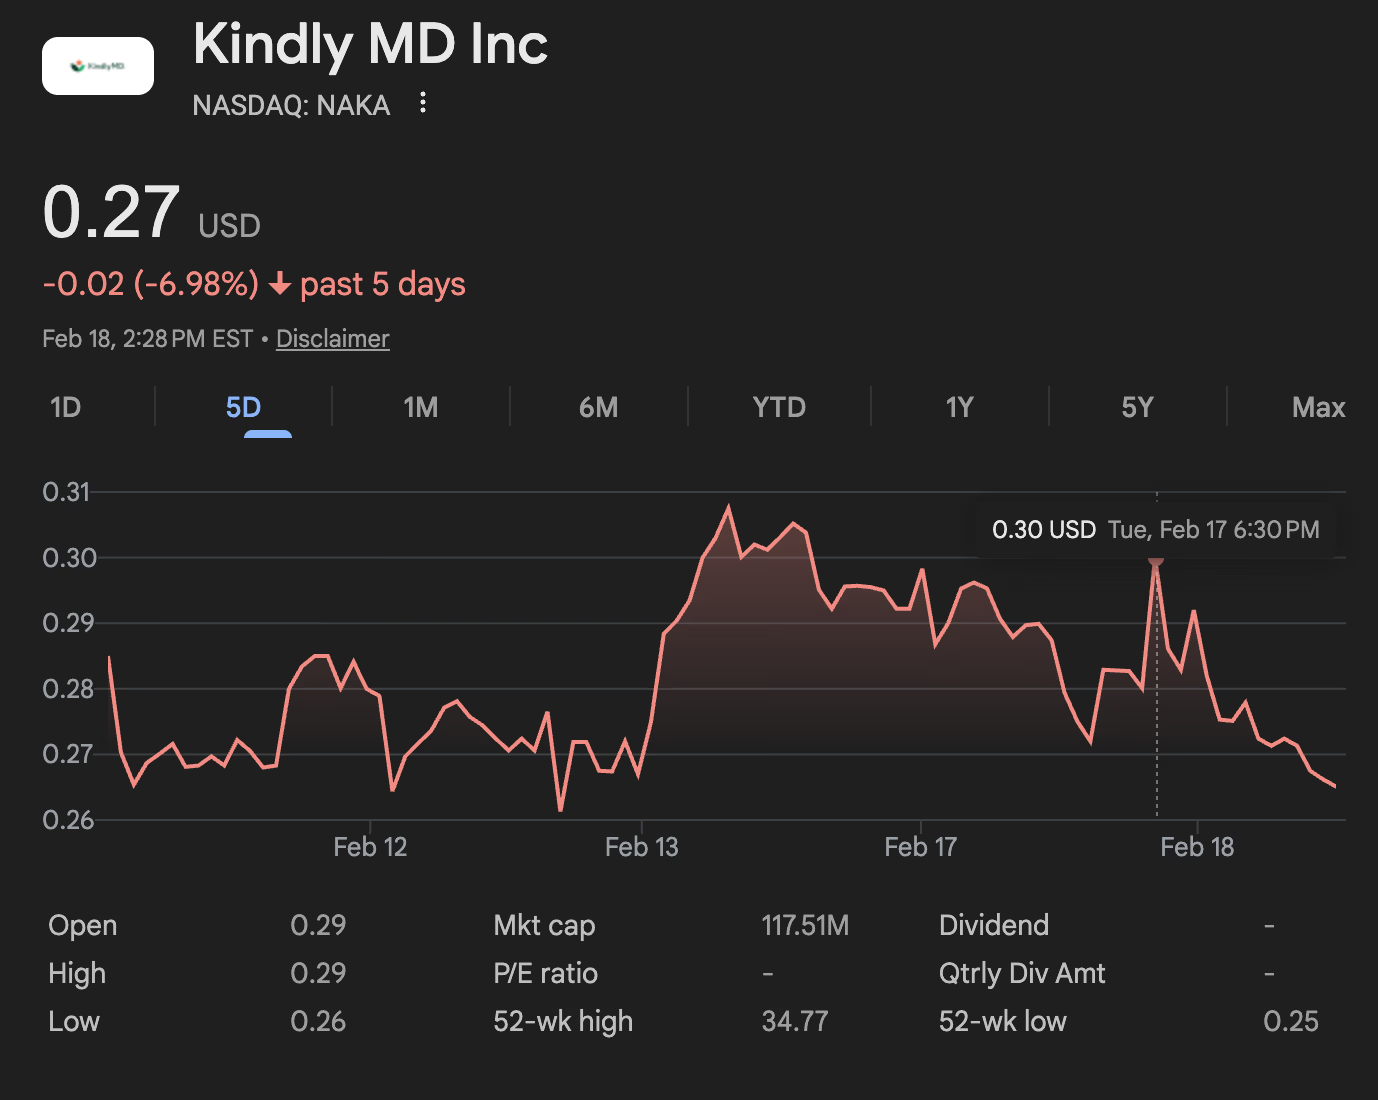
The deal is expected to close in Q1 2026 and is valued at about $107.2 million. Shares of Nakamoto, which trade on Nasdaq under the ticker NAKA, are down over 90% on the year.
NAKA shares are down 2.5% today and trading 10% lower since yesterday evening, following the news.

As Bitcoin advocate Justin Bechler pointed out in an X article on Feb. 17, in November 2025 Bailey handed the CEO title of BTC Inc. to Brandon Greene, who previously served as managing director, chief of staff, and head of events at BTC Inc., driving the growth of Bitcoin Magazine.
Bailey’s background spans over a decade in crypto leadership, including leading Bitcoin Magazine and organizing industry events. During the 2024 U.S. election cycle he was a visible Bitcoin advocate who advised Donald Trump’s campaign on crypto and played a role in securing Trump’s keynote appearance at the 2024 Bitcoin Conference.
‘Exit Liquidity’
As multiple commentators on X pointed out, the mechanics of the deal appear messy, given the ownership of the involved parties. The transaction will be financed entirely with newly issued common stock priced at $1.12 per share under pre‑existing call‑option terms, giving the sellers shares worth more than four times NAKA’s current market price, trading near $0.27 at press time.
That means Bailey’s private companies are being absorbed into the public shell at a price set long before most current shareholders bought in.
“Forget the pricing fiction on the contract. What matters is that 363.6 million new shares just entered the float. Existing shareholders are being diluted by that number regardless of whether the paperwork says $1.12 or $0.29. The $1.12 label is a courtesy to the seller. The dilution is real,” Bechler writes.
Because the call rights were previously disclosed and approved as part of earlier merger documentation, Nakamoto said “No additional Nakamoto shareholder approval is required to complete the Transaction.”
Some onlookers argue it was expected that Nakamoto would pull this move. Brian Brookshire, advisor at Bitcoin credit‑backed stablecoin protocol Saturn, noted in an X post yesterday evening that “no one should be surprised by this deal,” adding that “it was crystal clear from the outset that Nakamoto was a vehicle for bringing BTC Inc. public.”
For outside investors, the deal shows how linked operating businesses can be folded into a public shell while using shareholders as “exit liquidity.” Some explicitly pointed out the redundant ownership structure, saying the transaction was nothing more than “David pays David for David’s company with shareholders money…and the scam goes on.”

Bitcoin’s on-chain signals have shifted in a way that several researchers say signals capitulation could be underway, potentially setting the stage for a cycle bottom. The most studied metric — the short-term holder stress — has sunk to levels not seen since the late-2018 bear market trough, according to data from Checkonchain. The indicator measures the gap between the spot price and the average cost basis of wallets holding coins for under 155 days, applying Bollinger Bands to identify oversold conditions. Traders and researchers see the print as aligning with prior macro bottoms, though consensus on timing remains mixed. The conversation also points to macro liquidity catalysts: Wells Fargo cites tax refunds in 2026 as a possible tailwind that could pour liquidity into Bitcoin and equities by March, potentially absorbing remaining selling pressure. The path forward will hinge on whether market participants sustain buying interest as on-chain stress remains subdued across multiple cohorts, including short-term holder wallets.
Key takeaways
- Bitcoin’s Short-Term Holder (STH) MVRV Bollinger Band indicator has moved into its deepest oversold territory since the 2018 bear market bottom, signaling potential capitulation pressure.
- Historical precedents show similar oversold prints preceding substantial rallies, including a roughly 150% gain within a year and a 1,900% surge over three years after the 2018 bottom.
- The November 2022 trough, which preceded a multi-year rally to a record high near $126,270, is cited as another data point supporting cycle-bottom expectations.
- Realized losses among short-term holder whales have remained muted since Bitcoin’s October 2025 peak near $126,000, suggesting larger buyers have not yet fully capitulated.
- Macro liquidity signals, such as Wells Fargo’s note on sizable 2026 tax refunds potentially fueling a “YOLO” trade into Bitcoin and equities, could provide near-term upside pressure if flows materialize by end-March.
Tickers mentioned: $BTC
Sentiment: Neutral
Price impact: Neutral. While on-chain stress hints at a potential bottom, there is noConfirmed breakout scenario described and macro factors remain a key variable.
Market context: The combination of on-chain stress relief and a potential liquidity impulse from tax flows frames a window where risk appetite could improve in the near term. observers are watching whether the inflows materialize into persistent demand, or whether price action remains range-bound as macro conditions evolve.
Why it matters
On-chain metrics have long been a yardstick for evaluating Bitcoin’s market cycle phases, distinct from price action alone. The Short-Term Holder MVRV Bollinger Band approach temporarily puts a spotlight on coins held by newer entrants, treating them as a proxy for imminent selling or hold-to-maturity behavior. When the oscillator breaks below its lower Bollinger Band, it suggests that the average cost basis of short-term holders is being undercut by the current price — a condition historically associated with capitulation in the broader market. The 2018 experience, where oversold prints preceded a multi-year uptrend, is frequently cited by analysts as a potential template for this cycle.
The depth of the current oversold reading is meaningful because it aligns with a broader narrative: that selling pressure could be waning as investors capitulate, potentially creating room for a sustainable bottom. Yet, the analysis cautions that such signals are not guarantees. Bitcoin’s price has previously rebounded from similar conditions only to face renewed headwinds from macro shocks or shifts in risk appetite. The discussion around realized losses among short-term holder whales adds nuance: even as prices have fallen, large holders have not uniformly capitulated, suggesting that demand may still exist at higher levels than recent prices imply. This balance matters because it influences the probability of a durable bottom versus a quick bounce that fails to gain traction.
The macro dimension adds another layer. Wells Fargo’s strategists highlighted the potential for tax refunds to unlock liquidity that could support risk-on assets, including Bitcoin, by injecting capital into the market through March. If the $150 billion figure referenced by analysts proves accurate, such inflows could mitigate selling pressure and help price discover a more meaningful bottom. The convergence of on-chain signals with real-world liquidity flows is the kind of alignment that market watchers view as a constructive sign for risk assets, even as they remain cautious about the pace and durability of any rebound.
Analysts also point to historical cycles where bottoms were followed by notable recoveries. The late-2018 experience showed that oversold conditions, when paired with improving macro sentiment and increasing demand from new buyers, could catalyze a multi-year upside. The November 2022 bottom, followed by a surge to near-record highs, reinforces the idea that bottoms often coincide with periods of intense buyer interest returning to the market, even if the path there is bumpy. In this environment, the emphasis is on how fast new money and existing holders re-enter the market and how quickly sellers exhaust their supply, factors that are inherently linked to broader liquidity and sentiment dynamics.
Within the broader ecosystem, some traders and researchers also reference a smell-test of market psychology: the extent to which realized losses have cooled among the most active short-term participants suggests that the willingness to re-enter at higher levels remains present, albeit tentative. This is why the current data is interpreted as a potential setup for a cycle low rather than a guaranteed bottom. The shared takeaway is that while the signals are promising, the next few weeks — especially through the end of March — will be telling as tax-driven liquidity and on-chain dynamics continue to unfold.
The discussion around these dynamics is not isolated to Bitcoin. While the primary focus is on the flagship asset, the pattern of on-chain stress, macro liquidity, and historical analogs feeds into broader debates about the resilience of the crypto market amid evolving market structure and regulation. As always, readers are advised to view these signals as parts of a larger puzzle, not a definitive forecast. The intersection of on-chain data, fund flows, and macro risk sentiment remains the most informative lens for assessing where Bitcoin might head next.
What to watch next
- Monitor whether Bitcoin price stabilizes or rallies in the coming weeks, particularly if the STH Bollinger Band reading remains in oversold territory or begins to recover.
- Track tax-related liquidity flows into markets through March, as discussions around the $150 billion potential influx gain visibility.
- Observe changes in realized losses among short-term holder wallets and any signs of capitulation shifting toward distribution or accumulation phases.
- Watch updates from on-chain analytics providers like Checkonchain for new readings on short-term cost bases and holder behavior.
Sources & verification
- Checkonchain on the Short-Term Holder (STH) Bollinger Band metric and its historical precedents.
- Past Bitcoin bottoms in 2018 and 2022 that preceded major rallies, including a move to about $126,270 in 2022.
- Bitcoin price context around the October 2025 peak near $126,000 and the persistence of muted realized losses among short-term holder whales.
- Wells Fargo analysis cited by CNBC, noting potential liquidity inflows from tax refunds in 2026 and their possible impact on Bitcoin and equities.
- Matrixport’s bottom outlook as part of the broader analyst consensus around on-chain signals and macro risk sentiment.
Bitcoin on-chain stress signals edge toward potential cycle bottom
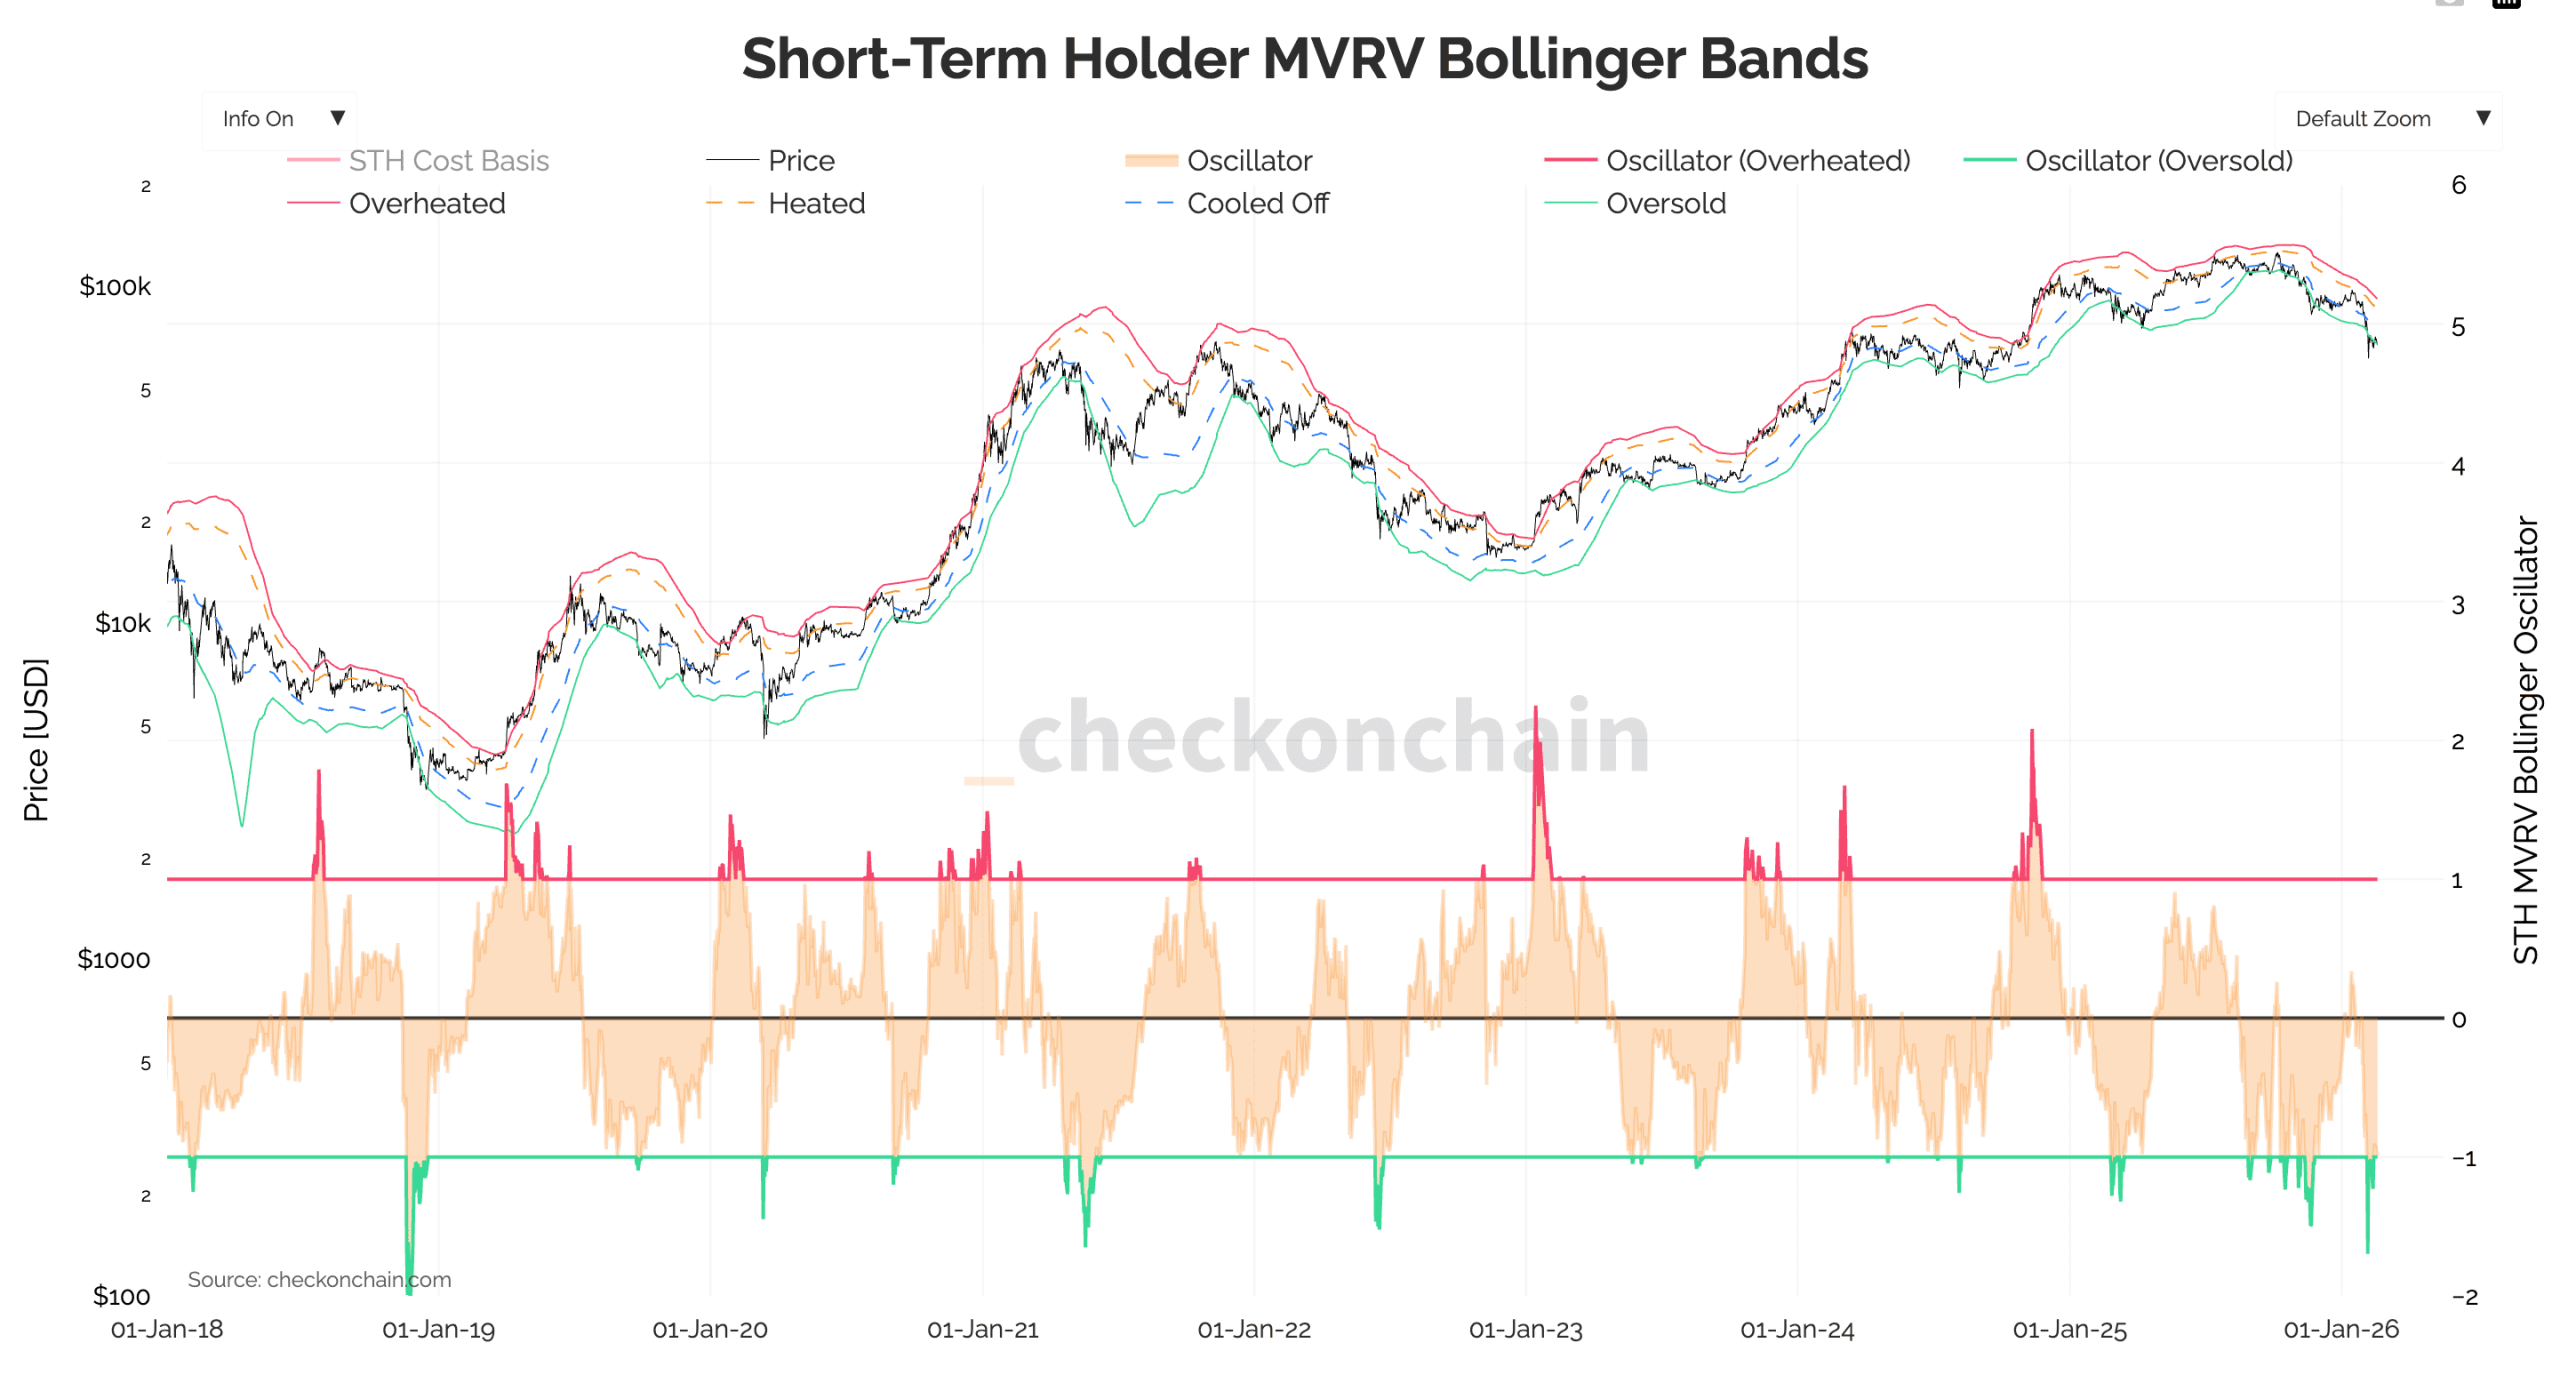
Bitcoin (CRYPTO: BTC) on-chain metrics have shifted in a way that several researchers say signals capitulation could be underway, potentially setting the stage for a cycle bottom. Foremost among them is the Short-Term Holder (STH) MVRV Bollinger Band indicator, which dipped into levels not seen since the 2018 bear trough, according to data from Checkonchain. By applying Bollinger Bands to the gap between the spot price and the average cost basis for wallets that have held BTC for less than 155 days, the oscillator flags oversold conditions when the price trades beyond the lower band.
The pattern mirrors a historical playbook: when the STH oscillator crosses the lower Bollinger band, Bitcoin has tended to trade well below the average purchase price of recent buyers, signaling capitulation pressure that often precedes a multi-month or multi-year rebound. In late 2018, such an oversold print foreshadowed a substantial rally, with BTC staging roughly a 150% ascent within a year and a cumulative rise of about 1,900% over three years. Similarly, the November 2022 trough marked a turning point before a dramatic upleg toward a record high near $126,270. These episodes illustrate how on-chain stress and market cycles can align in the aftermath of stress events.
Beyond price gaps, the market’s on-chain composition offers a nuanced view: realized losses among short-term holder whales have remained muted since Bitcoin’s October 2025 peak around $126,000, implying that larger buyers may still be sitting on loss-adjusted positions rather than capitulating. This balance between buying pressure and seller fatigue is often critical for confirming a bottom rather than a simple bounce. The data point is echoed in other analyses showing that demand from new entrants and opportunistic buyers has not yet faltered, though the overall macro environment remains uncertain.
Macro traders are also watching liquidity catalysts that could influence near-term direction. Wells Fargo’s Ohsung Kwon, cited by CNBC, highlighted that unusually large tax refunds anticipated in 2026 could revitalize what some call a “YOLO” trade — a rapid, all-in bet across equities and digital assets. Estimates floated in the note suggest as much as $150 billion could flow into stocks and Bitcoin by the end of March, a wave that may help absorb remaining selling pressure and support a stabilization narrative through the first quarter. More details
Such liquidity inflows would not, by themselves, guarantee a sustained rally, but they could dampen downside volatility and create a backdrop for a gradual rebound if on-chain metrics continue to show exhaustion of sellers. The discussion around short-term holder metrics is complemented by institutional commentary and analyst forecasts that point to a potential cycle low rather than a simple bounce. Some market observers, including researchers tracking long-run cycles, emphasize that the bottom’s timing is intrinsically linked to how quickly buyers re-emerge and how macro risk sentiment evolves in the coming weeks.
https://platform.twitter.com/widgets.js

TLDR:
- Prediction markets show a 60% Republican Senate and 83% Democratic House probability in 2026 elections.
- The GENIUS Act, enacted in 2025, awaits full implementation within 12 to 24 months after the midterms.
- ERC20 stablecoin supply surpassed $150 billion in 2024, approaching highs last seen during the 2021 cycle.
- A divided Congress points to gradual regulatory clarity, favoring steady capital inflows over sudden market shifts.
The 2026 U.S. midterm elections are drawing close attention from crypto markets worldwide. At the center of that attention is the GENIUS Act, a landmark stablecoin law enacted in 2025.
Prediction markets currently show a 60% probability of Republican Senate control and an 83% probability of Democratic House control.
That split points to a divided Congress as the most likely outcome. For crypto markets, this political structure could determine how quickly regulatory clarity translates into capital movement.
Why the Midterm Election Outcome Matters for Stablecoin Regulation
The 2026 midterms carry direct consequences for how the GENIUS Act moves toward full implementation. Enacted in 2025, the law established the first federal framework governing stablecoins in the United States.
Full implementation is expected to arrive within 12 to 24 months following the November 2026 elections. The political composition of Congress after that vote will influence how smoothly that process unfolds.
A divided Congress, the current base case, reduces the probability of sudden or sweeping regulatory reversals. Instead, markets can expect incremental policy progress as implementation details surface over time.
This gradual approach allows institutions and traders to adjust their positioning steadily. It also lowers the risk of abrupt disruption to existing market structures built around stablecoin liquidity.
“Regulation does not follow price—it reshapes the conditions under which price forms.” — XWIN Research Japan
Broader legislative efforts, such as the CLARITY Act, face a harder path under split congressional control. Without a unified legislative majority, comprehensive digital asset market reform may move slowly.
Crypto participants should therefore expect a multi-year regulatory window rather than a single decisive moment. Each phase of implementation will carry its own market repricing effect.
The midterms will not produce an overnight transformation in crypto markets. However, they will set the regulatory tempo for the following two years.
That tempo matters enormously for institutional capital planning cycles. A stable, predictable regulatory environment consistently attracts longer-term capital commitments into digital asset markets.
Stablecoin Supply Data Points to a Liquidity Cycle Already in Motion
On-chain data from CryptoQuant shows that the ERC20-based stablecoin supply has exceeded $150 billion as of 2024. That level approaches the historical highs last recorded during the 2021 market cycle.
Stablecoin supply functions as the most direct available measure of crypto market liquidity. When supply expands at this scale, it signals that capital is being staged ahead of broader risk allocation.
📊 CryptoQuant data confirms total ERC20 stablecoin supply surpassed $150 billion in 2024, nearing all-time highs.
Historical market patterns show that stablecoin supply growth has consistently preceded major bull cycles. The current supply level suggests that liquidity is already structurally present across the market.
This condition holds even as short-term volatility continues to affect crypto asset prices. Markets have historically used such periods of elevated liquidity to absorb risk before moving higher.
The combination of the GENIUS Act’s regulatory timeline and current supply data creates a specific market setup. Liquidity appears to be accumulating well ahead of the formal regulatory catalyst the midterms may deliver.
If divided government produces gradual clarity as expected, markets could reprice steadily throughout the implementation window.
That measured repricing environment tends to support sustained capital inflows rather than short-lived speculative spikes.
Ultimately, the 2026 midterms may not reshape crypto markets through legislation alone. Their larger role may be confirming the regulatory environment under which the next liquidity cycle accelerates.
The stablecoin supply structure already suggests that a foundation is forming. The election outcome will determine how quickly that foundation translates into the next market phase.

Bitcoin’s “short-term holder stress” metric has fallen to lows not seen since 2018, suggesting the market has capitulated and possibly bottomed.
A key Bitcoin (BTC) on-chain metric is flashing its most extreme capitulation signal since 2018, hinting at a potential cycle-low setup.
Bitcoin is mirroring 1,900% rally setup from 2018
Bitcoin’s short-term holder stress has dropped to its lowest level since the 2018 bear market bottom, according to new on-chain data from Checkonchain.
The Short-Term Holder (STH) Bollinger Band metric shows the oscillator falling into its deepest oversold territory in nearly eight years.

The indicator applies Bollinger Bands to the gap between Bitcoin’s spot price and the average cost basis of short-term holders, defined as wallets holding BTC for less than 155 days.
When the oscillator pierces the lower statistical band, it signals that Bitcoin is trading significantly below what recent buyers paid, beyond normal historical volatility. Historically, this signal has aligned with macro bottoms.
For instance, a similar oversold print appeared in late 2018 and preceded a roughly 150% rally within a year and 1,900% BTC price increase in three years.

It also flashed ahead of the November 2022 bottom, which preceded a 700% rally to a record high near $126,270.
Additionally, realized losses among short-term holder whales have stayed muted since Bitcoin’s October 2025 peak near $126,000, suggesting larger recent buyers haven’t capitulated yet.
Related: Traders pinpoint three price targets for Bitcoin if $70K holds as resistance
These metrics hint at seller exhaustion, aligning with the bottom outlook of multiple analysts, including those at crypto custodian platform MatrixPort.
Bitcoin may rebound by the end of March
Wells Fargo also sees a near-term liquidity tailwind building for Bitcoin.
In a note cited by CNBC, Wells Fargo strategist Ohsung Kwon said larger-than-usual US tax refunds in 2026 could revive the so-called “YOLO” trade, with as much as $150 billion potentially flowing into equities and Bitcoin by the end of March.
Such an event could absorb remaining sell pressure, reinforcing the idea that Bitcoin may bottom in the coming weeks.
This article does not contain investment advice or recommendations. Every investment and trading move involves risk, and readers should conduct their own research when making a decision. While we strive to provide accurate and timely information, Cointelegraph does not guarantee the accuracy, completeness, or reliability of any information in this article. This article may contain forward-looking statements that are subject to risks and uncertainties. Cointelegraph will not be liable for any loss or damage arising from your reliance on this information.


Crypto exchange Kraken has extended its acquisition streak by buying token management platform Magna as the company gears up for an expected public market debut.
The deal, announced Wednesday by Kraken’s parent company Payward, brings in a platform used by crypto teams to manage token vesting, claims and distributions. It currently serves over 160 clients and reported a peak total value locked (TVL) of $60 billion in 2025, according to the press release.
Terms of the deal were not disclosed.
The deal highlights Kraken’s push to become more than just a crypto exchange, expanding its offerings ahead as the firm is widely expected to go public.
Last year, it bought U.S. futures platform NinjaTrader for $1.5 billion, U.S.-licensed derivatives trading venue Small Exchange for $100 million. It also acquired proprietary trading firm Breakout and tokenized stock specialist Backed Finance, the issuer behind xStocks.
Kraken raised $800 million in November, a round that included Citadel Securities, valuing the firm at $20 billion.
Magna will continue to operate as a standalone platform, but its tools will be integrated into Kraken’s institutional-facing product suite.
Read more: Crypto exchange Kraken fires chief financial officer ahead of long-awaited IPO
Crypto World
Banking trade groups responsible for impasse on market structure bill, Brian Armstrong says


PALM BEACH, Fla. — Banking trade groups, rather than individual banks, are chiefly responsible for stalled negotiations on crypto market structure legislation, Coinbase CEO Brian Armstrong said.
Banks themselves are looking at crypto as an opportunity, he said Wednesday at the World Liberty Forum hosted at Mar-a-Lago.
“For whatever reason, sometimes incumbent industries have trade groups, and they view the world with a zero-sum mindset [where they believe] for the banks to win, crypto has to lose,” he said. “They’re not viewing this as a positive [step].”
Banking trade groups have represented the industry in meetings with the crypto industry hosted by the White House since the Senate Banking Committee’s push to advance market structure legislation last month fell apart. The latest such meeting, which took place last week, saw the banking industry holding the line on its demands that the bill block stablecoin rewards.
The next meeting is set to take place Thursday morning, individuals familiar with the plan told CoinDesk.
Read more: Crypto’s banker adversaries didn’t want to deal in latest White House meeting on bill
Armstrong said he did expect some sort of compromise where banks would have new benefits under a fresh draft market structure bill, though he did not elaborate. When the Digital Asset Market Clarity Act stalled the night before a Senate Banking Committee hearing, it was after Armstrong publicly withdrew his company’s support.
In the current talks, the Coinbase co-founder argued that individual small and medium-sized banks did not really fear deposit flight to stablecoin issuers, but rather said their more urgent concerns were with deposit flight to larger banks.
Major banks are leaning into crypto as well, he said, adding that Coinbase is supporting crypto infrastructure for “five of the largest banks in the world.”
Other banks are hiring for blockchain or crypto-focused employees on LinkedIn.
“We now live in this world where we have regulated U.S. stablecoins with rewards,” he said. “You have to accept that as a reality and decide if you want to treat that as an opportunity or as a threat.”
Crypto World
Real estate mogul Barry Sternlicht says his firm is ready to tokenize assets, but U.S. regulation blocks it
Billionaire real estate mogul Barry Sternlicht said his firm, Starwood Capital Group, which manages over $125 billion in assets, is ready to begin tokenizing real-world assets but can’t move forward due to regulatory barriers in the United States.
“We want to do it right now and we’re ready,” Sternlicht said Wednesday at the World Liberty Forum in Palm Beach. “It’s ridiculous that our clients can’t do it in token,” he said, referring to transacting real-world assets — like real estate — using blockchain-based tokens.
Tokenization refers to converting ownership of physical assets, like real estate or art, into blockchain-based tokens that can be traded. For firms like Starwood, it could offer a new way to raise capital or give investors access to previously illiquid markets.
Putting real estate on the blockchain isn’t a new idea, and some other firms are already moving forward on a small scale to make the massive market, which still relies heavily on manual processes, more efficient.
One such firm is Propy, which laid out its plans last year for $100 million expansion to acquire mid-size property title firms across the U.S., aiming to streamline the industry processes.
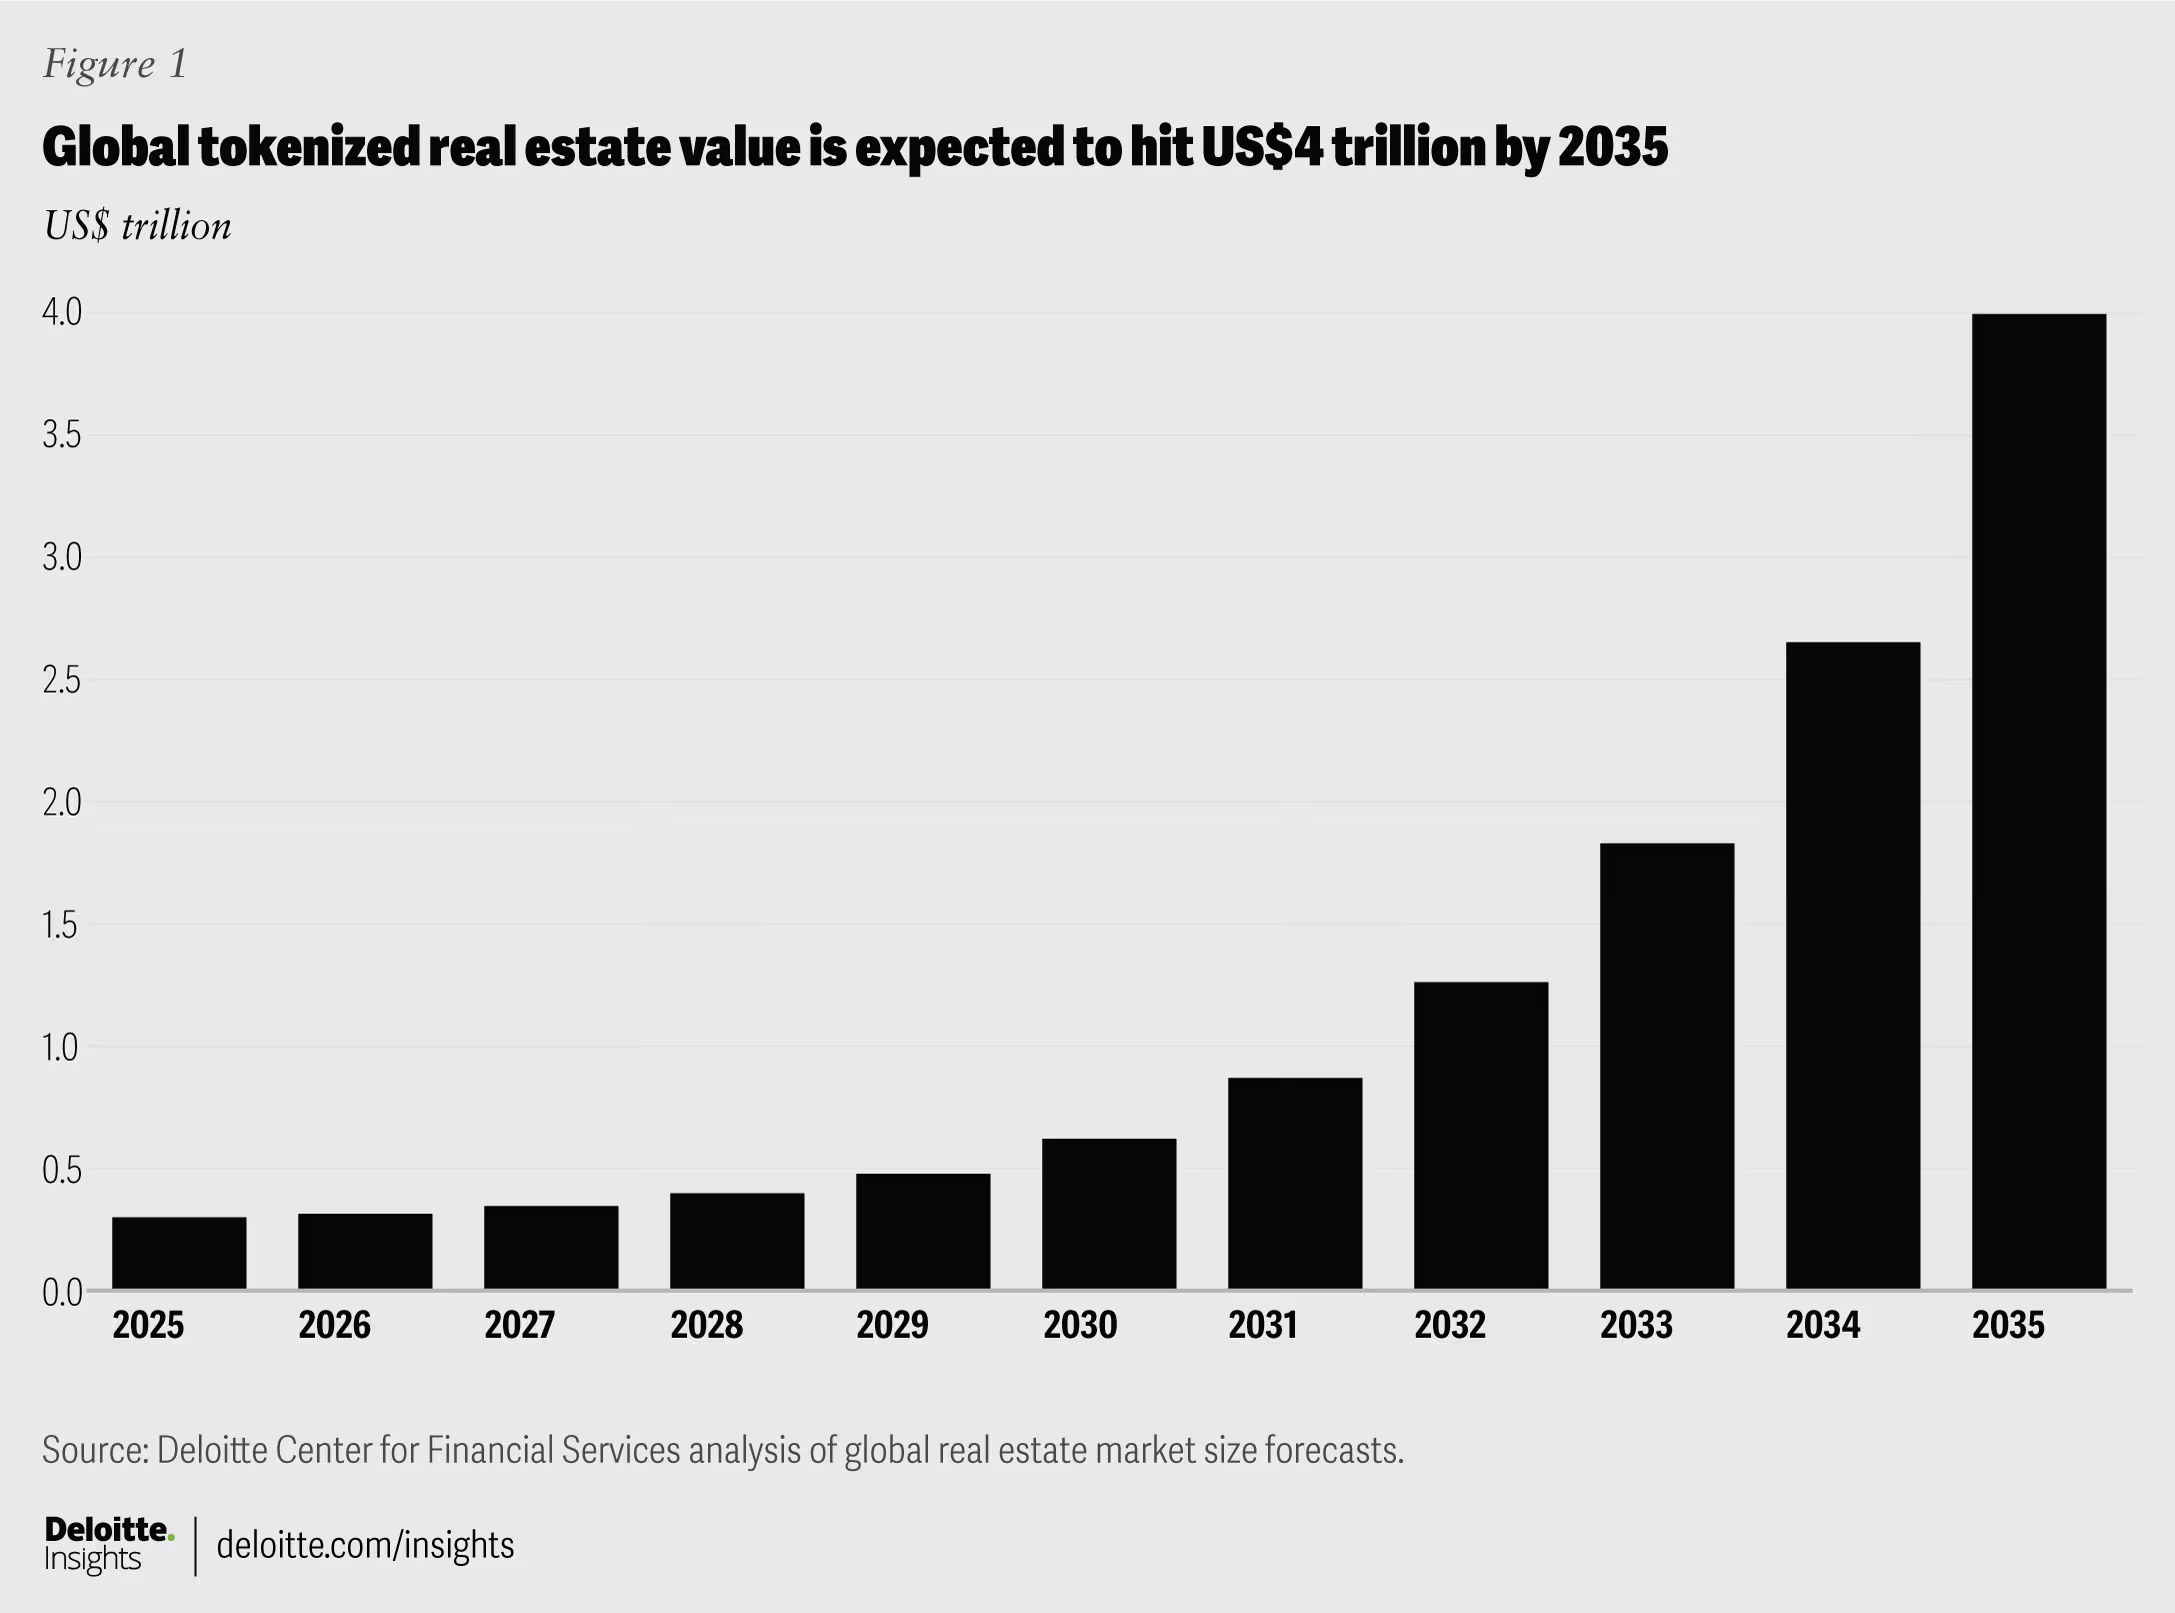
In fact, consulting giant Deloitte said in a report last year that $4 trillion of real estate will be tokenized by 2035, increasing from less than US$0.3 trillion in 2024. If that becomes reality, that’s a 27% CAGR for tokenized real estate.

“Tokenized real estate could not only pave the way for new markets and products, but also give real estate organizations an opportunity to overcome challenges related to operational inefficiency, high administrative costs charged to investors, and limited retail participation,” Deloitte said.
‘It’s a fantastic thing’
Sternlicht also seems to share the vision that tokenization can revolutionize the industry by praising the massive potential of the underlying technology.
“The technology is superior,” he said. “This is the future.
He went so far as to compare the current state of tokenization to artificial intelligence, saying it is far behind where AI is today.
“This is even earlier in the physical world than AI is.” Sternlicht called tokenization “exciting as can be,” saying, “It’s a fantastic thing for the world, the world just has to catch up with it.”


Crypto dev liability fears surge after 2025 cases, as Coin Center defends BRCA protections.
Summary
- Coin Center urged the Senate Banking Committee to advance the Blockchain Regulatory Certainty Act, warning that diluting it would chill U.S. blockchain innovation.
- The Lummis–Wyden bill clarifies that non-custodial developers and infrastructure providers are not money transmitters under federal law if they never control user assets.
- Recent convictions of Tornado Cash’s Roman Storm and Samourai Wallet’s founders for unlicensed money transmission highlight how unclear rules can expose open-source devs to prison.
Coin Center has called on the U.S. Senate Banking Committee to advance legislation that would shield cryptocurrency developers from prosecution when they do not control user funds, according to a letter sent by the advocacy group.
The organization warned that removing protections from the Blockchain Regulatory Certainty Act could discourage blockchain innovation in the United States, the letter stated.
Representative Tom Emmer first introduced the Blockchain Regulatory Certainty Act in 2018. Senators Cynthia Lummis and Ron Wyden introduced a revised version last month to clarify federal money transmitter rules, according to congressional records.
The updated bill seeks to confirm that software developers and blockchain infrastructure providers are not money transmitters if they do not take custody of customer assets. The draft has not yet been marked up or voted on by the Senate Banking Committee, according to lawmakers.
In the letter, Coin Center policy director Jason Somensatto compared blockchain developers to internet service providers and cloud hosting companies. Somensatto stated that authorities do not threaten those actors with prison when criminals misuse their systems and argued the same legal standard should apply to blockchain developers who publish code but do not manage user funds.
“This is the same type of activity conducted every day by internet service providers, cloud hosting services, router manufacturers, browser developers, and email providers,” Somensatto wrote in the letter.
The debate follows several criminal convictions of cryptocurrency developers in the United States in 2025. Courts convicted Tornado Cash developer Roman Storm and Samourai Wallet founders Keonne Rodriguez and Will Lonergan Hill of conspiring to operate an unlicensed money-transmitting business. Judges sentenced Rodriguez to five years in prison and Lonergan Hill to four years, according to court records. Storm is awaiting sentencing.
Coin Center stated that weakening the legislation could increase uncertainty for developers working in open-source software. The organization warned that some developers may choose to leave the United States if clear protections are not enacted.
Lawmakers continue to review the bill as discussions over digital asset regulation progress in Congress.

Pepe Coin price retreated this week, moving from the weekend high of $0.000005030 to the current $0.000004325.
Summary
- Pepe Coin price has formed a giant double-bottom pattern on the daily chart.
- This pattern points to a 150% surge to $0.00001080.
- Pepe’s futures open interest and volume have held steady this week.
The Pepe (PEPE) token remains well above its year-to-date low of $0.0000031, giving it a market capitalization of over $1.78 billion.
The ongoing consolidation is due to the crypto market’s price action, with Bitcoin and most altcoins remaining in a tight range.
However, on the positive side, there are signs that Pepe may be on the cusp of a strong bullish breakout, potentially to the year-to-date high of $0.000072.
Data compiled by CoinGlass show that futures open interest has continued to rise over the past few days, a sign of increased demand among traders betting on a potential rebound.
The futures open interest rose to $262 million, well above the year-to-date low of $200 million. Similarly, Pepe’s daily volume has bounced back from its lowest level this month. It stood at $435 million on Wednesday, much higher than the year-to-date low of $436 million.
Pepe’s volume was much higher than that of other top meme coins. For example, Shiba Inu had a daily volume of $114 million, while Official Trump had $152 million. The elevated volume is also a sign of demand among whale investors.
Pepe Coin price has formed a double-bottom pattern
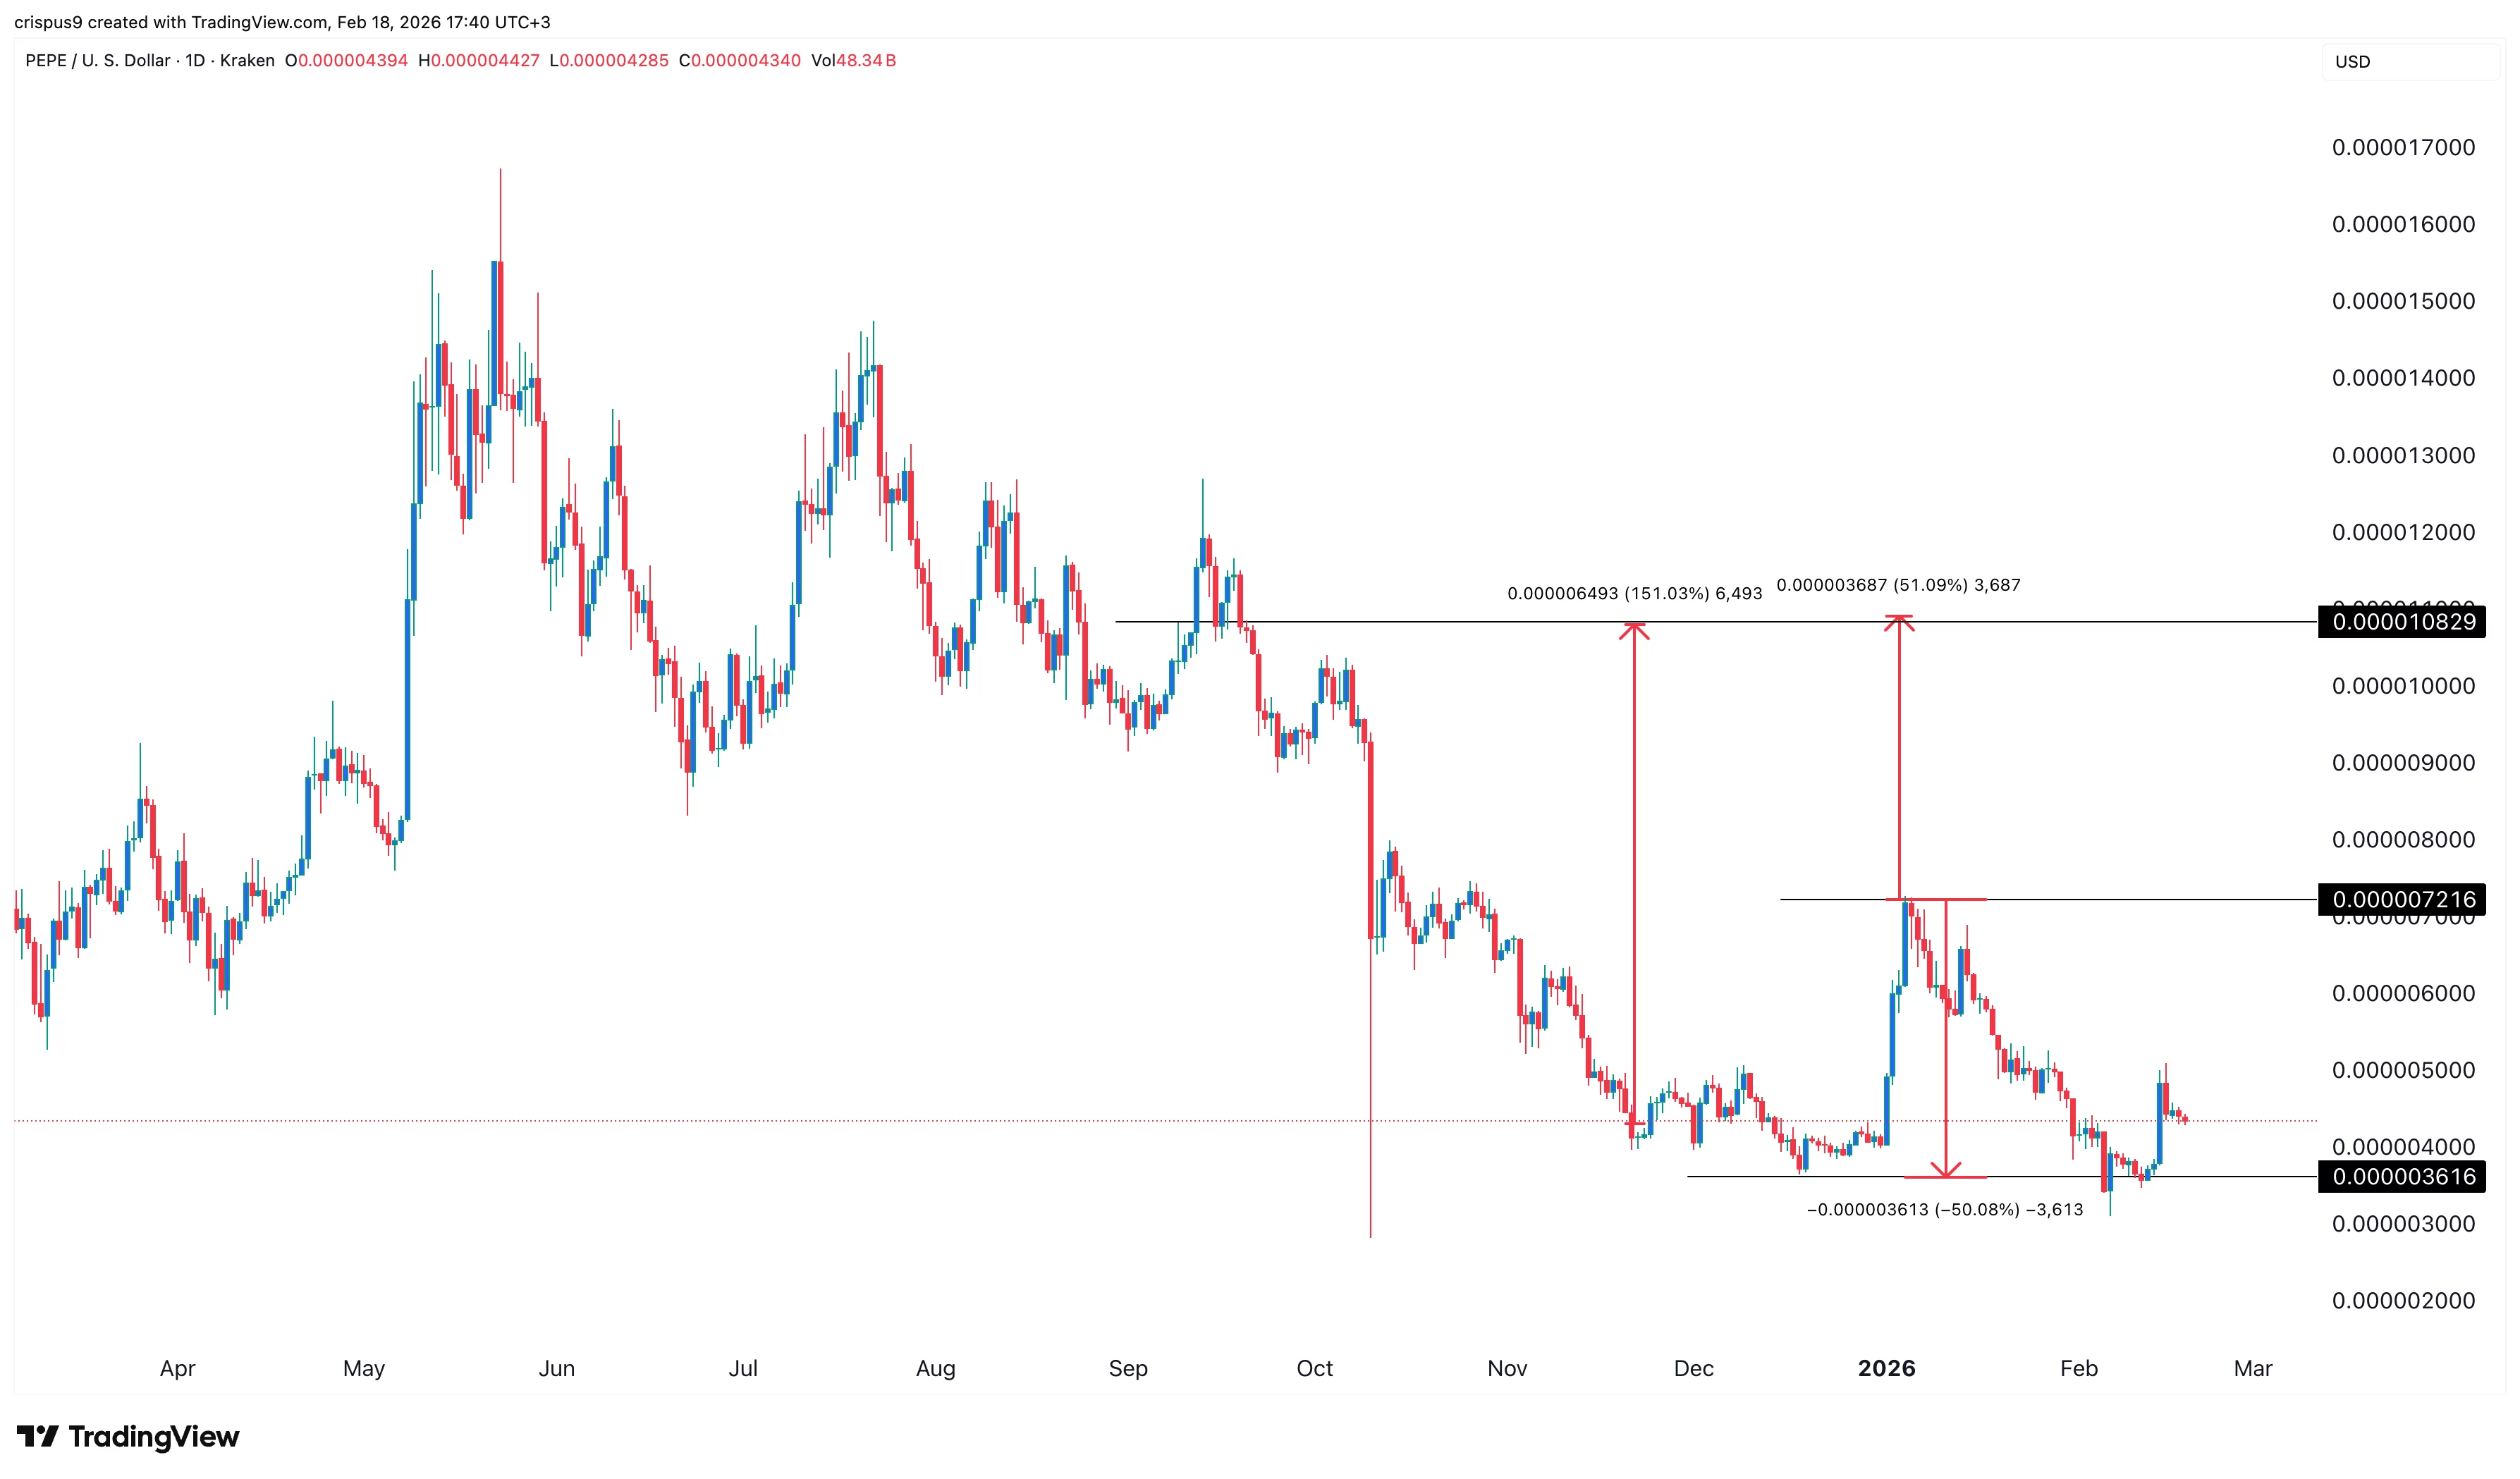
The daily chart shows that Pepe has been in a strong downward trend since 2025 as demand for meme coins waned and most altcoins tumbled.
On the positive side, it has formed a large double-bottom pattern at $0.0000036, its lowest level in December last year and this month.
A double-bottom pattern consists of two low swings and a neckline, which in this case is at $0.0000072. The profit target is determined by first measuring the distance between the neckline and the lower side.
After that, one measures the same distance from the neckline. In this case, Pepe will likely rally to $0.000p1082, up 150% from the current level.
The bullish Pepe Coin price forecast will become invalid if it drops below the double-bottom level at $0.0000036.
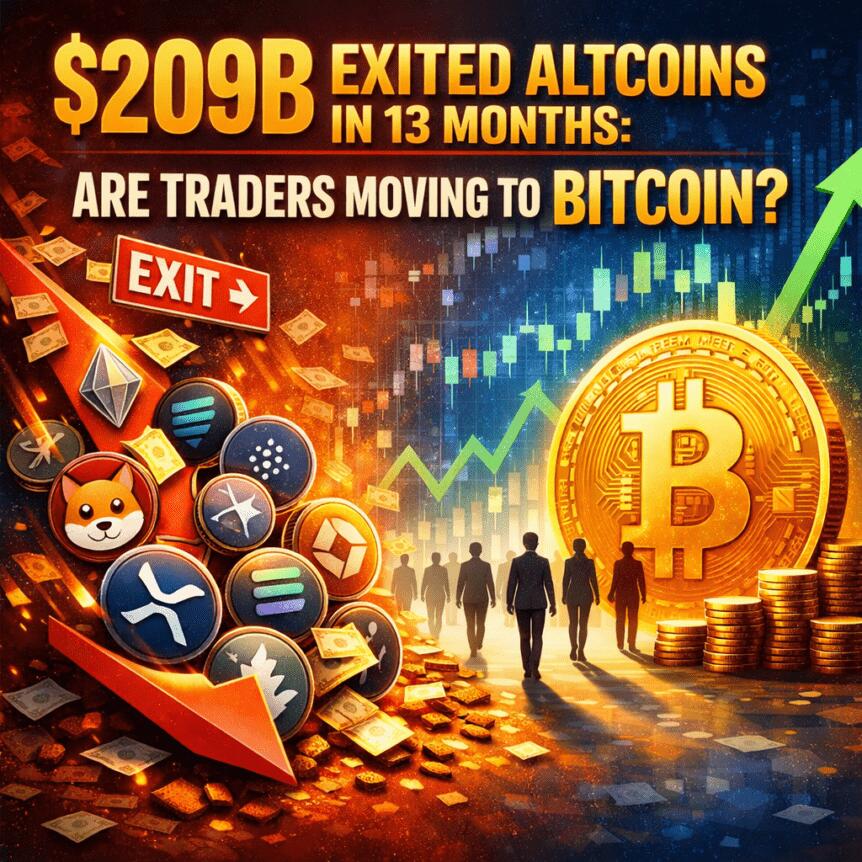
Altcoins have endured a pronounced stretch of selling pressure, with net selling totaling about $209 billion since January 2025, underscoring one of the steepest declines in speculative demand this cycle. On major exchanges, activity in the altcoin space has cooled markedly; data indicates a roughly 50% drop in altcoin trading volumes on Binance since late 2025, even as Bitcoin’s presence in the order book has grown. In this environment, market participants appear to be prioritizing the flagship asset, with capital gravitating toward Bitcoin during a sustained downtrend. The shift aligns with broader trends in the crypto market, including rising reliance on dollar-denominated assets as macro headwinds persist.
Key takeaways
- Altcoin net demand, excluding the leading crypto assets, shows a cumulative delta of -$209 billion since January 2025, signaling a persistent withdrawal of spot buyers and highlighting that this metric, while informative about demand balance, does not by itself mark a market bottom.
- On Binance, altcoin spot volumes have collapsed by about 50% since November 2025, while Bitcoin’s share of total exchange volume rose to 36.8% on February 7, with altcoins slipping to 33.6% by mid-February from a peak of 59.2% in November.
- Analysts point to repeated rotations into Bitcoin during corrective phases, with Darkfost noting similar patterns in April 2025, August 2024, and October 2022, when investor capital consolidated into BTC amid drawdowns for risk assets.
- Tether dominance has climbed to an all-time-like level on a weekly basis, hovering near 8% (USDT), a condition historically associated with capital shifting into dollar-pegged assets rather than tokens like BTC or ETH. Prior cycles show that declines in this metric have sometimes preceded renewed upside for Bitcoin.
- The combination of waning altcoin demand and rising stablecoin dominance suggests a risk-off environment where traders favor BTC and stablecoins as macro uncertainties persist and the market absorbs potential regulatory and macro signals.
Tickers mentioned: $BTC, $ETH, $USDT
Sentiment: Bearish
Market context: The current environment shows a clear preference for liquidity and safety over speculative bets on altcoins. With altcoin demand contracting and stablecoin dominance rising, the market signals a reduction in risk appetite as Bitcoin consolidates amid macro headwinds and evolving regulatory considerations. The shift mirrors past cycles where capital moved toward the flagship cryptocurrency as risk-off conditions intensified.
Why it matters
The observed rotation away from altcoins toward Bitcoin and stablecoins has meaningful implications for investors, developers, and market structure. For traders, the data underscores the importance of monitoring liquidity flows and the relative strength of Bitcoin during downturns, rather than simply chasing uncorrelated altcoin narratives. For ecosystem builders, sustained declines in altcoin demand could influence funding dynamics, token performance, and the pace of new project launches, as capital allocations recalibrate in a more risk-off posture. For the broader market, a prolonged shift toward BTC and dollar-pegged assets may affect liquidity distribution, derivatives pricing, and the timing of potential recoveries, making risk controls and diversification more critical in volatile environments.
The trend also emphasizes the value of watching market signals rather than price action alone. While Bitcoin’s price movements remain central to risk sentiment, the degree to which altcoins capitulate or stabilize can shape the pace and breadth of any eventual recovery. In this context, market participants are paying close attention to on-chain and exchange-level indicators, seeking any early signs that a shift in appetite could re-emerge as macro conditions evolve.
What to watch next
- Monitor the pace of altcoin net selling versus BTC-driven inflows to determine whether the current distribution begins to reverse or persists through the next leg of the cycle.
- Track USDT dominance around the 8% level and any moves away from this regime, as shifts could foreshadow changes in risk sentiment and liquidity allocation.
- Observe Bitcoin’s price and volume dynamics for signs of renewed strength or further consolidation near bear-market levels, particularly in relation to market-wide risk-off moves.
- Watch Binance and other major exchanges for changes in altcoin and BTC share of total volume, which can reveal evolving trader preferences during downturns.
- Stay alert for macro or regulatory catalysts that could alter the flow of capital between BTC, ETH, and dollar-pegged assets, potentially reshaping the near-term trajectory for altcoins.
Sources & verification
- CryptoQuant, Altcoin sell-pressure just hit a 5-year extreme — https://cryptoquant.com/insights/quicktake/6994dc07312550148f4ebe22-Altcoin-sell-pressure-just-hit-a-5-year-extreme
- CryptoQuant, Altcoin volumes shrink by 50% as capital rotates back to Bitcoin — https://cryptoquant.com/insights/quicktake/69958a88c876a02133a047bb-Altcoin-volumes-shrink-by-50-as-capital-rotates-back-to-Bitcoin
- TradingView, USDT.D chart data — https://in.tradingview.com/symbols/USDT.D/
- Cointelegraph, New Bitcoin whales are trapped underwater, but for how long? — https://cointelegraph.com/news/new-bitcoin-whales-are-trapped-underwater-but-for-how-long
- Cointelegraph, Wells Fargo tax refunds YOLO trade driving Bitcoin and risk assets — https://cointelegraph.com/news/wells-fargo-tax-refunds-yolo-trade-bitcoin-stocks-150b
Altcoin demand wanes as capital rotates back to Bitcoin and stablecoins rise
Bitcoin (CRYPTO: BTC) activity began to draw a larger slice of total exchange volume as altcoins retrenched, a trend reinforced by the wider market’s risk-off posture. While the market previously witnessed heightened attention to altcoins during bullish phases, the latest data show a clear tilt away from the broader altcoin complex toward the flagship asset. The shifts in volume and demand are not only a reflection of price moves but a signal of how market participants are prioritizing liquidity and safety in uncertain times.
Ether (CRYPTO: ETH) and other altcoins have experienced a decline in both trading interest and net demand, with the combined effect being a tight supply of buyers in the spot market. This is not a simple bottom indicator; rather, it reflects a fundamental reallocation of capital, where risk-on bets in lesser-known tokens give way to a more conservative stance. The data from centralized exchanges shows a persistent exodus from altcoin markets over the past year, with the most pronounced outflows occurring in the current downcycle, as traders reassess risk and position for potential macro triggers.
At the same time, the dominance of dollar-pegged assets remains elevated. USDT, a primary stablecoin, has reached levels reminiscent of prior multi-month highs, a condition that typically accompanies a preference for liquidity and ready-to-deploy capital in times of uncertainty. The dynamic has historically been associated with a cautious stance among traders, as they seek to preserve value while awaiting clearer directional cues from macro data, regulatory updates, or shifts in market sentiment.
In this context, the market has shown a pattern of capital rotations: investors move money into Bitcoin amid broad market weakness, then re-evaluate altcoin exposure as conditions stabilize. While such rotations do not guarantee a resumption of altcoin strength, they set the stage for potential re-entry if liquidity returns and risk appetite improves. The ongoing narrative emphasizes the intertwined nature of liquidity, risk sentiment, and asset selection within the crypto market, with Bitcoin acting as a focal point for funding during downturns and stablecoins serving as a practical store of value and liquidity during periods of uncertainty.

Exclusive-Top US commander for Latin America makes surprise visit to Venezuela
David Bailey’s Nakamoto Buys His Own Bitcoin Empire at a Discounted Public Price

‘Love Island’ Duo Iris Kendall and TJ Palma Heat Up in Hawaii


-

 Sports7 days ago
Big Tech enters cricket ecosystem as ICC partners Google ahead of T20 WC | T20 World Cup 2026
-

 Video2 days ago
Bitcoin: We’re Entering The Most Dangerous Phase
-

 Tech4 days ago
Luxman Enters Its Second Century with the D-100 SACD Player and L-100 Integrated Amplifier
-

 Sports2 days ago
GB's semi-final hopes hang by thread after loss to Switzerland
-

 Video5 days ago
The Final Warning: XRP Is Entering The Chaos Zone
-

 Crypto World2 days ago
Can XRP Price Successfully Register a 33% Breakout Past $2?
-
 Tech2 days ago
The Music Industry Enters Its Less-Is-More Era
-

 Business23 hours ago
Infosys Limited (INFY) Discusses Tech Transitions and the Unique Aspects of the AI Era Transcript
-

 Video2 days ago
Financial Statement Analysis | Complete Chapter Revision in 10 Minutes | Class 12 Board exam 2026
-

 Entertainment10 hours ago
Kunal Nayyar’s Secret Acts Of Kindness Sparks Online Discussion
-
 Crypto World5 days ago
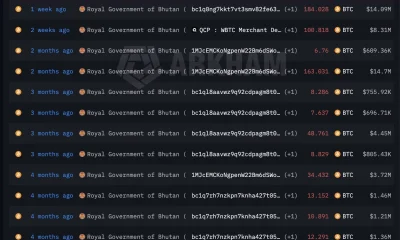
Bhutan’s Bitcoin sales enter third straight week with $6.7M BTC offload
-

 Tech14 hours ago
Retro Rover: LT6502 Laptop Packs 8-Bit Power On The Go
-
 Video7 days ago
Prepare: We Are Entering Phase 3 Of The Investing Cycle
-
 NewsBeat3 days ago
The strange Cambridgeshire cemetery that forbade church rectors from entering
-

 Business6 days ago
Barbeques Galore Enters Voluntary Administration
-

 Business16 hours ago
Tesla avoids California suspension after ending ‘autopilot’ marketing
-

 Crypto World4 hours ago
WLFI Crypto Surges Toward $0.12 as Whale Buys $2.75M Before Trump-Linked Forum
-
 Crypto World6 days ago
Ethereum Price Struggles Below $2,000 Despite Entering Buy Zone
-

 Crypto World5 days ago
Kalshi enters $9B sports insurance market with new brokerage deal
-
 NewsBeat3 days ago
Man dies after entering floodwater during police pursuit