
Crypto World
One trader just lost $220 million as ETH plunged 10%
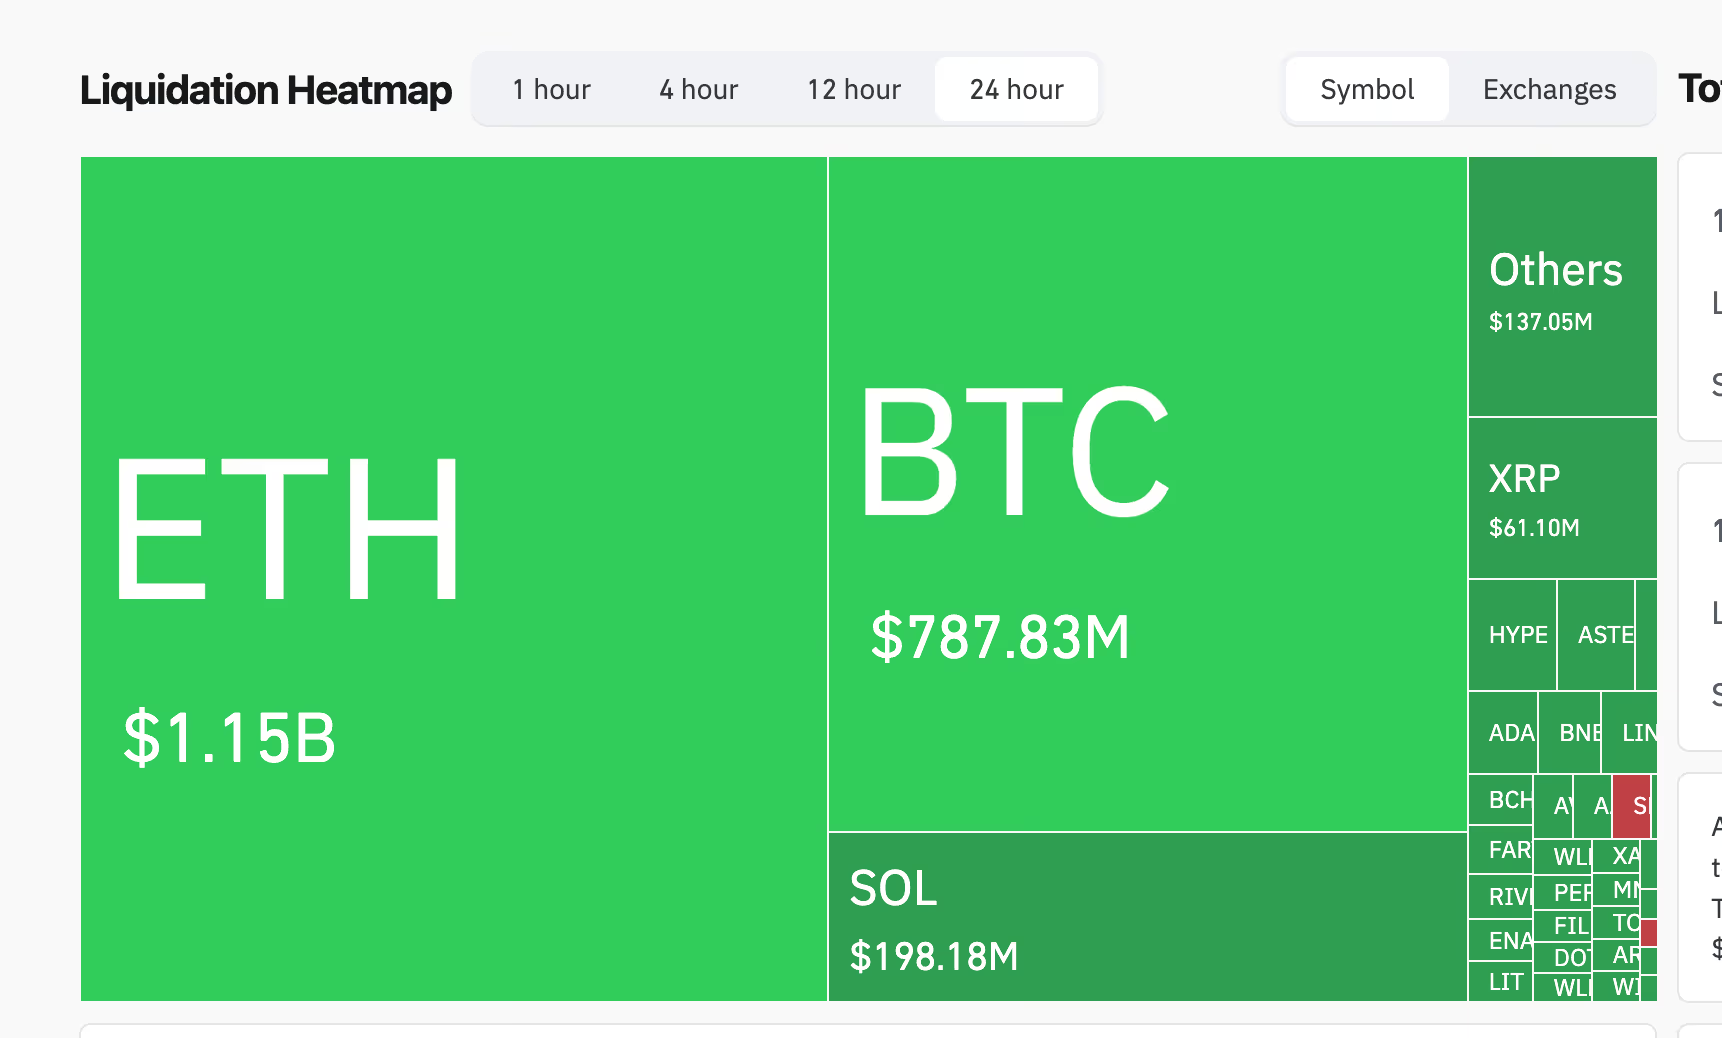
One trader lost more than $220 million on an ether position as a fresh wave of forced liquidations swept through crypto markets, pushing total losses over the past 24 hours to nearly $2.6 billion.
The largest single liquidation occurred on decentralized derivatives exchange Hyperliquid, where an ETH-USD position worth $222.65 million was wiped out, according to CoinGlass data.
The event came as ether slid as much as 17% in the past 24 hours, sharply alongside bitcoin and other major tokens during a period of thin liquidity.
In total, 434,945 traders were liquidated over the past day, with long positions accounting for the vast majority of losses. Roughly $2.42 billion of the $2.58 billion total came from bullish bets, while shorts made up just $163 million.
Hyperliquid saw the heaviest damage, recording $1.09 billion in liquidations — nearly all of it from long positions — accounting for more than 40% of total losses across exchanges. Bybit followed with $574.8 million in liquidations, while Binance recorded about $258 million.
Ether bore the brunt of the sell-off, with more than $1.15 billion in ETH positions liquidated in the past 24 hours. Bitcoin followed with roughly $788 million, while Solana saw close to $200 million wiped out, according to liquidation heatmap data.

Liquidations occur when leveraged positions are forcibly closed due to a price move beyond a trader’s margin threshold. This typically results in major losses and can trigger cascade effects during volatile moves.
Traders use liquidation data to gauge market sentiment and positioning. Large long liquidations often signal panic bottoms, while short liquidations may precede a squeeze.
Spikes in liquidations also help identify overcrowded trades and potential reversals. When paired with open interest and funding rate data, liquidation metrics can offer strategic entry or exit points, especially in overleveraged markets prone to sudden flushes or rallies.
Liquidation-driven moves have become more common during periods of low liquidity, where relatively small price declines can cascade through derivatives markets.


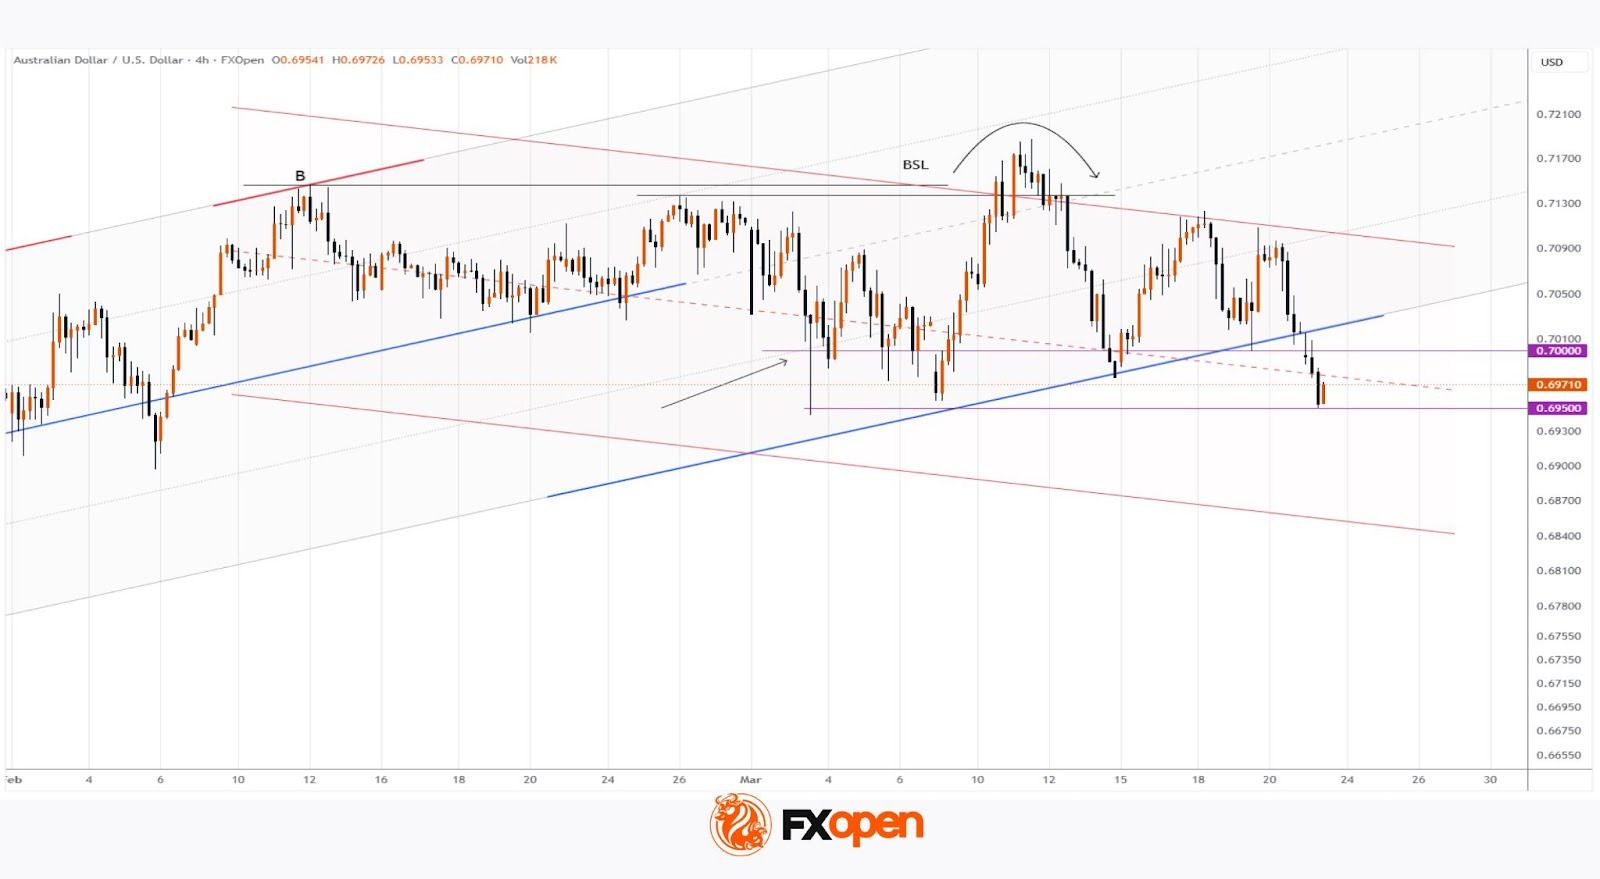
As the AUD/USD chart indicates, the Australian dollar is showing weakness against the US dollar at the start of the week. Notably, we are seeing a bearish breakout below the lower boundary of an important ascending channel that had been in place since December 2025.
Among the key bearish factors:
→ increased demand for the US dollar as a safe-haven asset amid the United States’ involvement in large-scale military actions against Iran. US President Donald Trump has threatened strikes on Iranian power infrastructure if the Strait of Hormuz remains closed, while Tehran has warned of potential attacks on key US and Israeli facilities;
→ a decline in Asian equity markets, which are sensitive to disruptions in energy supplies from the Middle East. In turn, the value of the Australian dollar is closely tied to commodity exports from Australia to China;
→ traders’ expectations ahead of inflation data due to be released on Wednesday.
Technical Analysis of AUD/USD
On 24 February, we confirmed the validity of the ascending channel, within which we:
→ identified signs of weakness during the formation of highs A and B;
→ suggested a potential break below the channel median with a move towards the psychological level of 0.7000.
Indeed, the price failed to surpass high B and moved into the lower half of the channel in early March. As shown by the first arrow, on 3 March it briefly dipped below the psychological 0.7000 level before quickly rebounding, signalling strong demand.
However, the underlying weakness near highs A and B persisted. Between 10–12 March, bulls attempted to break through these resistance levels but failed to hold above the new high. From a Smart Money Concept perspective, this resembles a liquidity grab in the buy-side liquidity (BSL) zone — a bearish signal.
In the short term, a rebound from the March low (around 0.6950) is possible. However, when considering a broader outlook, traders should not rule out:
→ the 0.7000 level turning into resistance;
→ further development of a downward trend within an increasingly well-defined descending channel.
Trade over 50 forex markets 24 hours a day with FXOpen. Take advantage of low commissions, deep liquidity, and spreads from 0.0 pips (additional fees may apply). Open your FXOpen account now or learn more about trading forex with FXOpen.
This article represents the opinion of the Companies operating under the FXOpen brand only. It is not to be construed as an offer, solicitation, or recommendation with respect to products and services provided by the Companies operating under the FXOpen brand, nor is it to be considered financial advice.
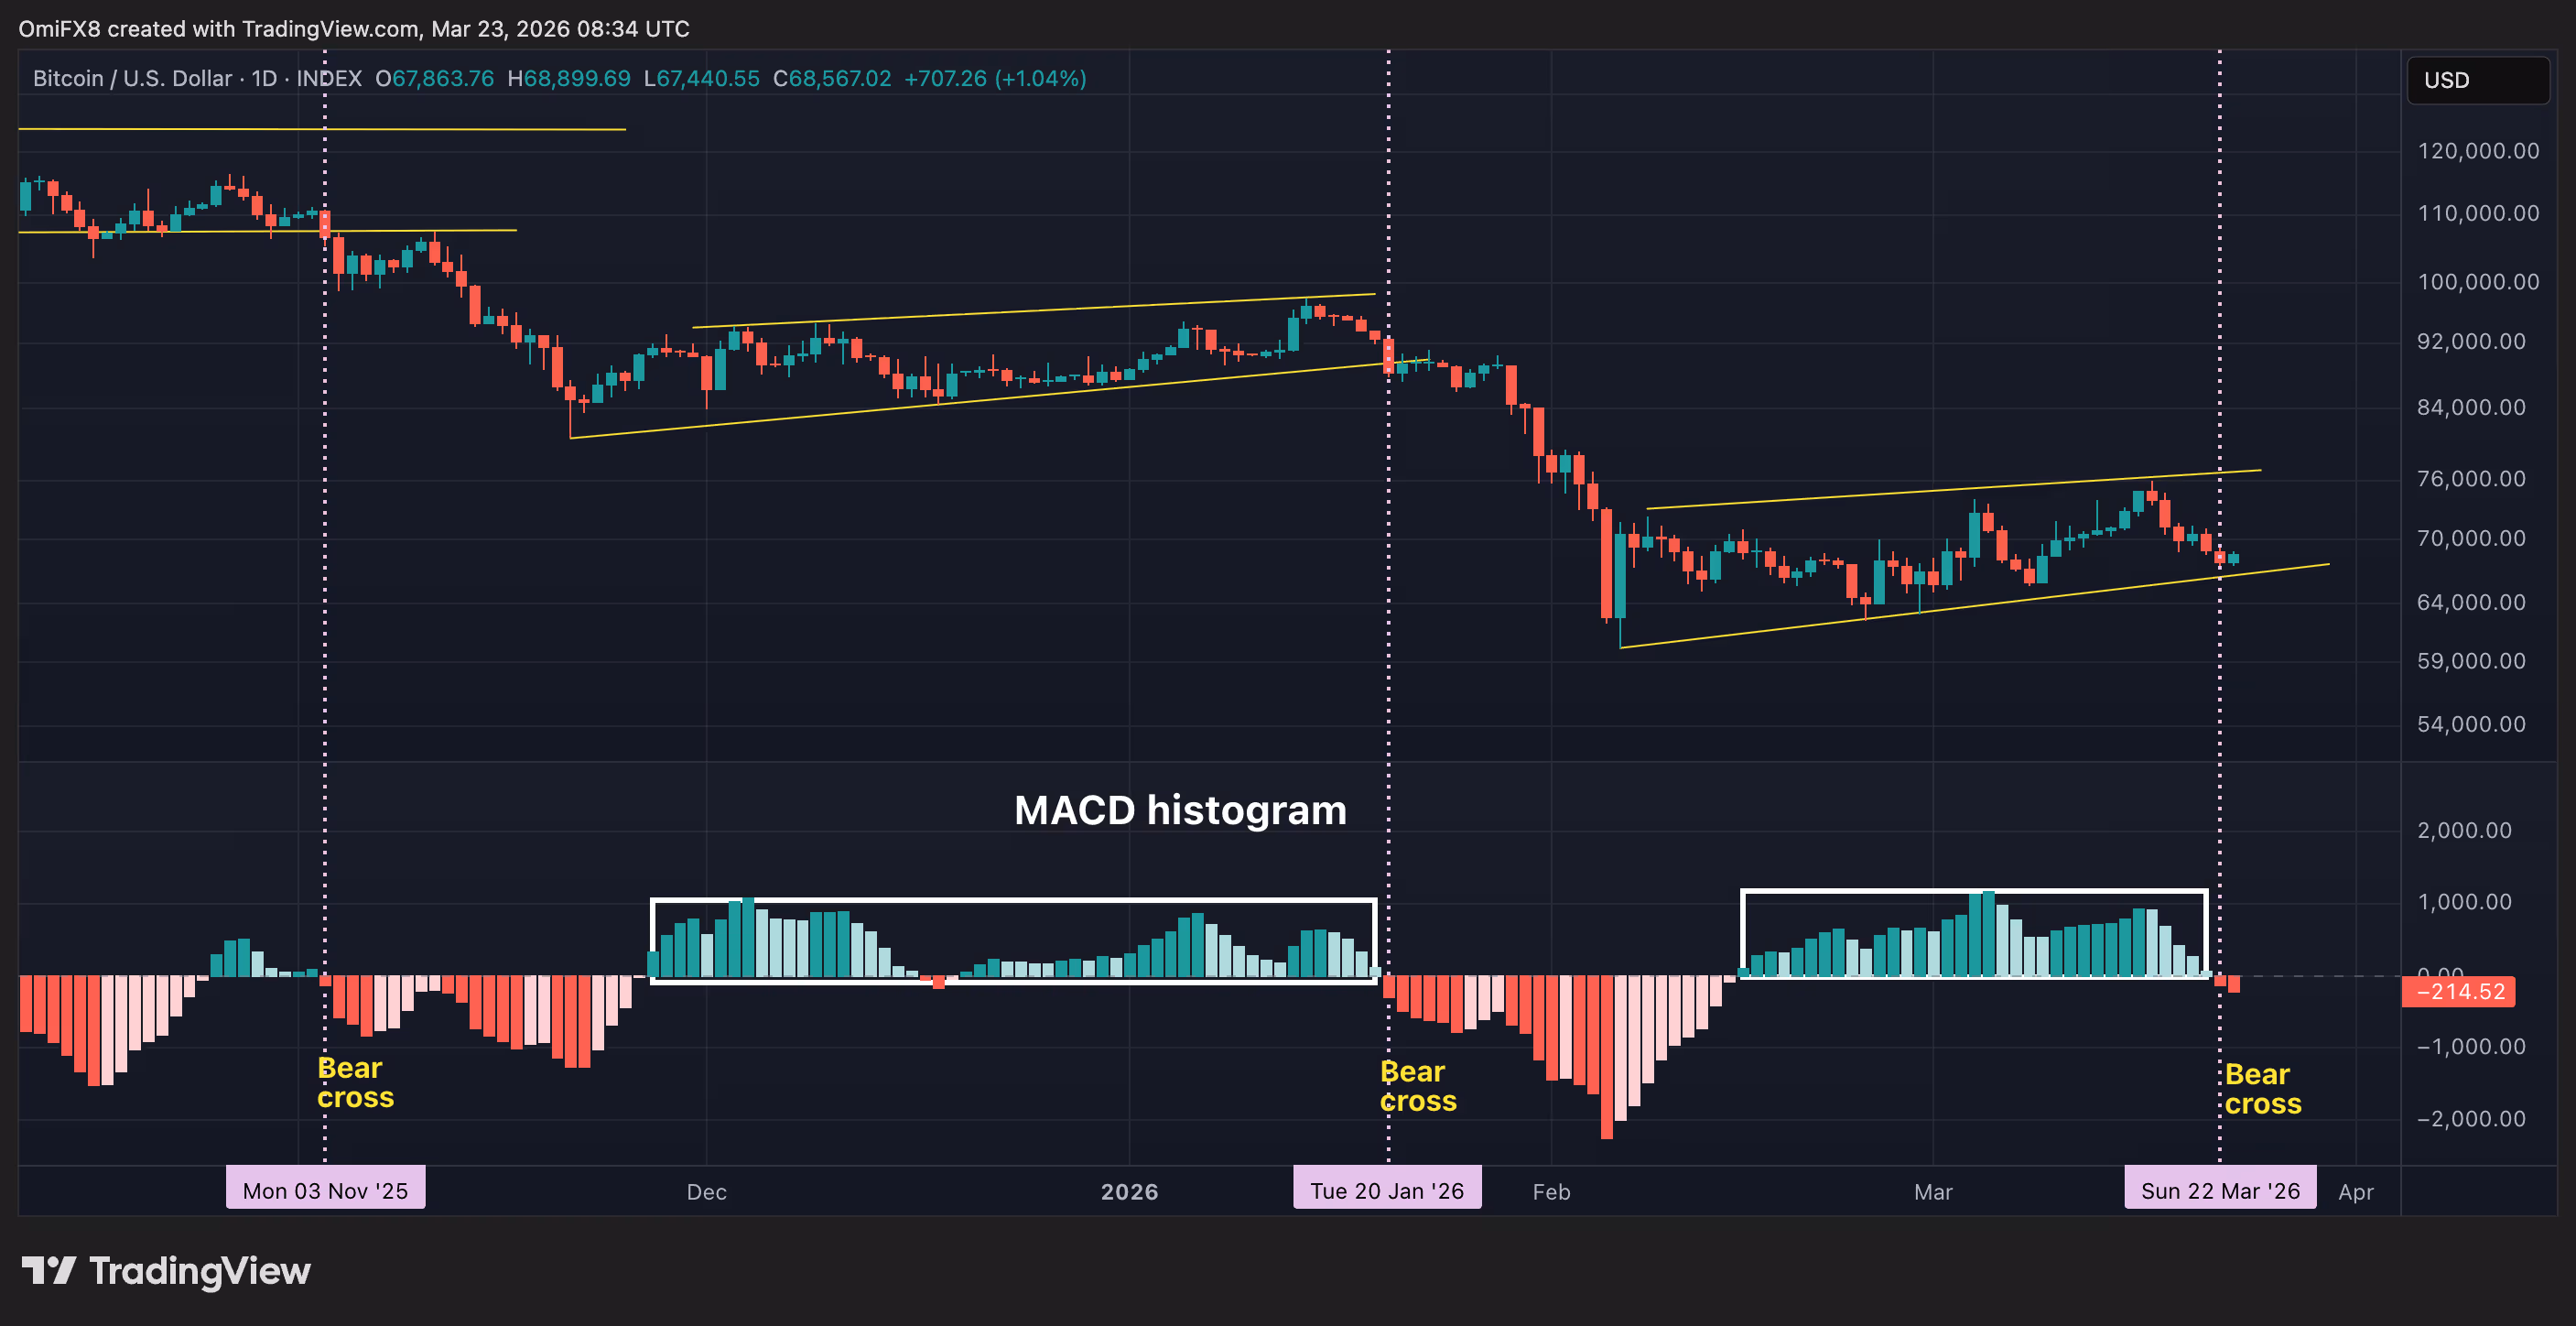
Bitcoin bulls should be on their toes: A key momentum indicator that has been disturbingly accurate at flagging selloffs since the largest cryptocurrency hit a record high in October has just triggered.
The indicator is the moving average convergence divergence histogram, better known as the MACD. It’s just crossed below zero for the third time, indicating a renewed bearish shift in momentum.
What is MACD anyway?
Before we dive into the market signal, let’s see how the MACD works.
The indicator uses two lines. The first is the MACD line, calculated by subtracting the 26-day exponential moving average (EMA) from the 12-day EMA. The gap between the two helps indicate momentum.
The other is the Signal line, which is the nine-day exponential moving average of the MACD line itself.
The really interesting part, though, is the histogram. That plots the difference between the MACD and Signal lines.
When the histogram turns positive, it signals bullish momentum; when it turns negative, as now, it signals bearish momentum. In both cases, the slope’s steepness indicates how strong the momentum is.
The indicator is popular because it cuts through market noise to provide a clear picture of trend strength and changes. And right now, it’s screaming “bearish.”

BTC gets crushed when MACD turns red
Since bitcoin topped out above $126,000 in October, MACD has developed an almost-perfect track record. When it turned bearish, bitcoin crashed hard. When it flipped bullish, there were weak bounces that went nowhere.
The evidence is damning. Bitcoin’s weekslong back-and-forth trading above $100,000 came to an abrupt end after the histogram crossed below zero on Nov. 3. Prices plummeted from around $106,000 to $80,000 by Nov. 21.
A brief bounce followed, as the MACD turned positive. But it was short-lived. Just two months later, on Jan. 20, the MACD flashed bearish again with bitcoin around $90,000. The result was the same as before — a face-ripping decline to nearly $60,000 by Feb. 6, once again followed by a minor bounce, backed by a positive MACD with upside capped at around $75,000.
So far, every bullish MACD cross has produced nothing but disappointing bounces that quickly fade, paving the way for deeper selloffs once the indicator turns red. It’s a strong signal that sellers are firmly in control, capable of crushing any attempts by the bulls to regain momentum.
And now, the indicator is flashing red again. Sure, past performance doesn’t guarantee future results. But when a signal with such a strong track record is flashing red, traders are better off paying heed than throwing caution to the wind. Bitcoin’s resilience during the war with Iran may be about to crumble.

Blockchain sleuth ZachXBT said Monday he uncovered a coordinated network of accounts on X using exaggerated or fake war and geopolitical posts to lure users into crypto scams.
The investigation identified more than 10 linked X accounts allegedly purchased with follower bases that pushed sensational content and scam links, according to an X thread and screenshots shared by ZachXBT.
The fake accounts used AI to impersonate prominent social media influencers such as Mario Nawfal, flooding X with “doomposts” and driving engagement before promoting fake crypto giveaways and pump-and-dump token schemes. “Onchain evidence suggests the scheme profited six figures,” ZachXBT said, adding that the group has been farming engagement and may be preparing another scam.
The report highlights the persistent problem of fake accounts and bot activity on social media platforms like X, even as the company says it is taking steps to combat such behavior.
Scam mechanics based on viral geopolitical posts
According to ZachXBT, the scheme started with accounts that had existing followers. These accounts repeatedly posted exaggerated war or political content, often sensational or misleading, which quickly went viral and attracted millions of views.
Once attention peaked, the fake accounts pivoted to promote fraudulent token giveaways or scam tokens. One such promotion involved the pump-and-dump crypto scam referred to as Oramama on Feb. 22, ZachXBT noted.

ZachXBT spotted numerous large accounts in the replies and quotes that fell for the engagement bait, only to boost the post’s reach unknowingly.
Social media’s scam problem persists despite platform changes
The revelation comes as social media platforms like X have been trying to clamp down on bots and scam activity.
Last month, X’s product chief Nikita Bier announced enhanced anti‑bot detection and removal measures, along with user flags for AI‑generated content, as part of broader efforts to curb automated spam and misinformation.

Still, the ZachXBT findings expose how quickly coordinated accounts can build engagement and mislead users.
Related: Coinbase-backed CoinDCX founders questioned in fraud case: Report
The investigator suggested that platform manipulation should lead to bans and legal consequences, calling social media users to review recent posts and account details before engaging with any content.
ZachXBT also shared a list of X users he believes to be involved in the scam in case they change usernames or deactivate their accounts.
Magazine: Are DeFi devs liable for the illegal activity of others on their platforms?

Quick Overview
- Zuckerberg’s personal AI assistant eliminates information bottlenecks in executive workflows.
- The technology enables Meta to reduce hierarchical layers and enhance operational efficiency.
- Executive-level AI aggregates documents, communications, and project data in real-time.
- Advanced automation allows complex multi-phase tasks with reduced human intervention.
- Meta is rolling out AI agents across teams to transform corporate structure.
Mark Zuckerberg, CEO of Meta, is currently piloting an innovative AI agent designed to enhance his operational efficiency and decision-making capabilities. This intelligent assistant focuses on delivering direct information access, eliminating bottlenecks created by traditional organizational chains. The initiative represents Meta’s strategic approach to operational optimization and enhanced productivity.
The experimental AI assistant is in active testing phases to accelerate data retrieval throughout Meta’s operations. By circumventing conventional management hierarchies, it enables rapid executive decisions and enhanced operational flow. Meta envisions this AI agent as a critical tool for simplifying high-level administrative functions.
This AI deployment reflects the company’s comprehensive strategy to embed advanced technology throughout its operations. Meta maintains a workforce of roughly 78,000 employees and continuously seeks methods to minimize organizational inefficiencies. The AI agent initiative demonstrates a commitment to enhanced leadership effectiveness while simultaneously enabling individual team members.
Executive AI Assistant Transforms Data Accessibility
The intelligent agent designed for Zuckerberg provides immediate data access, dramatically reducing dependence on traditional organizational hierarchies. It seamlessly aggregates internal documentation, conversation histories, and project intelligence for instantaneous retrieval. Through optimized information delivery, the AI assistant eliminates typical delays that hinder executive-level decisions.
Meta’s AI solution integrates with existing employee platforms that handle documentation, messaging, and team collaboration. These integrated systems facilitate enhanced workflow dynamics and connect personnel directly with necessary information. Deploying the AI agent at the executive level illustrates Meta’s dedication to cutting-edge operational excellence.
Initial testing reveals the AI assistant can autonomously handle sophisticated multi-phase workflows, supporting intricate decision-making processes. While complementing human judgment, it significantly reduces coordination time across departments. This technology exemplifies the growing trend of automation-enhanced executive operations.
Company-Wide AI Integration and Structural Evolution
Meta is broadening AI agent deployment throughout its entire workforce to optimize projects and decrease interdepartmental dependencies. Staff members utilize platforms such as MyClaw and Second Brain for efficient data access and workflow organization. These solutions operate in concert with the CEO’s AI assistant, establishing an enterprise-wide intelligent support ecosystem.
The AI agent program facilitates a more horizontal organizational framework, empowering teams to function with greater autonomy. Through reduced management tiers, Meta promotes accelerated decision cycles and enhanced individual responsibility. This operational model mirrors agile, AI-enabled organizations with streamlined structures.
Zuckerberg envisions 2026 as a pivotal year for comprehensive AI agent integration into everyday operations. The organization maintains substantial investments in cutting-edge technologies via its Meta Superintelligence Labs. Expanding AI agent utilization indicates a fundamental transformation in Meta’s approach to leadership, project execution, and internal collaboration.
The AI agent now serves as a cornerstone of Meta’s efficiency framework, optimizing executive responsibilities while empowering the broader workforce. This demonstrates that artificial intelligence has evolved beyond routine tasks to influence strategic corporate management. Meta’s implementation strategy positions the organization for accelerated, unified operations within the highly competitive technology sector.

Sweden-listed health-tech and Bitcoin treasury company H100 Group has entered into a letter of intent (LOI) with the shareholders of privately-held Norwegian Bitcoin companies Moonshot and Never Say Die to acquire all shares of the target companies in exchange for newly issued H100 stock.
The proposed transaction would be completed with newly issued H100 shares and no cash consideration, a structure intended to preserve the sellers’ Bitcoin exposure while moving the assets into a larger listed vehicle, according to a Monday press release.
A definitive agreement is expected by April 22, with closing targeted after H100’s annual general meeting. H100’s public materials currently show inconsistent AGM dates: its investor-relations calendar lists April 21, while a March 12 company notice referred to an AGM on May 21.
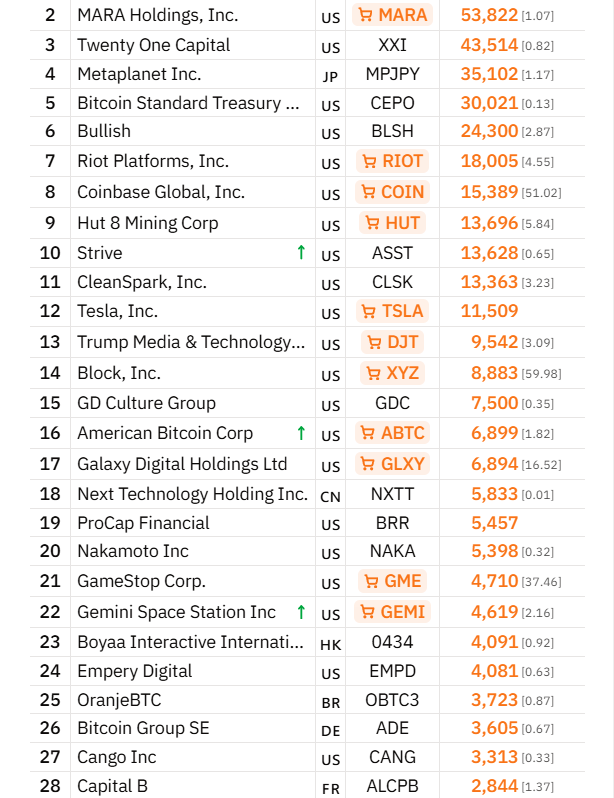
If the deal goes ahead, it would make H100 the second-largest listed Bitcoin treasury company in Europe behind Germany’s Bitcoin Group, which holds 3,605 BTC. H100 currently holds 1,051 Bitcoin, while the target companies hold about 2,450 BTC, bringing H100’s total to 3,501 BTC (worth around $239.7 million at current prices) after the deal, the release states.
H100 is the 44th largest Bitcoin treasury company worldwide. The deal would mean the company would rise to 27th in the rankings, above Cango Inc and France-based Capital B, according to Bitcointreasuries data.
The Norway deal follows H100’s completed acquisition of Switzerland-based Future Holdings AG.

“Scale, credibility and access to capital markets are increasingly important in the Bitcoin space, and this transaction would significantly strengthen H100 in all these areas,” said Sander Andersen, chairman of H100.
The “challenging” market environment makes the acquisition a welcome opportunity that strengthens the company’s Bitcoin position in a capital-efficient manner, Andersen told Cointelegraph, pledging future BTC purchases.
Related: Bitcoin whales shift $100M+ as oil spike rattles markets
Bitcoin treasury stocks remain under pressure
H100’s stock price has been declining. It fell by over 74% in the past nine months and over 26% year-to-date in 2026, Yahoo Finance data shows.

The weakness mirrors broader pressure across Bitcoin treasury stocks as Bitcoin remains well below its October 2025 all-time high.
Related: Morgan Stanley files amended S-1 for MSBT Bitcoin ETF
European Bitcoin treasury companies are continuing to accumulate BTC. Earlier on Monday, treasury company Capital B announced the acquisition of 44 Bitcoin for 2.7 million euros ($3.1 million), topping 2,888 in total BTC holdings at an average cost basis of $106,662 per coin.
H100’s average cost basis is $114,615 per BTC, Bitcointreasuries data shows.
Magazine: Bitcoin’s ‘biggest bull catalyst’ would be Saylor’s liquidation — Santiment founder

Token launches have always been a high-stakes game. From the early ICO days to the current DeFi era, one pattern remains constant: early participants often dump, leaving the project and long-term holders at the mercy of chaotic price swings. But what if there was a way to mathematically design token price behavior, balancing excitement for traders with stability for communities? Enter algorithmic price paths.
GBM-Based Launches: Predictability Meets Stochastic Modeling
At the heart of this innovation is the Geometric Brownian Motion (GBM) model, a mathematical tool long used in finance to simulate stock prices. Applied to token launches, GBM generates positive, log-normally distributed price paths that mimic natural market volatility without arbitrary spikes. In simpler terms, every token launch can now follow a realistic, predictable trajectory, allowing both traders and project teams to anticipate market behavior rather than react to chaos.
This is not about guaranteeing profits—far from it—but about reducing early-stage randomness. Traders can spot when a price is entering its “right-tail” phase (a statistical high point), while creators can prevent the sudden crashes that plague traditional launches.
Removing Early Dump Pressure
One of the most destructive forces in conventional token launches is the early dump—when insiders and early buyers immediately sell for quick gains. Algorithmic launches tackle this by tying price evolution to volume-based and time-sensitive rules. Instead of a free-for-all, the token’s trajectory grows with participation, making immediate sell-offs less profitable and creating a smoother, more sustainable introduction to the market.
Predictability vs Speculation: Striking the Balance
Critics might argue that introducing predictability kills the thrill of speculation. But algorithmic price paths are designed to blend randomness with structure. GBM ensures that while traders can anticipate trends, no one can perfectly predict the exact outcome, maintaining market excitement. Essentially, these launches reward strategy over luck, incentivizing informed trading while protecting the project’s long-term health.
Why This Matters
As DeFi matures, the era of chaotic, hype-driven launches is ending. Algorithmic price paths offer a middle ground—math-backed trajectories that reduce risk, limit early dumps, and create a healthier market for token holders. For project teams, it’s a way to foster long-term community growth; for traders, it’s a chance to engage with a more predictable, yet still dynamic, market.
In other words: the future of token launches isn’t about guesswork. It’s about smart, algorithmic design, and GBM-based launches are leading the way.
REQUEST AN ARTICLE

Decentralized, blockchain-based messaging and social platforms are moving from niche experimentation toward mainstream attention as civil unrest and state-level blackouts test the limits of centralized communication networks. Data from Exploding Topics shows that search interest in decentralized social media has surged 145% over the last five years, signaling a growing curiosity about open, permissionless communication rails. Meanwhile, decentralized messaging projects report real-world traction, including spikes in usage during protests in multiple regions.
In an interview with Cointelegraph, XMTP Labs CEO Shane Mac described a broader shift toward open protocols as users seek privacy, resilience, and independence from single corporate gatekeepers. XMTP Labs concentrates on decentralized communication technology, aiming to layer interoperability across apps that run on distributed networks rather than centralized servers.
Key takeaways
- Interest in decentralized social media has risen 145% over the past five years, according to Exploding Topics, reflecting a rising curiosity about open, censorship-resistant platforms.
- Decentralized messenger usage has shown real-world spikes, including Bitchat downloads during protests in Madagascar, Uganda, Nepal, Indonesia, and Iran, illustrating how open networks can bypass traditional shutdowns.
- Advocates argue that open-source, open-protocol ecosystems create resilience by removing single points of failure, making it harder for authorities to shutter communications entirely.
- Despite growing interest, centralized platforms are expected to remain dominant in many markets, underscoring a pragmatic coexistence between incumbents and new, open alternatives.
- Industry observers point to a broader momentum for open standards and collaborative development, with research firms projecting meaningful growth in the blockchain messaging market driven by privacy and security concerns.
Rising interest amid unrest and censorship concerns
The current decade has underscored a paradox for digital communications: centralized apps offer convenience and scale, but geopolitical stress tests reveal their vulnerability to shutdowns and censorship. Reports indicate that Russia’s blocking of messaging services and related enforcement pushback have accelerated interest in resilient, decentralized alternatives. As Mac notes, the past 15 years have been heavily centralized, and the next 15 are likely to tilt toward decentralization and open standards as users demand practical alternatives to state- or corporate-controlled tools.
Mac elaborates that the appeal goes beyond avoiding outages. He emphasizes a growing trust in open protocols over closed, proprietary systems: “I think people are starting to trust open protocols more than they trust closed companies.” This sentiment aligns with a broader industry trend that open-source software and interoperable networks can offer transparent governance and verifiable security properties that centralized platforms struggle to match at scale.
Beyond messaging alone, the conversation around open networks touches on identity, finance, and secure communications. Mac points to the broader momentum of open-source and open-standards ecosystems as a potential next era for the internet, where decentralization and interoperable layers come to define the user experience rather than a single corporate front end.
No single point of failure: how decentralization reshapes resilience
The decentralized model is lauded for distributing control and hosting across networks spanning many jurisdictions, with servers run by participants rather than a single company. In contrast, centralized services operate on a cohesive server footprint that can be targeted or shut down with coordinated action. Proponents argue that distributed architectures create a safer harbor for communication during conflict or censorship episodes because there is no easy, one-click takedown of the entire network.
Mac points to practical demonstrations of resilience, recounting how a developer integrated the XMTP network into the open-source Bitchat client after facing blockages in their home country. The fusion of mesh-network possibilities with decentralized networks means the app is less dependent on any single country or infrastructure, reducing the risk of a single point of failure.
The push toward resilience is supported by market observations: the broader blockchain messaging market is expected to grow significantly in the coming years as privacy and security become more central to how people communicate. In a March report, market researcher 360 Research Reports highlighted drivers such as heightened demand for privacy and secure messaging as key growth catalysts for the sector.
Coexistence and the real-world path forward
Despite the strong currents favoring decentralized approaches, experts do not anticipate an outright replacement of legacy platforms. Rather, the market is likely to see a continued coexistence where users and developers draw on the strengths of both paradigms. Centralized platforms offer polished user experiences, network effects, and regulatory compliance machinery, while decentralized options provide greater control, censorship resistance, and interoperability across applications and devices.
Exploding Topics also notes that social media users typically distribute their time across multiple platforms, averaging about 6.75 per month. This fragmentation suggests that new open-network options can carve out viable niches without immediately supplanting established services. The result could be a layered internet where open protocols underpin interoperable services that supplement, rather than replace, incumbent ecosystems.
The broader industry narrative is reinforced by related commentary from prominent tech leaders. For example, Telegram’s ongoing discussions about privacy and state-level pressure have been cited as part of a larger discourse on free, permissionless communication in an era of heightened regulatory scrutiny. As the market evolves, developers will need to push the envelope on usability and interopability to keep momentum alive for decentralized messaging and social platforms.
Open source momentum and what comes next
Open-source software, open protocols, and open financial systems are increasingly framed as the building blocks of the next internet era. Mac warns that the next phase will hinge on both technical innovation and broader adoption by users who value privacy and autonomy. The narrative is that decentralized networks will not instantly displace the old guard but will progressively expand the set of tools available to people who want more control over their communications.
What remains uncertain is how policymakers and platform operators will navigate the balance between security, privacy, and user protection as these technologies scale. Investors, builders, and users should watch for continued experimentation around interoperability between decentralized networks and traditional apps, as well as regulatory developments that could shape access to messaging infrastructure across borders.
As the industry quietly tests new configurations—combining open-source clients with distributed networks and mesh-ready architectures—the fundamental question persists: can open, decentralized communications achieve the reliability and polish of centralized services, while preserving the freedoms that open protocols promise?
Readers should keep an eye on how these dynamics unfold in regions facing connectivity pressures and policy changes, as the next wave of real-world deployments could redefine what it means to communicate securely and privately in a connected world.


On-chain investigator ZachXBT has reported a coordinated group of social media accounts that used war-related and political posts on X to direct users toward crypto scams.
Summary
- ZachXBT traced more than 10 X accounts using war panic posts to attract users into crypto scams.
- The network bought follower-rich accounts, reposted fear-driven content, then promoted fake giveaways and pump-and-dump tokens.
- On-chain data suggests the coordinated scam cluster earned six figures through misleading posts and social engineering.
His latest thread says the network included more than 10 accounts and relied on fear-driven content to gain reach during the ongoing Middle East conflict.
ZachXBT said the operators bought accounts that already had followers. They then began posting repeated negative updates about war and politics several times a day. The goal was to attract reactions from users who were already following fast-moving global events.
He described the pattern as a form of engagement farming tied to fraud. According to his thread, the accounts used emotionally charged posts to pull in views and replies. After gaining reach, the operators shifted attention toward scam content linked to crypto promotions.
ZachXBT said the scheme followed a clear sequence. The accounts would post alarming content, then use other linked accounts to repost the same messages and increase visibility. After that, they promoted fake giveaways or direct scam offers connected to crypto.
He added that the operators often changed usernames after running the campaigns. That step made the network harder to track and allowed the same accounts to appear unrelated over time. The use of several accounts also helped the group repeat the method across different topics and audiences.
Moreover, ZachXBT said some large X accounts replied to or interacted with the posts without knowing the source or purpose behind them. That activity gave the content wider exposure and helped it spread further across the platform.
He said the method relied on social engineering as much as account coordination. Users often react more quickly to negative or alarming posts, especially during war-related news cycles. That reaction can push a post higher in feeds and place scam promotions in front of more people.
On-chain data linked the network to crypto fraud
ZachXBT said 10 accounts in the monitored cluster promoted pump-and-dump crypto scams. He wrote that “on-chain evidence suggests the scheme profited six figures.” His statement tied the social media activity to financial gains rather than random spam.
He also warned about the broader risk of the tactic. ZachXBT wrote that “it’s scary to think about” how easily the same method could be used on a larger scale. He said platform manipulation should face bans and legal action because many users on X already fall for false information shared through coordinated posts.
Key Highlights
-
Company proposes $70M digital asset purchase awaiting shareholder vote
-
Current holdings include 4,091 BTC valued at approximately $280M
-
Strategic Ether position complements Bitcoin-focused treasury approach
-
Current market conditions present advantageous entry points for accumulation
-
Digital asset strategy supports company’s transition to Web3 gaming platforms
Gaming company Boyaa Interactive International has announced intentions to purchase up to $70 million in additional cryptocurrency assets. The proposed acquisition hinges on receiving shareholder consent and represents a significant component of the company’s Web3 transformation initiative. Management remains committed to treasury enhancement regardless of current market turbulence.
Bitcoin Holdings Form Foundation of Corporate Treasury
Boyaa maintains its focus on Bitcoin as the primary digital asset within its treasury framework. Currently, the organization possesses 4,091 Bitcoin with an estimated worth approaching $280 million. This substantial position establishes Boyaa as one of the leading corporate Bitcoin custodians internationally.
Throughout 2024, the company systematically expanded its Bitcoin position, demonstrating unwavering commitment to digital asset accumulation. Between August and November alone, Boyaa invested approximately $80.5 million to strengthen its cryptocurrency reserves. These calculated purchases demonstrate management’s dedication to building long-term value through digital assets.
Furthermore, Boyaa occupies the position as the 23rd-largest corporate Bitcoin holder on a global scale. Within the Asia-Pacific geography, it ranks third by total Bitcoin ownership. Such positioning enhances the company’s prominence within regional cryptocurrency markets.
Ethereum Holdings Enhance Portfolio Balance
Beyond Bitcoin, Boyaa has established a position in Ether to achieve greater treasury diversification. Currently, the company controls 302 Ether tokens worth more than $600,000. Though smaller in scale, this holding provides important portfolio balance alongside its substantial Bitcoin reserves.
Management selects digital assets based on liquidity depth and widespread market acceptance for extended holding periods. Ether satisfies these requirements and reinforces Boyaa’s multi-asset strategy. The firm positions Ether as a complementary asset to Bitcoin within its overall framework.
The company leverages its cryptocurrency portfolio to advance Web3 initiatives across its operations. Digital assets have been woven into gaming platforms and underlying infrastructure. This integration creates synergy between treasury operations and core business innovation.
Strategic Timing Leverages Current Market Weakness
Rather than purchasing during bull markets, Boyaa intends to execute acquisitions amid unfavorable price action. Cryptocurrency markets have retreated roughly 45% from October peaks. Such conditions enable cost-effective asset accumulation for long-term holders.
Many corporations have paused or reversed crypto reserves expansion during this period. Mining operations and other institutional holders have lightened positions recently. Boyaa distinguishes itself by persisting with expansion plans despite industry headwinds.
The company actively transforms from conventional gaming operations toward blockchain-enabled experiences. Recent launches include Web3 gaming offerings such as a poker application featuring cryptocurrency incentives. These developments create natural alignment between treasury growth and evolving business operations.


Federal prosecutors told a judge that a letter purportedly sent by Sam Bankman-Fried from prison was actually shipped via FedEx from somewhere else entirely, suggesting someone outside impersonated him.
The filing adds an unusual wrinkle to Bankman-Fried’s post-conviction fight. The FTX founder, sentenced to 25 years for fraud and conspiracy, has been pursuing a new trial from Federal Correctional Institution Terminal Island in San Pedro, California.
Prosecutors say the suspect letter was docketed March 16 but shipped from Palo Alto or Menlo Park, mislabeled the prison as a state facility, and carried a typed “/s/” instead of an actual signature.
Bureau of Prisons regulations bar inmates from sending mail through private carriers like FedEx, prosecutors noted.
Taken together, prosecutors said these discrepancies provide “reason to doubt” the letter was sent by Bankman-Fried.
The government did not accuse the defendant or his associates of fabricating the document, but the filing signals a willingness to challenge the reliability of materials submitted as part of his effort to secure a new trial.
Bankman-Fried has repeatedly argued that he did not receive a fair trial and has pointed to what he claims is new evidence, including the later recovery of customer funds through the FTX bankruptcy process.
Appellate judges have signaled skepticism toward that argument, stressing that the case turned on how customer funds were used and represented at the time, not whether creditors were later made whole.
Manchester’s Victoria North named in Government list of seven new towns

AUD/USD Falls Below Key Support
Bachelorette’s Doug Mason Addresses Bachelor Fan Speculation


-

 Fashion3 days ago
Weekend Open Thread: Adidas – Corporette.com
-
 Crypto World2 days ago
NIO (NIO) Stock Plunges 6.5% as Shelf Registration Sparks Dilution Worries
-

 Politics3 days ago
Jenni Murray, Long-Serving Woman’s Hour Presenter, Dies Aged 75
-
 Tech6 days ago
Are Split Spacebars the Next Big Gaming Keyboard Trend?
-

 Crypto World1 day ago
Best Crypto to Buy Now: Strategy Just Spent $1.57 Billion on Bitcoin During Fear While Early Investors Quietly Enter Pepeto for 150x Potential
-

 News Videos5 days ago
RBA board divided on rate cut, unusually buoyant share market | Finance Report | ABC NEWS
-

 Crypto World2 days ago
Bitcoin Price News: Bhutan Sells $72 Million in BTC Under Fiscal Pressure, but the Smart Money Entering Pepeto Sees What the Market Does Not
-

 Business7 days ago
Australian shares drop as Iran war enters third week
-

 Crypto World7 days ago
Crypto Lender BlockFills Enters Chapter 11 with Up to $500M in Liabilities
-

 Politics5 days ago
The House | The new register to protect children from their abusers shows Parliament at its best
-

 Fashion7 days ago
25 Celebrities with Curly Hair That Are Naturally Beautiful
-

 Tech3 days ago
inKONBINI Lets You Spend Summer Days Behind the Register
-
 Politics6 days ago
Real-time pollution monitoring calls after boy nearly dies
-

 Crypto World5 days ago
Canada’s FINTRAC revokes registrations of 23 crypto MSBs in AML crackdown
-
 NewsBeat5 days ago
Residents in North Lanarkshire reminded to register to vote in Scottish Parliament Election
-

 Business7 days ago
Meta planning major layoffs as AI spending and automation reshape workforce
-

 News Videos5 days ago
PARLIAMENT OF MALAWI – PAC MEETING WITH REGISTRAR OF FINANCIAL ON AMARYLLIS HOTEL – INQUIRY LIVE
-

 Politics4 days ago
Gender equality discussions at UN face pushbacks and US resistance
-

 Business18 hours ago
No Winner in March 21 Drawing as Prize Rolls to $133 Million for Next
-
Entertainment7 days ago
Oscars reunite Rob Reiner supergroup of 17 stars for emotional tribute: Here's who appeared on stage
You must be logged in to post a comment Login