
Crypto World
Pi Network price rises 10% as $0.09 breakout nears

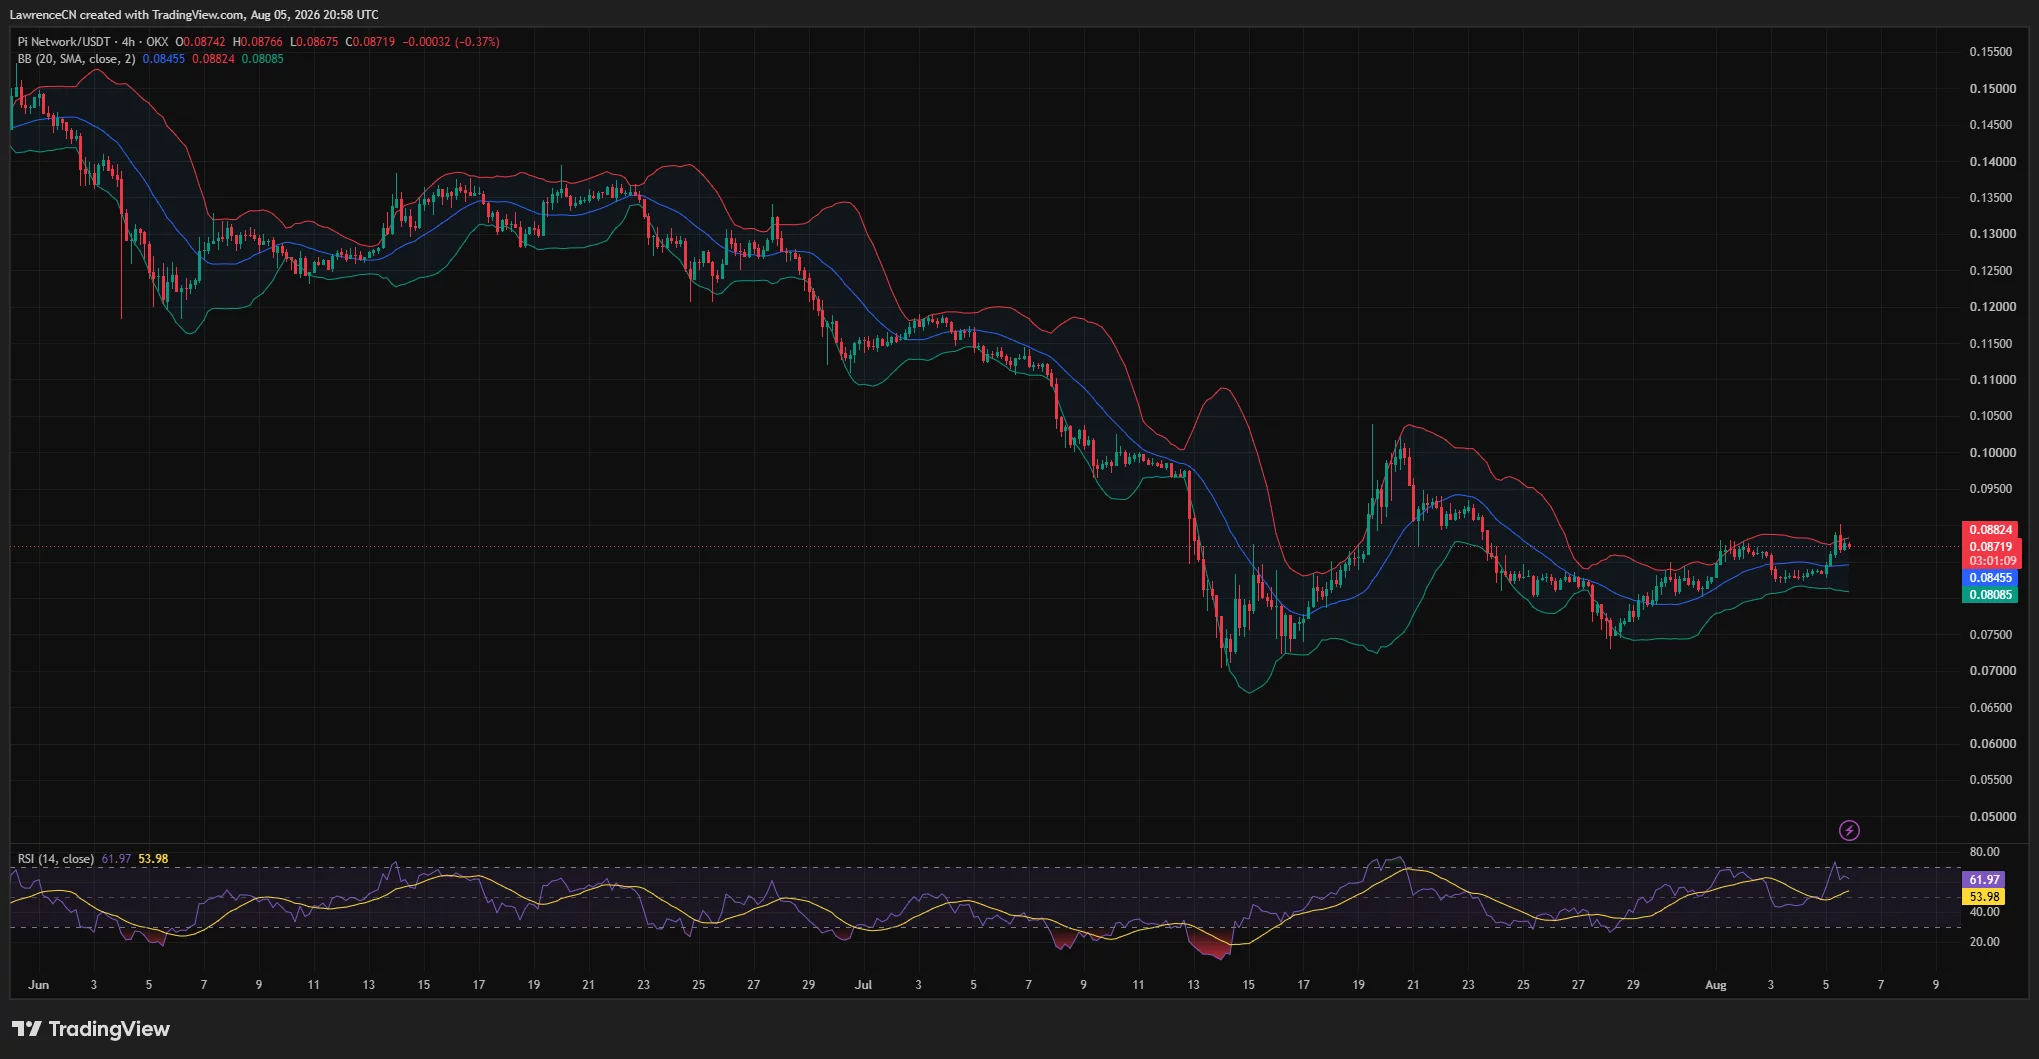
Pi Network price gained more than 10% this week as rising volume, the Protocol 26 upgrade, and a new RoboPay integration improved short-term demand.
Summary
- Pi Network price gained more than 10% this week, with trading volume rising 75% to $11.5 million.
- The token is testing resistance between $0.0882 and $0.0900 on the 4-hour chart.
- PI reclaimed its 20-day SMA at $0.08513, while Chaikin Money Flow turned positive.
- Protocol 26 requires Mainnet node operators to upgrade by Aug. 11 to remain connected.
Pi Network price tests $0.09 resistance
According to data from crypto.news, Pi Network (PI) price traded near $0.0872 on Wednesday after gaining more than 10% over the past week. The token rose as high as $0.0902 during the latest daily session before giving back part of the move.
Trading activity also increased. PI’s 24-hour volume rose 75% to approximately $11.5 million, showing that the recovery attracted more market participation than earlier low-volume moves.
The 4-hour chart shows PI pressing against the upper Bollinger Band at $0.08824. That level overlaps with the $0.088–$0.090 resistance zone that has limited several recovery attempts since late July.
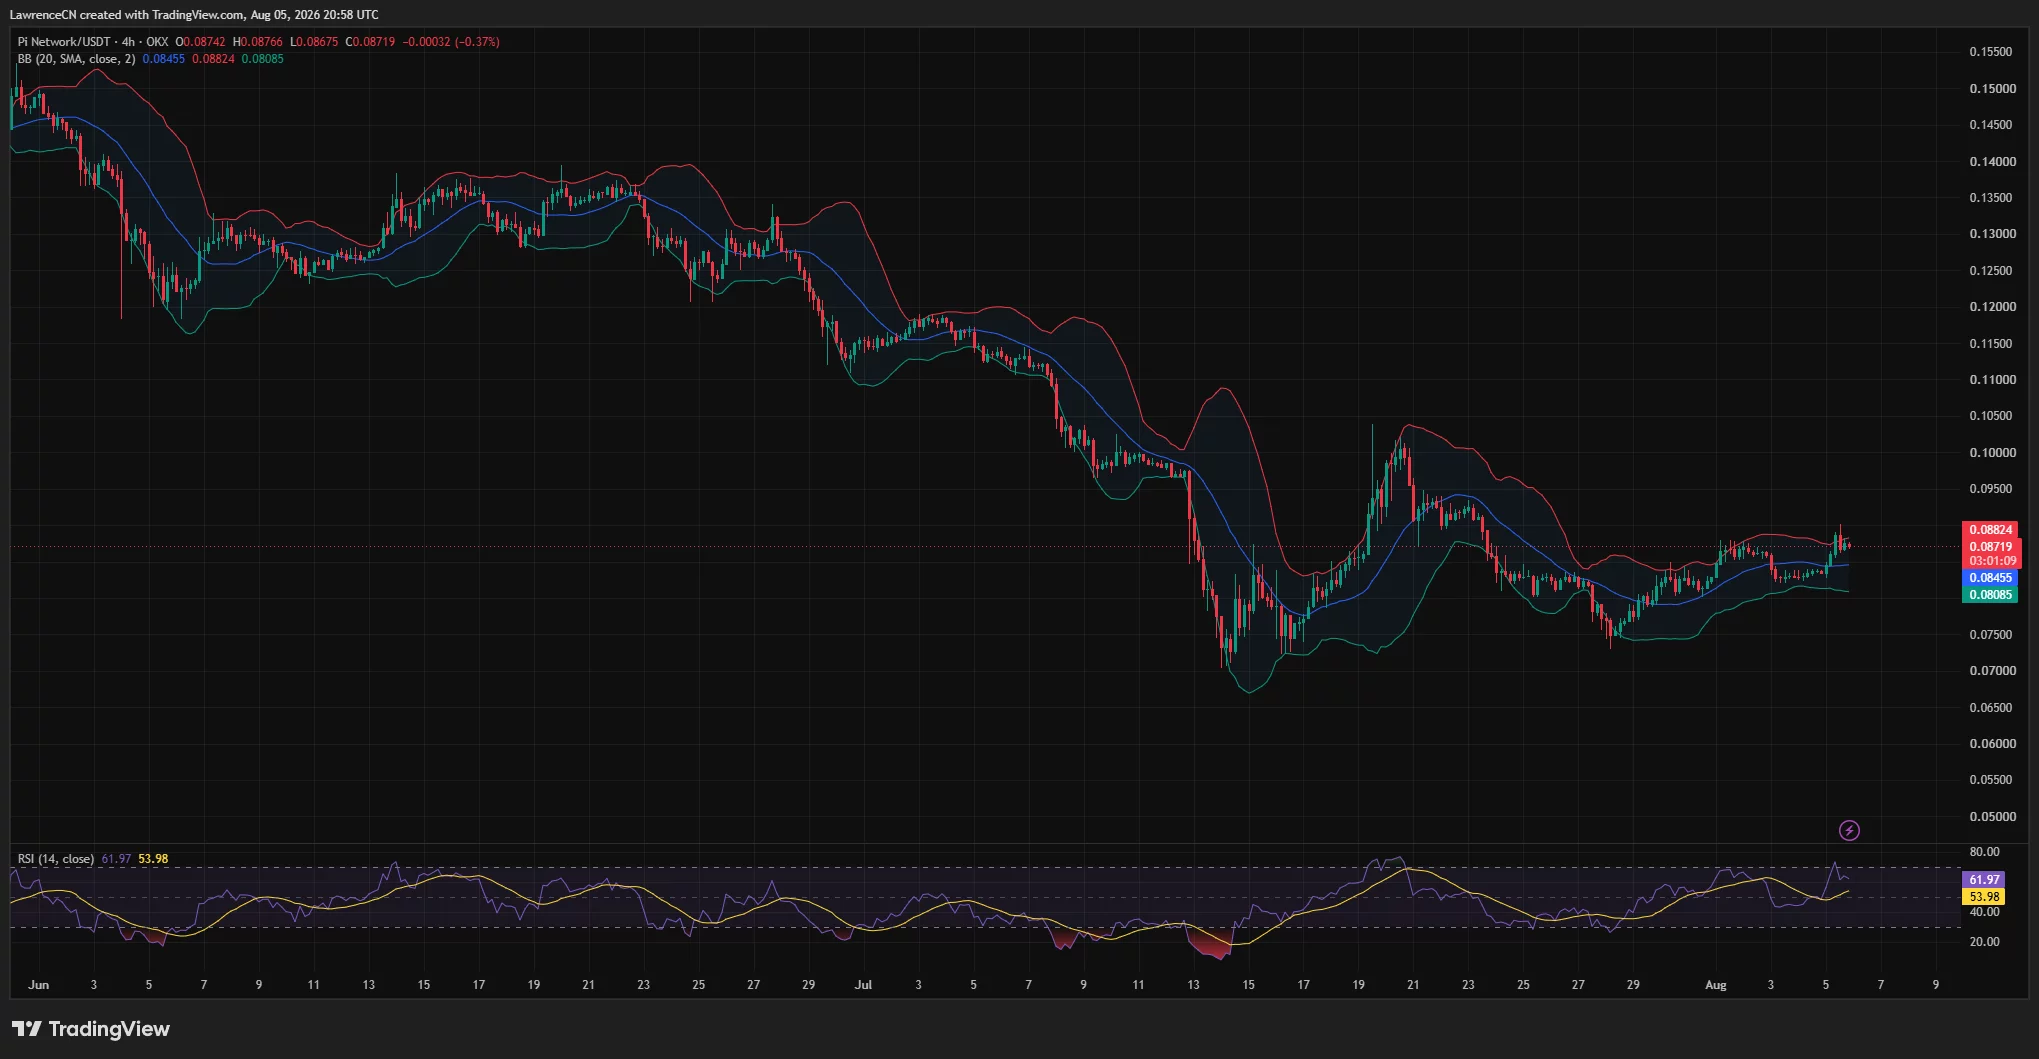
A 4-hour close above $0.090 would provide the first clear sign that buyers have broken the immediate ceiling. Until that happens, the latest advance remains a resistance test rather than a confirmed breakout.
PI’s 4-hour Relative Strength Index stood at 61.97, above its signal average of 53.98. The reading points to strengthening momentum but remains below the conventional overbought threshold of 70.
Protocol 26 deadline supports sentiment
The recovery comes as Pi Network prepares to complete its Protocol 26 Mainnet upgrade. The Pi Core Team has given node operators until Aug. 11 to install the update through the Pi Node software.
Operators who fail to upgrade risk losing their connection to the Mainnet, according to the project’s official announcement.
Protocol 26 follows eight upgrades completed during recent months. Pi Network has described it as a major step before Protocol 27, the final update currently planned in this upgrade cycle.
The upgrades are intended to bring the network’s protocol features and functionality up to date. However, they do not guarantee greater demand for PI or a sustained price recovery. Traders will be watching whether the technical work leads to increased development and activity across the ecosystem.
The Aug. 11 deadline may remain a short-term sentiment driver. Price volatility could rise around the event if node participation or the upgrade process differs from market expectations.
RoboPay adds a potential PI payment use case
Fabric Foundation also announced that Pi Network had joined RoboPay as a payment partner. The group said PI would be used to pay for robot services across the Fabric network.
“Pi will be used to pay for robot services across the Fabric network,” the Fabric Foundation said.
RoboPay is designed to let developers assign prices and execution rules to robotic tasks. A payment-authorized request can trigger a robot to perform an action and return a structured result once the task is completed or rejected, according to Fabric Foundation documentation.
Potential services include deliveries, security patrols, industrial inspections and interactions with humanoid assistants. These examples describe the planned scope of the system, however, and do not establish that each service is already widely available to PI holders.
The integration gives PI another proposed utility route beyond transfers and ecosystem applications. Its effect on token demand will depend on the availability of RoboPay services, user adoption, and the number of transactions ultimately settled with PI.
PI price faces larger moving-average barriers
The daily chart offers an improving short-term picture but shows that PI has not reversed its wider downtrend.
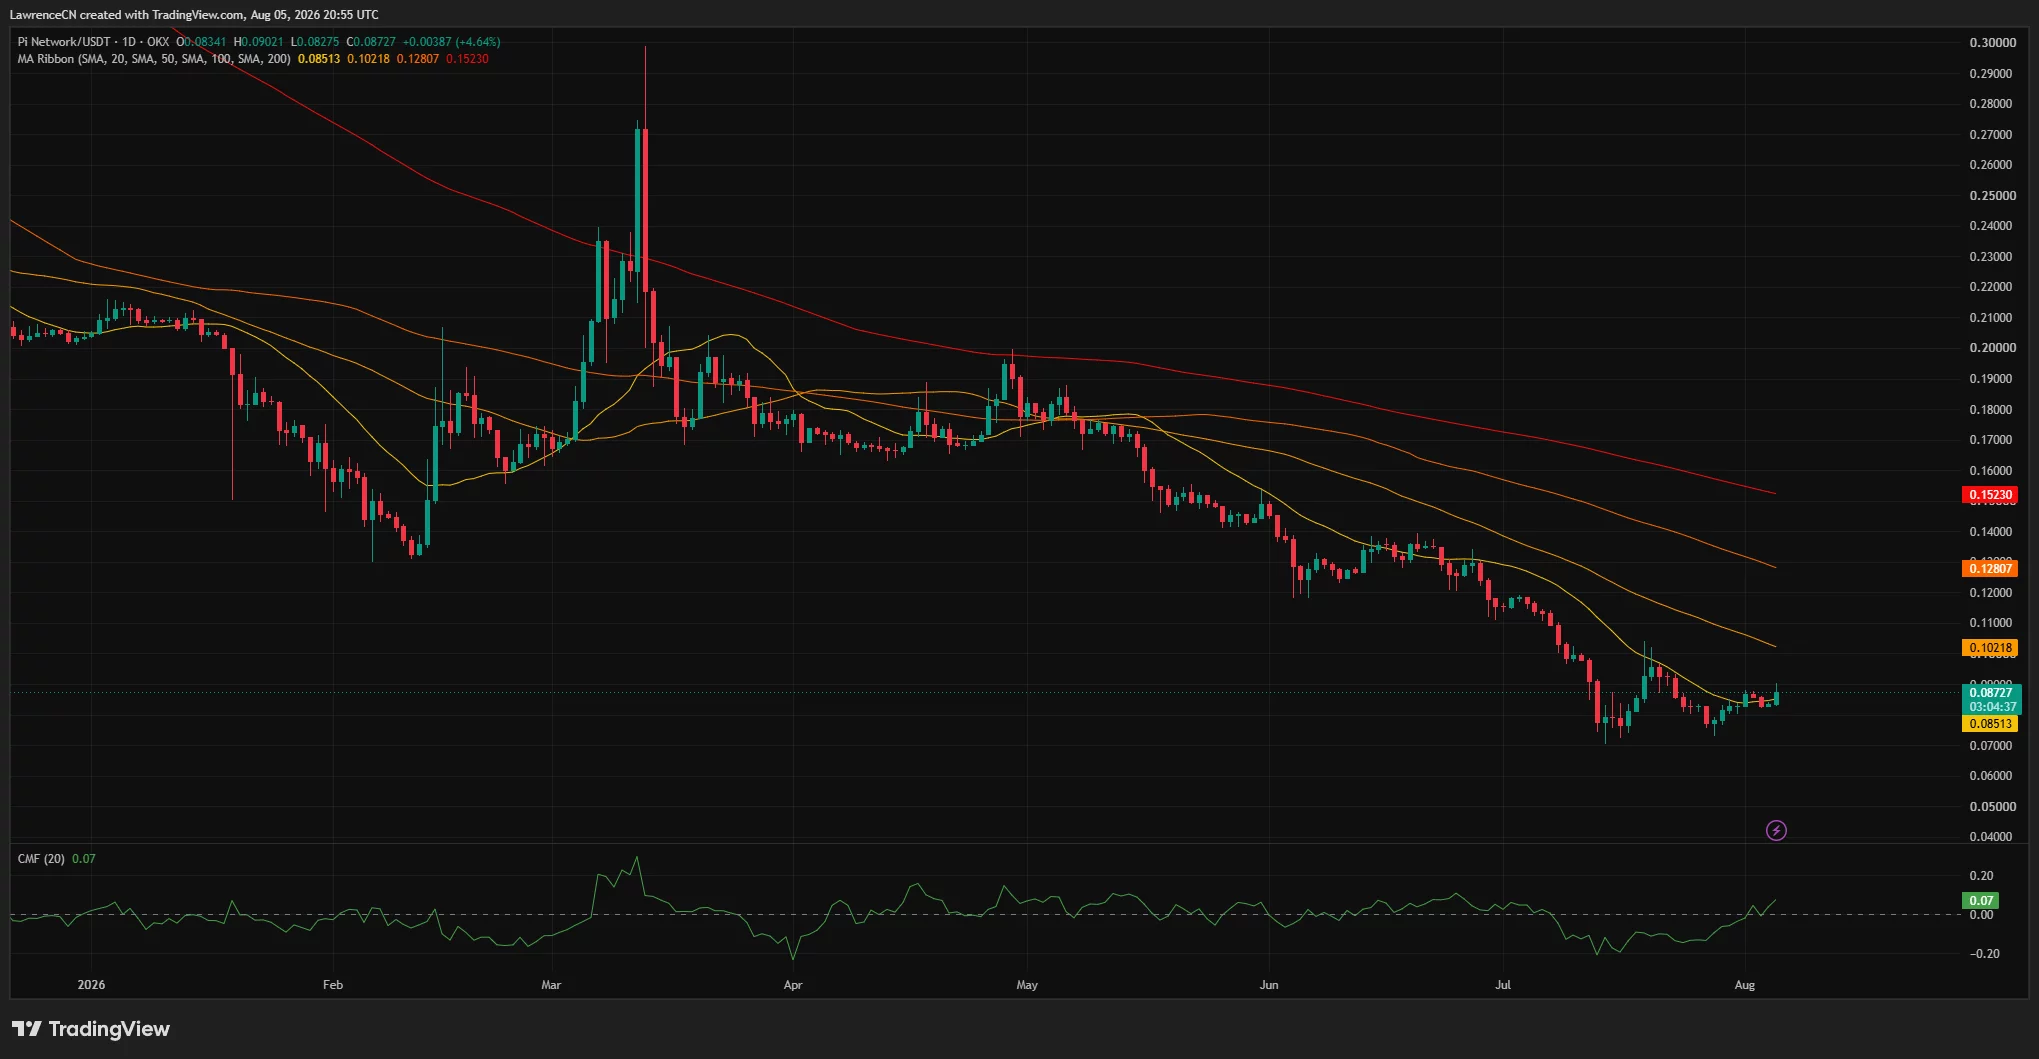
PI closed around $0.08727, above its 20-day simple moving average of $0.08513. Reclaiming that line gives buyers an initial support level following the rebound from July’s low near $0.070.
Chaikin Money Flow increased to 0.07, moving above zero as capital flows shifted modestly toward buyers. A sustained positive reading would add support to the recovery case.
The larger moving averages remain well above the market, however. PI trades below its 50-day SMA at $0.10218, the 100-day SMA at $0.12807, and the 200-day SMA at $0.15230. Their bearish alignment reflects the decline that has continued since the first quarter.
If PI closes above $0.090, the psychological $0.10 level and the 50-day SMA near $0.1022 would form the next resistance area. That would represent an advance of roughly 17% from $0.0872.
On the downside, the Bollinger Band midpoint and 20-day SMA create initial support around $0.0845–$0.0851. Losing that zone could expose the lower 4-hour band near $0.08085. A deeper reversal would put the July base between $0.070 and $0.075 back in focus.
For US traders, the setup also carries venue risk because PI access and supported trading pairs can differ by platform and jurisdiction. The displayed price comes from the OKX PI/USDT market, so spreads and available liquidity may not match those on other venues.
PI’s immediate outlook therefore depends on whether buyers can convert the current volume increase into a close above $0.090. Protocol 26 and RoboPay have improved sentiment, but the token must still clear its longer-term moving averages to establish a broader reversal.
Disclosure: This article does not represent investment advice. The content and materials featured on this page are for educational purposes only.

SpaceX stock fell as much as 11% on Wednesday after record AI investment, and an approaching share unlock overshadowed the company’s stronger-than-expected second-quarter revenue.
Summary
- SpaceX generated $7.8 billion in Q2 revenue, up 92% from a year earlier.
- AI-related capital expenditure jumped to $15.8 billion, compared with $749 million a year ago.
- Piper Sandler cut its SPCX price target to $140 from $156 while retaining a Neutral rating.
- SPCX faces further pressure as its tradable share count could rise by more than 140%.
SpaceX revenue beats Wall Street estimates
SpaceX reported $7.8 billion in second-quarter revenue, exceeding Wall Street’s estimate of about $6.8 billion. Revenue rose 92% from $4.1 billion in the same period last year, marking a strong first earnings report since the company’s June Nasdaq debut.
Starlink remained the company’s main financial engine. Revenue from the satellite connectivity business rose 66%, while SpaceX’s AI revenue increased by about 250% from a year earlier. The company’s total operating loss narrowed to $143 million from $970 million, according to Reuters.
However, investors focused on how much SpaceX spent to generate that growth. Total quarterly capital expenditure climbed above $18 billion, including $15.83 billion allocated to AI infrastructure. That compared with only $749 million in AI spending during the year-ago period.
Finance chief Bret Johnsen said capital spending would likely remain near current levels over the next several quarters. The outlook raised questions about how long Starlink may need to fund the company’s AI and space-development plans.
AI spending overshadows SpaceX earnings beat
SpaceX is expanding its computing capacity as Elon Musk positions AI as a major part of the company’s future valuation. AI revenue reached roughly $2.6 billion during the quarter, supported by new cloud-computing contracts.
Still, the amount committed to AI infrastructure exceeded market forecasts. At $15.8 billion, AI capital spending more than doubled from $7.7 billion in the first quarter and accounted for most of SpaceX’s total investment during Q2.
The spending contributed to a sharp change in sentiment after the results. SPCX initially fell 7.5% in after-hours trading before extending its decline to more than 11% in Wednesday’s pre-market session. The drop came despite a positive session for broader US equity futures, suggesting that company-specific concerns drove the move.
SpaceX also reported a net loss of $541 million, although adjusted earnings before interest, taxes, depreciation and amortization nearly tripled to $3.5 billion, according to Fortune.
Analysts remain divided on SPCX stock
Piper Sandler lowered its SpaceX price target from $156 to $140 while maintaining a Neutral rating. The brokerage raised its earnings forecasts but cited valuation pressure, uncertain AI cloud contract durability and higher anticipated spending.
The firm now expects fiscal 2027 capital expenditure of about $65 billion, roughly $17 billion above its previous projection. It also warned that the number of tradable SPCX shares could soon increase by more than 140%, creating a potential supply overhang.
Other Wall Street firms retained more bullish forecasts. Bank of America reaffirmed its Buy rating and $235 target, while JPMorgan raised its target from $225 to $240. Mizuho maintained a positive rating and a $200 target.
These forecasts indicate that analysts remain constructive on SpaceX’s long-term business despite concerns about near-term spending and dilution.
SPCX chart puts $104.91 support in focus
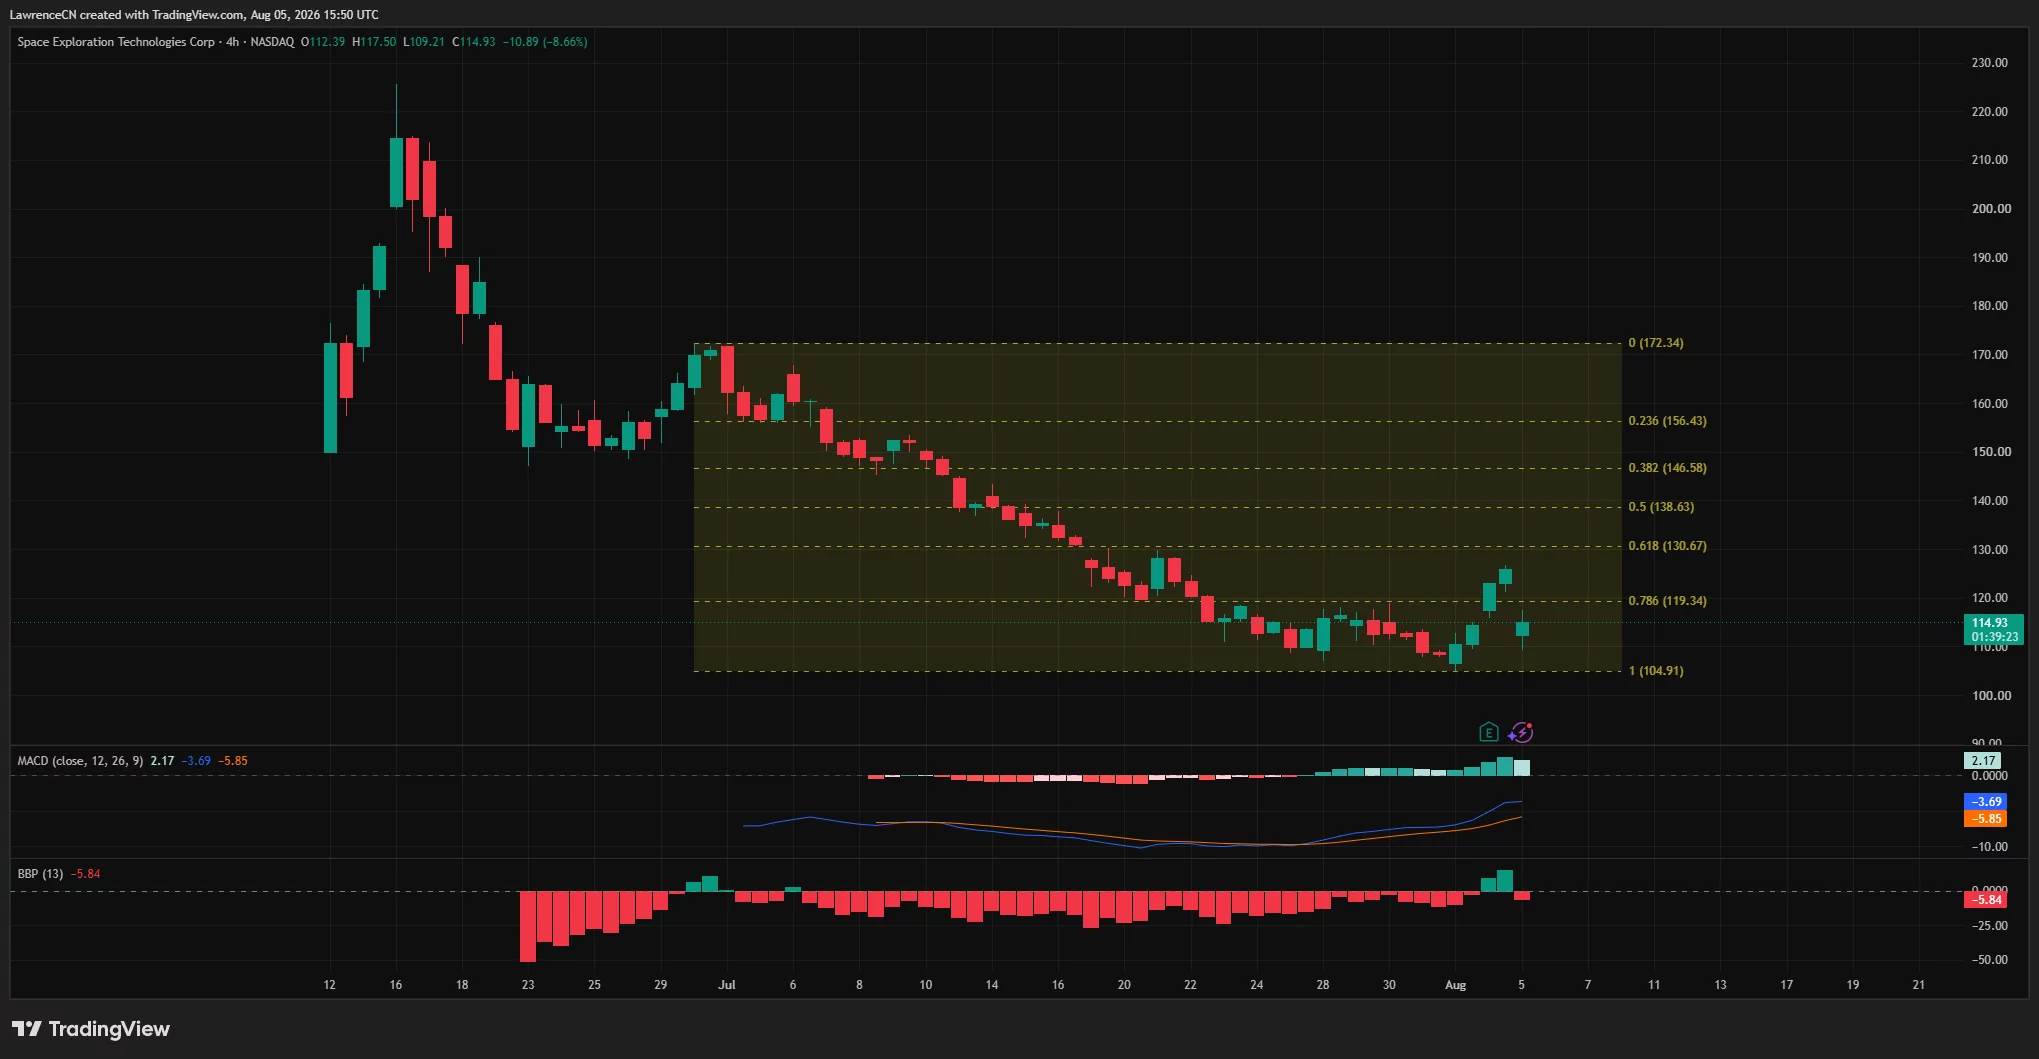
SPCX traded at $114.93 on the four-hour chart, down 8.66% during the session after touching an intraday low of $109.21. The stock’s attempted rebound was rejected near $126, returning it below the 78.6% Fibonacci retracement at $119.34.
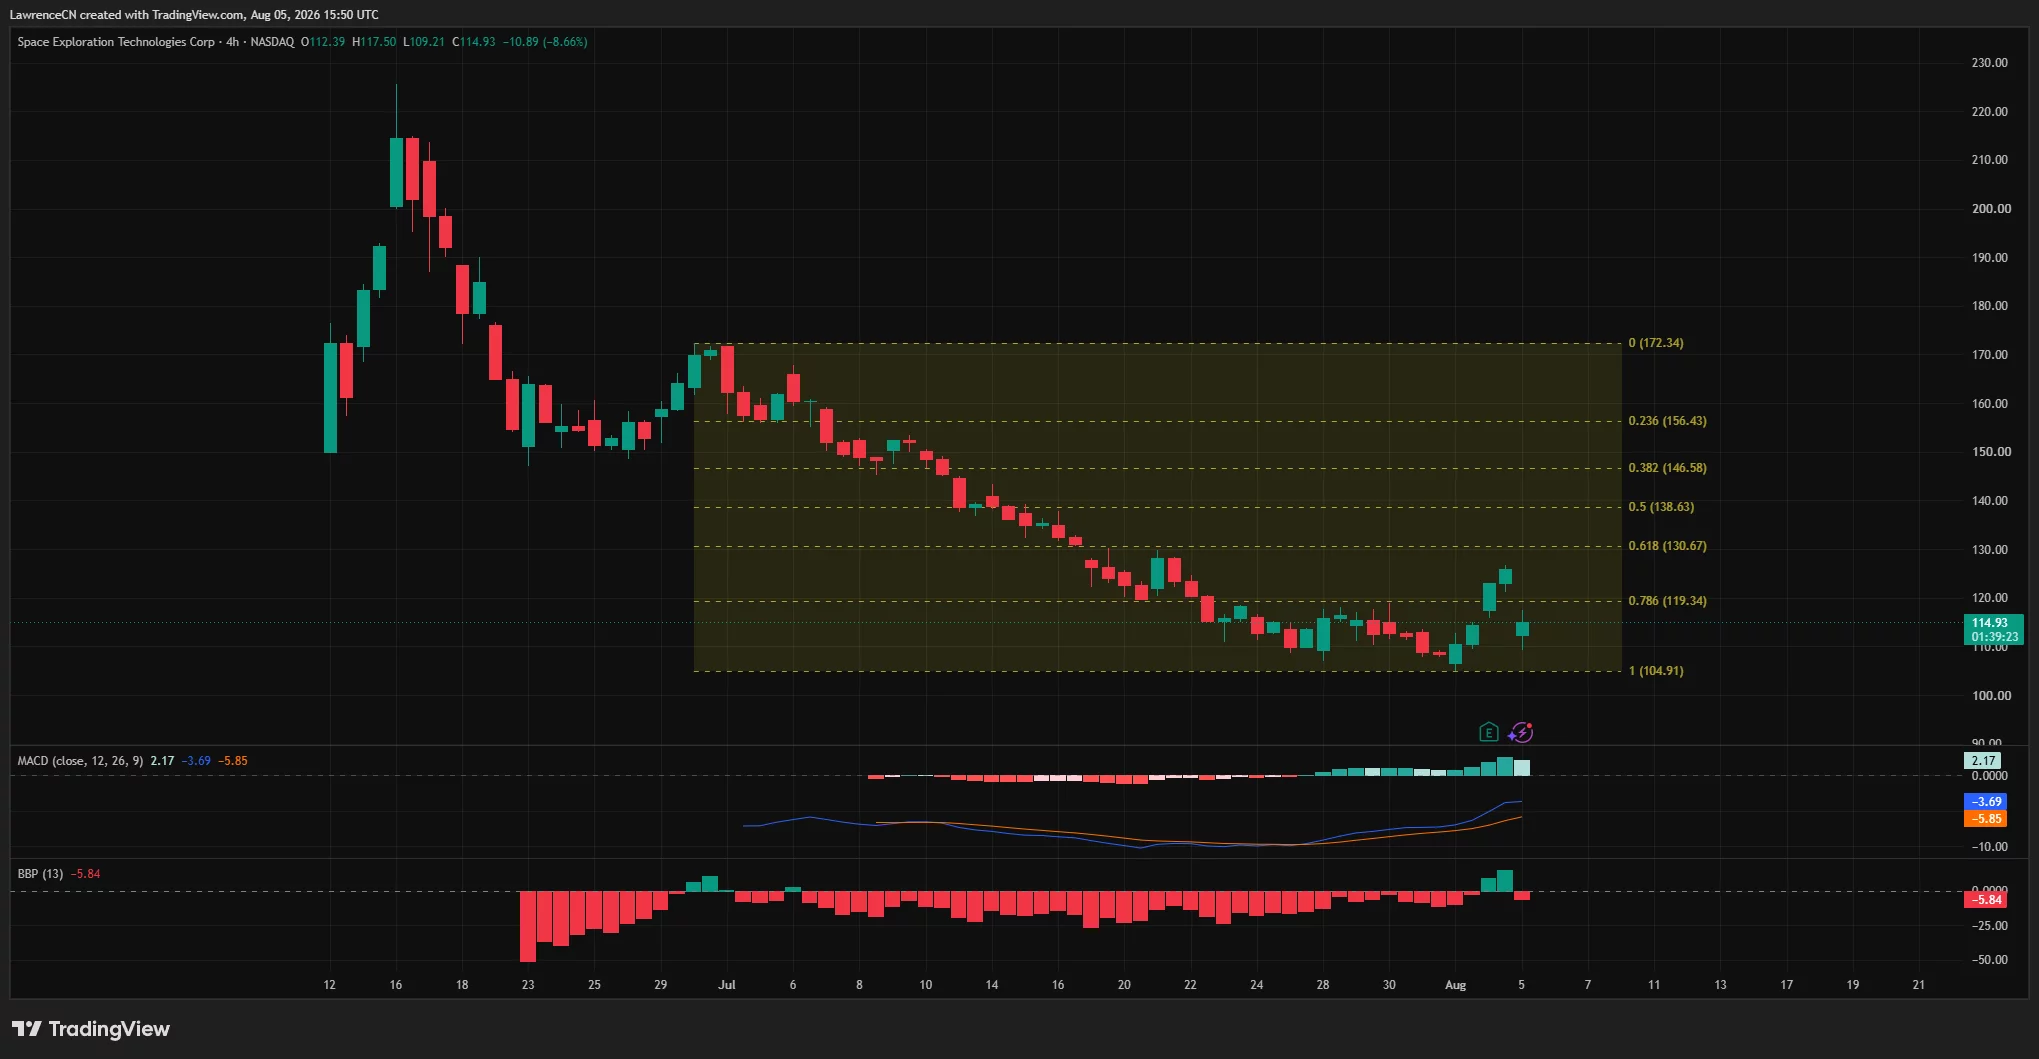
A sustained recovery above $119.34 could allow buyers to target $130.67. Further resistance stands at $138.63 and $146.58, but the broader trend remains weak following the decline from $172.34 in early July.
On the downside, $109 is the first area to watch. A break below that level would expose the July low at $104.91 and deepen the stock’s drop below its $135 IPO price.
The MACD shows that bearish momentum has eased from its July peak, but the latest rejection and negative Bull-Bear Power reading indicate that sellers remain active. Thursday’s post-IPO share unlock could add another source of volatility for US investors.


BitMine Immersion Technologies said Monday that its crypto, cash and "moonshot" holdings totaled $11.3 billion as of 4:00 pm ET on Aug. 2, down from the $11.8 billion it reported a week earlier, even after buying another 10,399 ETH. The decline came from the price BitMine used to mark its position,… Read the full story at The Defiant


Mysten Labs’ co-founder Sam Blackshear said he is joining Anthropic as AI shifts the balance between attackers and defenders.


Bitcoin has entered the national-security debate again as the Pentagon drafts a nuclear strategy centered on potential regional conflicts with China or Russia.
Summary
- The Pentagon is reportedly considering shorter-range tactical nuclear weapons for regional conflicts.
- US military officials previously confirmed operational Bitcoin testing and classified crypto-related work.
- Washington’s Strategic Bitcoin Reserve holds forfeited BTC under a no-sale policy.
- Bitcoin traded near $64,500, with no clear price reaction to the Pentagon report.
Pentagon drafts new nuclear strategy
Defense Department policy chief Elbridge Colby is drafting a classified nuclear framework that could expand the role of shorter-range tactical weapons, NBC News reported on Aug. 5, citing five people familiar with the plans.
The emerging strategy would prepare Washington for a possible regional war involving China or Russia. It reportedly seeks to give the US president more limited nuclear options during a crisis instead of relying mainly on long-range strategic weapons.
The approach would mark a departure from decades of US doctrine built around the threat of a large retaliatory strike. Tactical weapons have shorter ranges and are designed for more limited military targets, although any nuclear use would still carry a severe risk of escalation.
The framework has not been adopted as official US policy. Its reported objectives include preventing a conventional conflict from becoming a full nuclear exchange and stopping one adversary from exploiting Washington while it confronts the other.
Why Bitcoin has entered the security debate
The nuclear review does not formally include Bitcoin. However, the focus on China and Russia overlaps with separate US military discussions about decentralized networks, cybersecurity and digital financial infrastructure.
In April, US Indo-Pacific Command chief Admiral Samuel Paparo told lawmakers that the military was operating a Bitcoin node and testing the network in an operational setting, according to a statement from Rep. Lance Gooden’s office.
Paparo described Bitcoin as a peer-to-peer, zero-trust system with potential military applications. Defense Secretary Pete Hegseth later told Congress that classified digital-asset initiatives could give the US leverage across multiple scenarios.
Those disclosures do not mean Bitcoin forms part of US nuclear planning. They show that defense officials are assessing the network independently as a possible cybersecurity, communications or value-transfer tool as competition with China expands.
Crypto commentators have connected the NBC report with those earlier disclosures. The resulting discussion has focused on whether Bitcoin’s decentralized structure could become more valuable during sanctions, cyberattacks or disruptions to traditional payment systems.
US Bitcoin reserve adds a sovereign dimension
President Donald Trump established the Strategic Bitcoin Reserve through a March 2025 executive order. The reserve is capitalized with BTC forfeited through criminal or civil proceedings rather than direct market purchases.
Bitcoin placed in the reserve “shall not be sold,” according to the executive order published in the Federal Register. Treasury and Commerce may also explore budget-neutral ways to acquire more BTC without imposing additional costs on taxpayers.
The White House estimated in 2025 that the federal government controlled roughly 200,000 BTC, but no complete public audit was available at the time. That makes exact current holdings difficult to confirm, particularly because seized assets may be returned to victims or transferred between agencies.
The reserve and the Pentagon’s network tests remain separate initiatives. Still, together they show that parts of the US government increasingly view Bitcoin through strategic and operational lenses, not solely as a speculative asset.
Bitcoin shows no clear reaction to the report
Bitcoin traded near $64,500 on Aug. 5, within an intraday range of roughly $63,860 to $64,650. The price action showed no obvious response to the nuclear strategy report.
Any long-term market effect would likely depend on concrete policy changes, including additional congressional testimony, defense authorization language, or disclosures about how the military uses Bitcoin infrastructure.
For US investors, the report does not create a direct new demand catalyst. It instead adds to the broader case that Bitcoin is being examined as part of sovereign reserves and national-security planning. The connection remains indirect unless the Pentagon announces a formal procurement, reserve, or operational policy involving BTC.


BitGo will make Chainlink's Cross-Chain Interoperability Protocol the exclusive cross-chain infrastructure for Wrapped Bitcoin, the custodian said on Aug. 4, taking what it describes as more than $7.7 billion of the token off the provider it selected in 2024. All future BitGo-issued assets will use… Read the full story at The Defiant


Cash App and Square drove better-than-expected results, while the company said it expanded its use of AI across software engineering.


Wells Fargo will introduce tokenized deposits for its corporate and commercial clients this fall, the bank said on Aug. 4, beginning with a limited U.S. dollar-to-British pound exchange for select clients and expanding over the course of 2027 to more clients, countries and currencies. The… Read the full story at The Defiant

SpaceX now expects to reach $1 trillion in annual revenue by 2030, a year sooner than its pre-IPO forecast, CEO Elon Musk said on the company’s first earnings call as a public company.
SpaceX shares fell in after-hours trading Tuesday, then extended losses to roughly 14% during Wednesday’s session. Investors focused on surging capital spending instead of the earnings beat.
Faster Path to $1 Trillion
Despite its stock performance, SpaceX reported $7.81 billion in second quarter revenue, up 92% year over year. That beat the $6.81 billion analysts expected. Adjusted EBITDA reached $3.5 billion, nearly double Wall Street’s $2 billion forecast.
The report marked SpaceX’s first earnings beat since going public last month.
Musk addressed the long-term outlook directly on the call, framing the accelerated timeline as an internal projection rather than a promise.
Our internal projections for reaching $1 trillion in revenue… have moved up from 2031 to 2030, and there’s a non-zero chance of that being in 2029.
— Elon Musk, SpaceX
AI Capex Drives Selloff
Capital expenditures climbed to $18.37 billion, more than six times what SpaceX spent in the same period last year. Most of that spending, $15.83 billion, went into its AI business. That topped the $13.22 billion analysts had modeled, according to FactSet.
The AI segment includes SpaceX’s new Nvidia satellite partnership, announced hours before earnings. The deal will put Nvidia Rubin GPUs into orbit for in-space computing.
Starlink revenue rose 66% to remain SpaceX’s only profitable segment, though revenue per subscriber fell. SpaceX also faces a lockup expiration this week. It could release close to a fifth of outstanding shares, adding pressure on the stock.
Whether SpaceX’s AI bet pays off before its next report will shape investor patience with the 2030 target.
The post Musk Says SpaceX Revenue Could Hit $1 Trillion a Year Early Even as Stock Slides appeared first on BeInCrypto.


“There’s a lot of chaos right now in the ecosystem. We absolutely understand that many people are being bombarded with security issues right now,” said Bitcoin developer Calle.
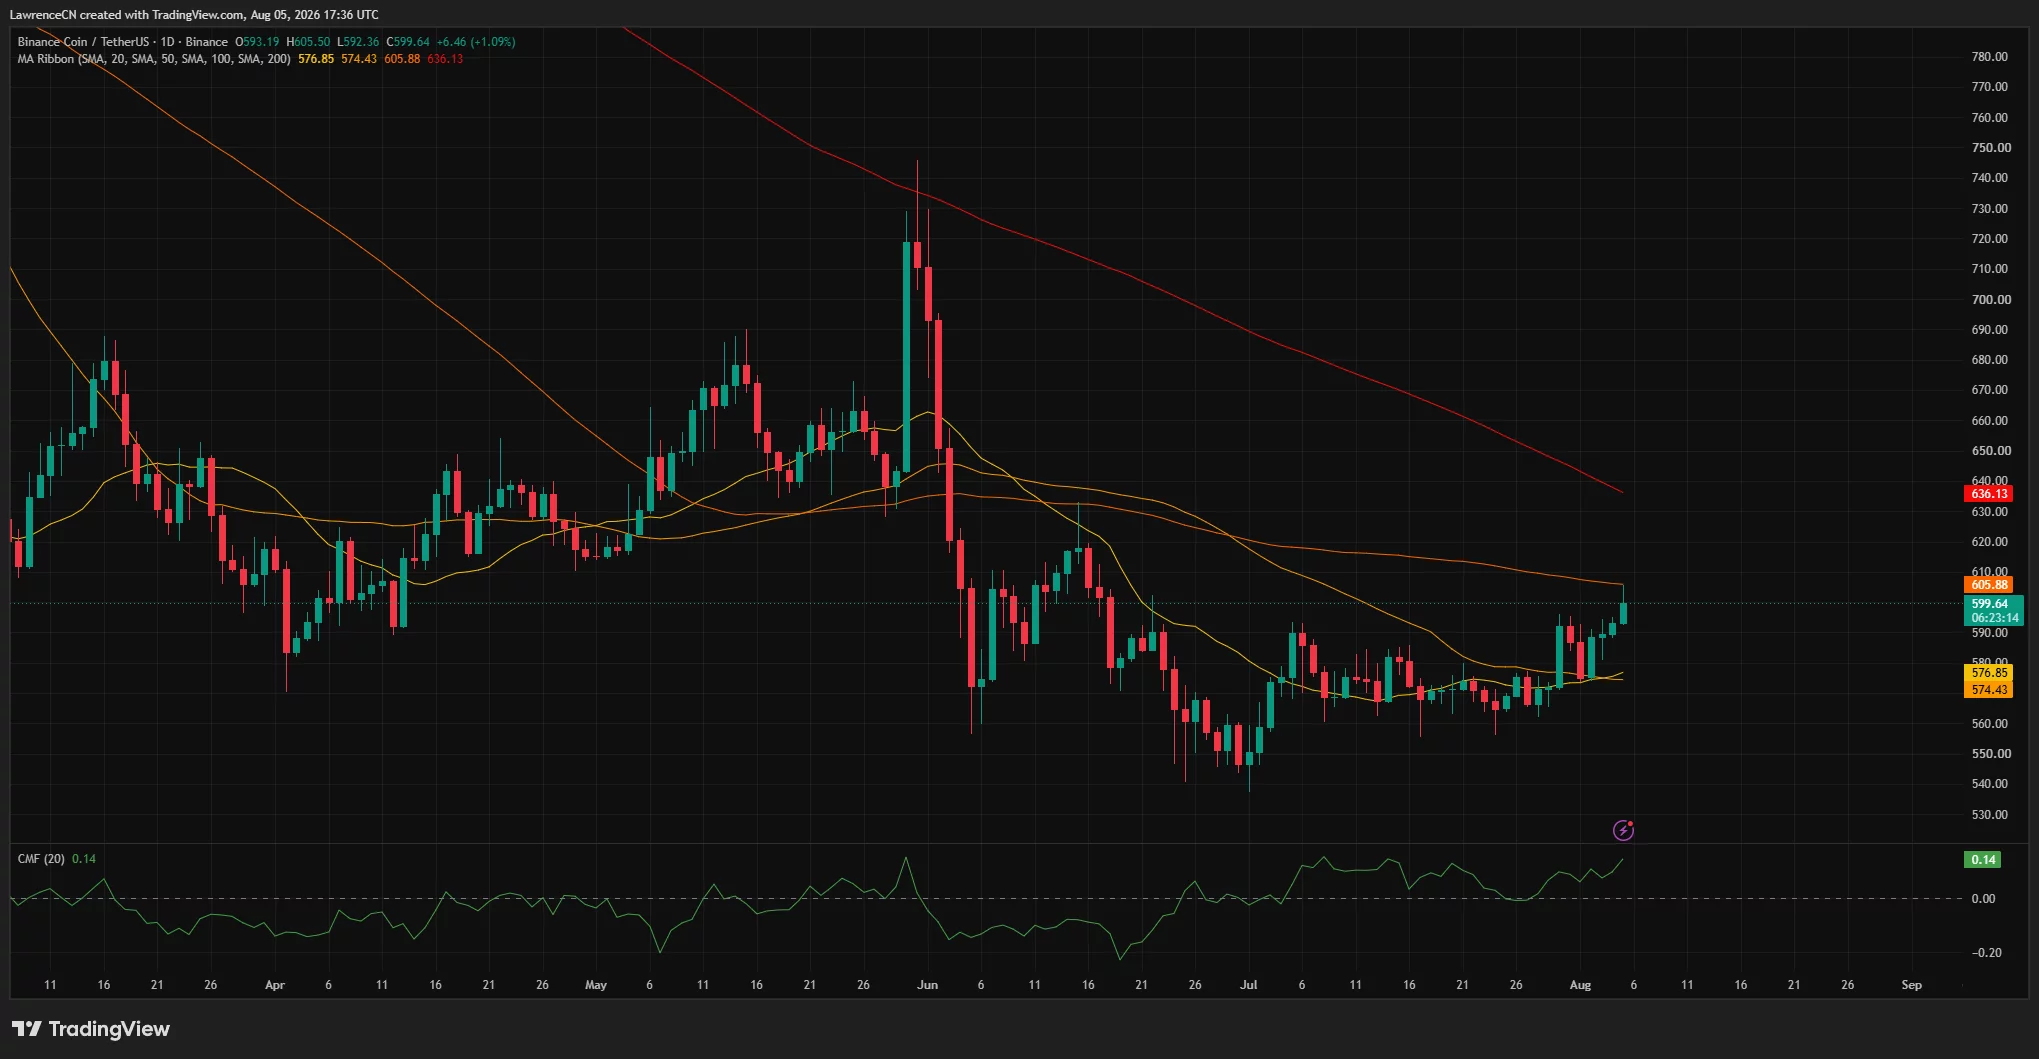
BNB price traded near $600 on Aug. 5 after breaking out of its July range, while rising derivatives activity and nearby liquidation clusters pointed to a possible test of $610.
Summary
- BNB price gained 5% over the past week, reclaiming the closely watched $592 level.
- Derivatives volume increased 56.1% to $719.9 million, while open interest rose 4.05%.
- The 4-hour RSI reached 63.74, showing bullish momentum without an overbought reading.
- Liquidity clusters near $612 and $616 could attract price if BNB clears immediate resistance.
BNB price reclaims $592 after July breakout
According to data from crypto.news, BNB (BNB) price rose to approximately $600 on Wednesday, extending its recovery from a late-July range around $560 to $575. The daily chart shows that the token closed near $599.64 after reaching an intraday high of $605.50.
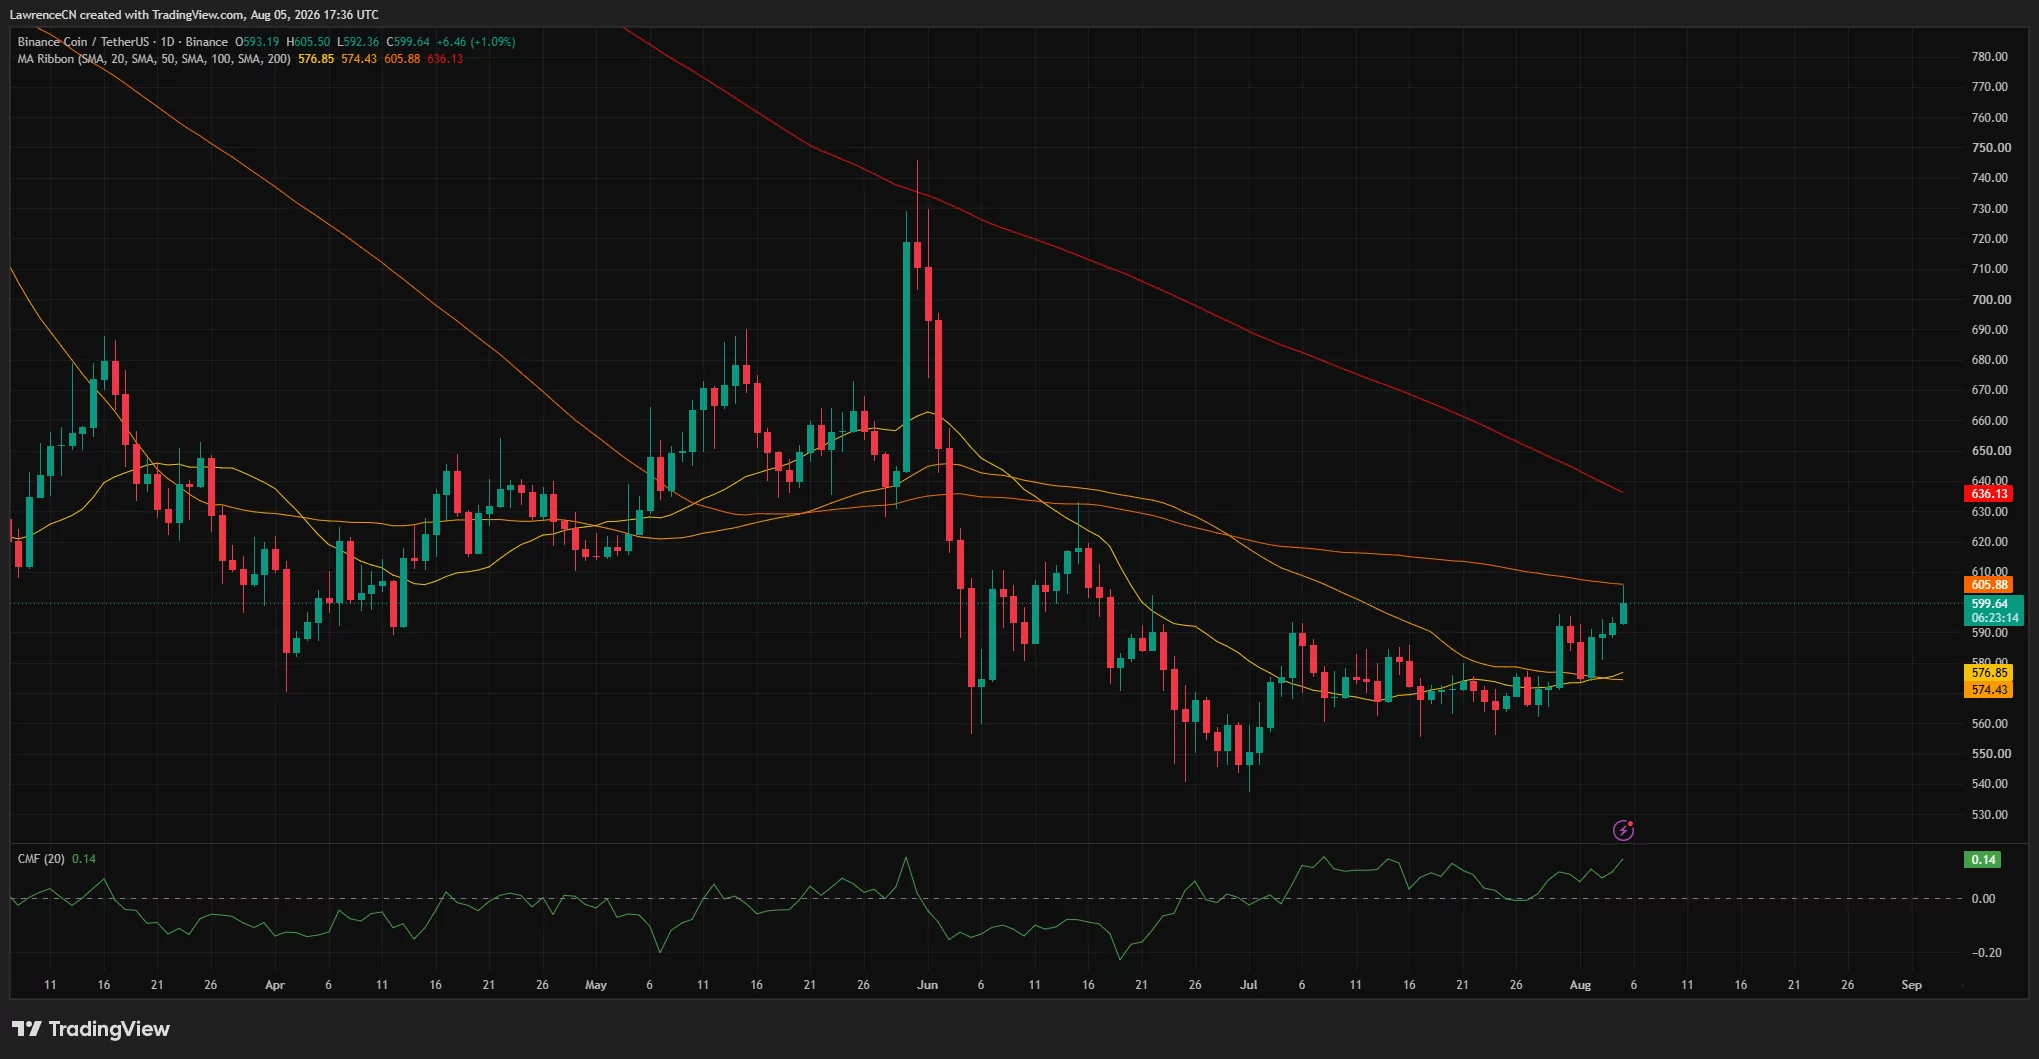
The move carried BNB above its 20-day and 50-day simple moving averages at $574.43 and $576.85, respectively. Reclaiming both averages supports the short-term bullish structure, although the asset has not yet reversed its wider downtrend.
The 100-day SMA at $605.88 now represents the first major test. This level sits close to Wednesday’s intraday high and could determine whether BNB extends its rally toward $610 or enters another period of consolidation.
Longer-term resistance remains at the 200-day SMA near $636.13. BNB would need to reclaim that level before the daily chart confirms a broader bullish trend reversal.
Chaikin Money Flow rose to 0.14 on the daily chart. A reading above zero indicates that buying pressure has exceeded selling pressure during the measured period, adding support to the latest recovery.
Derivatives traders add exposure as volume jumps
BNB derivatives activity strengthened alongside the spot-price increase. CoinGlass data provided for the analysis showed that trading volume climbed 56.1% to $719.9 million, while open interest increased 4.05% to $985.79 million.
Rising price and open interest can indicate that traders are opening new positions rather than closing existing contracts. However, the data alone does not establish whether the new exposure is primarily long or short.
The increase also raises the possibility of stronger volatility around the $600 barrier. Leveraged positions may face forced closures if BNB moves sharply through nearby liquidation zones.
Broader crypto-market conditions offered additional support. Bitcoin approached $64,000, while the total digital asset market capitalization reportedly rose 0.72% to $2.19 trillion.
European regulatory developments also improved the wider institutional backdrop. The latest MiCA register update added more authorized crypto-asset service providers, although the development does not provide a direct fundamental catalyst for BNB or Binance.
BNB price faces resistance between $602 and $606
The 4-hour chart places BNB near the upper Bollinger Band after its latest advance. The upper band stands at $602, while the middle band has risen to $591.92.
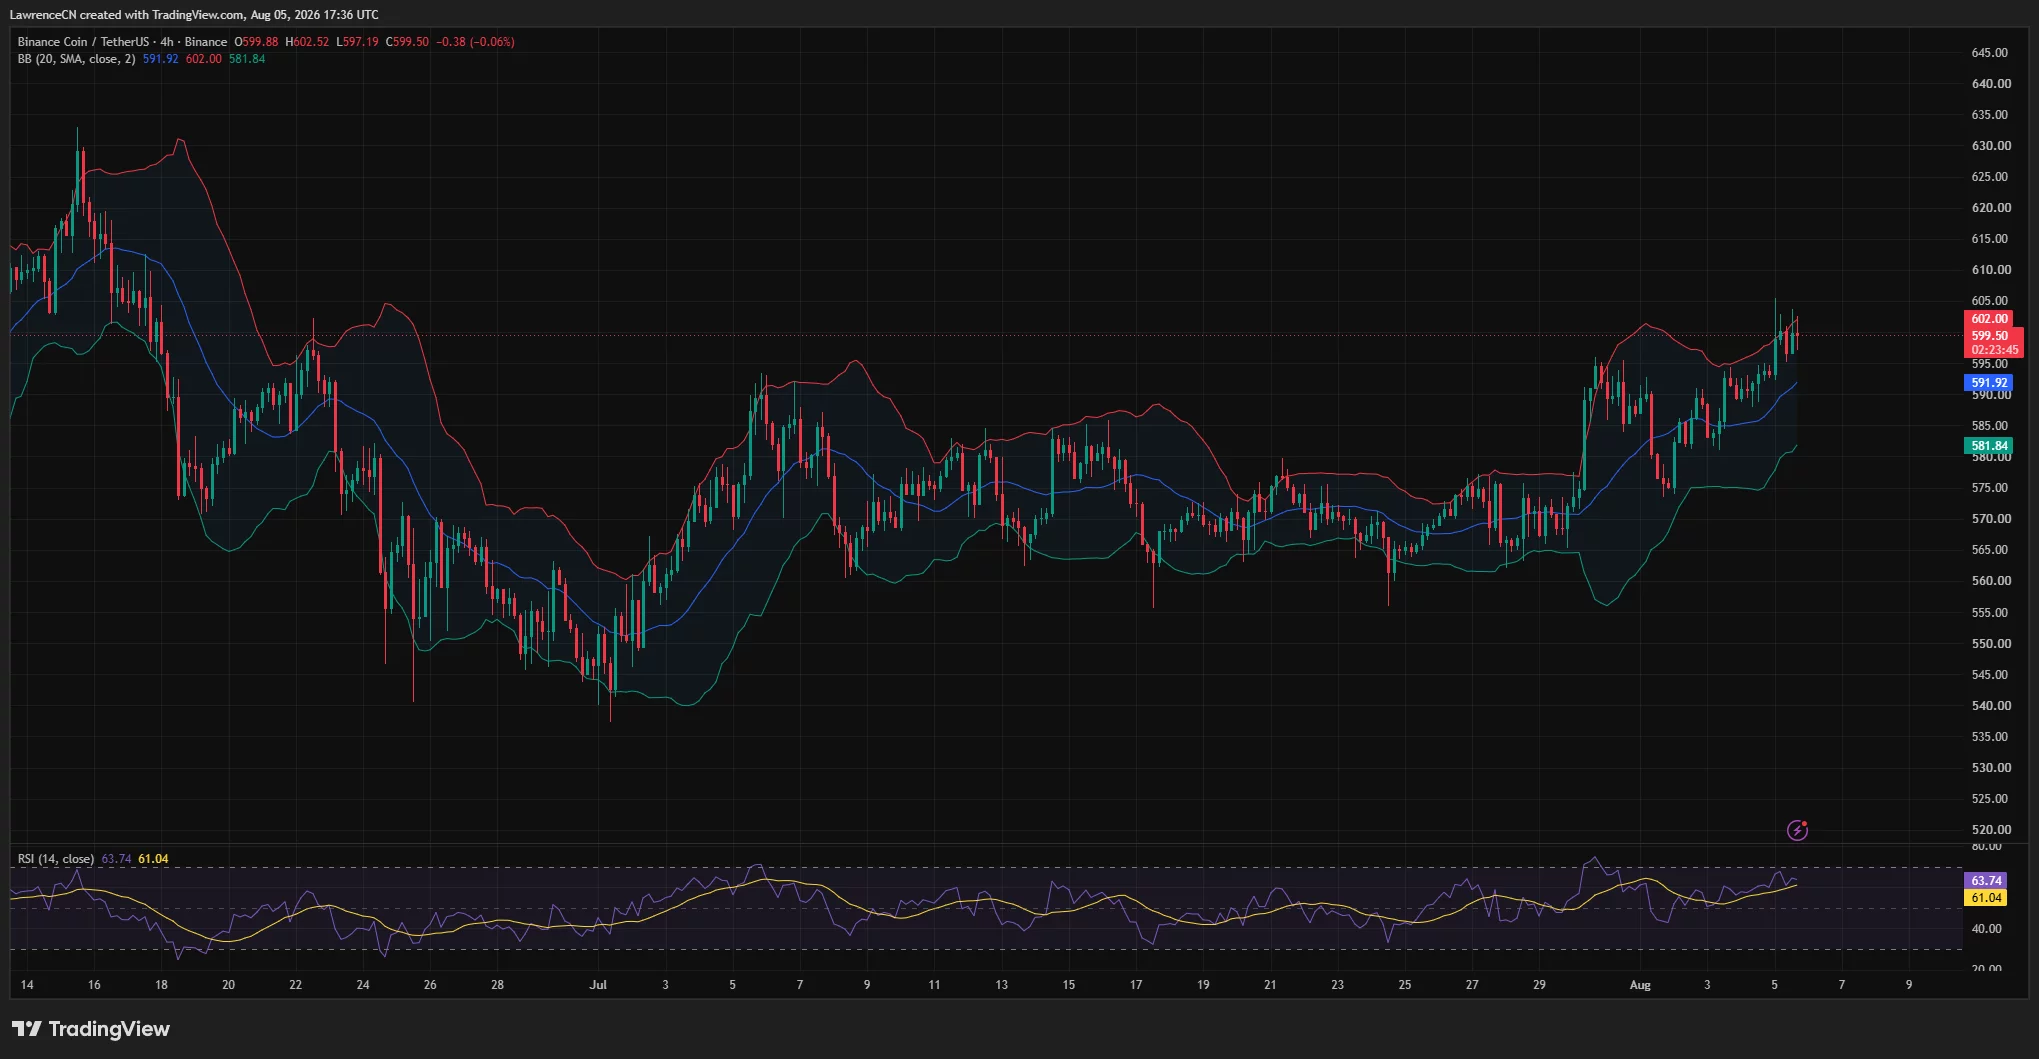
Price briefly moved above the upper band before slipping back toward $599.50. That rejection shows that sellers remain active around $602 to $605.88, where the 4-hour Bollinger Band and daily 100-day SMA converge.
The 4-hour Relative Strength Index stood at 63.74, above its signal average at 61.04. Momentum remains bullish, but the reading is approaching the 70 threshold commonly associated with overbought conditions.
A 4-hour close above $605.88 could open the way toward $610. The next upside area sits between $612 and $616, where the three-day liquidation heatmap shows two of the strongest overhead liquidity concentrations.
Failure to break the resistance zone would place initial support at $592, followed by the 4-hour middle Bollinger Band near $591.92. A deeper retracement could target the lower band at $581.84.
Liquidation heatmap puts $612 and $592 in focus
The three-day CoinGlass liquidation heatmap shows liquidity concentrated on both sides of the current price. Above BNB, prominent bands appear around $612 and $616, with additional leveraged positions extending toward $620.
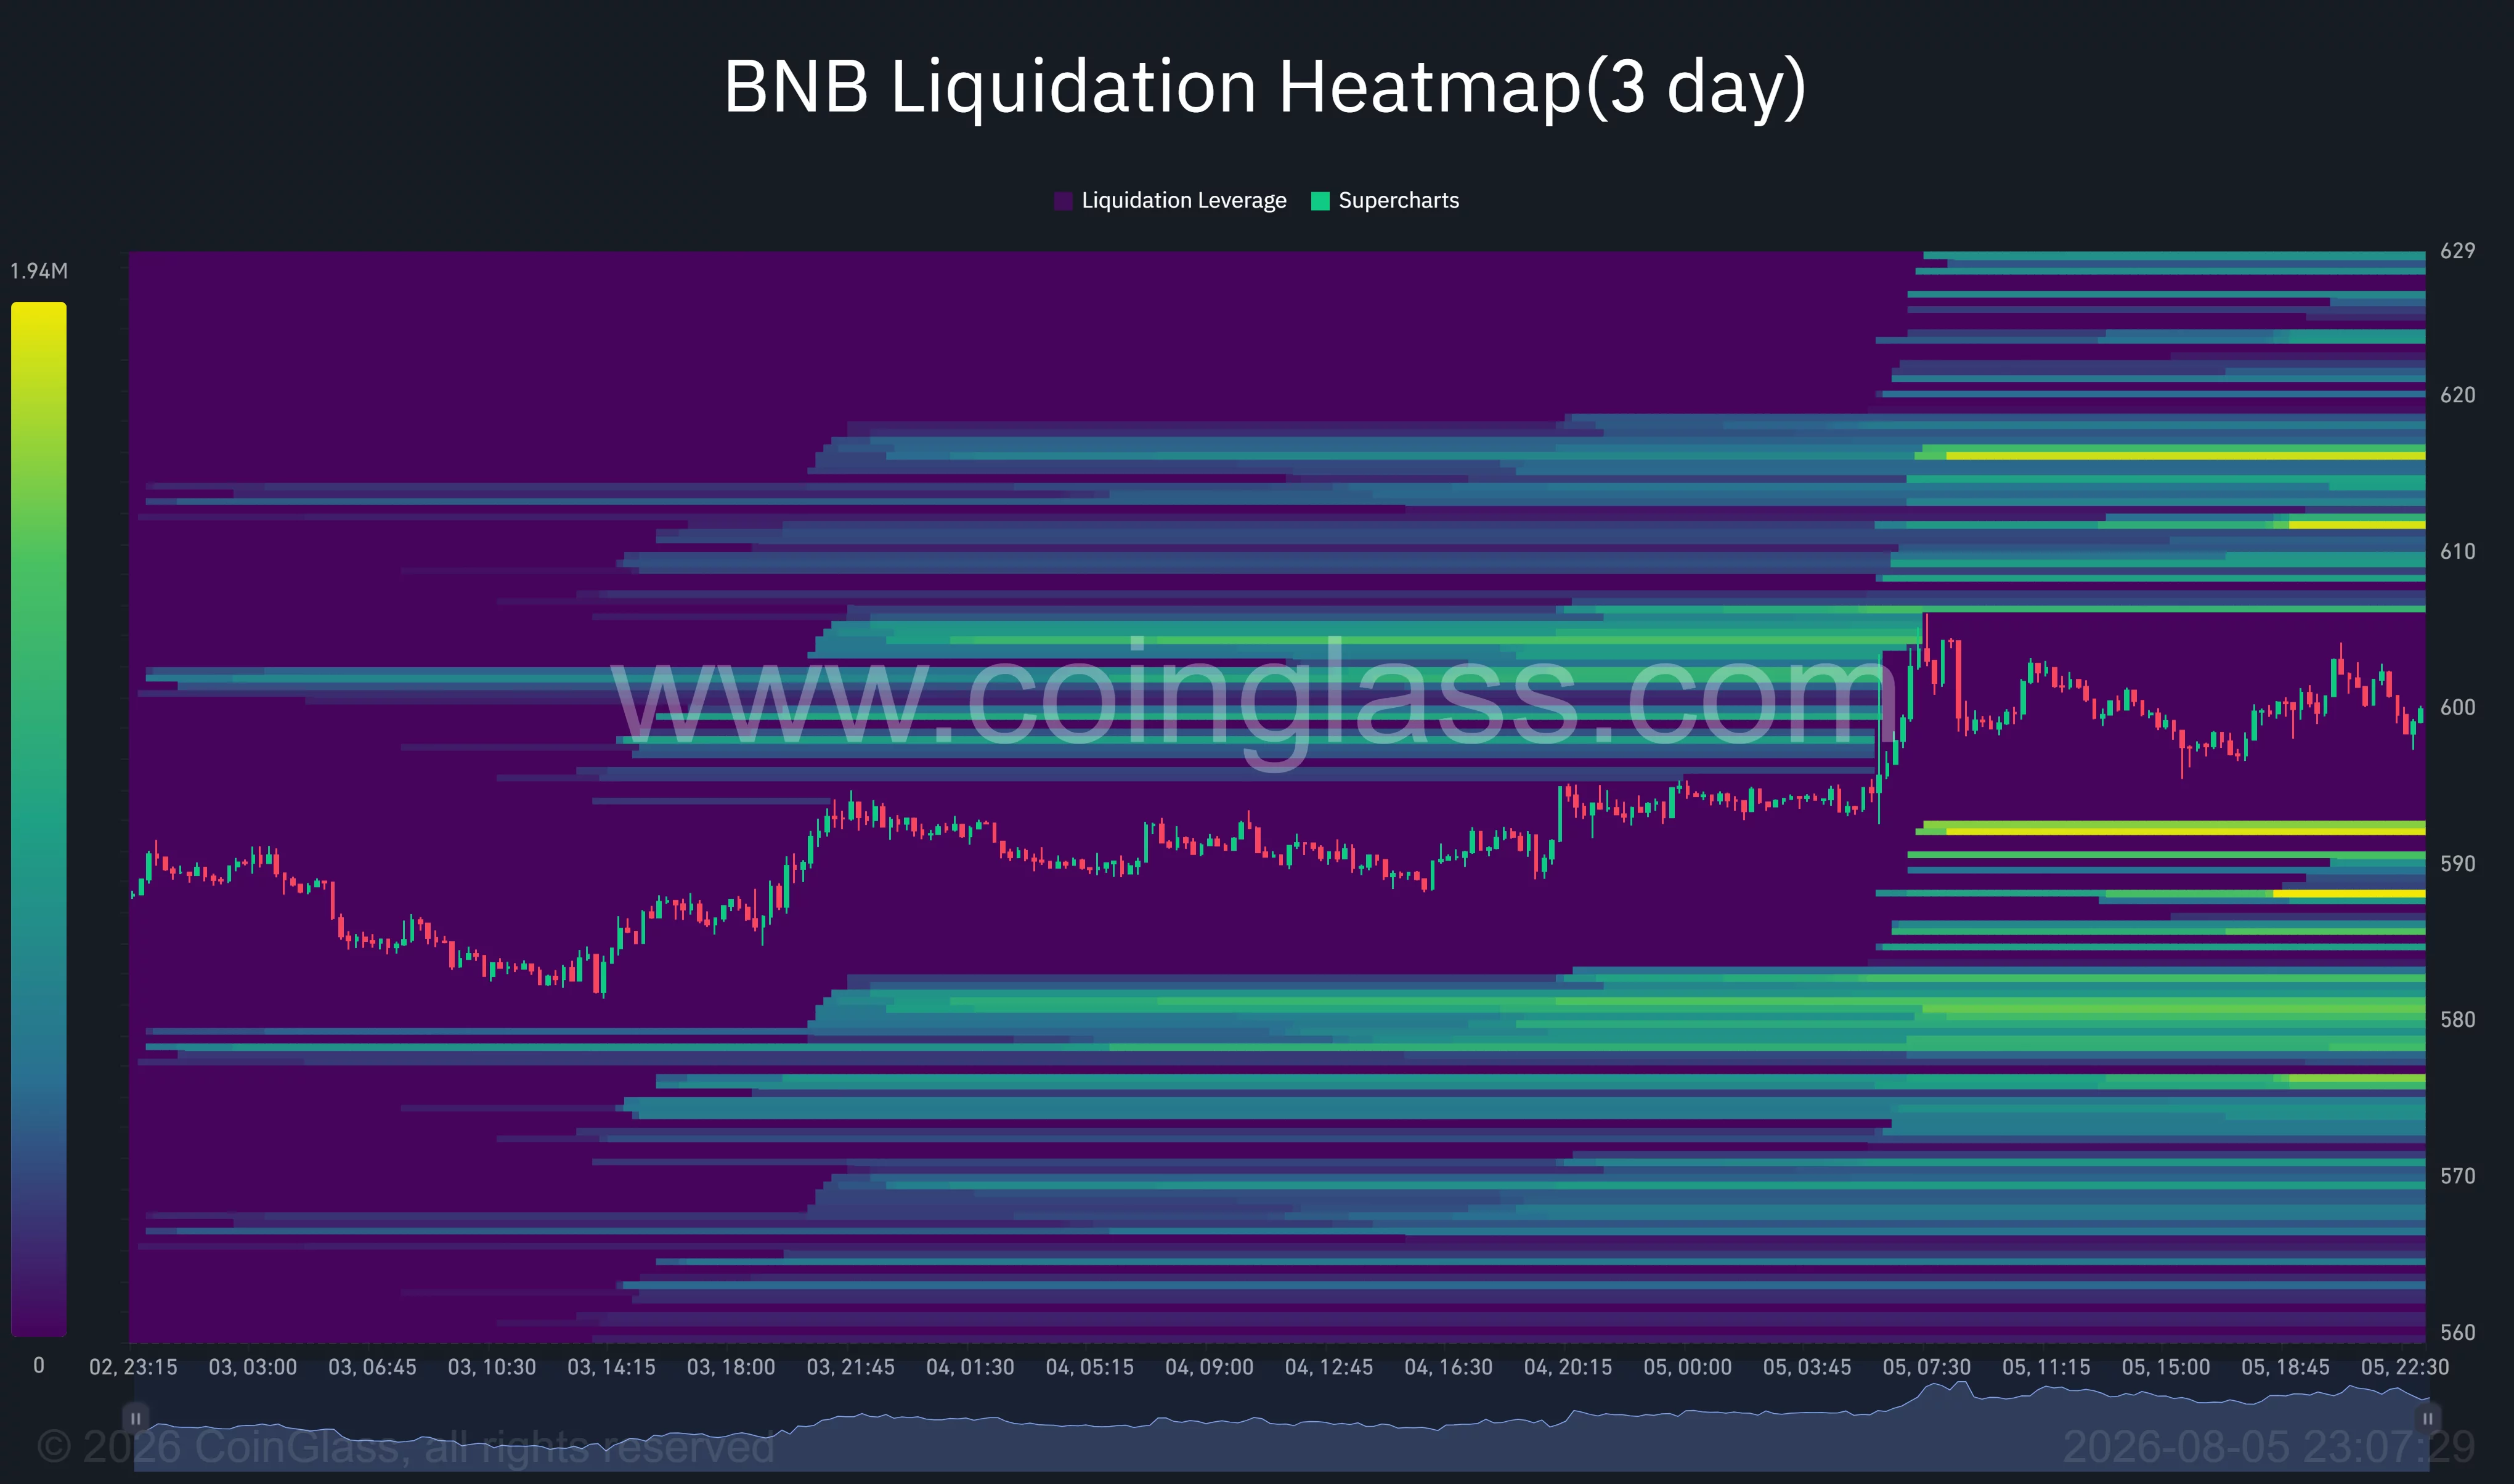
These clusters can act as price magnets because a move into them may force short sellers to close positions. A break above $606 could therefore accelerate toward $612 as short liquidations add market buying.
The closest major downside cluster sits near $592. Another band appears around $587, followed by larger concentrations near $581 and $576.
Losing $592 would weaken the recent breakout and raise the probability of a move toward $582. That area also aligns with the lower 4-hour Bollinger Band and the base of the latest advance.
The heatmap does not predict which liquidity zone BNB will reach first. It instead shows where leveraged positions may become vulnerable if price moves through those levels.
Analysts see $592 as the key trend level
Crypto commentator Satoshi Stacker described BNB’s retest of its former diagonal resistance as successful. He identified $592 as one of the asset’s most important levels of 2026 and said holding above it would support the view that BNB is entering an uptrend rather than posting a temporary recovery.
Another trader, Batman, pointed to BNB’s breakout from consolidation and its recovery above the 50-day moving average. The analyst said the subsequent retest preserved the bullish setup.
The charts support a constructive short-term outlook while BNB remains above $592. A confirmed break above $606 would bring $610, $612 and $616 into focus.
The bullish setup would weaken if BNB closes back below $592. In that case, $582 becomes the main downside level, with $576 providing the next support if selling pressure increases.
For US traders, MiCA developments mainly offer a comparison with Europe’s unified licensing framework. BNB’s short-term direction remains more closely tied to overall crypto liquidity, Binance-related developments and technical positioning than to European licensing updates.
Disclosure: This article does not represent investment advice. The content and materials featured on this page are for educational purposes only.

Carmen Electra Reflects On ‘Difficult’ Dennis Rodman Marriage

Being a woman with zero financial literacy isn’t chic!

Shock 216 UK deaths and 18,000 severe reactions linked to weight loss jabs – fatalities surge 300 per cent in a year … as woman dies after upping Mounjaro dose


-

 Fashion5 days ago
Weekend Open Thread: Wit & Wisdom
-

 Politics5 days ago
Meta enters AI-training agreement with far-right ‘propaganda rag’ Newsmax
-

 Politics3 days ago
Zack Polanski: an incitement to murder Nigel Farage?
-
 Crypto World4 days ago
MicroStrategy Post-Earnings CLARITY Act Push Could Add New Catalyst for Its Stock
-

 Crypto World5 days ago
XRP Ledger v3.3.0 brings five institutional features
-

 News Videos7 days ago
Bitcoin Enters the 3rd Stage of the Bear Market
-

 Politics6 days ago
Luke Littler’s dominance sparks GOAT debate
-

 Sports6 days ago
Seema Kaliramna Wins Discus Throw Bronze, Takes India’s CWG Medals Tally To 17
-

 Crypto World5 days ago
New York sues Kalshi over prediction market gambling
-

 Crypto World4 days ago
Crypto PAC spending tops $2M in Michigan House race
-

 Business3 days ago
DTCR: Deleveraging And A Hedge Fund Collapse Point To A Possible AI Bottom
-

 Business6 days ago
Trump Announces Hamas Disarmament Agreement as Iran Strikes Kuwait Air Base and US Attacks Pause Overnight
-
 Crypto World5 days ago
3 Fed Officials Just Explained Their Rate Hike Vote: Is Inflation Winning?
-

 Tech4 days ago
ESET tracks rise in malicious AI skills and adaptable malware
-

 Sports5 days ago
France Cricket implodes: letters hidden in a drawer and a board at war
-

 NewsBeat7 days ago
Four people die trying to cross Channel in small boats
-

 Tech6 days ago
Gemini Spark can now use Chrome logins and saved passwords to run errands on your behalf
-
 Tech6 days ago
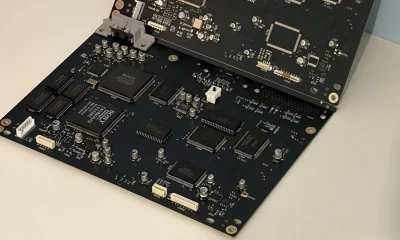
Building A Reproduction PlayStation Motherboard
-
Crypto World3 days ago
XRP Ledger urges node upgrade after manifest flood
-

 Crypto World5 days ago
Moneyflip CEO charged in $40K murder-for-hire plot
You must be logged in to post a comment Login