

Crypto World
Pi Network upgrade puts battered PI price on the brink of a rebound

Pi Network’s PI token has held above $0.073 after a prolonged decline, with its July 22 Protocol v25 upgrade offering buyers a possible recovery catalyst.
Summary
- PI holds above $0.073 as traders await the Protocol v25 upgrade on July 22.
- A triangle breakout above $0.080 could expose resistance near $0.085 and $0.10.
- Weak capital inflows leave PI vulnerable to a breakdown toward $0.070.
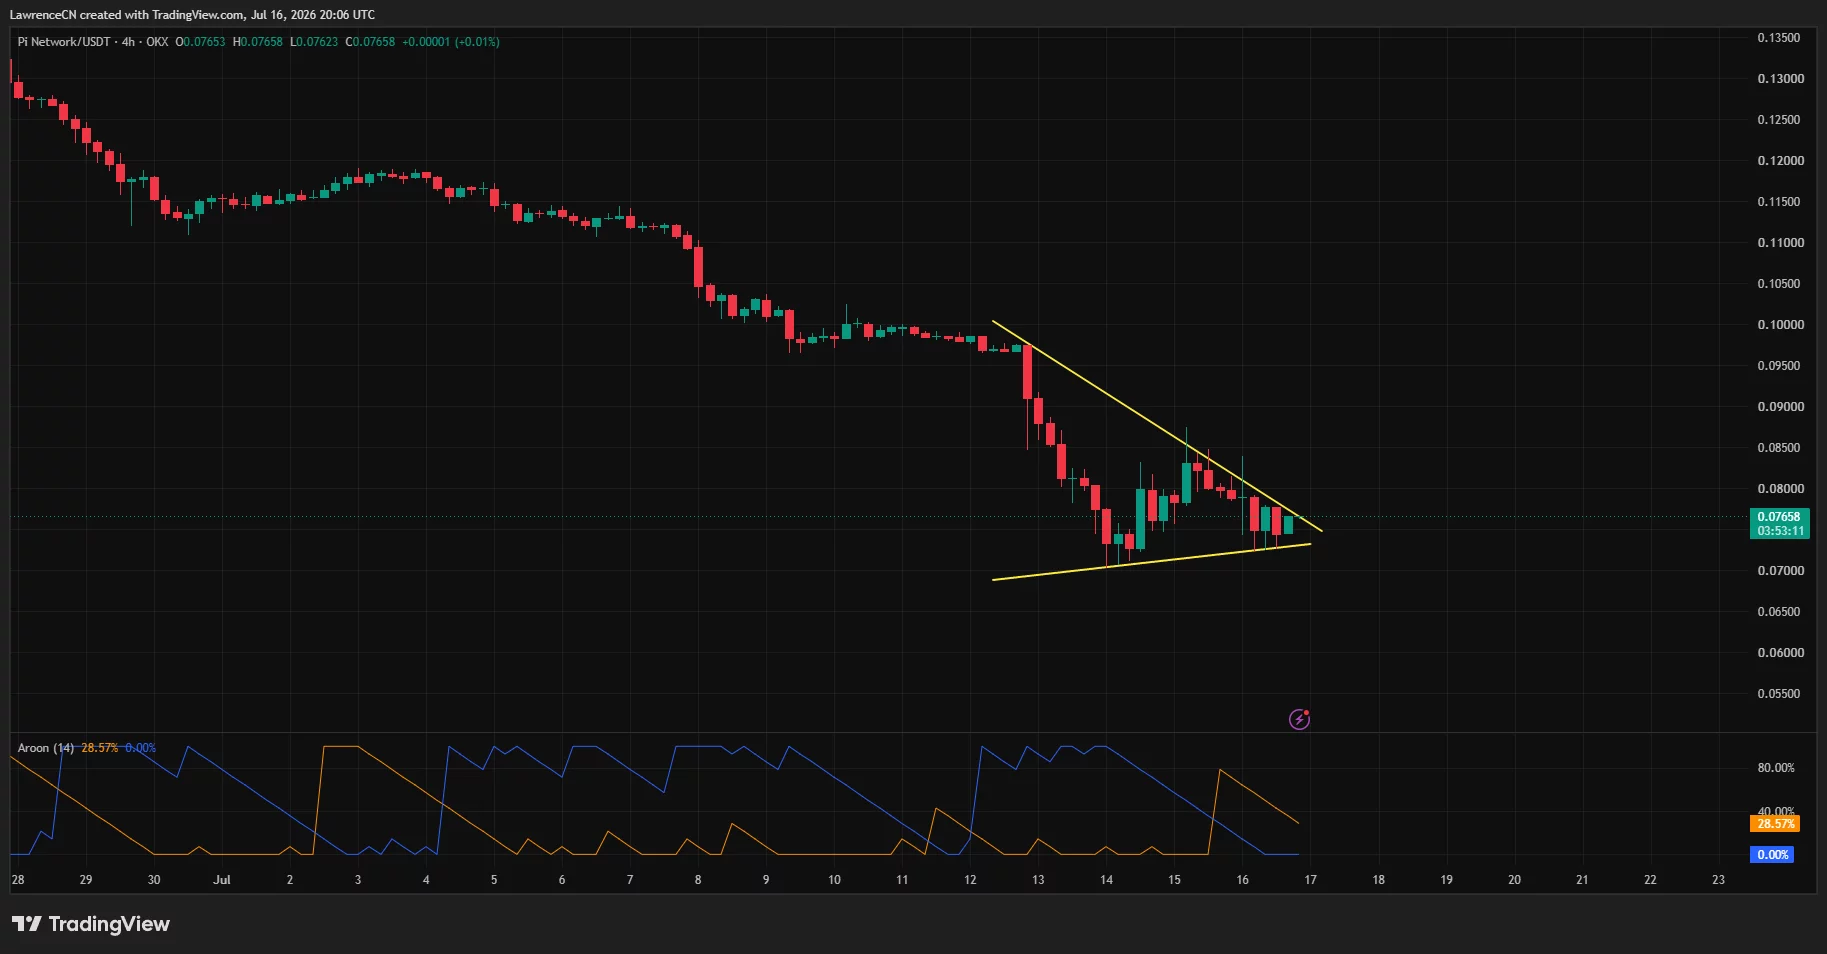
According to data from crypto.news, Pi Network (PI) price traded near $0.0765 on Thursday after moving between an intraday low of $0.0723 and a high of $0.0839. The token remains under pressure on the daily chart, but its 4-hour structure shows price compression that could precede a larger move.
Pi Network announced on July 15 that Protocol v25 will focus on network stability, reliability, and more efficient privacy-focused smart contracts. The upgrade will reach the network on July 22, giving traders a dated catalyst as PI attempts to stabilize near its recent lows.
Bitcoin’s consolidation near $64,000 and a 1.67% decline in the total crypto market have limited demand for smaller tokens. PI has faced the same weak risk appetite while trying to recover from a steep multi-week decline.
Protocol v25 gives buyers a fresh catalyst
Pi Network’s announcement states that Protocol v25 will introduce BN254 cryptography and Poseidon hashing. Developers can use these tools to build zero-knowledge applications that process sensitive information without placing the underlying data on public records.
“On July 22, Pi is scheduled to upgrade to Protocol v25, which primarily focuses on improving network stability and reliability, and supports new capabilities for more efficient, privacy-preserving smart contracts,” the Pi Core Team wrote on X.
By supporting private contract execution, the upgrade could expand the types of applications developers can build on Pi Network, according to the project. Pi Core Team also expects the release to improve contract efficiency as the ecosystem adds new applications and services.
Protocol v25’s effect on PI demand will depend on developer participation, application growth, and network performance after activation. The announcement has created a fresh event for traders to watch, though the price charts have not yet confirmed a sustained reversal.
PI needs $0.080 to confirm its recovery
On the 4-hour TradingView chart, PI has formed a symmetrical triangle after falling from about $0.10 earlier in July. Its descending resistance line now meets an ascending support line, leaving the token close to the pattern’s narrowing end.
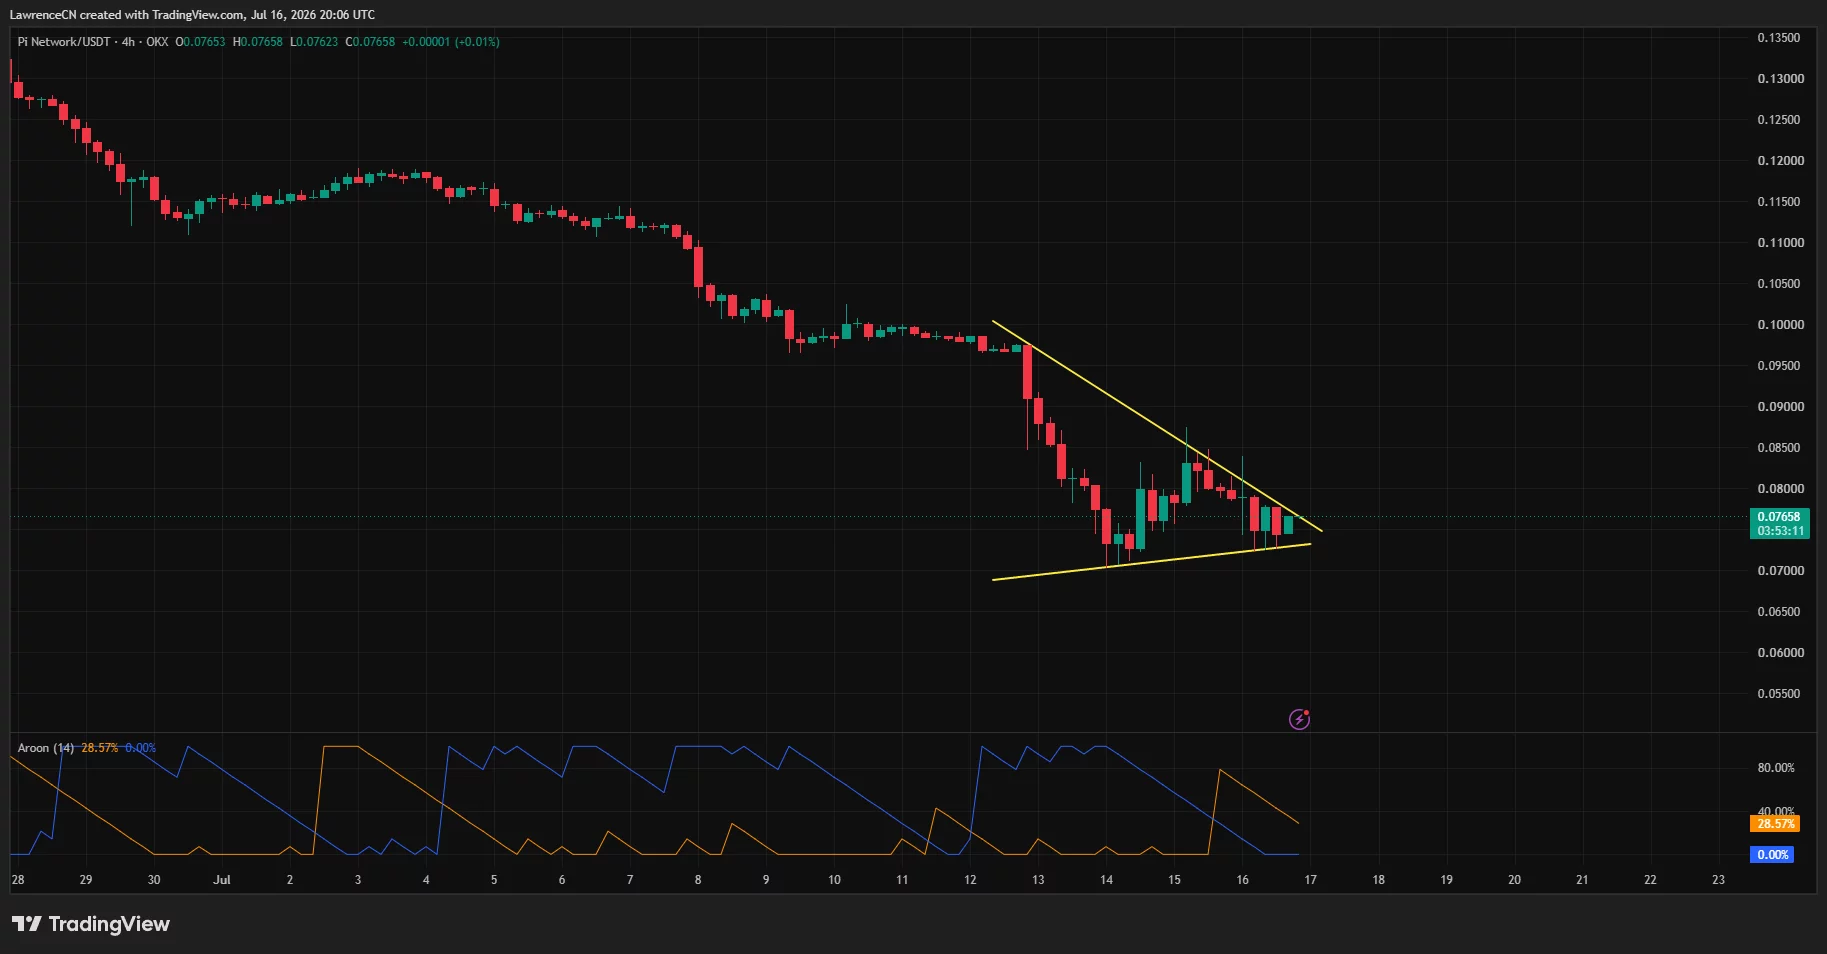
A 4-hour close above the upper trendline and $0.080 would confirm a bullish breakout from the triangle, according to the chart structure. Such a move would expose $0.085, which matches the daily Murrey Math oversold level at $0.08545, before traders turn toward $0.097 and the psychological $0.10 barrier.
Momentum has not yet confirmed that outcome. The 4-hour Aroon indicator shows Aroon Up at 28.57% and Aroon Down at 0%, signaling weak trend strength even as selling momentum eases.
Daily capital flows remain another obstacle. TradingView’s Chaikin Money Flow reading stands near -0.20, indicating that outflows continue to outweigh inflows despite buyers defending the latest support area.
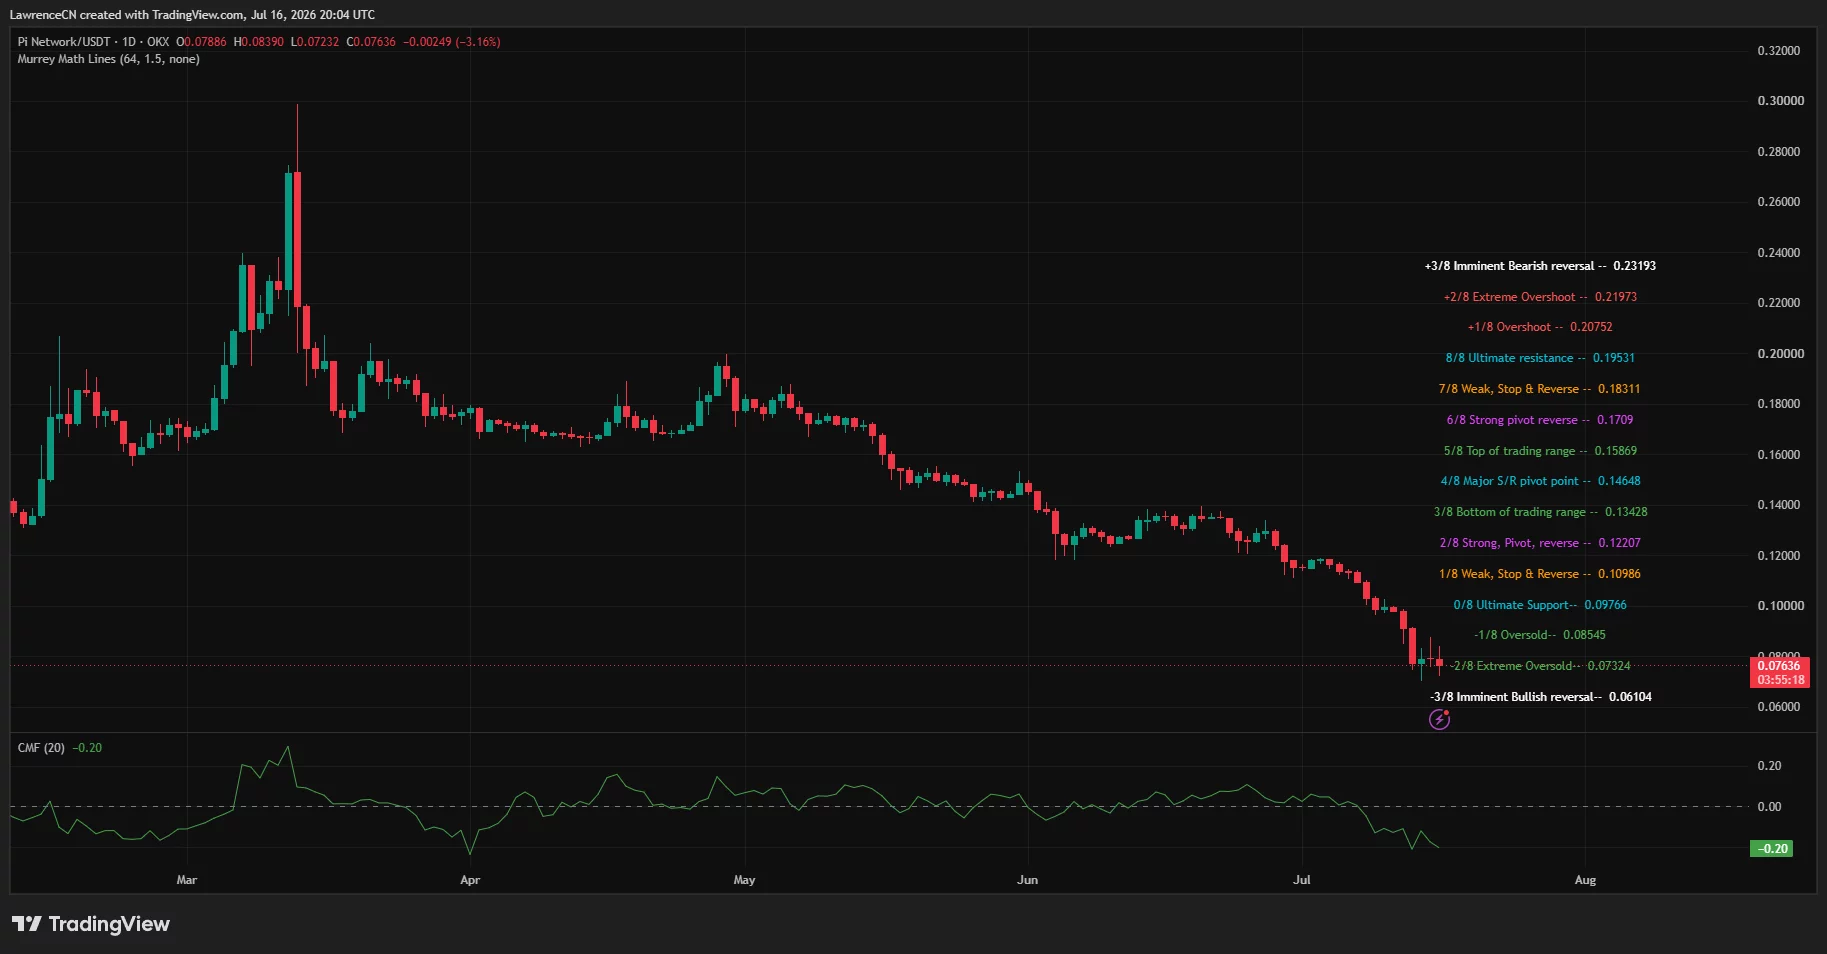
On the downside, $0.07324 represents the daily Murrey Math extreme-oversold level and sits close to the triangle’s rising boundary. A clear break below that zone would weaken the rebound setup and expose $0.070, while continued selling could bring the Murrey Math bullish-reversal level near $0.061 into focus.
Disclosure: This article does not represent investment advice. The content and materials featured on this page are for educational purposes only.

Prediction markets are facing renewed insider-trading scrutiny after a U.S. White House staffer, long involved with President Donald Trump’s teleprompter, was reportedly in talks with federal regulators over allegations that he profited from bets tied to the president’s speeches. ABC News reported Thursday that the matter centers on whether Gabriel Perez—who has served as a technical assistant operating the teleprompter since 2016—used nonpublic information to place wagers on Kalshi markets linked to specific remarks.
According to ABC News, Perez allegedly bet on more than a dozen Kalshi “Mentions” contracts—products that let users wager whether certain words, phrases, or topics will appear in public speeches—earning over $100,000 in profits. The report adds that Kalshi’s surveillance flagged the activity and referred it to the Commodity Futures Trading Commission (CFTC).
Key takeaways
- ABC News says teleprompter operator Gabriel Perez placed Kalshi “Mentions” bets tied to Trump speeches and earned more than $100,000.
- Kalshi reportedly detected the trades through its monitoring systems and referred them to the CFTC.
- Federal scrutiny of prediction markets appears to be intensifying as lawmakers and regulators focus on potential access to nonpublic information.
- Recent high-profile Polymarket-related allegations and wallet-pattern investigations have already heightened compliance concerns across the sector.
How the Kalshi “Mentions” markets came under scrutiny
Kalshi’s “Mentions” markets are designed around verifiable speech outcomes: users wager on whether particular words, phrases, or topics will appear when a public figure delivers a prepared message. ABC News reports that Perez allegedly used this structure to place bets on language expected to be included in Trump’s remarks.
The ABC report further claims that investigators found evidence suggesting Perez sometimes exited positions mid-speech when Trump reportedly skipped prepared passages that contained words he had wagered would be mentioned. If accurate, the timing detail points to a key question at the center of insider-trading concerns: whether the trades were based solely on public expectation and market pricing, or on knowledge obtained before the speech content became public.
ABC News said regulators uncovered bets connected to more than a dozen speeches over roughly a three-month span, including Trump’s State of the Union address and remarks made at the World Economic Forum.
Regulatory escalation and the CFTC referral
ABC News attributes the discovery process to Kalshi’s surveillance systems. The exchange’s monitoring reportedly detected the betting pattern and prompted a referral to the Commodity Futures Trading Commission. That referral matters because it indicates the activity was treated not just as a compliance question for a private platform, but as a potential issue for federal oversight.
The report also says the White House placed Perez on unpaid administrative leave following publication of the allegations. White House press secretary Karoline Leavitt stated that Trump called the alleged conduct a “disgrace.”
While the ABC News account describes negotiations with federal regulators to settle the matter, it does not provide details about the specific allegations’ legal theory, possible violations, or whether an agreement has been reached. Readers should watch for official regulatory filings or enforcement action that clarifies what conduct regulators believe occurred and what standard they applied.
Why this is a broader warning for prediction markets
The Kalshi teleprompter story arrives at a time when prediction markets have seen both rapid growth and increasing concern about market integrity. In recent months, multiple incidents have raised questions about whether traders may sometimes benefit from information that is not available to the general public.
In March, Cointelegraph previously reported on concerns surrounding Polymarket traders who earned roughly $1 million after correctly betting the United States would strike Iran before the end of February. That episode drew attention after Bloomberg, citing analytics firm Bubblemaps, reported that some wallets placed bets only hours before explosions were first reported in Tehran.
Cointelegraph also reported separate allegations involving traders making more than $1.2 million by betting on an onchain investigation into DeFi platform Axiom shortly before investigator ZachXBT published accusations related to insider activity. Another example highlighted by Cointelegraph involved a trader who reportedly made about $400,000 by wagering on the capture of Venezuelan President Nicolás Maduro shortly before that news became public.
Across these cases, the common thread is not simply that traders were right—it’s that the timing of certain trades appeared unusual relative to public knowledge. Investigators and lawmakers are increasingly focused on whether that timing could reflect nonpublic access rather than genuine forecasting skill.
Lawmakers push for tighter rules around political outcome trading
Beyond platform-level surveillance, U.S. lawmakers have also signaled they want clearer guardrails for prediction markets tied to political or public-policy outcomes. Last month, Republican Representative Bryan Steil, who chairs the House subcommittee on digital assets, introduced legislation aimed at restricting members of Congress and their immediate families from trading prediction market contracts connected to public policy and political events, according to Cointelegraph’s earlier coverage.
That kind of proposal aligns with the concern surfaced by the teleprompter operator case: prediction markets can involve content that effectively becomes “public” only when a speech is delivered, an official announcement is made, or an event is confirmed. If insiders—whether due to their job duties or privileged access— can anticipate specific wording or developments, markets built on public outcomes can drift toward information asymmetry.
Even when the underlying platform uses monitoring tools, enforcement depends on whether regulators believe the trades reflect actionable misconduct under existing market rules or analogous legal frameworks. The direction of travel in U.S. policy suggests more scrutiny is likely, particularly for markets that depend on politically sensitive disclosures.
What to watch next
For investors, traders, and builders, the key unknown is how regulators frame and prove the alleged information advantage in the Kalshi case. Watch for official regulatory statements or filings from the CFTC that clarify the scope of the conduct, the standard being applied to speech-linked contracts, and whether this becomes a template for future enforcement against other prediction market participants.
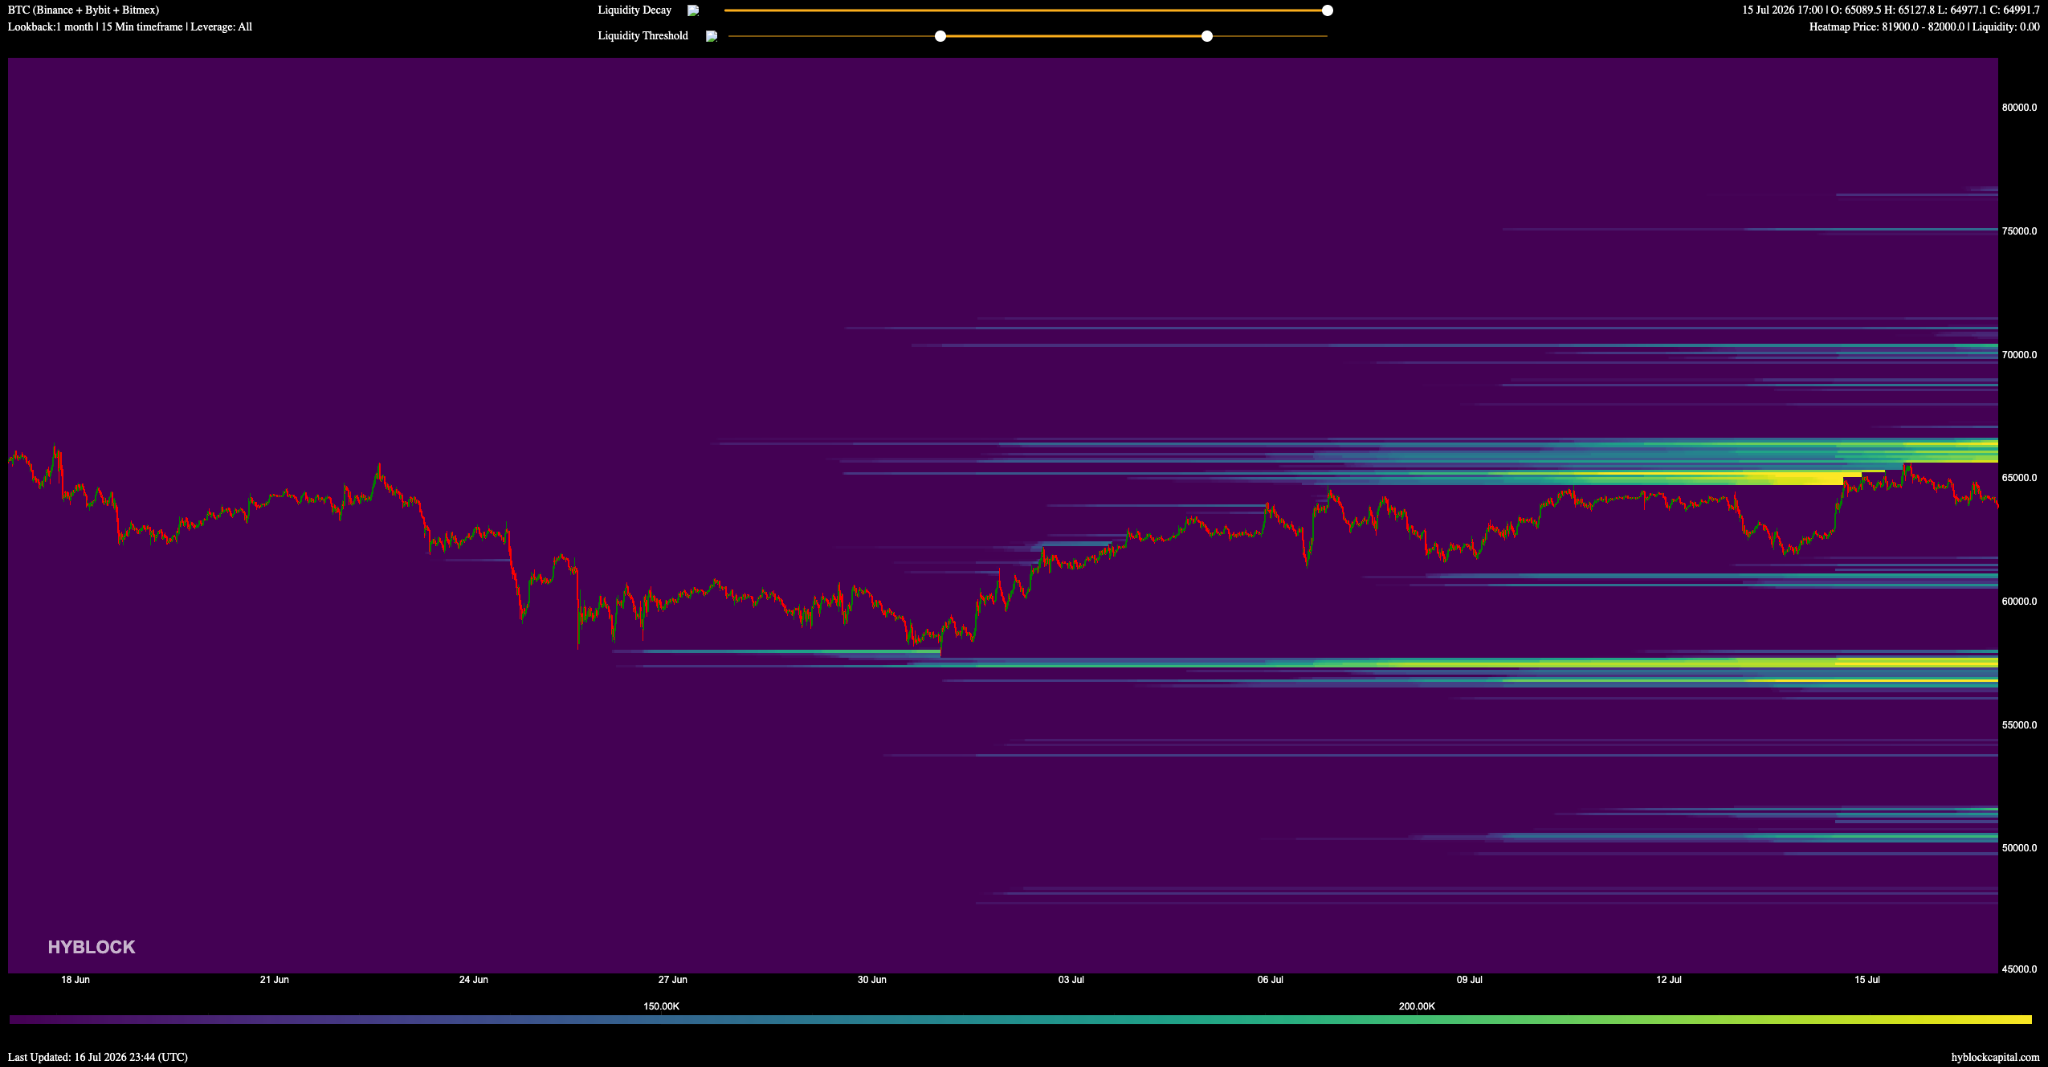
Increased activity across Bitcoin’s (BTC) futures markets is playing the dominant role in its short-term price action, which keeps tracing back to where leveraged positions are stacked. Prices tend to gravitate toward where liquidity is most concentrated, and as Bitcoin battles to hold above $64,000, reviewing current liquidation scenarios may provide insight into BTC’s next move.
Liquidation heatmap data shows a cluster of short positions concentrated between $65,500 and $66,000, roughly 3% away from current market pricing. A push through $65,600 may put that shelf in play and could accelerate a larger rally toward $67,000.
Below market pricing, support is layered in the $63,500 to $63,750 range, with the closest cluster 1% away, and larger liquidity pools are found at $63,000-$63,250 (about 1.5% down) and $62,500-$62,750 (about 2.3% down).
Combined, long-side liquidity across the tracked window outweighs short-side liquidity by nearly two to one, potentially signaling that the bulk of a leverage built up over the past month hasn’t fully closed out.
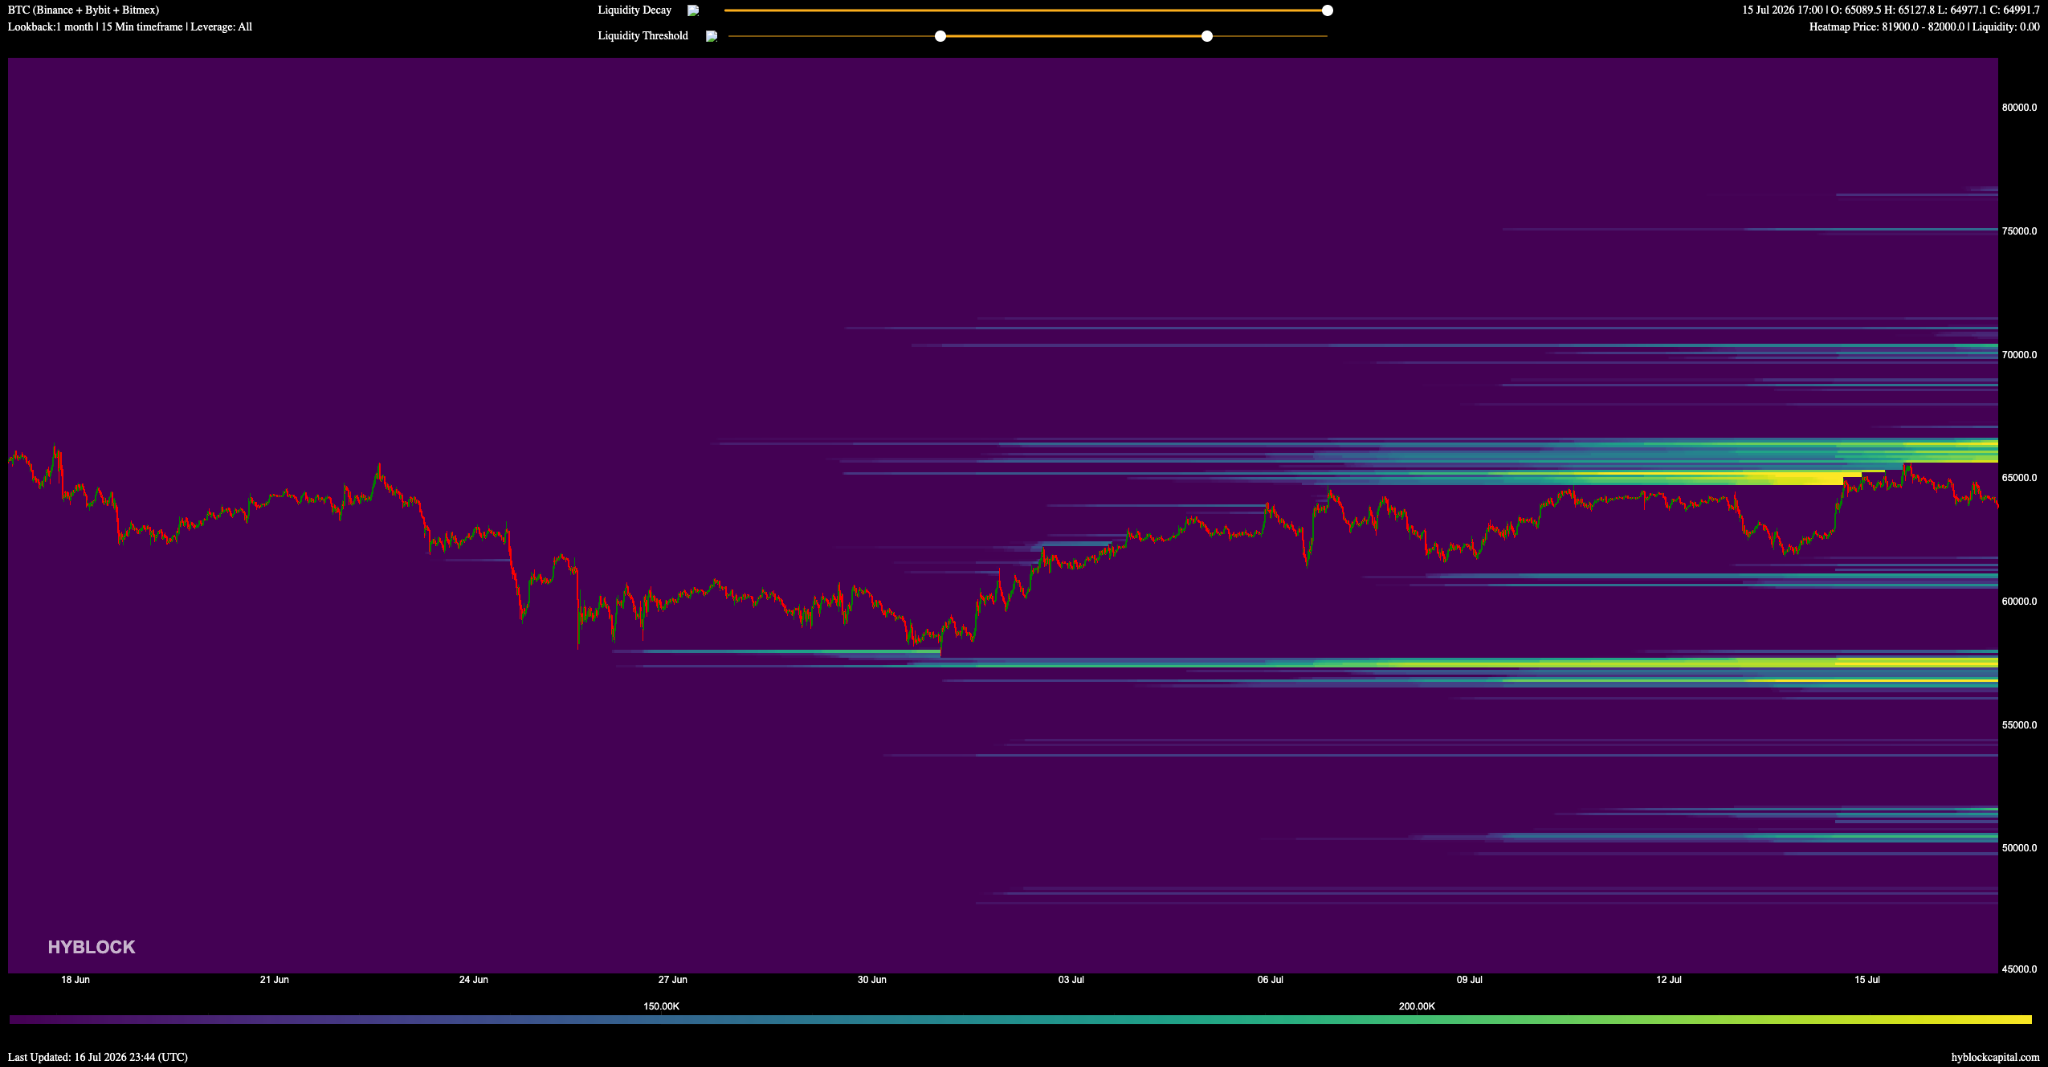
BTC liquidation heatmap, 1-month lookback. Source: Hyblock
In the most bearish scenario, a wide liquidation band near $55,000 (which has built up over the full month lookback) is visible and stands out more than almost anything else on the chart. This magnet could exert its pull on price if support in the $62,500 to $63,750 were to give way.
The last few weeks of price action suggest that Bitcoin may remain rangebound between $60,000 and $67,000, and BTC’s aggregate open interest and funding rate back this view.
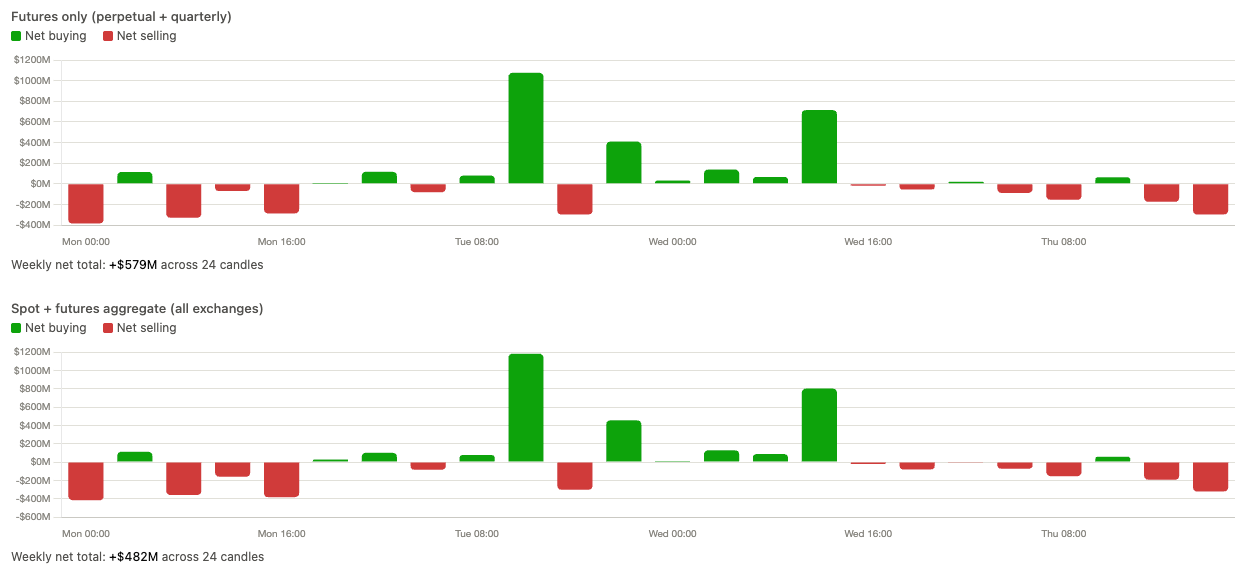
BTC spot and cumulative volume flows. Source: Hyblock
While OI has come down more than 3% from Tuesday’s peak, BTC price has barely moved, and as funding cooled toward neutral, spot and futures flows have favored the buy side over the past week.
Ethereum price has retreated from a two-month high after traders locked in profits, though analysts still expect a push toward $2,000 while key support holds.
Summary
- Ethereum price pulled back after a 5% CPI-driven rally as traders booked profits near $1,930.
- Strong support around $1,850 keeps the technical outlook intact, with $2,000 remaining the next key target.
- Liquidation clusters, ETF flows, and Fed expectations will likely determine Ethereum’s next move.
The June U.S. CPI and PPI data initially fueled a risk-on move across crypto markets, lifting ETH more than 5% before sellers emerged near a major resistance area. The rally briefly pushed Ethereum above a multi-month descending trendline, but momentum faded around $1,930 as short-term traders adopted a classic sell-the-news strategy.
The pullback drove Ethereum (ETH) price as low as $1,878 before buyers returned around the $1,880 region, which now serves as the first line of support after the breakout attempt.
Derivatives activity accelerated the reversal. Funding rates climbed as leveraged longs entered the market during the move above $1,900, leaving positions vulnerable once upside momentum stalled. The retreat triggered a wave of long liquidations across major exchanges, adding forced market-selling pressure to an already weakening spot market.
Macro markets also turned less supportive as the trading session progressed. Oil prices rebounded sharply after the inflation data, reviving concerns that energy costs could complicate the Federal Reserve’s path on interest rates.
Treasury yields moved higher alongside the U.S. Dollar Index, reducing appetite for risk assets and encouraging some investors to rotate capital toward traditional fixed-income markets instead of cryptocurrencies.
Technical structure continues to favor another test of $2,000
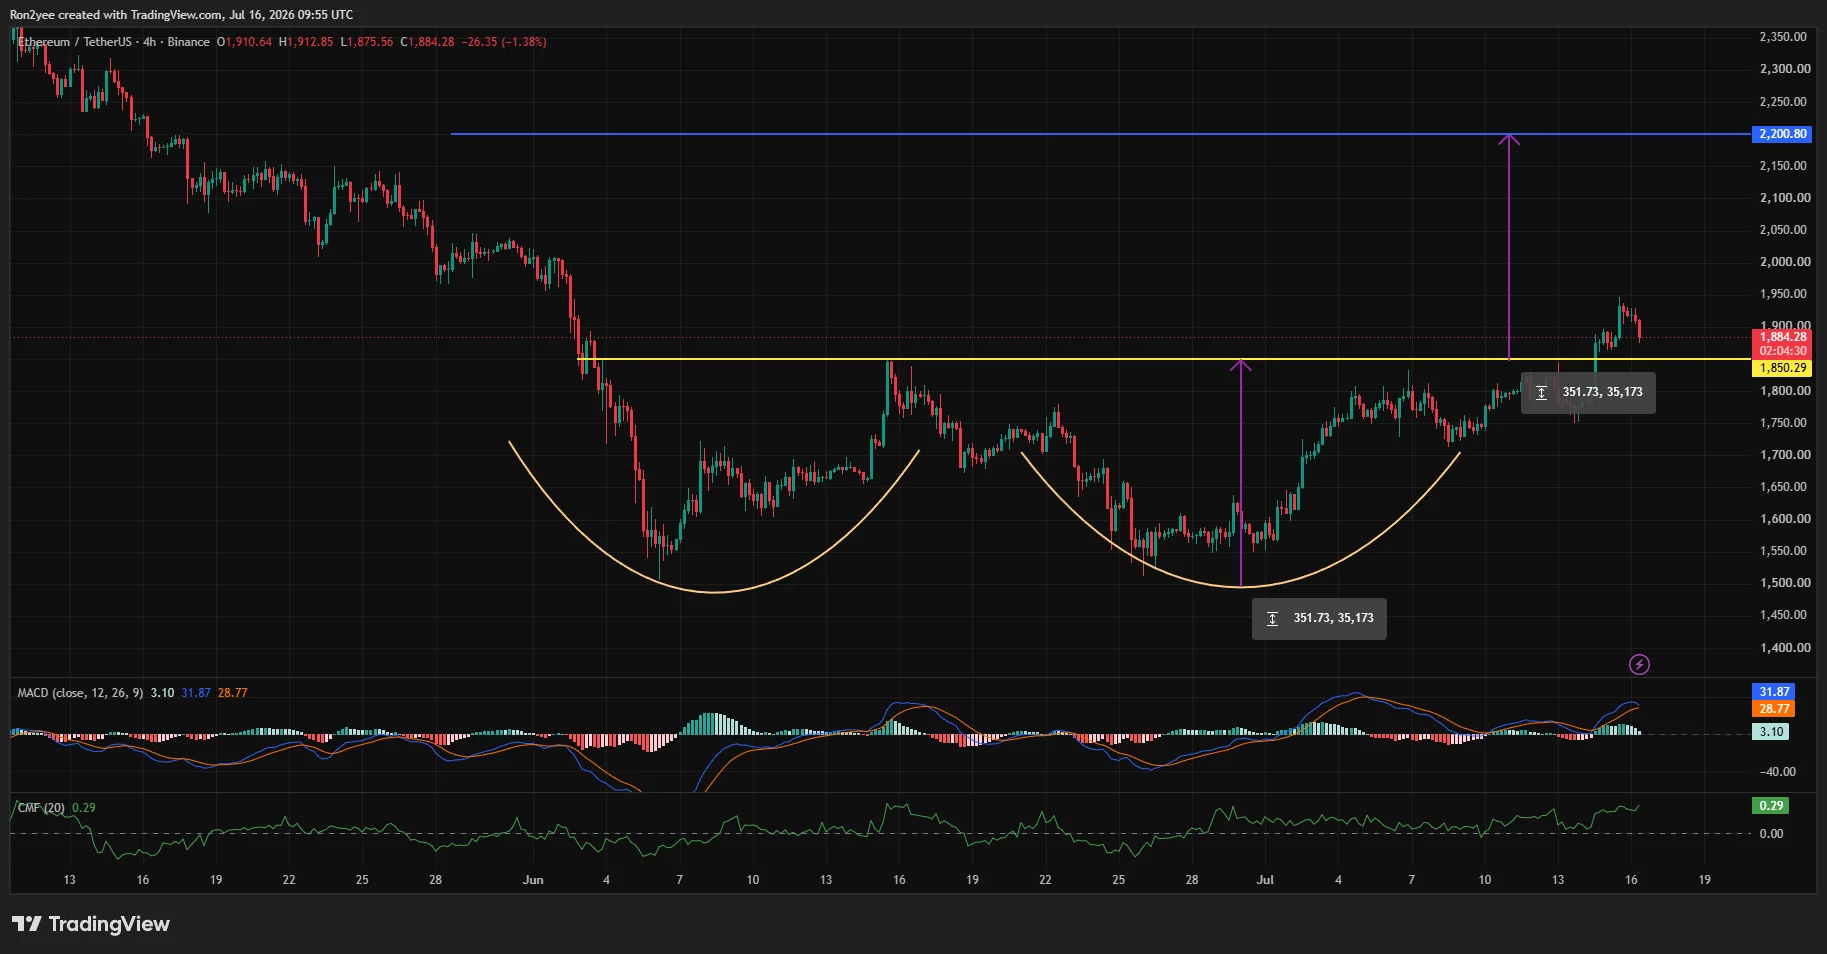
Ethereum’s 4-hour chart still presents a constructive technical picture despite the latest rejection. Price has completed a second rounded-bottom formation after rebounding from the June lows near $1,500 and recently reclaimed the horizontal resistance around $1,850.
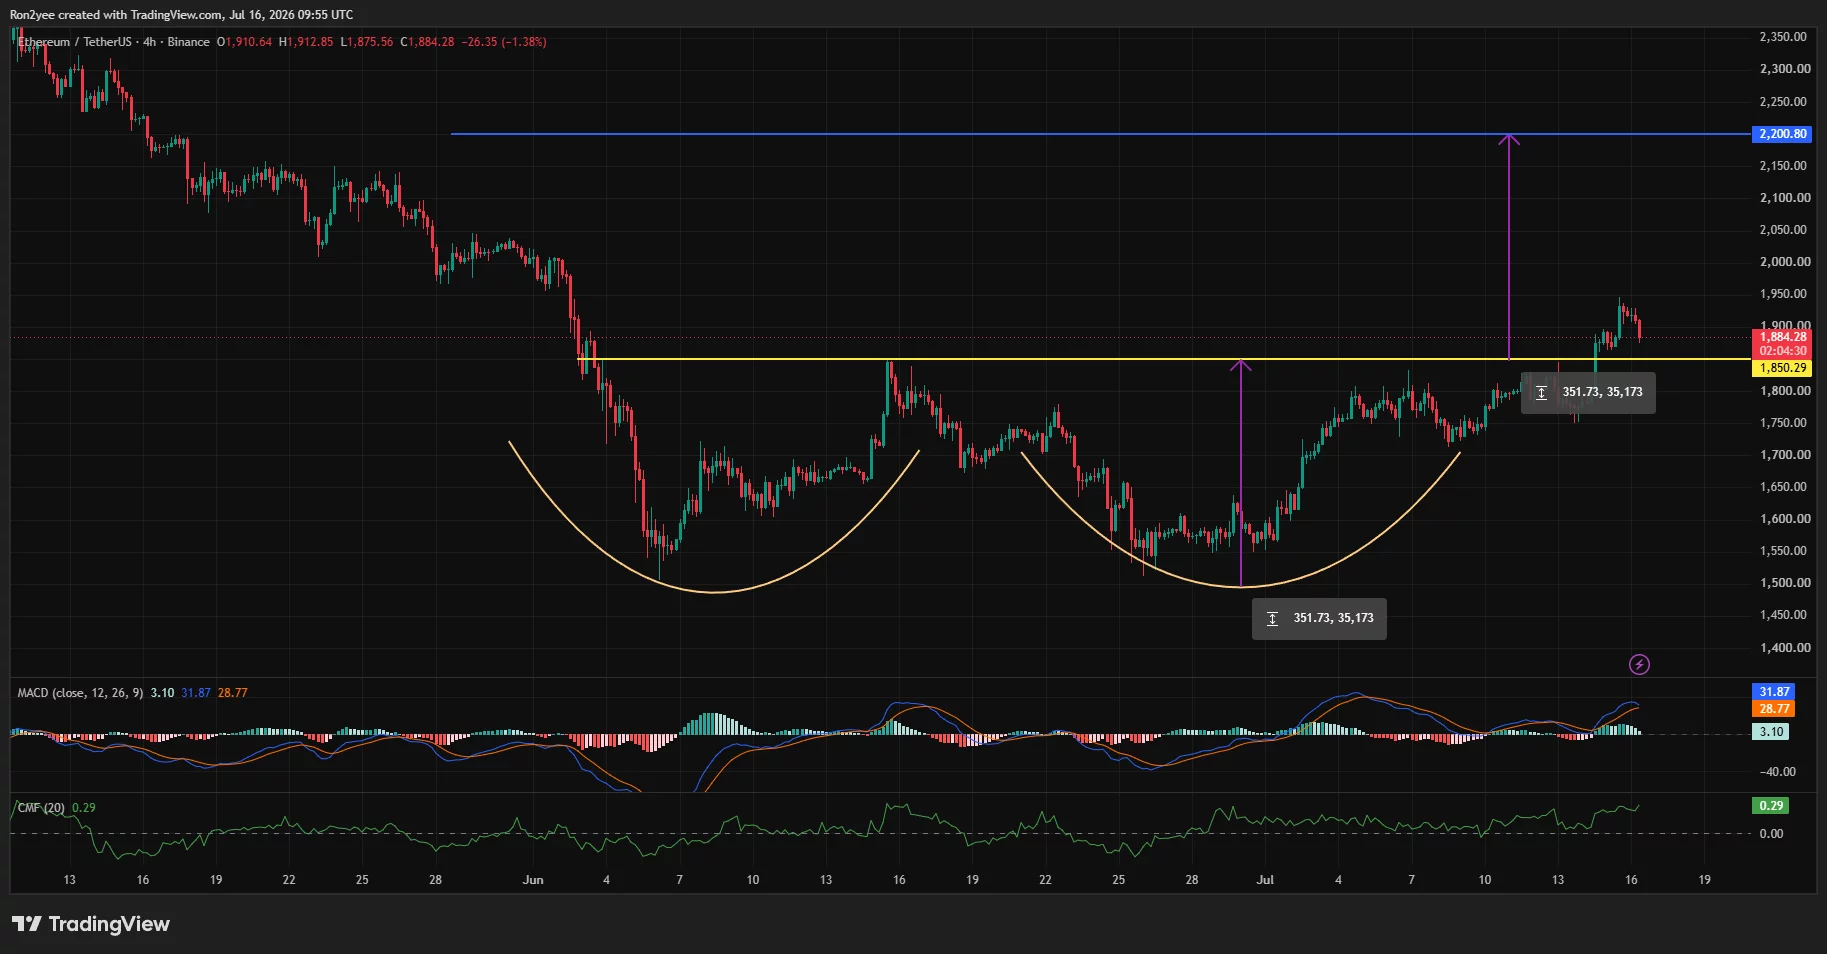
This former ceiling now represents the primary support level, while the measured move from the pattern projects an upside target near $2,200 if buyers regain control above the recent highs.
Momentum indicators continue to lean positive. The MACD remains above the zero line with its signal line intact despite a modest slowdown after the rejection, while the Chaikin Money Flow holds around 0.29, showing capital has continued entering Ethereum over recent weeks instead of exiting the market. Together, those indicators suggest the recent decline has so far resembled profit-taking rather than a complete trend reversal.
Liquidation data also identifies the next battleground. CoinGlass’ 3-day ETH liquidation heatmap shows one of the largest clusters of leveraged positions concentrated between roughly $1,840 and $1,860, reinforcing the importance of that support zone.
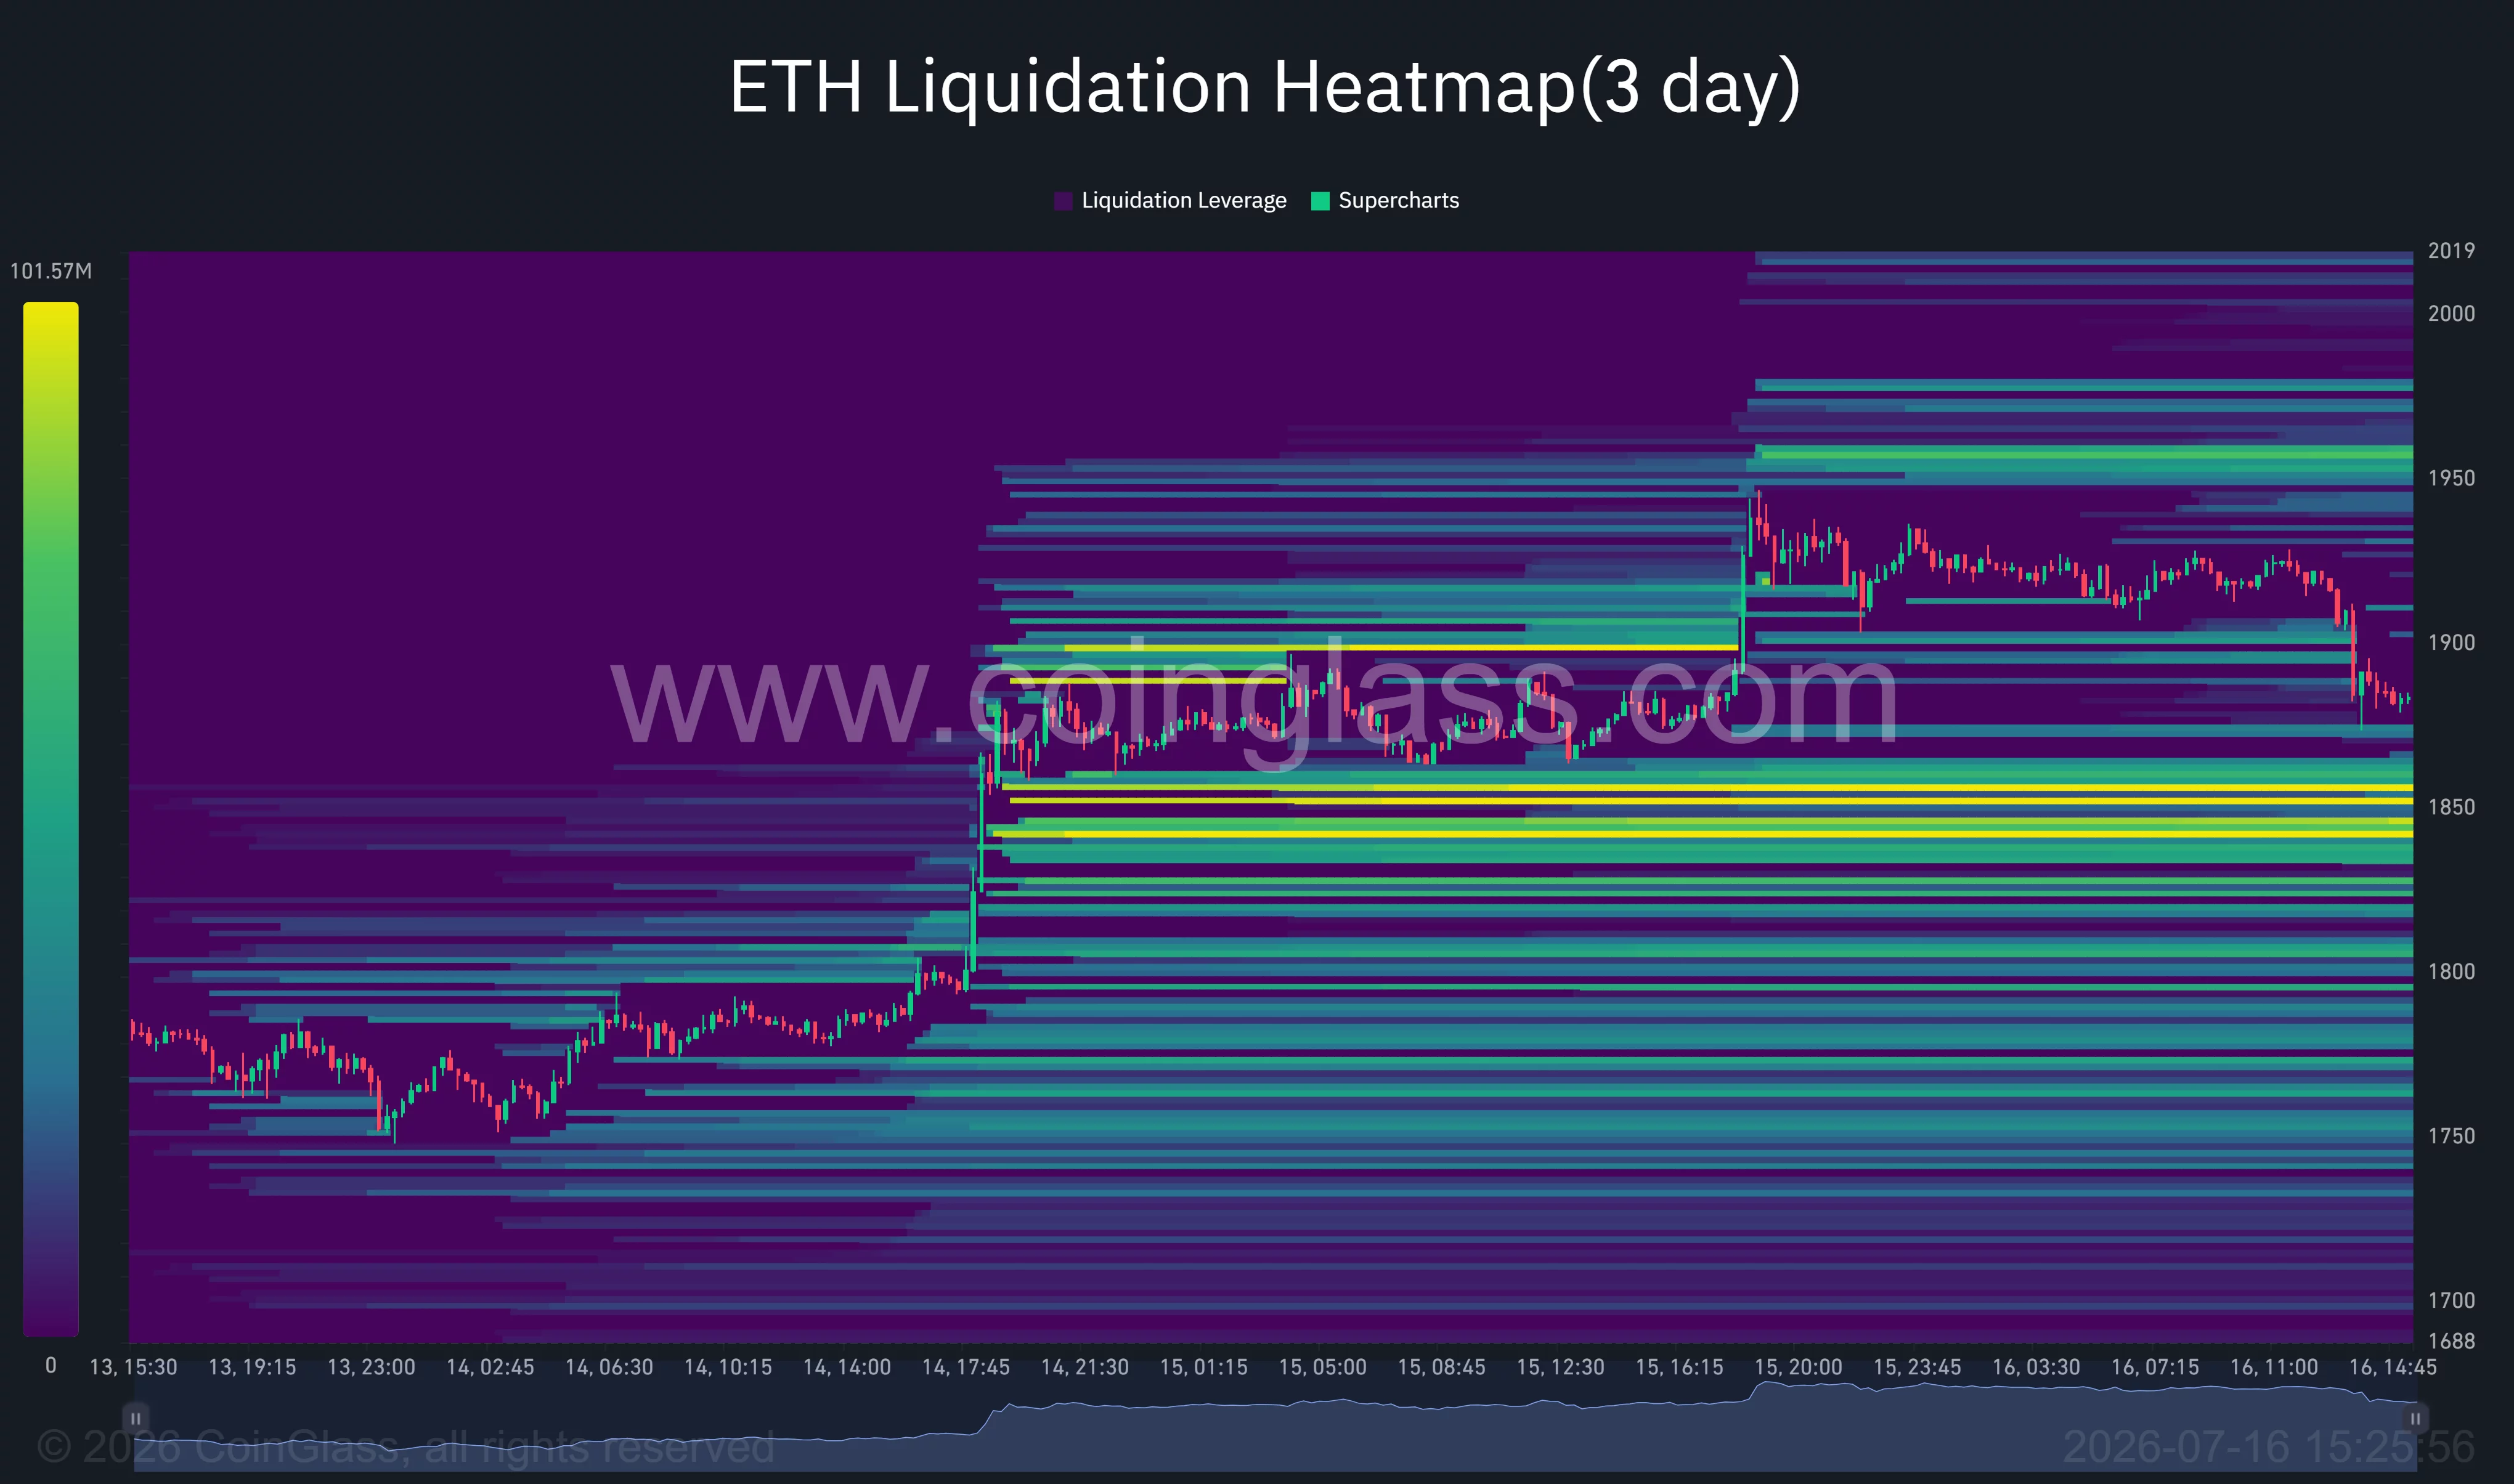
A successful defense there could allow Ethereum to target liquidity around $1,950 before challenging the psychological $2,000 level, where another large concentration of short liquidations sits waiting above price.
Commenting on the move, analyst Ted Pillows noted the recent decline remains a healthy pause rather than the start of a larger correction.
“As long as Ethereum holds above the $1,850 level, the next move will be towards $2,000.”
Separately, according to Michaël van de Poppe, the current environment remains a buy-the-dip market, adding, “There’s a lot more upside going to come on this one.”
Loss of $1,850 could delay the bullish breakout
Several risks could still invalidate Ethereum’s recovery. A decisive break below the $1,850 support would negate the recent breakout and expose the asset to a deeper retracement toward the $1,750-$1,800 region, where another concentration of liquidity has formed. Failure to hold that area would shift attention back toward the June base near $1,500.
Outside the charts, macro developments remain an important variable. Renewed strength in the U.S. dollar, higher Treasury yields, persistent spot ETF outflows, or fresh geopolitical tensions that lift energy prices could reduce demand for crypto assets again.
Exchange inflows from larger holders and continued capital rotation into AI and technology equities also present headwinds, making sustained spot buying essential if Ethereum is to convert its recent breakout into a move above $2,000.
Disclosure: This article does not represent investment advice. The content and materials featured on this page are for educational purposes only.


Crypto exchanges have increasingly positioned themselves as bridges between digital asset markets and traditional finance.


Binance co-founder Changpeng Zhao has weighed into the growing Bitcoin versus artificial intelligence debate as investors compare two of the market’s largest growth themes.
Summary
- CZ says Bitcoin protects against inflation while artificial intelligence offers growth without the same hedge.
- Crypto capital has rotated toward AI, but softer inflation data helped Bitcoin recover above $65,000.
- Upcoming AI listings may compete for liquidity, though macro conditions remain the larger market driver.
In a July 16 post on X, Zhao offered a direct distinction between the two. “AI is great, but it does not protect you against inflation. Bitcoin does.” His comment presents Bitcoin as monetary protection rather than treating AI and crypto as competing technologies with the same purpose.
CZ draws a line between Bitcoin and AI
Zhao’s latest comment comes weeks after he identified artificial intelligence as one factor behind weaker crypto market conditions in 2026. As previously reported by crypto.news, he said new industries such as AI had attracted some speculative capital that might otherwise have entered digital assets.
However, Zhao has not taken a negative position on artificial intelligence itself. In May, he said he preferred investments in the infrastructure supporting AI, including data centers, computing systems and energy. His investment activities have also remained focused largely on Web3, according to earlier crypto.news coverage.
AI investment competes with crypto for capital
The debate has gained attention as major AI companies attract large amounts of investor capital. The expected public listings and fundraising plans involving OpenAI and Anthropic have raised questions about whether investors could sell other liquid assets, including crypto, to fund new equity positions.
A recent crypto.news analysis examined whether major technology listings could drain liquidity from digital assets. The report found that large IPOs can create short-term competition for capital because investors often need to sell existing holdings to fund new allocations. However, broader factors including monetary policy and geopolitical risk also played a major role in Bitcoin’s 2026 decline.
The connection between the two sectors is also becoming less direct. Some former Bitcoin miners are moving part of their infrastructure toward AI computing. As reported by crypto.news, TeraWulf is seeking financing for an AI data center tied to a 20-year Anthropic agreement after expanding beyond its original Bitcoin mining business.
Bitcoin’s inflation case remains tied to macro conditions
Zhao’s statement frames Bitcoin as protection against inflation, but recent price action has shown that the cryptocurrency also responds strongly to interest-rate expectations and global liquidity. Bitcoin recovered above $65,000 after softer US producer inflation reduced expectations for another Federal Reserve rate increase.
June producer inflation came in below market forecasts, helping Bitcoin and other risk assets move higher. Traders reduced expectations for tighter monetary policy following the data, while Ethereum also recovered above $1,900.
That market reaction shows why the Bitcoin versus AI debate does not offer a simple choice between two assets. AI companies compete for investment capital, while Bitcoin trades within a wider market shaped by inflation, interest rates and liquidity.

A stablecoin depeg is not one event. It is two very different events that look identical on a price chart, and confusing them is how traders lose money on coins that were never actually broken.
Summary
- A depeg happens when a stablecoin’s market price moves meaningfully away from its target, almost always one dollar, and does not quickly return. Drift of a fraction of a cent is normal and not a depeg.
- The distinction that matters is between a liquidity depeg, where the exchange price falls but redemption at the issuer still works, and a reserve depeg, where the backing itself has failed. They look the same on a chart and end completely differently.
- The reference cases: TerraUSD collapsed entirely in May 2022, erasing roughly $60 billion. USDC fell to about $0.87 in March 2023 and fully recovered because its reserves were sound.
- Oracles turn depegs into disasters. A protocol that reads a $0.90 exchange price and liquidates collateral can destroy solvent positions in a coin that is still fully backed.
- The GENIUS Act now requires US payment stablecoin issuers to hold full reserves in liquid assets and disclose monthly, which reduces reserve-failure risk without touching liquidity-driven depegs at all.
The word stablecoin contains a promise, and the promise is arithmetic: one token, one dollar, forever. When the number on the screen reads $0.94, something in that arithmetic has broken. What most people never learn is that two entirely different things break, they produce identical-looking charts, and only one of them is a real emergency. In March 2023, USDC traded as low as 87 cents while Circle’s redemption desk continued honoring dollars at par. In May 2022, TerraUSD traded down through the same levels and never came back, taking roughly $60 billion with it. Same visual, opposite outcomes. Learning to tell them apart in real time is one of the more valuable skills in this market, and it starts with understanding what holds a peg up in the first place.
What a depeg actually is
A stablecoin depeg occurs when the market price of a stablecoin deviates from the value it is designed to track and does not promptly revert. Most stablecoins are soft-pegged, meaning small deviations are expected and normal. A coin trading at $0.998 is not depegged. It is a market with an ordinary bid-ask spread.
The threshold is about degree and duration together. A move to $0.995 for a few minutes during a volatile session is noise, corrected by arbitrage almost immediately. A move to $0.90 that persists for days is a broken mechanism. Between those poles is a spectrum, and where a specific event falls on it depends on how far the price went, how long it stayed, and crucially whether the primary redemption channel kept working.
Depegs run in both directions, which surprises people. A stablecoin can trade above its peg when demand outstrips the supply that can be minted quickly, or when a liquidity pool becomes imbalanced. During the March 2023 turmoil, Tether briefly traded as high as $1.15 as capital fled USDC and Curve’s main stablecoin pool skewed hard. Trading above a dollar is a depeg by definition, and it signals stress just as a discount does.
What holds a peg up
Four mechanisms hold the price near target, and understanding them is what lets you diagnose a break.
Reserves and backing. Each token is supposed to have real value behind it: cash, short-term Treasury bills, repo, crypto collateral, or some mixture. Under the GENIUS Act, signed in July 2025, US payment stablecoin issuers must hold full reserves in liquid assets and disclose their composition monthly. Reserves are the ultimate backstop, but they only defend the peg if holders can actually reach them.
Arbitrage through mint and redeem. This is the real engine. If a token trades at $0.98 and an authorized party can redeem it with the issuer for a full dollar, they will buy every cheap token on the market and redeem for a two-cent profit. That buying pressure lifts the price. The mechanism works precisely as well as the redemption channel does, and no better. Note the constraint: Tether’s minimum redemption is $100,000, which means most holders cannot redeem directly and must sell into the market instead.
Secondary market liquidity. Between arbitrage windows, ordinary exchange liquidity absorbs flow. Deep order books and well-balanced pools soak up sell pressure with minimal price impact. Thin ones do not.
Collateral design. Crypto-backed stablecoins such as DAI overcollateralize, requiring roughly 150% collateral value, with automatic liquidation if it falls below a threshold. Algorithmic stablecoins hold no meaningful collateral and rely instead on minting and burning a paired token to absorb supply and demand.
The four are ranked by fragility. Fiat-backed coins with functioning redemption are the sturdiest. Overcollateralized crypto-backed coins are next, vulnerable when their collateral itself is impaired. Algorithmic designs are the weakest, because their backing is circular: the stablecoin’s value depends on demand for a token whose value depends on the stablecoin.
The distinction that matters
Here is the single most useful idea in this article. When a stablecoin’s exchange price drops, ask one question: is the redemption channel still working?
If it is, you are watching a liquidity depeg. Too many people want out at once through a venue with insufficient depth. The price on that exchange falls because the order book cannot absorb the flow, not because the dollars behind the token vanished. The asset’s redemption value is intact. Arbitrage will close the gap once someone with redemption access shows up.
If it is not, you are watching a reserve depeg. The backing is impaired, inaccessible, or was never sufficient. Nobody arbitrages, because there is no profitable trade in buying a token you cannot redeem for more than you paid. The gap does not close. It widens.
Cain O’Sullivan, co-founder of Hyperdrive, has made this point directly: an exchange price is often not a true representation of the actual redemption value of the asset. The market price and the redemption value are two different numbers, and during stress they diverge violently.
The practical test has three parts. Check whether the issuer’s mint and redeem facility is still operating. Check whether the discount is uniform across venues or concentrated on one. And check whether the reserves are disclosed, liquid, and reachable. A discount on one exchange while the coin trades near par elsewhere is a venue problem. A discount everywhere with redemption frozen is an issuer problem.
The cases worth knowing
TerraUSD, May 2022. The reserve failure. UST was algorithmic, holding no meaningful collateral, and maintained its peg through a mint-and-burn relationship with its sister token LUNA. When confidence broke and holders rushed the exit, the mechanism did what it was designed to do and minted LUNA to absorb the selling. LUNA’s supply exploded from roughly 342 million to about 6.5 trillion tokens, destroying its value, which destroyed the only thing backing UST. Around $60 billion of value was erased and the broader market lost several hundred billion more. The US Treasury Secretary cited it as evidence of rapidly growing risks in the sector. This is the textbook reserve depeg: no collateral, circular backing, no recovery.
USDC, March 2023. The liquidity depeg that looked fatal. Circle disclosed that $3.3 billion of its roughly $40 billion in reserves was trapped at the collapsed Silicon Valley Bank. USDC fell to around $0.87. DAI depegged alongside it, because USDC made up over half of DAI’s collateral, a clean illustration of contagion through collateral chains. But the reserves were real. When the FDIC announced a systemic risk exception covering the bank’s depositors, the peg restored fully. Anyone who panic-sold at $0.88 realized apermanent loss on an asset that was solvent the entire time.
Tether, June 2023. The pool imbalance. USDT slipped to about $0.977 when its share of Curve’s main stablecoin pool ballooned past 70% against a balanced target near a third. Nothing about Tether’s reserves changed. The pool became lopsided, and a lopsided pool prices the overweight asset down. Kaiko noted it looked like a possible deliberate attempt to break the peg.
USDR, October 2023. Collateral that could not be sold. Real USD faced roughly $10 million in redemption requests that drained its liquid DAI reserves, leaving collateral consisting largely of tokenized real estate. The assets existed. They could not be liquidated fast enough to meet redemptions. Illiquid backing is functionally the same as absent backing during a run.
USDe, October 2025. The oracle depeg. During a market-wide liquidation event of roughly $19 billion, Ethena’s USDe briefly printed 65 cents on Binance while trading at near parity on decentralized venues such as Curve. The protocol was around 110% collateralized and its design held. What failed was Binance’s internal oracle and order book depth. The 65-cent print was a venue artifact, not a valuation.
xUSD, November 2025. The disclosure shock. The token fell roughly 77% in a single day after its issuer disclosed a $93 million loss tied to one external fund manager. It had traded at a dollar until the moment the mechanism behind it was revealed to be impaired.
How a depeg spreads
Depegs rarely stay contained, and the transmission runs through three channels.
Collateral chains. When one stablecoin backs another, impairment travels. DAI followed USDC down in 2023 for exactly this reason. Today’s version of the question is which assets sit inside which reserves, and tokenized money market funds have begun appearing in stablecoin reserve baskets, which creates new linkages worth tracking.
Oracle-driven liquidation. This is the most destructive channel and the least understood. DeFi lending protocols price collateral using oracles. If an oracle reports the market price of a stablecoin at $0.90, the protocol sees undercollateralized loans and liquidates them, even when the stablecoin is fully backed and will be at par within hours. Those liquidations dump more supply, pushing the price lower, triggering more liquidations. O’Sullivan describes the result as a death spiral in an asset that never actually failed. The fix is pricing collateral by redemption rate instead of by market quote, anchoring valuation to actual backing.
Reflexive panic. A depeg is a bank run in public. Once the price prints below a dollar, holders who never thought about reserves start selling, which pushes it further below, which convinces more holders. In 2022, Tether processed over $13 billion in redemptions within a week as fear spread from Terra, and Tether was not the coin that failed.
Why the stakes keep rising
The stablecoin market now exceeds $300 billion, with the largest coins holding close to 90% of supply, and the sector functions as the settlement layer for most crypto trading. That combination of scale and concentration is the systemic worry. A depeg of a minor token is a bad day for its holders. A depeg of a dominant one is a repricing of the entire market’s unit of account, because trading pairs, collateral, and DeFi accounting are all denominated in it.
The GENIUS Act addresses one half of the problem well and the other half not at all. Full liquid reserve requirements and monthly disclosure make reserve failures materially less likely for compliant US issuers, which is the half that killed Terra. It does nothing about liquidity depegs, oracle mispricing, or thin pools on individual venues, which is what produced the USDC, USDT, and USDe episodes. The likeliest future depeg is therefore not a collapse. It is a solvent coin printing a scary number on one exchange while a protocol somewhere liquidates people who did nothing wrong.
The three families, ranked by how they break
Because the failure mode depends almost entirely on the design, it is worth walking each family and naming exactly what kills it.
Fiat-backed coins. USDC and Tether are the archetypes. Each token is meant to correspond to a dollar or dollar-equivalent held off-chain in cash and short-term Treasuries. The strength is obvious: the backing is boring, liquid, and reachable. The weakness is that it lives in the traditional banking system, which introduces a counterparty crypto cannot audit. USDC did not depeg in 2023 because of anything on-chain. It depegged because a bank in California failed. That is the structural exposure of the entire category: the safest stablecoin design is only as safe as the least safe bank holding its reserves. The second weakness is redemption access. If direct redemption carries a $100,000 minimum, as Tether’s does, then the arbitrage that defends the peg is available to a small set of large players, and everyone else is a price-taker on the secondary market. The peg is defended on your behalf by people whose interests may not align with yours during a panic.
Crypto-backed coins. DAI is the reference. Collateral sits in smart contracts, overcollateralized at around 150%, with automatic liquidation if the ratio breaks. The strength is transparency: you can verify the collateral yourself, on-chain, right now, which is impossible with a bank account. The weakness is that crypto collateral is volatile, and a market crash triggers mass liquidations exactly when liquidity is thinnest. The subtler weakness is composition. DAI followed USDC down in March 2023 because USDC made up more than half its collateral. A crypto-backed coin backed substantially by a fiat-backed coin inherits every risk of the fiat-backed coin and adds liquidation mechanics on top. Verifying that collateral exists is not the same as verifying it is uncorrelated.
Algorithmic coins. TerraUSD is the tombstone. No meaningful collateral, with stability maintained by minting and burning a paired token. The design’s appeal was that it scaled without needing reserves, which is another way of saying it produced dollars from confidence. The failure is not a bug; it is the mechanism working as specified. When holders sold, the protocol minted LUNA to absorb them, which diluted LUNA, which reduced the value of the only thing backing UST, which prompted more selling. The technical term is a death spiral and the plain term is that the backing was circular. Every purely algorithmic design shares this property: the collateral’s value depends on demand for the stablecoin whose value depends on the collateral. Under stress, both variables go to zero together.
The practical hierarchy that falls out is unromantic. Fiat-backed coins with transparent reserves and functioning redemption fail rarely and recover when they do. Crypto-backed coins fail more often, recover usually, and inherit whatever their collateral is exposed to. Algorithmic coins fail rarely and terminally. The frequency ranking and the severity ranking run in opposite directions, which is exactly why the category confuses people: the coins that wobble most are the ones most likely to come back, and the one that never wobbled until the day it died is the one that took $60 billion with it.
Reading a depeg without panicking
If you hold stablecoins, the practical guidance is unglamorous and short.
Know what backs your coin, and whether that backing is liquid. Cash and short-dated Treasuries are reachable in a crisis. Tokenized real estate is not. Algorithmic backing is not backing.
Watch redemption, not price. The exchange quote is the noisiest signal available during stress. Whether the issuer is still honoring redemptions at par is the informative one.
Compare across venues. A discount on one exchange and parity elsewhere is a liquidity event. A uniform discount is a solvency question.
Do not sell into a liquidity depeg on reflex. Every holder who dumped USDC at $0.88 in 2023 paid twelve cents for the privilege of being wrong about a solvent asset. Equally, do not hold an algorithmic coin through a break on the theory that it recovered last time, because Terra did not.
Understand that spreading holdings across several stablecoins reduces single-issuer exposure and does nothing about correlated collateral. If three coins all hold the same asset in reserve, you own one risk wearing three names.
The uncomfortable truth is that a depeg is a test that reveals what a stablecoin always was. The peg was never a property of the token. It was a claim about a mechanism, and stress is the only thing that ever checks whether the claim was true.
Disclaimer: This article is for information and educational purposes only and does not constitute financial or investment advice. Stablecoins carry issuer, reserve, regulatory, and liquidity risk, and past recoveries do not indicate future ones. Nothing here is a recommendation to buy, hold, or sell any asset. Always do your own research. Information is accurate as of July 16, 2026.
Frequently Asked Questions
What is a stablecoin depeg?
A depeg occurs when a stablecoin’s market price moves meaningfully away from its target value, almost always one dollar, and does not quickly return. Most stablecoins are soft-pegged, so drift of a fraction of a cent is normal market noise. A depeg is defined by both degree and duration: a large move, or a smaller one that persists for days, indicates the stabilizing mechanism has broken down.
Why do stablecoins depeg?
Four broad causes. Liquidity imbalances, where too many holders sell at once into insufficient exchange depth. Reserve problems, where the backing is impaired, inaccessible, or illiquid. Design flaws, particularly in algorithmic coins whose backing is circular. And external shocks such as a bank failure, regulatory action, or a code bug. Liquidity causes are far more common than reserve failures.
Is a depeg always a collapse?
No, and this is the most important distinction. If the issuer’s redemption channel still works and reserves are sound, arbitrage restores the peg. USDC fell to roughly $0.87 in March 2023 and recovered completely once its reserves were confirmed. If the backing has actually failed, as with TerraUSD, there is no recovery, because nobody will buy a token they cannot redeem for more than they paid.
What happened with TerraUSD?
UST was algorithmic, holding no meaningful collateral, and maintained its peg by minting its sister token LUNA to absorb selling. In May 2022, confidence broke, the mechanism minted LUNA supply from roughly 342 million to about 6.5 trillion tokens, and LUNA’s value collapsed, destroying the only backing UST had. Around $60 billion was erased, with several hundred billion more lost across the broader market.
Can a stablecoin trade above one dollar?
Yes, and that is also a depeg. It happens when demand exceeds the supply that can be minted quickly, or when a liquidity pool becomes imbalanced. Tether traded as high as roughly $1.15 during the March 2023 stress as capital fled USDC and Curve’s main pool skewed. A premium signals stress in the same way a discount does.
How do oracles make depegs worse?
DeFi lending protocols price collateral using oracle feeds. If an oracle reports a market price of $0.90 for a stablecoin that is fully backed, the protocol sees undercollateralized loans and liquidates them. Those liquidations add sell pressure, pushing the price lower and triggering more liquidations. Ethena’s USDe printed 65 cents on Binance in October 2025 while trading near par on Curve, driven by venue oracle and order book failure rather than any reserve problem.
Does the GENIUS Act prevent depegs?
Partially. It requires US payment stablecoin issuers to hold full reserves in liquid assets and disclose composition monthly, which materially reduces the risk of reserve failures like Terra’s. It does nothing about liquidity depegs, oracle mispricing, or thin liquidity on individual venues, which caused the USDC, Tether, and USDe episodes. Compliant issuers are safer, not immune.
How can I protect against a depeg?
Understand what backs each coin you hold and whether that backing is liquid and reachable. Prefer issuers with transparent, regularly attested reserves. Treat algorithmic designs with far more caution. Watch whether redemption is functioning instead of reacting to an exchange quote, and compare pricing across venues to separate a local liquidity problem from a genuine solvency problem. Holding several coins that share the same reserve assets does not diversify the risk.
Ondo price has surged nearly 20% over the past 24 hours after the protocol unveiled tokenized U.S. equities backed by DTC tokenized entitlements, lifting ONDO well ahead of a largely range-bound crypto market.
Summary
- ONDO jumped 20% after launching tokenized U.S. equities through the DTCC Tokenization Service pilot.
- A breakout above a multi-month falling wedge has shifted focus toward the $0.47 resistance level.
- Short liquidation clusters near $0.38-$0.39 could fuel additional upside if bullish momentum continues.
The rally gathered pace after Ondo announced its integration with the Depository Trust Company and participation in the DTCC Tokenization Service pilot, allowing on-chain exposure to assets such as the SPDR S&P 500 ETF (SPYon) and Circle stock (CRCLon).
The launch strengthened Ondo’s position in the rapidly expanding real-world asset sector and pushed daily trading activity sharply higher as buyers piled into the token.
Commenting on the move, crypto analyst Michaël van de Poppe argued that the catalyst could have lasting effects rather than a one-day spike. “I don’t think the run will stall, there’s more in the tank to come on this one,” he wrote on X after highlighting Ondo’s DTCC partnership announcement.
Technical breakout has opened the path toward higher resistance
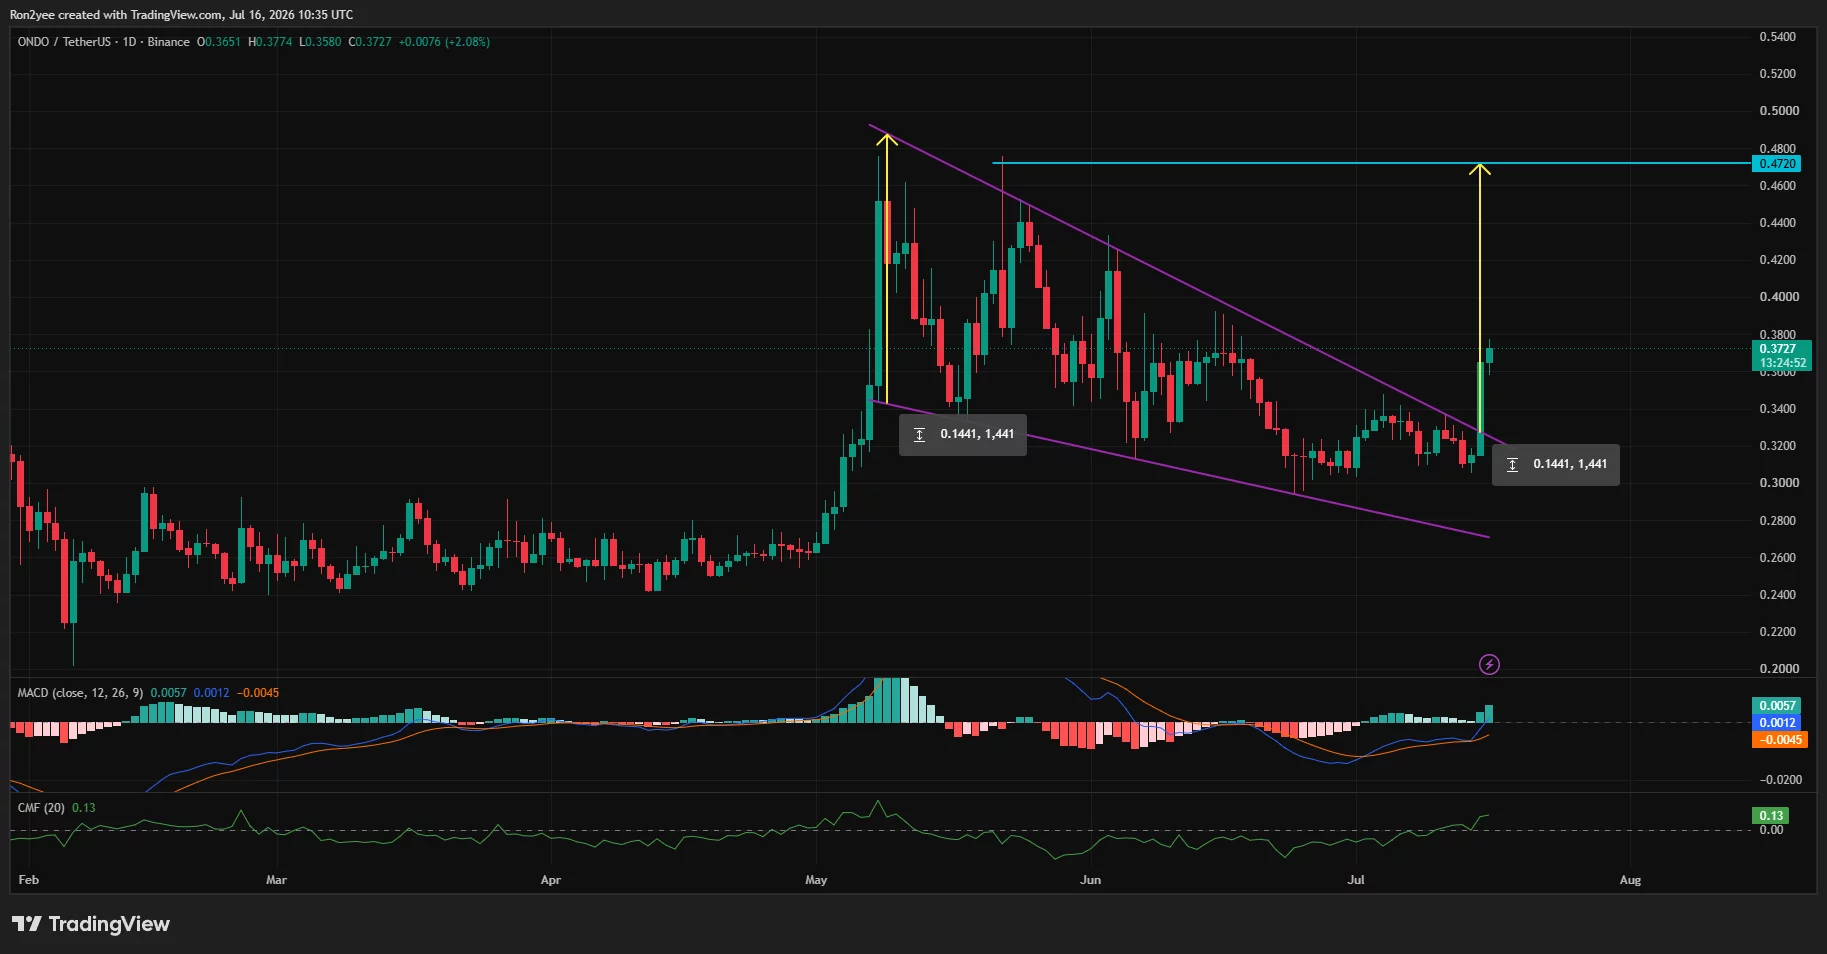
The daily chart shows Ondo (ONDO) breaking decisively above the upper trendline of a descending wedge that had contained price action since May. The breakout also invalidated a series of lower highs and pushed the token back above the short-term resistance area near $0.34. At the time of writing, ONDO is trading around $0.37, with the next major resistance sitting near $0.47, the level where the token previously reversed in May.
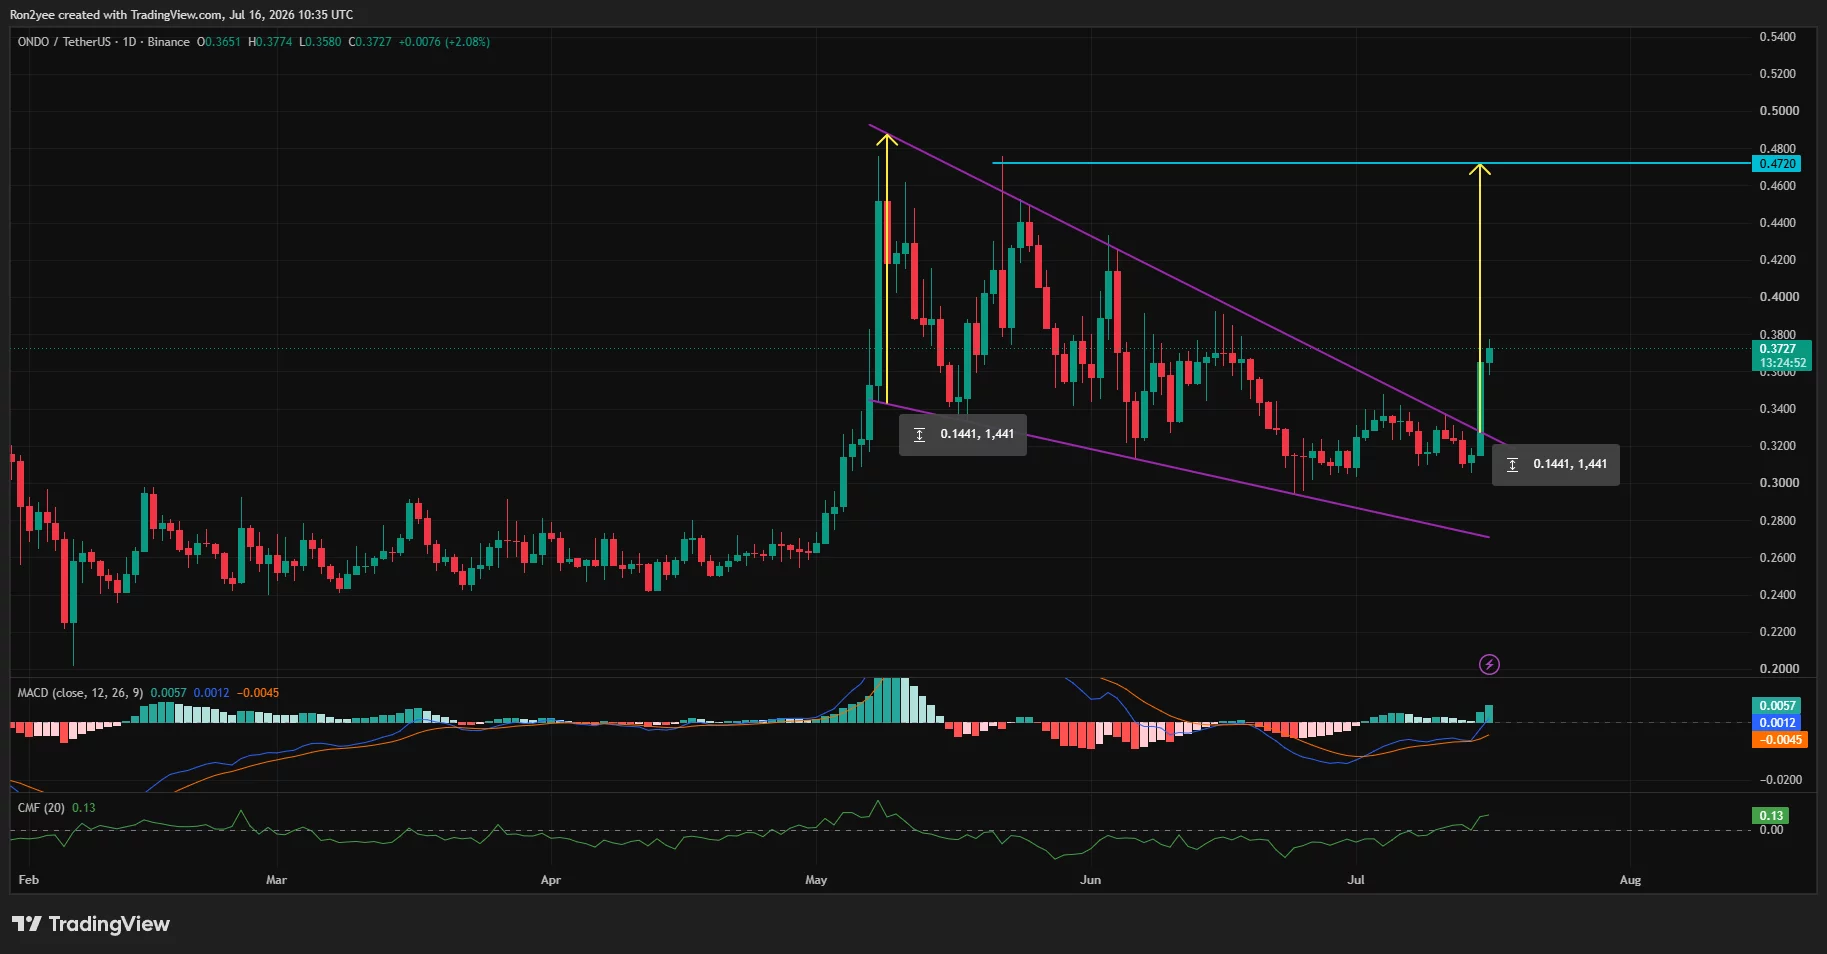
Momentum indicators have also turned constructive. The MACD has completed a bullish crossover with expanding positive histogram bars, while the Chaikin Money Flow has climbed to around 0.13, suggesting fresh capital has entered the market alongside the breakout.
Maintaining support above the former wedge resistance around $0.34–$0.35 would keep the bullish structure intact, whereas a loss of that zone could expose the token to a retest of the $0.32 area.
Derivatives positioning also favors elevated volatility. CoinGlass’ three-day liquidation heatmap shows dense short liquidation clusters between $0.38 and $0.39, just above the current market price.
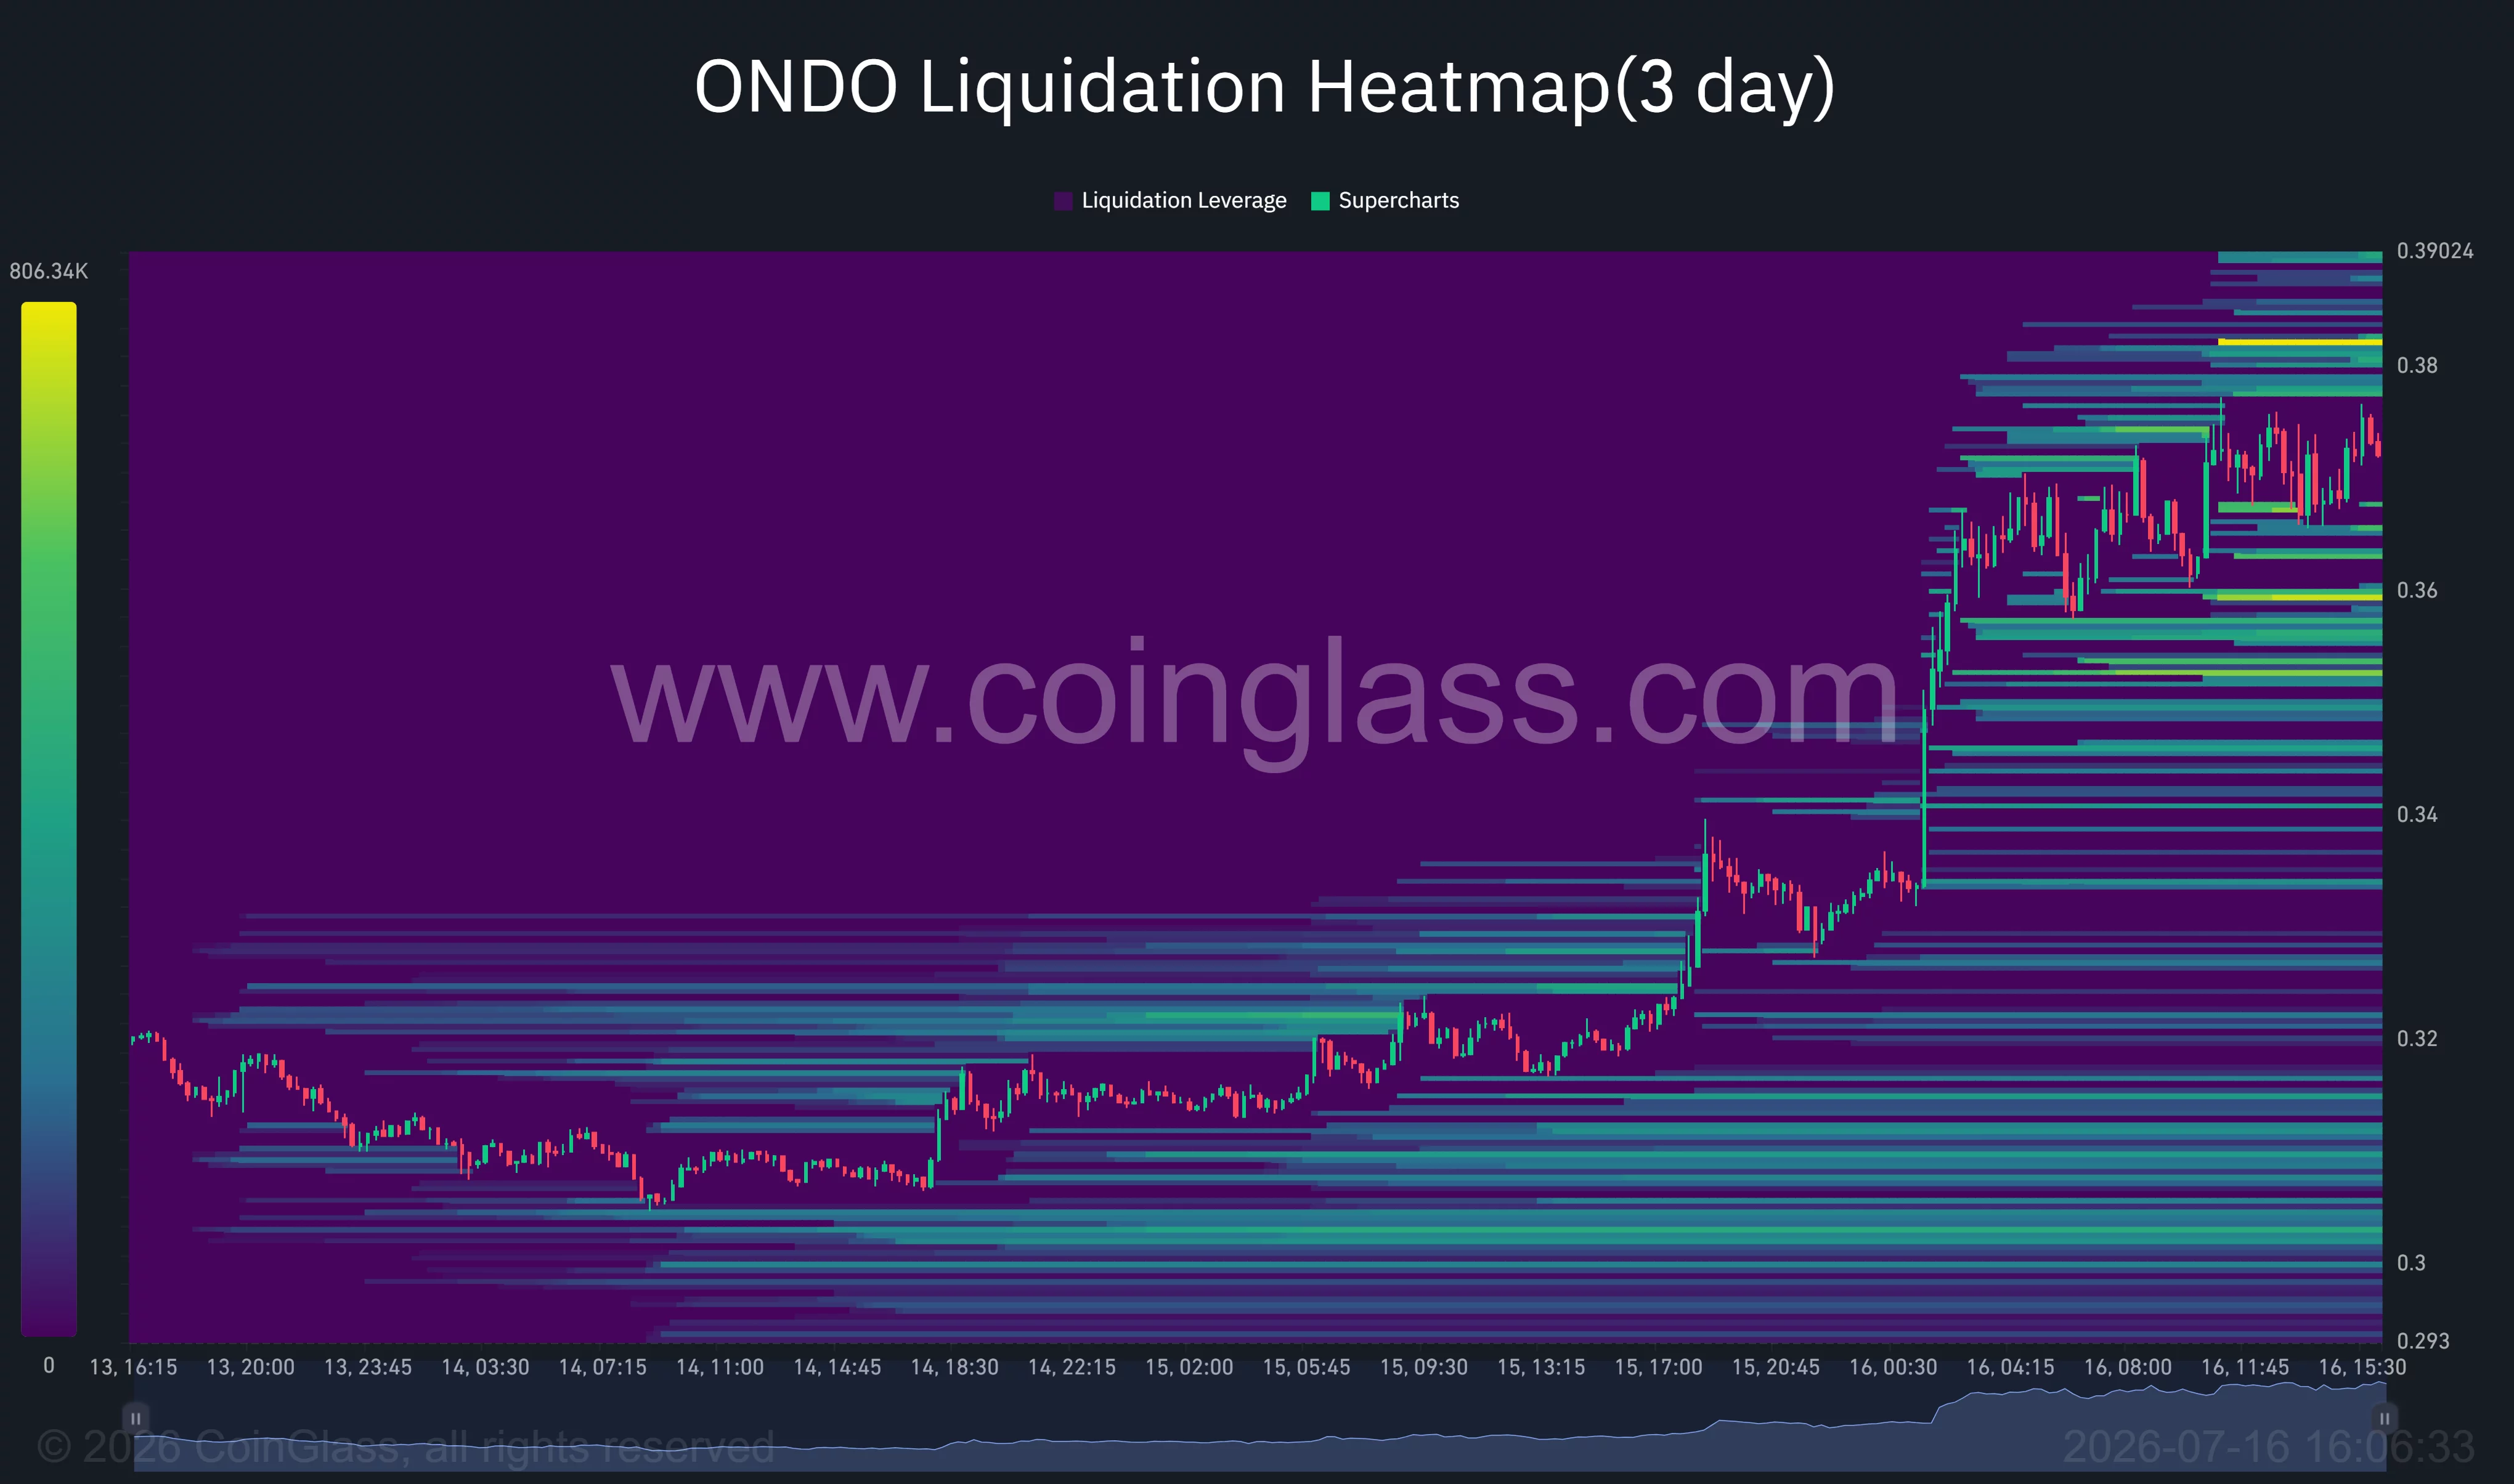
A sustained push into that range could trigger another wave of forced short covering. Below the market, sizeable liquidity remains concentrated around $0.35 and $0.34, making those levels the first areas traders are likely to watch if momentum weakens.
Institutional adoption continues to strengthen Ondo’s investment case
The latest product launch adds to Ondo’s institutional strategy, which centers on bringing regulated financial assets onto public blockchains instead of replacing traditional markets. Participation alongside firms involved in the DTCC ecosystem, including major Wall Street institutions, has strengthened investor confidence in Ondo’s long-term role within tokenized securities infrastructure.
The product rollout also expands utility across the network. Ondo Perps now allows eligible users outside the United States to trade perpetual futures linked to tokenized equities with leverage while using tokenized stocks as collateral.
At the same time, marketing campaigns with partners such as Trust Wallet have widened retail access to assets including NVDAon, GOOGLon, and TSLAon through zero-fee promotions, adding another demand driver beyond speculative trading.
Although macro uncertainty surrounding interest rates continues to limit risk appetite across digital assets, ONDO has attracted capital through a project-specific catalyst rather than a marketwide rally.
As long as buyers defend the breakout zone and institutional adoption continues to expand, traders will likely focus on whether the token can challenge the $0.47 resistance over the coming sessions.
Disclosure: This article does not represent investment advice. The content and materials featured on this page are for educational purposes only.


Robinhood spent months positioning its blockchain as regulated infrastructure for tokenized stocks. Two weeks after launch, tokenized assets account for about 4% of it, a cat token was worth twelve times the entire real-world asset base, and the CEO was posting that it works great for memes too.
Summary
- Robinhood Chain launched July 1 as a permissionless Ethereum layer 2 built for tokenized real-world assets, and within two weeks became one of crypto’s busiest new networks with roughly $312 million locked and 3.6 million daily transactions.
- Tokenized real-world assets, the entire reason the chain exists, account for only about $12.8 million of value and roughly 4% of activity.
- CASHCAT, a memecoin named after Robinhood’s original working name, reached a market cap near $156 million and at its peak was worth about twelve times every tokenized asset on the chain combined.
- CEO Vlad Tenev said on July 2 that assets without utility do not last. Six days later he posted that the chain works great for memes too, and followed the token’s account.
- The cycle has already turned: Noxa, the launchpad driving the boom, earned an estimated $12 million in fees, stopped accepting launches on July 11, and went dark two days later as CASHCAT fell sharply.
On July 1, at a London keynote billed as The World Is Flat, one of America’s largest retail brokerages turned on its own blockchain. Robinhood Chain went live as an Ethereum layer 2 built on Arbitrum’s Orbit stack, carrying 95 tokenized equities priced by Chainlink oracles, a Uniswap deployment for liquidity, Morpho-powered lending, and access wired into a wallet used across more than 120 countries. The pitch was specific and repeated for months: a regulated venue where tokenized real-world assets plug into decentralized finance. For readers new to the launch, crypto.news has also explained the full architecture and Stock Token rules. Two weeks later the chain is a genuine success by every headline metric and a conspicuous failure at the one thing it was built for. The busiest thing on Robinhood’s real-world-asset chain is a cartoon cat.
What the chain actually built
Start with the architecture, because Robinhood did the engineering seriously. Robinhood Chain is a permissionless layer 2 on Arbitrum’s Orbit stack, using ether for gas, running roughly 100-millisecond block times, and settling to Ethereum mainnet from day one. Fees run a fraction of a cent. The flagship product is Stock Tokens, on-chain versions of equities including Nvidia, Apple, and Alphabet that trade around the clock and can move through DeFi as collateral. Day-one partners included Uniswap with a dedicated automated market maker, Chainlink providing oracle pricing across the 95 equities, Morpho for lending, and BitGo for custody.
The strategic logic behind it is coherent and worth taking seriously. Robinhood spent 2025 assembling the pieces: it acquired Bitstamp for trading and institutional infrastructure, WonderFi for Canadian licensing, and ran European tokenized-equity pilots as legal and product rehearsal. A public testnet processed millions of transactions from February. The July launch composed those pieces into a single architecture: assets tokenized on its own network, traded through its own wallet and partner venues, financed through integrated lending, and custodied through its own stack. The composition, more than any single component, is the product. It is a vertically integrated on-chain brokerage built around the use case the chain was built for.
The business case is equally clear once you read the earnings. Robinhood’s crypto transaction revenue fell 47% year over year to $134 million in the first quarter of 2026, and native-app crypto trading volume dropped 48% to $24 billion. The company cut roughly 10% of its workforce, about 290 employees, weeks before the launch, absorbing $28 million in restructuring charges. Total revenue of $1.07 billion and platform assets growing 39% to $307 billion show the wider business is healthy, but the blockchain pivot is explicitly designed to swap volatile transaction revenue for infrastructure and distribution income. Robinhood is not dabbling. It is trying to become the rails.
What actually showed up
The traffic arrived immediately, and it was spectacular. Within two weeks Robinhood Chain had drawn roughly $312 million in total value locked, nearly 800,000 lifetime active addresses, and processed 3.6 million transactions in a single day, with $838 million of decentralized exchange volume over 24 hours. A Bernstein research note counted $3.1 billion in DEX activity across the first seven days, and the network briefly ranked third in daily DEX volume behind only Solana and BNB Chain. More than 65,000 users held around $320 million in stablecoins on it. By any conventional measure of a chain launch, this was a triumph.
Then look at the composition, and the picture inverts. According to Dune Analytics data, asset management accounts for about 40.5% of value locked and lending 38.3%, with spot exchanges at 11.9% and perpetual futures at 5.2%. Real-world assets, the flagship use case behind the chain’s existence, sit at roughly 4.1%. In dollar terms, tokenized real-world assets on the chain total about $12.8 million, of which roughly $10.68 million is stocks, with the remainder split across commodities, tokenized ETFs, and a $410,000 allocation to Treasuries. Robinhood built a settlement layer for tokenized equities and attracted less than eleven million dollars of tokenized equities.
What arrived instead was CASHCAT, a cat-themed token named after the working name Tenev and co-founder Baiju Bhatt used before the company became Robinhood. It has no official affiliation with the company. It surged more than 2,100% in a week, hit an all-time high above $0.17, reached a market capitalization around $156 million and briefly higher, and on its peak day generated roughly $98 million of 24-hour volume, about 17% of the chain’s entire daily DEX figure. At its high, one joke token was worth roughly twelve times every tokenized real-world asset on the network combined. It spawned an ecosystem within days: Cash Dog in Hood, Little John, Hoodrat, Arrow, none of which existed before July 1. Noxa, a launchpad on the chain, averaged roughly 18,600 new token launches per day. For context on how launchpads mint tokens on demand, the mechanism matters as much as the mascot. On July 8, Pump.fun added support for Robinhood Chain tokens, letting Solana’s memecoin crowd trade them without bridging.
The bull case: liquidity is liquidity
The optimistic reading is that this is exactly how successful chains begin, and that treating it as failure misunderstands how crypto adoption works. A new blockchain needs transactions and wallets to look alive, and speculative trading delivers both far faster than tokenized Treasuries do. Permissionless networks with cheap fees and easy token creation reliably attract retail speculators before complex financial products find traction. That is why speculative tokens bootstrap new chains. The comparison traders keep making is Solana, which grew through a memecoin cycle of MYRO and SILLY before producing serious infrastructure and billion-dollar tokens, and one veteran trader explicitly framed Robinhood Chain as resembling Solana’s early ecosystem: rapid token-driven growth, engaged leadership, and a wave of new launches.
There is a bootstrapping argument underneath the noise. Liquidity begets liquidity. Market makers deploy where volume exists, DeFi protocols integrate where users are, and the infrastructure built to service speculation, the AMMs, the oracles, the routing, is the same infrastructure tokenized equities will eventually need. A chain with 800,000 addresses and $3.1 billion of weekly DEX volume is a chain that can credibly ask a tokenized-asset issuer to deploy on it. A chain with $12 million of RWAs and no traffic cannot ask anyone anything. Speculation, in this framing, is the ignition sequence rather than the engine.
Robinhood also has the one asset earlier tokenization projects lacked, which is distribution. This is not a startup trying to persuade strangers to try blockchain equities. It is a brokerage with nearly 28 million customers across 38 countries adding tokenized products to a platform people already use. And the company has profited from joke-driven investing before without apparent damage: it sat at the center of the GameStop episode in 2021, and in the second quarter of that year 62% of its crypto revenue came from Dogecoin. Robinhood has always monetized retail enthusiasm and then sold those users more products. Memecoins on its chain may simply be the top of a familiar funnel.
The bear case: the wrong audience, permanently
The skeptical reading is that this is the oldest failure mode in crypto infrastructure, which is building for one audience and attracting another that never converts. Memecoin traders are mercenary by construction. They run to wherever activity is and are loyal to no chain, which means Robinhood Chain’s current users may have no overlap whatsoever with the investors it hopes to attract. The moment a flashier chain offers quicker profits, the volume leaves, and what remains is the $12.8 million of tokenized assets that was there all along. Traffic that departs on a whim never becomes a user base.
The proof arrived faster than anyone expected. Noxa, the launchpad feeding the entire boom, generated an estimated $12 million in cumulative fees, then abruptly stopped accepting new token launches on July 11, at the precise moment CASHCAT was hitting peak trading volume, and went dark two days later, citing concerns about low-quality tokens flooding the platform. Its business model shows how launchpads like Noxa earn from launches. CASHCAT fell more than 33% in 24 hours. One prominent trader who claims to have ridden the token from a $10,000 market cap to $230 million dismissed the selloff as noise. The infrastructure that produced the traffic exited within eleven days of the chain going live, which is not the profile of a bootstrapping sequence. It is the profile of an extraction cycle.
The distributional facts are worse than the price action. An early buyer spent $838 on 15.04 million CASHCAT tokens, sold about 13.5 million for roughly $917,600, and held a remainder worth about $133,700, a return in the region of 1,250 times. A second wallet turned $85 into 17.4 million tokens and realized about $687,700 while sitting on roughly $1.2 million more on paper. The five most profitable wallets banked close to $3.7 million between them. Every dollar of that came from the other side of roughly 12,300 sell orders, which is to say from people who bought later and worse. And the headline metrics deserve an asterisk: a 90-day gas fee subsidy is inflating transaction counts, which makes direct comparisons with chains like Base unreliable.
The Tenev problem
Sitting on top of all this is a contradiction the company has not resolved, and it belongs to the chief executive personally. On July 2, the day after the chain went live, Tenev told CNBC that assets without utility do not serve a lasting purpose and that tokenized real-world assets were the durable direction for crypto. It was a clean statement of the thesis the entire chain was built to prove. Six days later, as CASHCAT climbed, he posted on X that while the company is building Robinhood Chain to be the best chain for real-world assets, it works great for memes too. He then followed the token’s account.
The charitable reading is that he was simply describing reality with good humor, and that a CEO refusing to acknowledge the most visible thing happening on his own network would look ridiculous. Robinhood’s crypto chief, Johann Kerbrat, stayed rigorously on message when asked, saying the company remains focused on building a secure and scalable foundation for real-world assets. Companies contain multitudes, and a permissionless chain by definition cannot control what deploys on it. Robinhood did not create CASHCAT and has no affiliation with it.
The uncharitable reading is that the endorsement, however light, told the market what Robinhood actually values, which is volume. There is a real cost to that. The entire regulatory proposition of Robinhood Chain is that it is a compliant venue where a licensed brokerage extends institutional standards into DeFi. That proposition is what would eventually persuade issuers and institutions to tokenize serious assets there. A CEO cheerleading a memecoin one week after dismissing memecoins does not obviously advance that case, particularly while Stock Tokens are structured as tokenized debt securities that grant no shareholder rights and remain unavailable to Americans. The company is asking regulators and institutions to take it seriously as financial infrastructure while its most famous product is a cat.
The corporate chain question
Robinhood Chain did not arrive in isolation, and the pattern it belongs to is arguably more consequential than anything happening on the chain itself. Coinbase has Base. Stripe has Tempo. Robinhood now has its own layer 2. A category of corporate-backed networks is forming in which crypto and payments companies build their own rails instead of relying on neutral public infrastructure, and each one shifts attention, liquidity, and value away from the developer-led ecosystems that defined the industry’s first decade.
The appeal to the company is obvious. Owning the settlement layer means owning the economics: transaction fees, sequencer revenue, and the ability to route order flow through infrastructure you control instead of renting someone else’s. It also means control over compliance, which for a licensed brokerage is not a nice-to-have. Robinhood’s competitive advantage over crypto-native rivals is its brokerage licenses and regulatory relationships, and a chain it operates is a chain where it can attempt to extend those standards into DeFi. The challenge is that those licenses govern its traditional operations, while the chain is an experiment in whether a regulated institution can impose compliance on an inherently borderless, permissionless environment. CASHCAT is the first evidence on that question, and the answer so far is that it cannot.
The value-capture math is where this gets genuinely uncomfortable for the wider ecosystem. Robinhood Chain runs on Arbitrum’s stack and settles to Ethereum, and one analysis circulating in mid-July calculated that of roughly $816,000 in revenue the chain had grossed since inception, Arbitrum took about 10% as the middleware provider, and Arbitrum in turn paid Ethereum a settlement bill measured in four figures. Ethereum provides the security that makes the whole arrangement credible and captures almost none of the economics. That is the layer-2 value drain in a single line item, and it is the same dynamic that has collapsed Ethereum’s fee burn and pushed its net issuance mildly inflationary since activity migrated off the base layer.
So the strategic picture is stranger than the memecoin story alone suggests. A brokerage under real revenue pressure built a chain to capture infrastructure economics, chose Arbitrum’s stack to do it, and inherited Ethereum’s security nearly for free. The chain then filled with speculation the brokerage says it did not want but has not discouraged. Meanwhile the neutral chains that made this architecture possible collect a rounding error. Whether or not tokenized equities ever show up on Robinhood Chain, the launch is already a useful data point about who captures value in a world of corporate rails, and the answer is not the people who built the roads.
The verdict, for now
The fair conclusion is that both stories are still live, and the next few months settle it. The test Robinhood set for itself is measurable and specific: if tokenized real-world assets grow well beyond roughly $13 million while memecoin activity fades, the strategy is working and the speculation was just ignition. If real-world assets stay flat while the speculation moves on to the next chain offering quicker profits, then Robinhood Chain becomes another entry in crypto’s long catalogue of infrastructure that attracted a wave of speculation and never became the thing it was built to support.
The first real evidence arrives with Robinhood’s second-quarter earnings on July 29, which should give the first genuine look at Stock Token adoption rather than chain-level vanity metrics. Watch the RWA number specifically, not TVL, not transactions, and not DEX volume, all of which are currently measuring something other than the product. Watch whether liquidity depth on the chain’s AMMs persists after the gas subsidy expires. And watch whether any tokenized-asset issuer of consequence chooses to deploy there, because that is the decision the entire architecture was designed to win.
What makes this genuinely interesting is that Robinhood may be right about tokenization and still lose this particular bet. The thesis that equities eventually settle on-chain, trade around the clock, and function as collateral is a serious one held by serious institutions, and the DTCC is moving tokenized securities into live trading while ICE and OKX form joint ventures aimed at the same market. Robinhood is the only brokerage in that group that also built the settlement layer, which is either visionary or premature. The company spent months and a great deal of engineering building a venue for the future of finance. What showed up first was a cat with a fistful of cash, and a chief executive who spent the previous week explaining why that was exactly the thing crypto needed to outgrow.
Frequently asked questions
What is Robinhood Chain?
It is a permissionless Ethereum layer 2 blockchain launched by Robinhood on July 1, 2026, built on Arbitrum’s Orbit stack. It uses ether for gas, runs roughly 100-millisecond block times, and settles to Ethereum mainnet. It was designed for tokenized real-world assets, with Stock Tokens as the flagship product, alongside DeFi applications including lending, trading, and perpetual futures.
Why are memecoins dominating it?
Because it is permissionless, meaning anyone can deploy a token without approval, and because cheap fees plus easy token creation reliably attract speculative traders faster than institutional products. CASHCAT, named after Robinhood’s original working name, surged more than 2,100% in a week to a market cap near $156 million, and spawned a wave of Robinhood-themed tokens that did not exist before July 1.
How much in real-world assets is actually on the chain?
Roughly $12.8 million, according to Dune Analytics data, of which about $10.68 million is tokenized stocks and the remainder is commodities, tokenized ETFs, and about $410,000 in Treasuries. That is approximately 4.1% of activity on the network. At its peak, the CASHCAT memecoin alone was worth around twelve times the entire real-world asset base.
What did Vlad Tenev say about memecoins?
On July 2 he told CNBC that assets without utility do not serve a lasting purpose and that tokenized real-world assets were the durable direction for crypto. On July 8, as CASHCAT climbed, he posted on X that while the company is building the chain to be best for real-world assets, it works great for memes too, and he followed the token’s account.
What happened to the Noxa launchpad?
Noxa was the largest token launchpad on Robinhood Chain, averaging roughly 18,600 new token launches per day. It generated an estimated $12 million in cumulative fees, then stopped accepting new token launches on July 11 as CASHCAT hit peak volume, and went dark two days later, citing concerns about low-quality tokens flooding the platform. CASHCAT fell more than 33% in 24 hours.
Are Robinhood Stock Tokens the same as owning shares?
No. They are structured as tokenized debt securities, not equity. They track the economic performance of the underlying stock, meaning price movements, but confer no voting rights, no shareholder rights, and no direct legal ownership claim on the shares. They are available in more than 120 countries but not to US persons, and jurisdictional restrictions vary.
Why did Robinhood build a blockchain at all?
Business pressure and strategic positioning. Crypto transaction revenue fell 47% year over year to $134 million in the first quarter of 2026 and native-app crypto volume dropped 48%, so the pivot aims to replace volatile transaction revenue with infrastructure income. Robinhood is also the only brokerage building its own settlement layer while rivals including ICE, OKX, and Binance target tokenized equities.
How will we know if the strategy is working?
Watch the real-world asset figure rather than total value locked, transactions, or DEX volume, which currently measure speculation. If tokenized assets grow well beyond roughly $13 million while memecoin activity fades, the traffic converted. Robinhood’s second-quarter earnings on July 29 should offer the first real look at Stock Token adoption. A 90-day gas subsidy is also inflating transaction counts.
Disclaimer: This article is for information and educational purposes only and does not constitute financial or investment advice. It analyzes a company strategy and on-chain activity, not the merits of any asset. Memecoins are highly speculative, trade on thin liquidity, and most participants lose money. Nothing here is a recommendation to buy any token or use any platform. Always do your own research. Figures are accurate as of July 16, 2026, and move daily.


Polygon Labs has cut another round of jobs as it completes the integration of crypto exchange Coinme, part of a restructuring that the company says is intended to support profitability by 2027.
Summary
- Polygon Labs has reduced its workforce as it completes the integration of Coinme and moves toward a payments focused business model.
- CEO Marc Boiron said the restructuring is intended to help position the company for profitability by 2027 while expanding through the Coinme merger.
- The latest cuts extend a multi year restructuring as Polygon continues shifting its focus from blockchain infrastructure to payment services.
According to Polygon Labs CEO Marc Boiron, the workforce reduction comes as the company enters the final stages of acquiring Coinme and prepares to merge its operations into Polygon Labs, a move he said will expand the organization while changing its focus from a blockchain foundation to a blockchain-enabled payments company.
In a post on X, Boiron said the layoffs were a difficult but necessary part of the transition. He added that integrating the Coinme team would increase the company’s headcount overall even as existing roles were eliminated during the restructuring.
The latest changes extend a strategy Polygon Labs has been pursuing for months. In January, the company spent about $250 million to acquire crypto exchange Coinme and wallet infrastructure provider Sequence, describing both businesses as core building blocks of its Polygon Open Money Stack.
The platform is designed as a vertically integrated payments infrastructure that allows blockchain-based payments to operate with fewer intermediaries while making transfers as seamless as traditional payment systems.
Restructuring continues as payments become the priority
Although Polygon has traditionally focused on blockchain infrastructure, its priorities have changed over the past year. In mid-2025, Polygon co-founder Sandeep Nailwal became CEO of the Polygon Foundation and announced plans to retire the Polygon zkEVM chain, which had been built using technology acquired through Hermez Network and Mir Protocol.
Thursday’s layoffs also continue a series of workforce reductions across the company. Polygon previously eliminated about 100 roles, or roughly 20% of its workforce, in February 2023, followed by another 60 positions during a 19% reduction in 2024. Earlier this year, the company cut another 60 employees, a move widely linked to preparations for integrating the Coinme and Sequence acquisitions.
A Polygon Labs spokesperson declined to disclose how many employees were affected in the latest round. The spokesperson said affected workers will receive severance packages and transition support, while some employees have been asked to remain temporarily to help complete the organizational changes.
In an internal message shared with employees, Boiron said the company decided to act now rather than keep an organizational structure that could affect execution. He acknowledged that two rounds of workforce changes in a single year were difficult for employees but said the restructuring would provide a stronger financial foundation for long-term growth and support the company’s goal of becoming profitable in 2027.
Payments strategy expands despite industry-wide job cuts
Polygon said the restructuring is separate from the Polygon Foundation, which continues to oversee the network, treasury, ecosystem development and protocol upgrades. According to a company spokesperson, Polygon’s stablecoin supply has reached $3.37 billion, making it the eighth-largest stablecoin ecosystem across blockchains, while on-chain payment volume climbed to a record $9.12 billion in June.
The latest cuts come as several crypto firms continue reshaping their businesses through restructuring. In June, Robinhood announced plans to eliminate about 290 jobs, or roughly 10% of its workforce, saying the move would simplify management and improve efficiency even as Chief Executive Officer Vlad Tenev described the business as financially strong.
Workforce reductions have also remained common across non-engineering roles in the digital asset industry. Earlier this year, the Plexus State of Crypto Hiring report found that women accounted for less than 8% of crypto hires despite a sharp increase in female Web3 placements, noting that marketing, communications, community and events positions remain more exposed to layoffs than technical roles. The report said those functions have frequently been targeted as companies reduce costs and reorganize around new business priorities.
President Donald Trump has convened key Republican senators at the White House as Ripple warned that rejecting the CLARITY Act would preserve regulatory gaps linked to the FTX collapse.
Summary
- Trump will meet Republican senators to address disputes holding up the CLARITY Act.
- Ripple warned that rejecting the bill would leave major crypto regulatory gaps open.
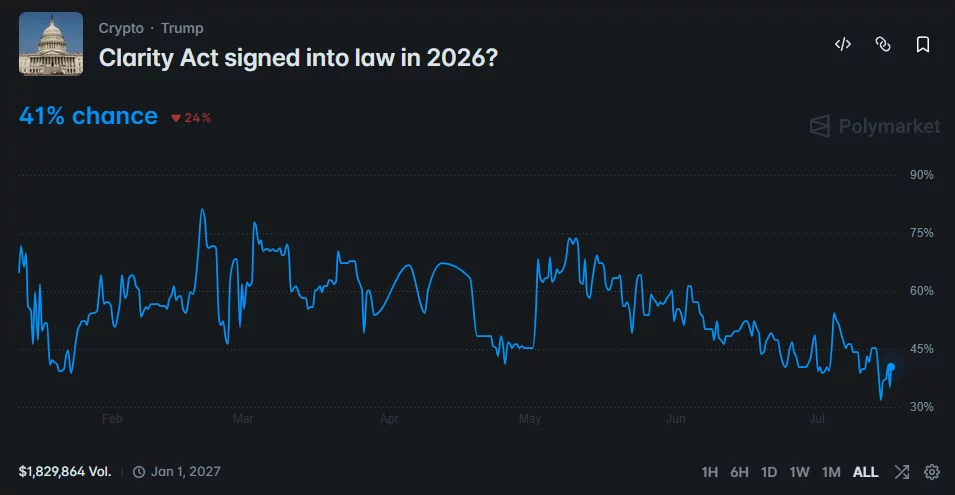
- Polymarket places the bill’s chance of becoming law in 2026 at 36%.
According to Politico, Trump is scheduled to meet several Republican senators on Thursday to discuss the crypto market structure bill and the remaining work needed to secure a Senate vote.
Senator Bernie Moreno told the publication that lawmakers would brief Trump on the legislation and “its path to success.” A Senate Republican aide also confirmed that Senator Cynthia Lummis, a leading supporter of crypto legislation, would attend the meeting.
“We’ll be talking about the entirety of the bill. I mean, obviously the president’s been very engaged in this bill,” Moreno told Politico. “He’s the one who’s really driven the innovation that I think will pay dividends.”
Republican lawmakers are seeking to pass the CLARITY Act before Congress leaves Washington for the August recess. According to Politico, several lawmakers view the current work period as their best chance to move the measure before campaigning for the midterm elections takes up more of the Senate’s schedule.
Ethics provisions remain a key source of disagreement. Senator Thom Tillis expressed hope that lawmakers and the White House could settle the dispute within days.
“I’m hoping that we can come up with some agreement by the end of this week,” Tillis said.
Ripple warns regulatory gaps will remain open
As negotiations continue in Washington, Ripple chief legal officer Stuart Alderoty has urged lawmakers to support the legislation, arguing that a failed vote would leave the crypto industry exposed to misconduct under the existing system.
Alderoty linked his warning to the collapse of FTX, which left customers unable to access billions of dollars held on the exchange.
“We’ve seen this movie. Let’s not watch the sequel,” Alderoty wrote.
Lauren Belive, Ripple’s global co-head of public policy and government, also argued that lawmakers have yet to close the loopholes that contributed to past crypto failures.
“The same regulatory gaps that let bad actors like FTX collapse and wipe out customer funds are still wide open today.”
Under the bill, authority over the crypto market would be divided between the Commodity Futures Trading Commission and the Securities and Exchange Commission. Ripple maintains that the framework would clarify each agency’s role and introduce oversight before qualifying digital assets reach the market.
Political odds fall as the Senate deadline tightens
Doubts about the bill’s prospects have increased on prediction markets despite the White House talks. Polymarket traders have lowered the probability of the CLARITY Act becoming law in 2026 to about 41%.
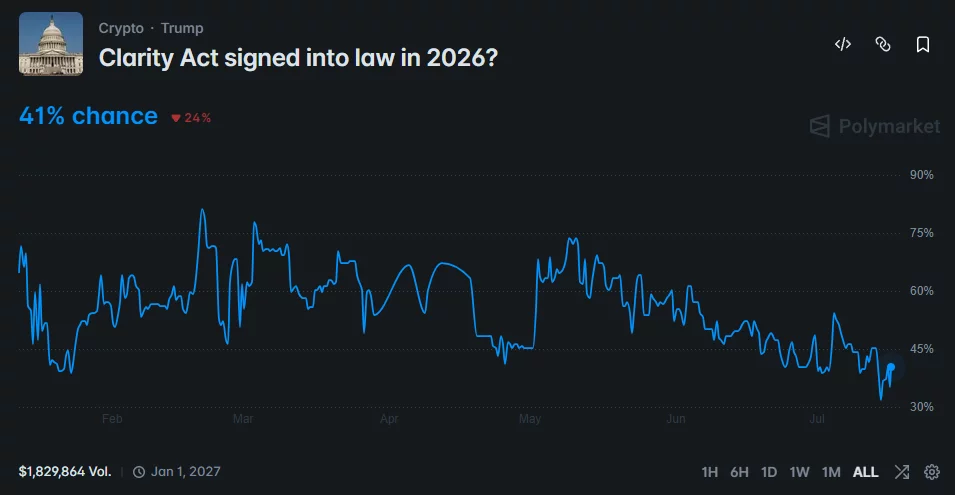
Negotiations over ethics rules and the limited number of legislative days before the August recess have weighed on those odds. However, the planned White House meeting indicates that Trump and Senate Republicans are still working to resolve the remaining disputes before the window closes.
Separately, the House Financial Services Committee is scheduled to hold a July 17 hearing titled “Building the Future of Finance: How the CLARITY Act Unlocks Innovation.” According to the committee’s description, the session will examine how the legislation could support U.S. leadership in blockchain technology and digital assets.
The committee is also expected to discuss the American Reserve Modernization Act, which concerns the proposed Strategic Bitcoin Reserve. Witnesses will provide views on the measures as Senate Republicans continue their push for a floor vote before the recess.
Trump Aide Under Review for $100K Kalshi Speech Bets: ABC

‘House of the Dragon’ Has Officially Beat ‘Game of Thrones’ at Its Own Game

GELD FUTSCH – So kann es gehen – GELD oder WAHRHEIT?


-

 Fashion6 days ago
Weekend Open Thread: Nutriplenish Leave-In Conditioner
-
 NewsBeat9 hours ago
London Mayor Sadiq Khan handed a peerage by Keir Starmer alongside 15 other Labour figures… just days before the PM leaves No10
-

 Sports7 days ago
Super Eagles star Moses Simon opens up on Liverpool transfer regret
-

 Crypto World23 hours ago
CFTC blocks Kalshi from unwinding Michigan trades after court order
-

 Business21 hours ago
Nvidia Stock Slips After Big Tuesday Rally as Huang Confirms Vera Rubin Chip Is Now in Production Today
-

 Politics2 days ago
Young campaigners urge incoming PM to act on outdoor junk food ads
-

 News Videos2 days ago
XRP BOMBSHELL… XRP OMBOARDED FOR TRANSACTIONS!!!
-
 Tech3 days ago
Get Your ESP32 Sunny Side Up With This Solar Dev Board
-
 Entertainment1 day ago
Disney’s Most Ambitious Failed Star Wars Attraction Is Coming to SDCC
-

 Tech2 days ago
Dark Secrets Emerge When Jailbreaking LLMs
-

 Crypto World4 hours ago
Injective Submits SEC Transfer-Agent Registration to Onchain Ownership Records
-
 Sports1 day ago
New Cornerback Enters Vikings Trade Rumor Mill
-
 Tech3 days ago
Cloudflare Precursor Watches Your Mouse and Keyboard To Decide If You Are Human
-

 News Videos3 days ago
how to make coin bank box with cardboard #scienceproject #money #diy #shorts
-
 Entertainment1 day ago
Vicki Gunvalson Defends Discussing Heather Dubrow’s Money
-
Crypto World2 days ago
Ripple, Coinbase, Circle Join Linux x402 Foundation to Help Shape AI Payments
-

 Business2 days ago
ACCC warns AI could lift insurance costs in risk-prone areas
-

 NewsBeat1 day ago
Watch: Is Donald Trump facing a popular backlash on immigration?
-

 Sports1 day ago
Michigan officials not expected to discuss AD Warde Manuel at Thursday meeting
-

 Business2 days ago
Subaru recalls 541,000 vehicles over federal safety sticker mistake: NHTSA
You must be logged in to post a comment Login