
Crypto World
PI price flashes bullish pattern, eyes $0.200


The PI price is flashing a falling wedge chart pattern on its 12-hour chart that analysts at Invezz say could push the token 22 percent higher toward the $0.200 resistance level, with smart contract catalysts and a Kraken listing adding fundamental weight to the technical setup.
Summary
- PI is trading around $0.164 to $0.167 and has exited the upper side of the falling wedge channel, a move that Invezz analysts say signals a likely rebound toward the next key resistance at $0.200, approximately 22 percent above the current level.
- A drop below the support level at $0.15 would invalidate the bullish outlook; a single whale address has accumulated approximately 350 million PI worth roughly $134 million, becoming the network’s sixth-largest holder, which signals long-term accumulation even as daily token unlocks of roughly 230 million PI create consistent sell-side pressure.
- Four near-term catalysts are cited for the setup: the RPC testnet launch on April 11, the Protocol v23 smart contract upgrade due May 18, a Kraken listing, and the ongoing KYC verification process that has already cleared over 16 million users.
Invezz’s April 14 analysis identifies the falling wedge as a classic continuation pattern in which price compression within converging trendlines precedes a directional breakout. Pi has also remained above the Supertrend indicator and moved slightly above the 50-period moving average, with the RSI pointing upward from neutral territory near 42. Those conditions collectively suggest the selling pressure that has weighed on PI since its peak above $2.90 may be approaching exhaustion at the current level.
The PI token has spent much of 2026 between $0.16 and $0.20 after falling sharply from its open-market high, weighed down by the token unlock schedule and the absence of smart contract functionality that would give the network real DeFi utility.
The most significant near-term catalyst is Protocol v23, due May 18. The upgrade introduces smart contracts to the Pi mainnet for the first time, turning the network from a payment token into a programmable platform that developers can build lending, gaming, and DeFi applications on. The protocol is built on Stellar’s tech, which has already implemented similar features, meaning the transition is expected to be more stable than a greenfield smart contract rollout. Node operators must upgrade sequentially through v22.1 on April 22 before v23.0 goes live.
Why the Token Unlock Schedule Is the Counter-Argument
The bullish technical setup runs directly against a structural headwind that is not chart-dependent. Approximately 230 million PI tokens are scheduled to unlock in the next 30 days, adding consistent sell pressure regardless of technical patterns or protocol upgrades. That daily unlock rate has been the primary reason PI has underperformed the broader market since its listing. Any 22 percent move toward $0.200 would need buying volume to absorb that supply, which historically has required either a major exchange listing or a significant utility event to materialize.
What Traders Are Watching as the April 22 Node Deadline Approaches
The v22.1 node upgrade deadline on April 22 is the next verifiable milestone on the road to Protocol v23. All mainnet node operators must complete it to remain connected to the network. Successful on-schedule completion would signal to the market that the May 18 smart contract launch is on track. As Pi builds toward that milestone, the $0.15 level remains the line that separates the current bullish setup from a deeper consolidation.


TLDR
- Elon Musk has resolved an SEC enforcement action regarding delayed Twitter stock disclosure by agreeing to a $1.5 million settlement payment
- Federal regulators claimed Musk’s 11-day filing delay allowed him to acquire shares at reduced prices, resulting in approximately $150 million in avoided costs
- The settlement, paid through Musk’s trust, includes no acknowledgment of liability or wrongdoing
- This $1.5 million settlement represents the highest penalty ever imposed by the SEC for violations of this nature
- Tesla shares declined 0.16% in pre-market activity following the announcement, extending year-to-date losses to approximately 13%
Elon Musk has reached a settlement agreement with the U.S. Securities and Exchange Commission regarding allegations that he failed to timely disclose his accumulation of Twitter shares. Under the terms, a trust bearing Musk’s name will remit $1.5 million to resolve the matter. The settlement contains no acknowledgment of liability.
The regulatory agency initiated legal proceedings in January 2025, mere days before President Biden’s term concluded. The complaint centered on Musk’s alleged failure to file required disclosures for 11 days after surpassing the 5% ownership threshold in Twitter shares during late March and early April of 2022.
Federal securities regulations mandate that investors publicly report their holdings once they exceed 5% ownership in any publicly traded company. According to the SEC’s allegations, Musk’s delayed filing enabled him to continue accumulating shares at artificially suppressed prices before market participants could respond to the information.
Throughout this disclosure gap, Musk acquired more than $500 million in Twitter stock. His eventual disclosure revealed a 9.2% ownership position. The SEC calculated that the filing delay resulted in approximately $150 million in cost savings for Musk.
While the SEC initially sought disgorgement of the full $150 million, observers with knowledge of the proceedings indicated that establishing such damages in litigation would have presented significant evidentiary challenges. The negotiated resolution requires only the $1.5 million monetary penalty.
According to Alex Spiro, Musk’s legal counsel, his client has been “cleared of all issues related to the late filing of forms in the Twitter acquisition.” Musk previously characterized the filing delay as unintentional and contended that the SEC’s enforcement action violated his constitutional free speech protections.
A Long History With the SEC
This settlement marks another chapter in Musk’s ongoing relationship with the securities regulator. In 2018, he resolved separate charges by paying $20 million after publishing tweets claiming he had “funding secured” to take Tesla private. That earlier agreement also mandated his resignation as Tesla’s board chairman and implemented pre-approval requirements for certain social media communications.
The Twitter-related settlement was formally filed on May 4 in federal court in Washington, D.C. The resolution came approximately three months after a federal judge denied Musk’s motion seeking dismissal of the enforcement action.
The agreement emerged following the unexpected March departure of Margaret Ryan, the SEC’s enforcement division chief, who resigned after internal disagreements with agency leadership. Under current Chairman Paul Atkins, the SEC has been recalibrating its enforcement priorities and approach.
According to a source with direct knowledge of the matter, the $1.5 million penalty establishes a new record as the largest civil penalty ever assessed for this particular category of disclosure violation.
What It Means for Tesla
Tesla shares experienced a modest 0.16% decline in pre-market trading following news of the settlement. Year-to-date, the stock has fallen approximately 13%.
Current Wall Street consensus rates Tesla as a Moderate Buy, reflecting 13 Buy recommendations, 12 Hold ratings, and 5 Sell opinions. Analysts’ average price target of $410.21 suggests potential upside of roughly 4.5% from present trading levels.
For Musk personally, whose net worth Forbes estimates at $789.9 billion, the $1.5 million settlement payment represents an immaterial financial impact.


The crypto market resumed its uptrend on Tuesday, rising 1.2% to $2.76 trillion as oil prices eased, after Iranian officials hinted at progress in U.S.-Iran peace negotiations.
Summary
- Crypto market rises 1.2% to $2.76T as Bitcoin tops $81K; rebound triggers $225M in short liquidations.
- Sentiment improves as the Crypto Fear and Greed index moves to neutral; oil prices ease on signs of progress in U.S.-Iran talks.
- Focus shifts to U.S. Nonfarm Payrolls and JOLTS data, which could shape Fed policy outlook and market direction.
Bitcoin (BTC) climbed 3.5%, briefly moving above the $81,000 level before settling at around $80,855 at press time. Ethereum (ETH) gained 1% to trade above $2,381, while other major assets such as XRP (XRP), Solana (SOL), and Tron (TRX) showed relatively muted price action. Among the top performers on the day were Toncoin (TON), MemeCore (M), and Morpho (MORPHO).
The rebound across digital assets triggered a wave of short liquidations, with roughly $225 million in bearish positions wiped out over the past 24 hours, according to derivatives data. The move suggests that traders positioned for further downside were forced to exit as prices pushed higher.
Market sentiment also improved notably. The Crypto Fear and Greed index rose by 10 points, moving out of fear territory and back into neutral levels, reflecting a shift in investor outlook after days of caution.
The recovery in crypto prices came alongside a pullback in oil and energy markets. Comments from Iran’s foreign minister helped ease concerns, as officials indicated that recent attacks in the UAE and against U.S. interests may have been attempts to provoke a larger conflict. They added that ongoing talks between Iran and the United States, reportedly mediated by Pakistan, continue to show signs of progress.
Tensions had escalated earlier after U.S. President Donald Trump warned of severe retaliation following reports of Iranian missile strikes in the UAE and unverified claims of a U.S. naval vessel being targeted in the Strait of Hormuz.
Traditional safe-haven assets such as gold and silver posted modest gains during the session, while Asian technology stocks also edged higher, mirroring the cautious recovery seen in risk assets.
Looking ahead, investors are turning their attention to upcoming U.S. macroeconomic data, including Nonfarm Payrolls and JOLTS job openings figures.
These releases are expected to offer further clarity on the strength of the labor market and could influence expectations around Federal Reserve policy, which remains a key driver for both crypto and broader financial markets.
Disclosure: This article does not represent investment advice. The content and materials featured on this page are for educational purposes only.

Key Highlights
- Pavel Durov announced Telegram will take over from TON Foundation as the primary force driving the TON blockchain, sending Toncoin (TON) up more than 30%.
- The messaging platform will operate as TON’s primary validator, with Durov emphasizing a renewed commitment to “technological excellence.”
- Network transaction costs have decreased by 83%, falling to practically zero and boosting attractiveness for both users and developers.
- Daily trading activity skyrocketed 600%, surpassing $630 million within 24 hours, while market capitalization reached $4.5 billion.
- Meme coins built on TON experienced dramatic gains, including Dogs soaring over 90% and Notcoin climbing 26%.
Toncoin (TON) experienced one of its most significant daily price surges in recent months following an announcement from Pavel Durov, the founder and CEO of Telegram, who shared a critical governance change for the TON blockchain via his X account.
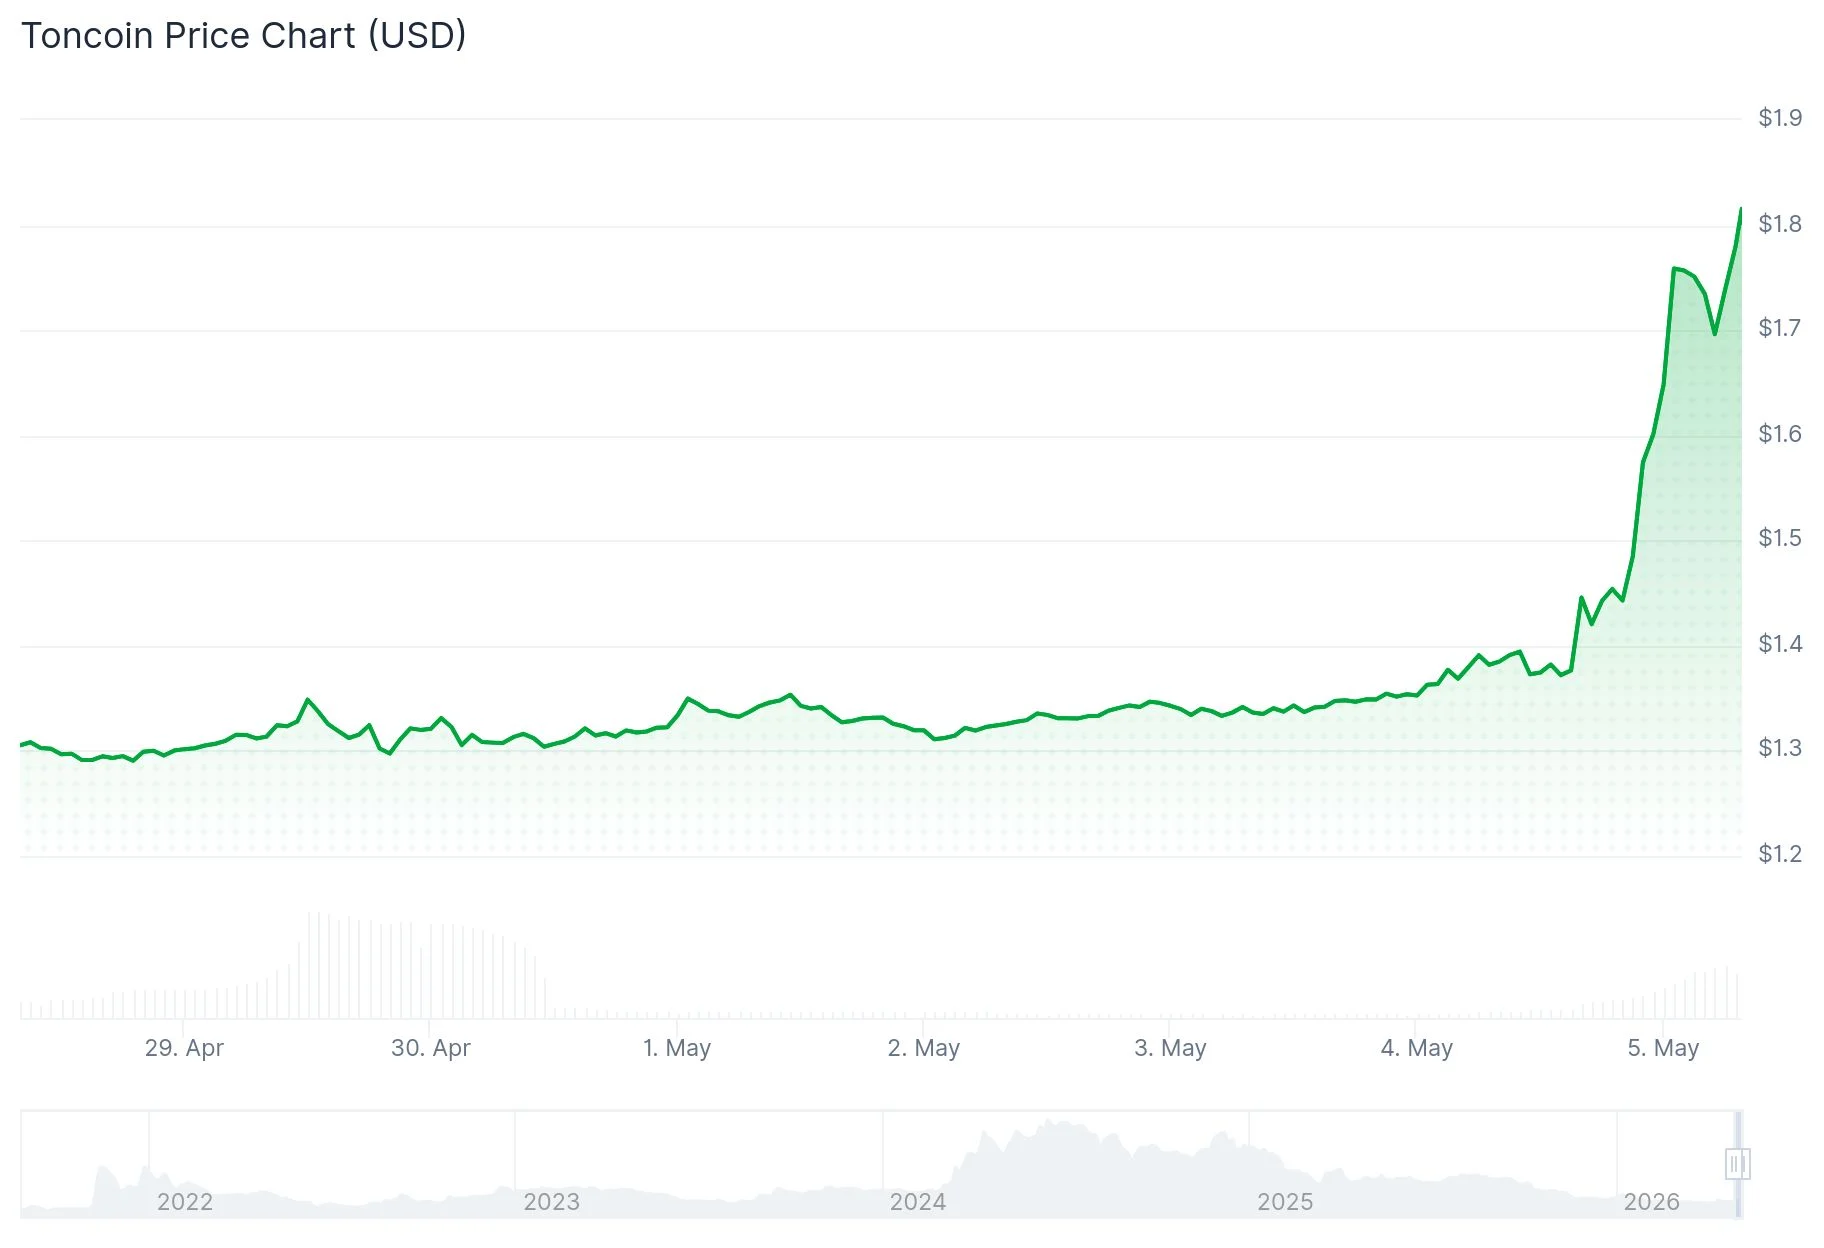
In his announcement, Durov revealed that Telegram would “replace the TON Foundation as the driving force behind TON and become its largest validator.” Despite the brevity of the message, the market response was swift and substantial. TON’s price surged from $1.37 to a peak of $1.84 over the following 24 hours, representing approximately 34% growth.
Cryptocurrency analyst Sam Cooling emphasized that the significance of this development extends far beyond simple organizational restructuring. With Telegram’s massive user base of 950 million monthly active accounts, the platform is now officially integrating its operations with a single blockchain infrastructure—establishing what Cooling characterizes as “structural demand for TON that didn’t exist under a community-run foundation.”
Market activity confirmed this assessment. Trading volume exploded by 600%, exceeding $630 million over a 24-hour period, while Toncoin’s market capitalization climbed to $4.5 billion.
Durov further revealed that TON’s transaction costs have been reduced by a factor of six, now approaching zero. He announced that significant upgrades—including a redesigned ton.org website, enhanced developer resources, and network performance enhancements—are scheduled for release within the next two to three weeks.
Telegram’s new role as TON’s primary validator gives the company direct authority to validate network transactions, collect staking incentives, and exercise significant influence over future protocol governance. This integration also creates a tighter connection between Telegram’s revenue model and the TON ecosystem.
What the Telegram-TON Connection Means in Practice
A practical illustration of this integration is visible in the Telegram Ad Platform. Advertisers must acquire advertising space using Toncoin, while channel operators receive 50% of ad revenue distributed in TON. Telegram intends to expand this model through Telegram Stars by the third quarter of 2026. Every advertising transaction generates buying pressure for TON, while revenue distributions circulate the token throughout the ecosystem.
The blockchain has already processed 1.5 billion transactions during the first quarter of 2026 alone. Total value locked within the TON ecosystem reached $1.2 billion by April 2026. The TON v4 upgrade deployed in March 2026 implemented sharding technology capable of processing more than 100,000 transactions per second.
Durov also demonstrated personal commitment by investing $5 million into TON liquidity pools in late 2024.
Meme Token Surge Across the TON Ecosystem
The price rally extended well beyond Toncoin itself. The aggregate market capitalization of meme tokens built on TON increased 67% within a single day, based on CoinGecko data.
Notcoin, a tap-to-earn token distributed through Telegram mini-applications, appreciated 26%. Dogs, a community-driven meme token on TON, skyrocketed more than 90%—despite still trading approximately 96% below its peak value. Lower-capitalization tokens experienced even more dramatic movements, with Morfey climbing nearly 1,000%, Resistance Duck surging 645%, and Cubigator advancing 390%.
At press time, TON was changing hands near $1.44, representing approximately 6% daily gains, with trading volume reaching $232 million—a 235% increase compared to the previous day.
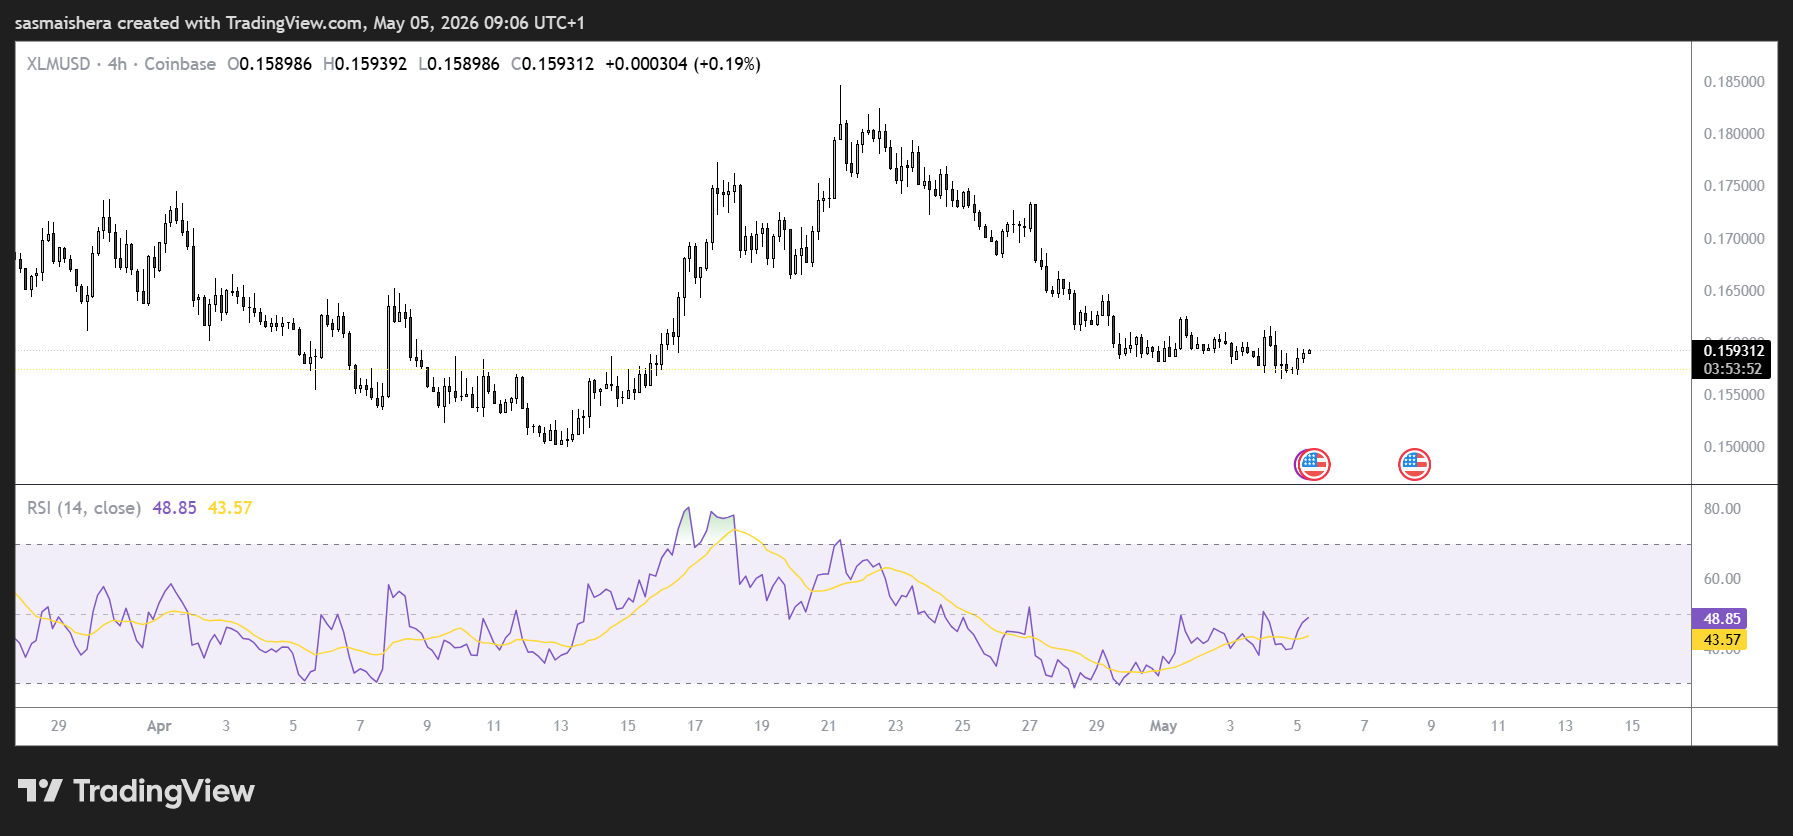
Stellar’s native token XLM remains under pressure on Tuesday, with muted price action reflecting a broader lack of conviction across altcoins. XLM has stabilized around $0.158 as traders weigh conflicting on-chain and derivatives signals.
On-chain data hints at mild bullish bias
Data from CryptoQuant points to a neutral-to-slightly bullish backdrop for XLM. XLM presents a bullish picture, with buy-side dominance emerging but broader indicators staying largely flat. This combination points to mild bullish pressure, though not strong enough to confirm a clear trend reversal.
Data obtained from CoinGlass highlights a divided market. The long-to-short ratio sits below 1 (0.77 for XLM), indicating that a larger share of traders are positioned for downside. This typically reflects a bearish tilt in sentiment.
However, funding rate data tells a different story. XLM has flipped into positive territory, meaning long traders are paying shorts—often a sign of improving bullish sentiment and growing demand for long exposure.
The divergence between bearish positioning (long/short ratios) and improving funding rates underscores a market stuck in indecision.
Until either bullish momentum strengthens or bearish pressure intensifies, both XRP and XLM are likely to remain range-bound. A confirmed breakout above XRP’s $1.40 resistance or stronger follow-through in XLM could provide the first real directional signal for traders.
Stellar price forecast: XLM remains in consolidation mode
The XLM/USD 4-hour chart is bearish and efficient as XLM is trading at $0.159 on Tuesday, maintaining a bearish near-term bias as it holds beneath the key EMAs.
The 50-day EMA at roughly $0.165, the 100-day EMA near $0.176, and the 200-day EMA around $0.208 all sit overhead as layered resistance, suggesting rallies are likely to be capped while the pair remains below this stack.
The RSI on the daily chart hovers around 43, suggesting subdued demand, while the MACD remains in negative territory, indicating that downside momentum persists despite recent stabilization.
If the rally persists, initial resistance is seen at the 50-day EMA around $0.165, followed by the 100-day EMA near $0.176.
A daily candle close above these levels could see XLM extend its rally towards the 23.6% Fibonacci retracement at $0.201, ahead of the 200-day EMA close to $0.208.

On the downside, immediate support sits on the nearby intraday pivot around the current price, with stronger support emerging toward the prior trendline break area near $0.139.
A break below this level could see XLM retest the $0.136 support zone in the near to medium term.
TLDR:
- Moscow Exchange will launch MOEXSOL, MOEXXRP, MOEXTRX, and MOEXBNB indexes starting May 13, 2026.
- Pricing data will be sourced from Binance, Bybit, OKX, and Bitget based on their trading volume share.
- All crypto indexes will update every 15 seconds during trading sessions, replacing the once-daily calculation.
- The exchange plans to expand crypto benchmarks to ten and eventually enable direct crypto trading by 2027.
The Moscow Exchange is set to expand its cryptocurrency benchmark offerings beginning May 13, with four new crypto indexes covering Solana, Ripple, Tron, and Binance Coin.
These additions come as Russia’s largest securities exchange continues building out its digital asset infrastructure. The move also brings updates to existing Bitcoin and Ether indexes.
As with current crypto instruments on the platform, access remains limited to professional investors only.
New Indexes and How They Will Be Calculated
Starting May 13, the exchange will begin calculating and publishing four new indexes: MOEXSOL for Solana, MOEXXRP for Ripple, MOEXTRX for Tron, and MOEXBNB for Binance Coin.
To determine pricing, the platform will draw from four major crypto exchanges based on their share of total trading volume.
Binance will account for 50% of the data, while Bybit will contribute 20%. OKX and Bitget will each supply 15% of the pricing inputs.
This multi-source approach aims to produce more balanced and representative index values across different trading platforms.
Along with the new listings, the frequency of index calculations will also change. From May 13, all digital currency indexes — including the existing MOEXBTC and MOEXETH — will update every 15 seconds throughout the trading day and during weekend sessions. Currently, these indexes are calculated once per day, with results published by 18:00 Moscow time.
The Moscow Exchange has indicated that these indexes may serve as underlying assets for new financial instruments in the future.
However, all crypto-related tools on the platform remain accessible only to professional investors, in line with current Russian regulations.
Expansion Plans and the Road Ahead
Beyond the four incoming indexes, the Moscow Exchange has set a target of reaching ten cryptocurrency benchmarks in total.
The preliminary list for upcoming additions includes Dogecoin (MOEXDOGE), Cardano (MOEXADA), Hyperliquid (MOEXHYPE), and Chainlink (MOEXLINK).
The exchange’s derivatives market product group head, Maria Silkina, confirmed that the platform intends to offer perpetual futures for Bitcoin and Ether at a later stage.
A futures contract obligates the seller to deliver and the buyer to purchase an asset at a set price within a defined period. In settlement futures, profit or loss is calculated based on the difference between the contract price and the strike price.
Russia’s Bank of Russia opened the door for such instruments in May 2025, permitting financial institutions to offer professional investors derivatives, securities, and digital assets tied to cryptocurrency prices. Actual delivery of digital currencies, however, is not permitted under these arrangements.
By November 2025, the exchange had already launched several instruments, including futures on its Bitcoin and Ether indexes, as well as the iShares Bitcoin Trust (IBIT) and iShares Ethereum Trust (ETHA) ETFs. The Moscow Exchange expects to enable direct cryptocurrency trading by early 2027.


Leading decentralized lending platform Aave has asked a U.S. federal court to block an attempt by victims of North Korean terrorism to seize about $71 million in crypto frozen after last month’s rsETH-related exploit, escalating a dispute that has already split Arbitrum’s governance.
The filing, submitted Monday in the Southern District of New York, seeks to vacate a restraining notice served on Arbitrum DAO by lawyers representing judgment creditors of the Democratic People’s Republic of Korea. Aave argues the assets belong to users of its protocol, not North Korea, and warns that keeping them frozen risks “irreparable harm” to the platform and the broader DeFi ecosystem.
At the center of the fight is 30,765 ETH that Arbitrum’s Security Council froze after the April exploit, when attackers used improperly valued or unbacked rsETH as collateral on Aave, contributing to a situation that the plaintiffs allege resulted in approximately $230 million in ETH being withdrawn from the Aave Protocol. Some of those funds were later intercepted and immobilized on Arbitrum, with plans to return them to affected users as part of a coordinated recovery effort.
The dispute centers on whether stolen property briefly held by hackers becomes their legal property.
The plaintiffs, three sets of judgment creditors holding $877 million in damages awards against North Korea, argue it does — and that’s because the rsETH attackers are widely believed to be linked to Pyongyang’s Lazarus Group, the recovered ether can be claimed against those decades-old judgments.
Aave’s lawyers call that theory “flatly wrong” and warn it would punish blameless users while rewriting basic property law.
Aave’s motion challenges that theory directly. The filing argues the restrained ETH “belong[s] to completely blameless third parties,” not to North Korea, and that even if a thief briefly held the assets, that does not confer legal ownership.
It also disputes the underlying attribution, calling claims that the exploit was carried out by DPRK actors “conjecture” based on unverified reports.
Aave is asking the court to immediately lift the restraining notice, or at a minimum to suspend it while the case is heard.
Aave says keeping the funds frozen via the restraining notice could deepen losses and destabilize DeFi markets already strained by the exploit. The filing warns this “increases the likelihood of cascading liquidations, sustained liquidity outflows, and irreversible changes to user positions,” a chain reaction the industry has been trying to avoid for two weeks.
The outcome could have consequences far beyond this case. If courts allow seized or recovered crypto to be claimed by outside creditors, it could deter future rescue efforts and complicate how the industry responds to hacks, where speed and coordination are often the only tools to limit damage.
Bitcoin (BTC) traded near $81,025 on May 5 after rising 1.56% in the latest session.
Summary
- Ali Charts says Bitcoin’s weekly MACD crossover has already driven a 15% price increase since April 13.
- Bitcoin whales bought 4,527 BTC worth about $362M as ETF inflows supported renewed institutional demand.
- Santiment data shows Bitcoin on-chain activity hit two-year lows despite BTC reclaiming the $80K level.
The asset also recorded an intraday high near $81,204, while trading volume stayed elevated as buyers returned above the $80,000 zone.
The move followed a sharp market reaction to Middle East headlines and renewed demand through U.S. spot Bitcoin ETFs. Bitcoin’s rebound placed the market back near a key technical area watched by traders after several weeks of recovery.
Analyst watches $83,000 resistance
Well-known crypto analyst Ali Martinez asked, “Is Bitcoin heading to $100,000?” He said Bitcoin has shown structural strength since a bullish MACD crossover appeared on the weekly chart on April 13. Since then, BTC has gained about 15%.
Ali Martinez said similar weekly MACD crossovers preceded earlier multi-month moves. He cited a 147% rally after Oct. 23, 2023, a 75% rally after Oct. 14, 2024, and a 35% rally after May 5, 2025.
On the daily chart, Ali placed the 200-day simple moving average near $83,000. He described that area as the main psychological and structural barrier. A daily close above it could open a path toward $89,000, with $94,000 as the next target.
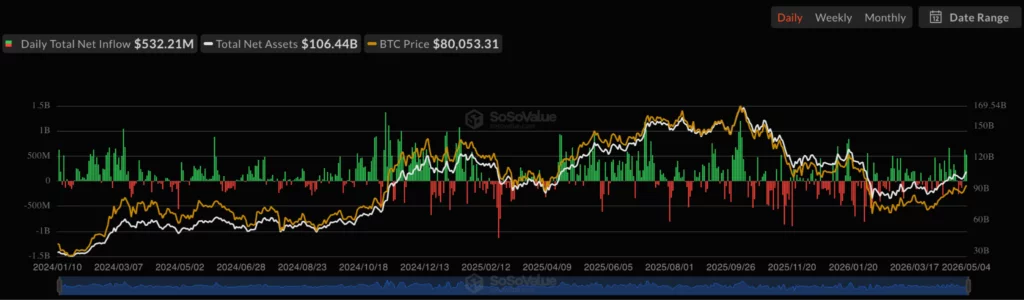
ETF inflows support Bitcoin demand
Spot Bitcoin ETFs added fresh support to the rally. SoSoValue data showed U.S. spot Bitcoin ETFs drew $532 million in net inflows on May 4, after $630 million on May 1. The two sessions brought about $1.16 billion into the products.

ETF demand also suggests that many buyers are entering Bitcoin through regulated market products rather than direct on-chain transfers. Bitcoin’s market dominance also rose above 60%, showing that capital continued to favor BTC over many altcoins during the move.
Ali Charts also reported that whales bought 4,527 BTC in 24 hours, worth about $362 million. That activity points to large-holder demand even as broader network use remains weak.
Network activity sends mixed signal
Santiment data showed Bitcoin’s on-chain activity dropped to two-year lows while BTC moved back above $80,000. About 531,000 Bitcoin wallets made daily transfers, while roughly 203,000 new wallets were created each day.
That creates a mixed setup for the market. Price has risen while fewer users are active on-chain, meaning the rally may depend more on whales, ETFs and derivatives activity than broad retail participation.
Short liquidations also helped the move. Market data cited by traders showed about $270 million in short positions were cleared as BTC moved higher. Better miner returns also reduced near-term selling pressure, with daily mining revenue per petahash rising to its highest level since late January.
Finally, Macro conditions also shifted after the U.S. launched Project Freedom to guide ships through the Strait of Hormuz. Reuters reported that the operation followed weeks of tension around the shipping route, which remains central to global oil flows.
Disclosure: This article does not represent investment advice. The content and materials featured on this page are for educational purposes only.
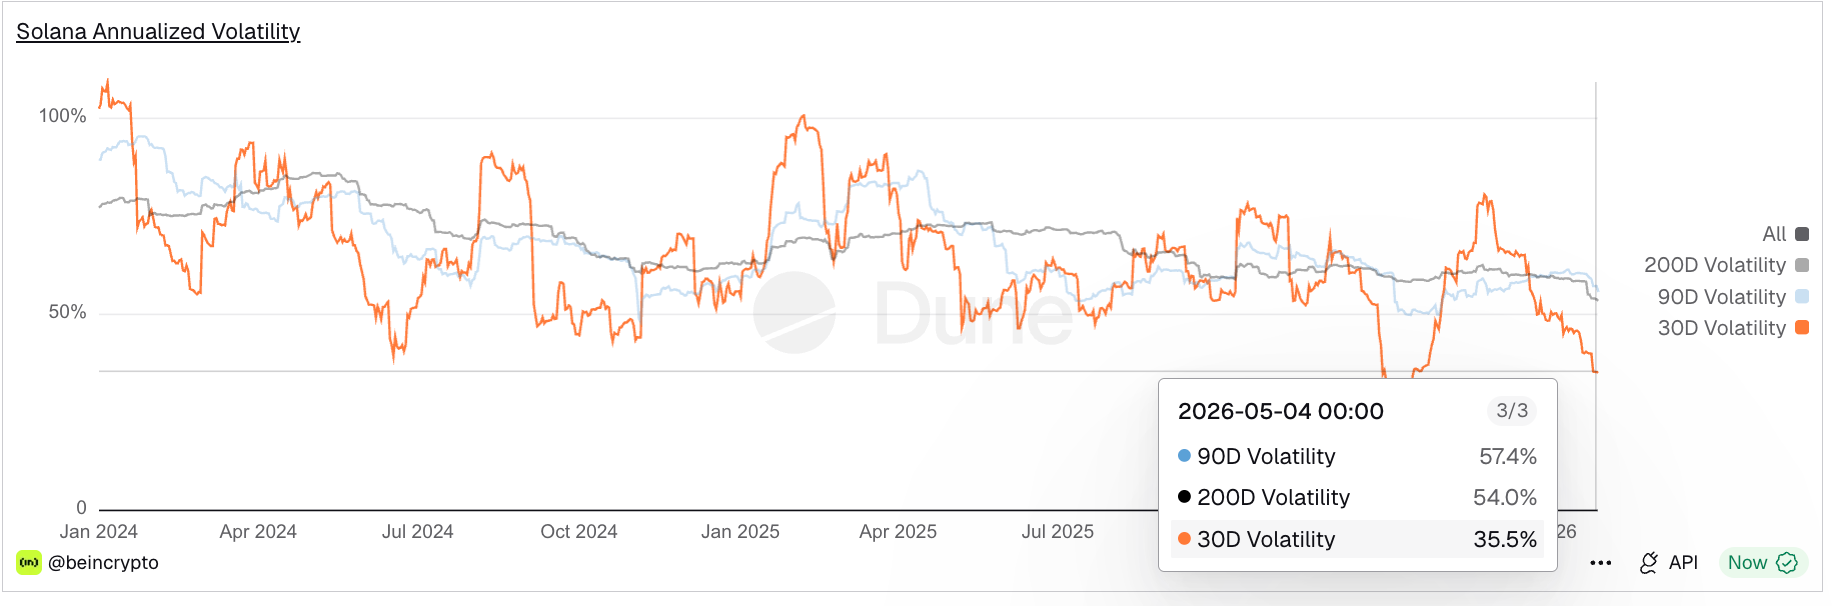
Solana volatility hits a multi-year low, with the 30-day annualized reading dropping to 35.5%. In 2026, it even fell to under 26% for a brief period.
Per BeInCrypto’s exclusive Solana volatility dashboard, this compression marks one of the lowest sustained 30-day prints the indicator has tracked. The cause sits in a structural shift in who owns SOL. The spot ETF, launched in October 2025, has not had a single month of outflows.
Long-term holder supply has expanded sharply over the past two months. The result is a market that has neutralized a textbook breakdown pattern, but capped the upside in the process.
Solana Volatility Crashes to a Multi-Year Low
Per BeInCrypto’s Solana volatility dashboard, the 30-day annualized volatility, a measure of how much SOL’s daily returns deviate from their average over the previous month, sits at 35.5% as of May 4. The 90-day reading is 57.4%. The 200-day is 54.0%.
Want more token insights like this? Sign up for Editor Harsh Notariya’s Daily Crypto Newsletter here.
Compare those numbers to early 2024. The same metrics printed 109% on the 30-day, 92.6% on the 90-day, and 78.8% on the 200-day. Even the early 2026 lows of 58.5%, 50.1%, and 25.8% are now being matched by the active 30-day window.

Two structural facts make the current reading notable. First, the 30-day has dropped below both the 90-day and the 200-day, a configuration that signals the recent trading regime is calmer than the medium-term average.
Second, the SOL price volatility compression has held through a period of macro turbulence, including the April FOMC meeting and the Project Freedom geopolitical risk premium that lifted broader risk assets. Volatility does not compress on its own. Something is absorbing the swings.
The Institutional Trade Explains the Compression
Two strands of ownership data explain the volatility drop.
First, spot Solana ETF flows. The products launched in October 2025 and have not posted a single month of net outflows since. Per SoSoValue data, cumulative inflows have crossed $1.02 billion. Monthly flows have slowed from $419 million in November 2025 to $39.93 million in April 2026, but the cumulative absorption has kept growing every single month.

Second, long-term holder accumulation. Glassnode’s Hodler Net Position Change metric, which tracks accumulation by addresses holding SOL for at least 155 days, expanded from 524,366 SOL on March 8 to 2,588,971 SOL on May 4. That is roughly a five-fold increase in two months.

The combination matters. ETFs absorb supply that does not flow back into the market. Long-term holders accumulate during price weakness rather than during strength. When both forces operate during a flat tape, realized swings compress because the patient cohort is buying every dip and the speculative cohort that drove past volatility no longer dominates flow.
The Solana price chart confirms the same story from a different angle.
Solana Price Levels Show the Trade-Off
Solana has been trading inside a head and shoulders pattern, a bearish reversal setup.
The pattern projects a 19.21% breakdown. But the breakdown has not happened. Sell volume has declined sharply since the mid-February highs, signaling that the seller pressure required to pull SOL through the neckline is structurally absent.

That absence is the institutional bid showing up in price action. Long-term holder accumulation and ETF inflows have possibly absorbed the selling pattern needed to complete its measured move.
The same forces have also capped the upside. SOL has gained roughly 4% over the past 30 days. Bitcoin has gained closer to 20% in the same window. Institutional ownership has stabilized the asset but removed the high-velocity flow that drives speculative breakouts.
The level of math is tight in both directions. Holding $82.86, the 0.382 Fibonacci level, keeps the consolidation intact. A break of $82.86 exposes $77.91. A close below $69.89 confirms the breakdown the pattern projects, but would require a return to higher selling volume, which the current institutional flow data does not support. The full $56.92 target only activates if the institutional thesis breaks.

On the upside, a daily close above $85.93 reopens the path to $90.88. A break above $90.88 neutralizes the head and shoulders structure entirely. Above $97.67, the head’s high, the recovery becomes structural.
The $82.86 to $85.93 range is the line in the sand. A clean break above $85.93 hands the move back to the bulls. A daily close below $82.86 cracks the institutional floor and reopens $77.91. Until volatility expands in either direction, Solana stays caught between two forces that are neither selling nor buying with conviction.
The post Solana’s Volatility Hits a Multi-Year Low and The Institutional Trade Explains Why appeared first on BeInCrypto.
Crypto World
Trump’s Crypto Company Strikes Back: World Liberty Financial Sues Justin Sun for Defamation
Key Takeaways
- World Liberty Financial initiated defamation proceedings in Florida targeting Justin Sun
- Allegations include Sun engaging in short-selling activities and moving WLFI tokens to Binance with intent to manipulate pricing
- Sun had already launched legal action against World Liberty in April over frozen token assets
- The WLFI token experienced a 12% surge following lawsuit disclosure but remains 72% below initial trading levels
- Revenue distribution shows 75% of token sales flowing to the Trump family, generating over $1 billion
The cryptocurrency platform World Liberty Financial, established through a partnership with Donald Trump and his family members, has initiated defamation proceedings against Justin Sun, previously among its most significant financial supporters.
https://twitter.com/coinbureau/status/2051292790693540220?s=20
Court documents were submitted to Florida’s state judicial system on May 4. The complaint accuses Sun of orchestrating a coordinated effort to publicly malign the venture and undermine its credibility.
[[LINK_START_0]]World Liberty[[LINK_END_0]] contends that Sun moved WLFI tokens carrying governance privileges to the Binance cryptocurrency platform. Additionally, the filing asserts he executed short-selling strategies designed to profit from declining token values, coinciding with the public trading debut in September 2025.
Sun has rejected these accusations outright. Through his representatives, he characterized the legal action as “a meritless PR stunt” and expressed confidence in his courtroom defense.
This marks the second round of litigation between these entities. Sun filed his own lawsuit against World Liberty in April through San Francisco’s federal court system. His complaint alleged unauthorized freezing of his token holdings, elimination of his governance participation rights, and threats to permanently destroy the assets.
World Liberty countered that token freezing provisions were explicitly outlined in contractual documentation. The company accused Sun of improper behavior and dismissed his legal challenge as “a desperate attempt to deflect attention.”
The Transformation from Strategic Partner to Courtroom Opponent
Sun’s involvement began as a cornerstone supporter. His financial commitment totaled $45 million across late 2024 and early 2025, earning him an advisory position. He expanded his Trump-related investments by purchasing $100 million worth of Trump’s meme coins in July 2025.
Eric Trump previously praised Sun as “a great friend and an icon in the crypto space.” On September 1, 2025, when WLFI trading commenced, Sun publicly declared his conviction that the project would become “one of the biggest and most important projects in crypto.”
That alliance has now completely deteriorated.
Market Performance and Financial Exposure
Sun’s portfolio includes 4 billion WLFI tokens, presently valued at approximately $264 million. Since trading commenced, the token has plummeted from 31 cents to below 8 cents, representing roughly a 72% depreciation.
The token did experience a temporary 12% price increase after Monday’s lawsuit became public knowledge.
Revenue Distribution Structure
World Liberty’s organizational framework allocates 75% of proceeds from WLFI token transactions to the Trump family. According to Reuters’ financial analysis, the family has already secured more than $1 billion through this arrangement.
In his legal filing, Sun claimed that specific individuals managing World Liberty are exploiting the Trump reputation “to profit through fraud.” World Liberty categorically denies any impropriety.
The Securities and Exchange Commission previously examined Sun regarding allegations that he compensated social media influencers to promote his business interests without proper disclosure. Following the investigation’s closure, Senator Elizabeth Warren raised concerns about potential connections between that outcome and Sun’s financial involvement with Trump’s cryptocurrency enterprises.
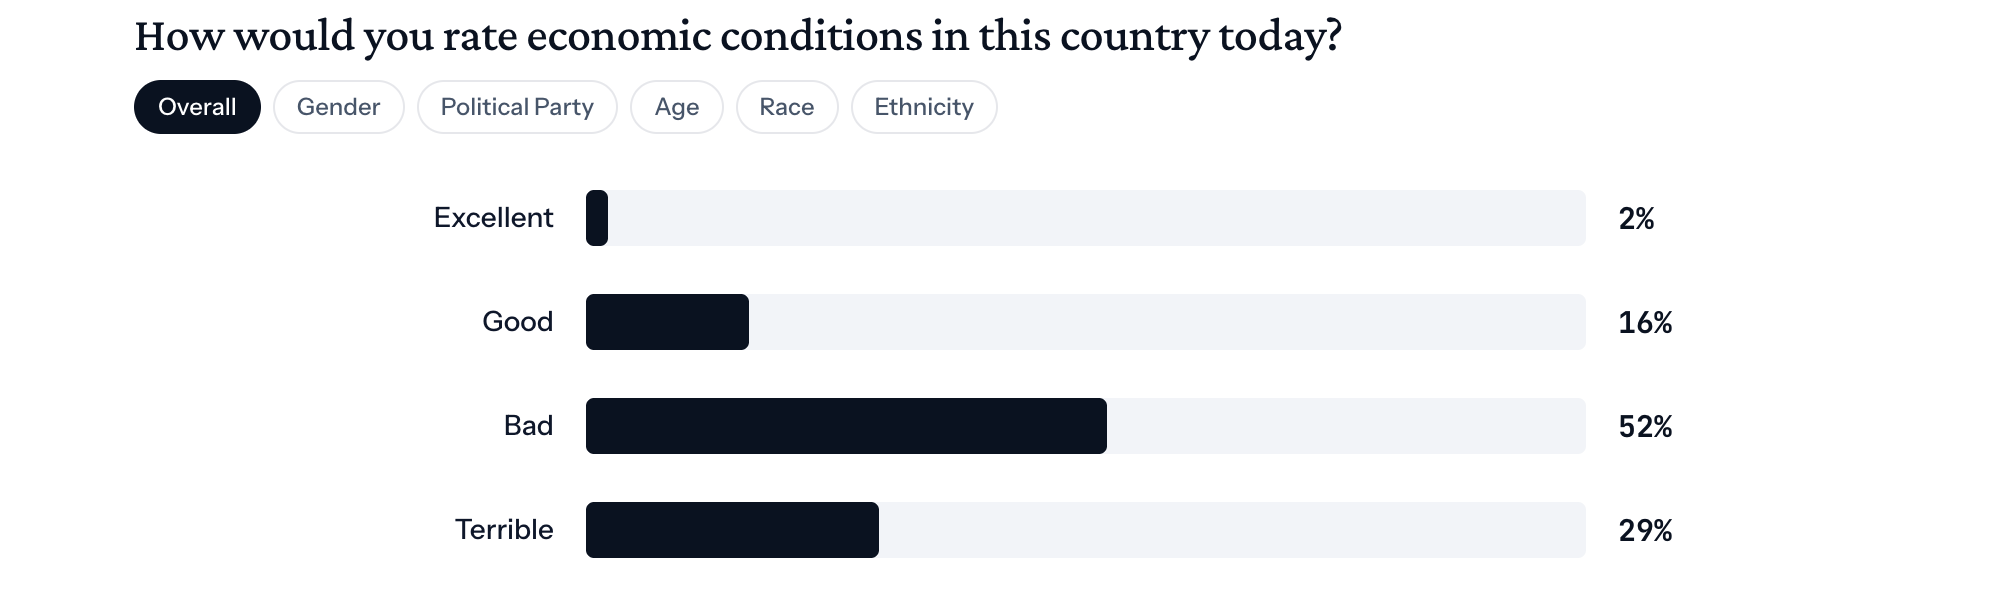
More than 84% of Americans aged 18-24 rate the US economy as bad or terrible, a fresh Generation Lab survey shows, with President Trump and corporate greed sharing most of the blame.
The findings land as Trump’s second term continues to push pro-crypto policy, suggesting economic gloom among Gen Z and younger millennials has not eased despite a friendlier digital asset agenda.
How Americans Feel About Trump’s Economy
Generation Lab surveyed 1,002 Americans aged 18-34 between April 26 and April 29. Among all respondents, 52% rated the economy as bad, and 29% rated it terrible. Just 16% picked good, and only 2% chose excellent.
Follow us on X to get the latest news as it happens

The pattern holds across age brackets. About 84% of 18-24-year-olds rated conditions as bad or terrible. The 25-29 group landed at 81%, while the 30-34s came in at 73%.
Sentiment runs sharper among women, non-binary, and other respondents. Roughly 90% of female respondents chose ‘bad’ or ‘terrible,’ compared with 73% of male respondents.
Meanwhile, among respondents who viewed the economy negatively, responsibility was most often assigned to the President. Overall, 41% attributed poor economic conditions to him.
Within the 18–24 age group, 42% placed the blame on Trump, while 32% cited corporate greed. Among those aged 25–29, opinion was evenly divided, with 33% pointing to Trump and an equal share blaming corporate actors.
The oldest cohort is the harshest. 48% of 30-34-year-olds pin responsibility on Trump, the highest share among any age group surveyed. Just 2% blame former President Biden.
Generation Lab noted that results carry a ±3.1 percentage-point margin of error, with wider margins for subgroup analyses.
Crypto Sentiment Meets Economic Reality
The findings stand out given Trump’s loud support for digital assets since returning to office. His administration backed a Strategic Bitcoin Reserve and signed the GENIUS Act, which regulates stablecoins.
Still, headline pressure remains intense. March inflation rose to 3.3%, while gas prices have surged past $4.45 per gallon since the US-Israel war with Iran began.
Concerns about a potential food shortage and the risk of a recession are also weighing on Americans. Notably, 77% of survey respondents said the United States made the wrong decision in taking military action against Iran.
Subscribe to our YouTube channel to watch leaders and journalists provide expert insights
The post Only 2% of Americans Call the US Economy “Excellent,” Poll Finds appeared first on BeInCrypto.
Sushi chain to open five new UK sites including in Bristol and Ipswich
Elon Musk Pays $1.5M to Resolve SEC Dispute Over Twitter Stock Disclosure Delay

BB Cs Jeremy Bowen Criticises Trumps Iran Bombing Decision
Manchester United reach agreement with Casemiro over contract clause amid transfer speculation

US brings back mandatory military draft registration

Steven Gerrard disagrees with Gary Neville over ‘shock’ Chelsea and Arsenal claim | Football


-

 Business6 days ago
Most Commercial Energy Audits Miss the Real Losses
-

 Fashion6 days ago
Kylie Jenner’s KHY Enters a New Era with ‘Born in LA’
-

 NewsBeat2 days ago
Channel 5 – All Creatures Great and Small series 7 new post
-
 Tech4 days ago
Trump’s 25% EU auto tariff breaches Turnberry Agreement that also covers semiconductors and digital trade
-
 Sports4 days ago
Paul Scholes issues Marcus Rashford reality check as agreement emerges over Man United star
-

 Crypto World7 days ago
CFTC’s AI will review U.S. crypto registration applications, chairman tells CoinDesk
-

 Business6 days ago
Barclay Brothers Avoid Bankruptcy: HSBC Drops High Court Petitions After IVA Deal
-
 Business6 days ago
Tesla Officially Registers Elon Musk’s Stock: What Investors Need to Know
-

 Tech7 days ago
Get Ready for More Brain-Scanning Consumer Gadgets
-

 Tech6 days ago
Texas Instruments made a new flagship graphing calculator: the TI-84 Evo
-

 Business4 days ago
Two Powerball Tickets Split $143 Million Jackpot in Indiana and Kansas
-
 Crypto World4 days ago
CoreWeave (CRWV) Stock Climbs 8% Despite $45M Insider Share Dump
-
Business2 days ago
Winning Numbers Drawn as Jackpot Resets to $20 Million
-
Crypto World5 days ago
Securitize and Computershare Enable Tokenized Equity Issuance for Over 25,000 U.S.-Listed Stocks
-

 Crypto World5 days ago
Gibraltar Proposes Tokenized Funds Regulation to Bolster Compliance
-

 Fashion2 days ago
Mary J. Blige Vegas Residency Looks: Crystal-Embellished Fjolla Haxhismajli, Todd Fisher, and More!
-

 Tech5 days ago
Official SAP npm packages compromised to steal credentials
-

 Tech7 days ago
Acer Swift 16 AI (2026) Review: Where Do Your Hands Go?
-

 Sports6 days ago
Antrim GAA: Hurlers cancel training as row with board deepens
-

 Crypto World2 days ago
Linux Copy Fail: ‘A Trivially Exploitable Bug’
You must be logged in to post a comment Login