

Crypto World
Policy at Consensus Miami: State of Crypto
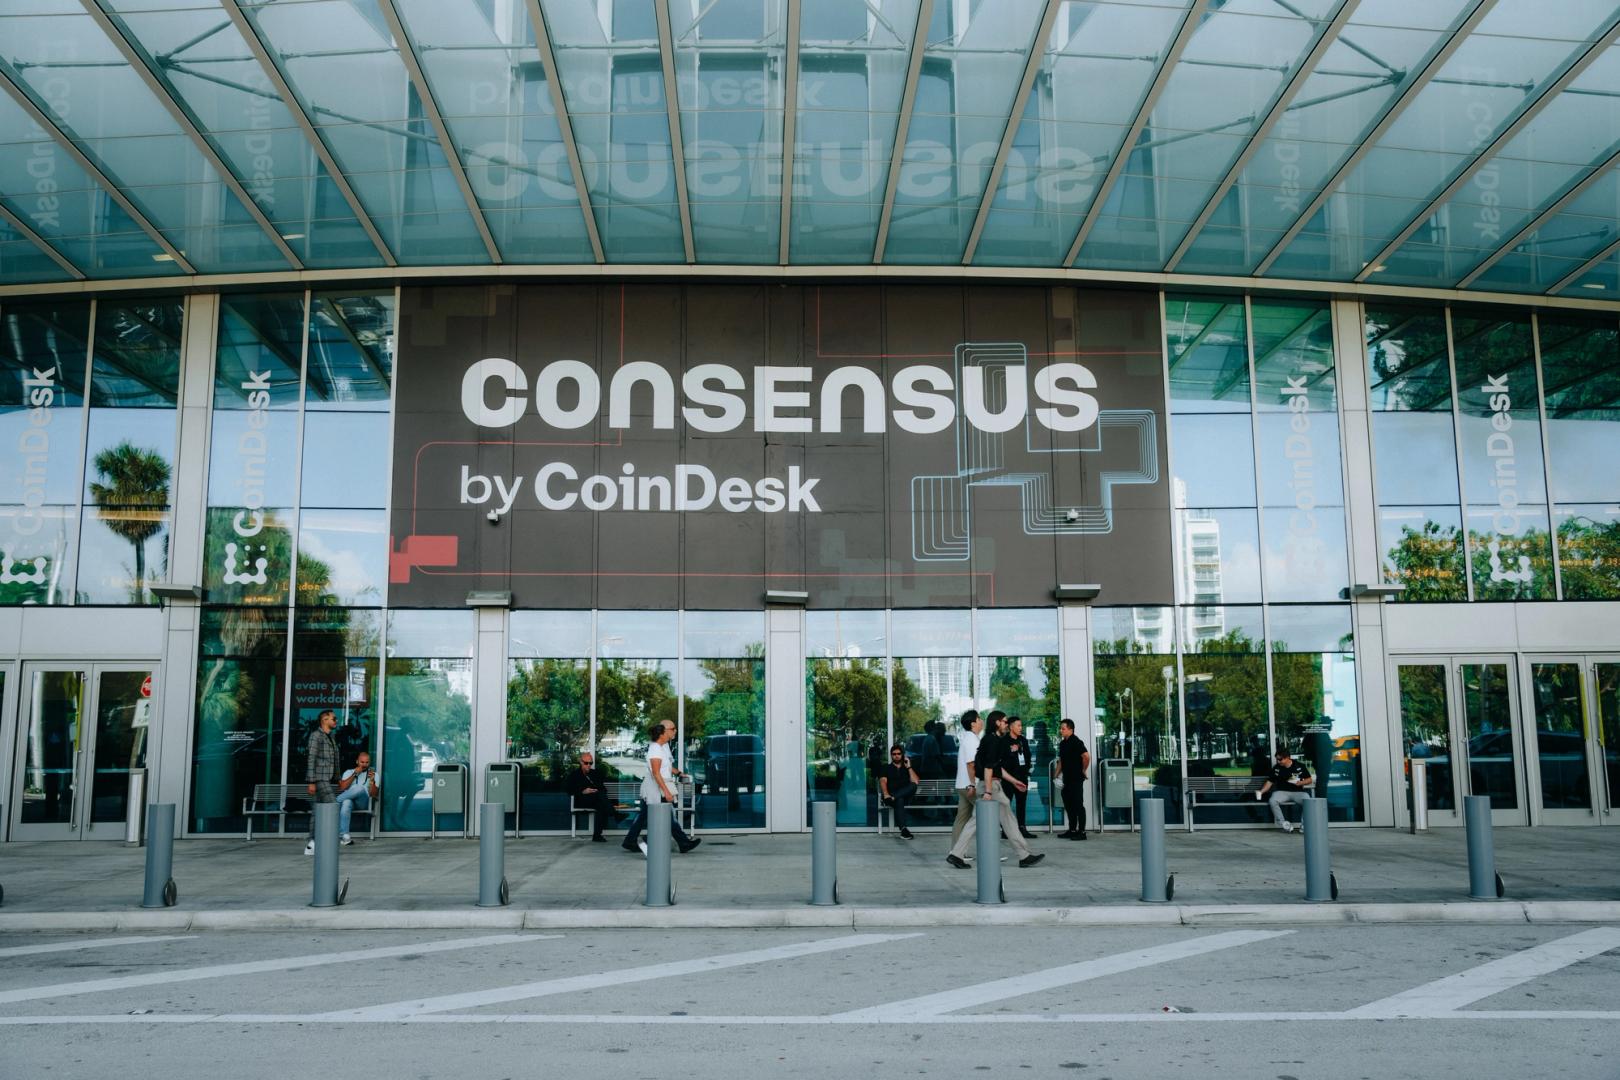

White House adviser Patrick Witt said it’s possible the Clarity Act becomes law by July 4 while Senator Kirsten Gillibrand pushed for an ethics provision in the market structure bill. Consensus Miami 2026 wrapped up with a fiery debate on the role of prediction markets, and a lot otherwise happened at our first conference in the Sunshine State.
CoinDesk also released the results of a survey it commissioned of 1,000 registered voters on their views toward crypto heading into the 2026 election.
PS: I’ll be at the Bermuda Digital Finance Forum next week. Let’s catch up if you’re there.
You’re reading State of Crypto, a CoinDesk newsletter looking at the intersection of cryptocurrency and government. Click here to sign up for future editions.
The narrative
White House Executive Director of the President’s Council on Digital Assets Patrick Witt told the audience at Consensus Miami this week that he believed it was possible to have President Donald Trump sign the Clarity Act into law by July 4. The timeline would require a markup this month (which seems very possible), four weeks for the Senate to merge the Banking and Agriculture bills (technically possible), a few weeks for reconciliation with the House (also technically possible) and the House vote (will depend on the House) and finally, the part where the president signs the bill.
Beyond Witt, we heard from various industry participants and policymakers at Consensus Miami. Catch up below.
Why it matters
Look, if you’ve read this newsletter for more than a few weeks, you know the Clarity Act has taken center stage for the last several months. Maybe it’ll happen and we can move on to other things. Maybe not. But there does seem to be more momentum now than there has been in weeks, and so we’ll see — I imagine quite soon — what that means.
Breaking it down
Consensus this year had a number of other sessions with lawmakers, policymakers and lawyers weighing in on everything from what the Clarity Act needs (ethics provisions, per Senator Kirsten Gillibrand) to whether or not prediction markets are gambling (we did not reach a conclusion but it was an excellent debate!).
Some highlights:
CoinDesk also released the results of a survey of registered voters it commissioned from April 21-27. We found that while voters generally don’t care about crypto leading into the 2026 midterm election when facing other issues like the economy and healthcare. This likely isn’t a surprise to anyone.
Voters did overwhelmingly say that they did not want senior government officials to have ties to crypto business interests, a majority said they did not feel comfortable with President Donald Trump’s administration overseeing crypto (though just 17% of voters said they knew he and his family had co-founded World Liberty Financial). Voters also overwhelmingly favored banks to crypto projects when asked which was more likely to bring them financial services.
You can read our articles on this data below:
Crypto is at bottom of U.S. voters’ priorities heading into elections, CoinDesk survey shows
U.S. voters don’t trust Trump administration to oversee crypto sector, CoinDesk poll finds
Americans still prefer banks over crypto for financial access, CoinDesk’s survey shows
Thursday
- 14:30 UTC (10:30 a.m. ET) The Senate Banking Committee plans to hold a markup hearing to advance the Clarity Act.
If you’ve got thoughts or questions on what I should discuss next week or any other feedback you’d like to share, feel free to email me at nik@coindesk.com or find me on Bluesky @nikhileshde.bsky.social.
You can also join the group conversation on Telegram.
See ya’ll next week!


TLDR:
- XRPL Foundation has expanded its leadership roles to improve coordination across developers and validators.
- XRP continues acting as liquidity bridge across settlement flows and tokenized asset markets.
- Compliance tools like credentials and permissioned domains support regulated XRPL participation.
- Lending, escrow, and payment channels advance XRPL’s programmable settlement infrastructure layer.
XRP Ledger Foundation advances ecosystem coordination as XRPL development intensifies across liquidity, compliance, and settlement design.
The latest structural updates place XRP at the center of network activity, while new leadership roles expand collaboration across developers, validators, and institutions globally.
XRPL Foundation Reshapes Governance and Ecosystem Coordination
The XRP Ledger Foundation new leadership roles now span engineering, operations, and community engagement to streamline protocol development cycles.
This structure will strengthen alignment between validators, developers, and infrastructure operators participating in network upgrades.
The organisation’s coordination model aims to reduce fragmentation across technical proposals and amendment processes.
Public collaboration has become central, with structured communication channels connecting core contributors globally. Regular updates and documentation efforts are now supporting clearer alignment between ecosystem participants.
Leadership changes also reflect a shift toward transparent ecosystem development and broader stakeholder participation.
The foundation continues engaging validators and developers through structured forums and technical working groups.
This approach positions XRPL governance for more consistent delivery of upgrades and protocol enhancements. Stakeholder engagement has increased through public events, livestreams, and community-led technical discussions.
These efforts aim to strengthen feedback loops between infrastructure operators and protocol engineers. The expanded structure reflects a growing emphasis on coordinated development across the XRPL ecosystem layers.
It also supports clearer decision-making processes for amendments and validator consensus upgrades. Overall coordination improvements are expected to enhance XRPL’s long-term technical stability.
The foundation continues positioning itself as a central facilitator across ecosystem governance. This transition supports broader institutional alignment globally across markets.
XRP Expands Role in Liquidity, Compliance, and Settlement Design
This is as XRP continues to function as a liquidity bridge asset across XRPL-based settlement flows. It is increasingly used for transactions requiring cross-currency routing without direct trading pairs.
This structure enhances settlement efficiency across institutional and retail payment environments globally. On-chain orderbook systems and automated market makers continue supporting decentralized trading activity.
Token standards across the ledger include IOUs, NFTs, and semi-fungible asset representations. These mechanisms improve liquidity distribution while maintaining native settlement characteristics of the network.
Compliance-oriented tools such as credentials and permissioned domains are gaining attention within XRPL development. These features aim to support regulated participation without compromising core ledger efficiency or performance.
Permissioned DEX concepts are being evaluated to enable controlled trading environments for institutions. Lending infrastructure under development targets both institutional credit markets and retail participation models.
XRP will remain central to settlement flows, particularly in bridging liquidity across asset classes. Its role extends across both retail payments and institutional-grade financial infrastructure use cases.
The asset continues to support ecosystem expansion across global payment corridors and tokenized markets. Market participants continue monitoring XRPL upgrades as adoption of compliant infrastructure grows steadily.
The ecosystem developments aim to support broader interoperability across global blockchain-based financial systems over time frameworks.

TLDR:
- MSTR targets doubling Bitcoin exposure per share every 7 years through strategic leverage and management execution.
- A 14-year projection shows MSTR potentially delivering a 75x return compared to Bitcoin’s estimated 13x gain.
- Buying MSTR alongside spot Bitcoin lets investors compound exposure without selling or replacing their core holdings.
- The core trade-off is clear: MSTR carries more risk but offers greater purchasing power protection than spot Bitcoin alone.
Investors seeking Bitcoin exposure increasingly look beyond spot holdings toward MicroStrategy (MSTR) as an alternative vehicle.
The question of why someone would buy MSTR instead of Bitcoin comes down to one core objective: maximizing purchasing power through amplified exposure.
While both assets track Bitcoin’s growth, their mechanics differ significantly, and those differences matter greatly depending on an investor’s goals.
MSTR Offers a Different Path to Bitcoin Exposure
MicroStrategy operates as a leveraged Bitcoin holding company. Every share represents indirect but amplified exposure to Bitcoin’s price movements. This structure appeals to investors who want more Bitcoin per dollar invested over time.
Adam Livingston, a Bitcoin advocate, framed this clearly. He explained, “If I take $180 and buy 1 MSTR share, the management is acting to increase my Bitcoin exposure per share, currently with a stated goal of doubling my Bitcoin per share over 7 years.”
Compare that to buying spot Bitcoin directly. A $180 investment in Bitcoin locks in a fixed amount of the asset. That exposure never grows unless the investor adds more capital. MSTR, by contrast, works to compound Bitcoin holdings per share through strategic leverage.
Management execution remains the key variable here. If MicroStrategy delivers on its stated goals, shareholders benefit from growing Bitcoin exposure without actively adding capital. That compounding effect is what separates MSTR from simply holding spot Bitcoin in a wallet.
The Math Behind Choosing MSTR Over Bitcoin
Numbers help clarify why risk-tolerant investors favor MSTR. Livingston outlined a 14-year projection using realistic assumptions. With Bitcoin growing at 20% annually and MSTR maintaining a 33% amplification ratio, the results diverge sharply over time.
Under those conditions, Bitcoin delivers roughly a 13x return over 14 years. MSTR, factoring in leverage and a mNAV re-rating to 1.5x, projects closer to a 75x return over the same period. That gap represents a meaningful difference in preserved and grown purchasing power.
Livingston acknowledged the trade-off directly. He noted, “Am I accepting more risk? Absolutely, 100%. But when you actually run the math it is very easy to see why people take the risk.” The risk is real, but so is the potential reward for investors who understand what they are buying.
MSTR also fits within a Bitcoin-standard framework. Investors can price their returns in Bitcoin terms rather than fiat, making MSTR a rational allocation of risk capital alongside spot holdings.
Buying MSTR does not replace Bitcoin — it works alongside it for those seeking greater exposure. For investors focused on protecting and growing purchasing power, MSTR presents a mathematically sound, though higher-risk, alternative to holding Bitcoin alone.
.
TLDR:
- TRX price climbed to $0.35 while total token transfers fell sharply from 17.3 billion to 12.2 billion.
- The drop in network activity during a price rally points to speculation rather than organic on-chain demand.
- Tron Inc. acquired 142,957 TRX at $0.3498, pushing total treasury holdings past 695.2 million tokens.
- Analysts warn the $0.35 price level remains fragile without a recovery in on-chain transfer volume.
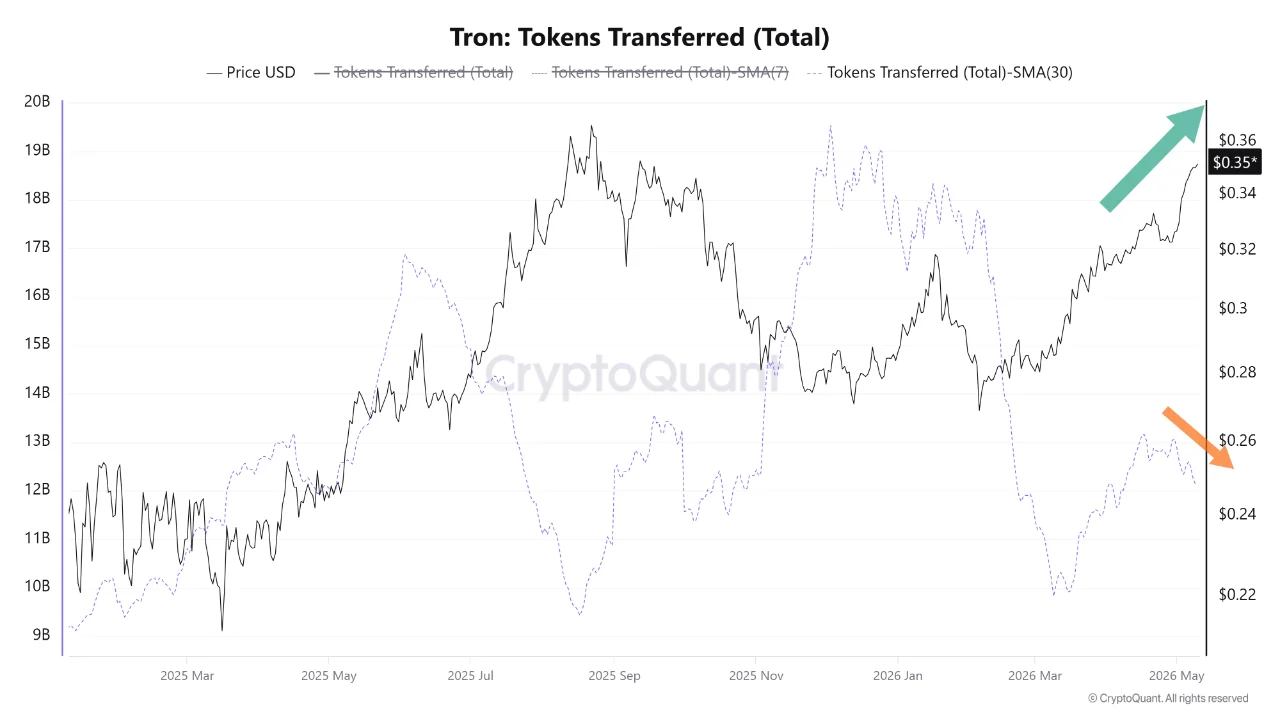
Tron (TRX) has climbed back to $0.35, matching its recent price high. However, on-chain data tells a different story beneath the surface.
Network token transfers have dropped sharply, falling from 17.3 billion to 12.2 billion. This gap between price and activity has raised red flags among analysts. The divergence points to a rally that may lack the organic support needed for sustained momentum.
On-Chain Data Reveals a Growing Gap Between Price and Network Activity
Tron’s price recovery to $0.35 looks strong on charts at first glance. Yet the underlying network data does not confirm the move.
Token transfer volume on the Tron blockchain has declined steeply over the past month. That kind of drop during a price rally is a classic bearish divergence signal.

Source: Cryptoquant
A healthy price rally is typically backed by rising network usage and real utility. When prices rise while transfers fall, it suggests fewer users are actively moving tokens.
This pattern often points to speculative buying rather than organic demand. Traders watching on-chain metrics would treat this as a cautionary sign.
The gap between price performance and transfer volume has widened considerably. Moving from 17.3 billion to 12.2 billion in total transfers is not a minor dip.
It reflects a measurable decline in actual network participation. That level of drop during a price surge is worth taking seriously.
If buying pressure fades without network activity to support the price, a correction becomes more likely. The $0.35 level may struggle to hold under those conditions.
Analysts tracking these signals tend to wait for transfer volume to recover before calling a rally sustainable. Until then, caution remains the appropriate stance.
Tron Inc. Continues Accumulating TRX Despite Market Warning Signs
While market analysts flag the divergence, corporate activity around TRX continues. Tron Inc., listed on NASDAQ under the ticker TRON, recently disclosed a fresh purchase. According to an update shared on X, the company acquired 142,957 TRX tokens at an average price of $0.3498.
That purchase brought Tron Inc.’s total TRX treasury holdings to over 695.2 million tokens. The company stated that it aims to grow its Tron DAT holdings further.
The goal, as outlined in the announcement, is to enhance long-term shareholder value. A designated on-chain wallet tracks these treasury movements in real time.
Corporate accumulation at the $0.35 level adds an interesting layer to the current picture. Large buyers stepping in at these prices can sometimes slow or delay a correction.
However, institutional buying alone does not resolve the underlying network activity concern. Transfer volume would still need to recover to confirm a healthier rally.
The contrast between institutional accumulation and declining on-chain usage reflects the tension in TRX’s current market position.
Traders are watching both sets of data closely. The next move in price may depend on which force proves stronger. Network activity picking back up would be the cleaner bullish signal to watch for.
TLDR:
- ETF inflows and treasury demand continue to support expectations of a potential market cycle peak
- Macro rate expectations and equity correlation remain key drivers of short-term crypto sentiment
- Exchange reserve trends and derivatives positioning show mixed sentiment across trading venues
- Price consolidation near resistance suggests accumulation with potential breakout formation ahead
Bitcoin Return Prediction from VanEck targets a new all-time high within 12 months. The outlook draws strength from institutional demand, ETF inflows, and shifting macro conditions that shape liquidity across global crypto markets. Market participants track flow data and positioning for directional confirmation.
Institutional Flows and Market Structure Support
VanEck builds its outlook on rising institutional participation in regulated Bitcoin products. ETFs attract continuous capital, and this strengthens spot market liquidity. Corporate treasuries also expand allocations, which adds steady buy-side pressure across cycles.
Market structure reflects this demand. Bitcoin is consolidating below resistance while buyers absorb supply on dips. Price action holds higher lows, which signals accumulation instead of distribution across recent sessions.
Macro conditions reinforce this setup. Interest rate expectations and equity performance drive risk appetite in digital assets. Institutions adjust exposure through spot accumulation and hedged derivatives based on volatility shifts.
Exchange data supports the trend. Traders withdraw Bitcoin from exchanges at a steady pace, which reduces available sell-side liquidity. This pattern aligns with long-term holding behavior and stronger market phases.
Macro Drivers, Risk Factors, and Price Structure
VanEck links the new high projection to global liquidity conditions. Easier liquidity pushes capital into risk assets like Bitcoin. In contrast, tighter policy conditions slow momentum and reduce upside speed.
Regulation remains a key variable. Policy shifts across major economies affect institutional participation and capital allocation. Market participants monitor these developments closely as they adjust positioning.
Bitcoin trades in a tight range below resistance. Buyers defend higher support levels and maintain structure across short-term charts. This compression often leads to expansion when volume returns.
Momentum indicators recover gradually. Price avoids overextension, which leaves room for continuation if demand strengthens. Traders watch breakout confirmation through volume expansion and follow-through.
Derivatives positioning remains split. Some traders hedge risk, while others build selective long exposure. This reflects uncertainty in timing, not direction.
Overall, Bitcoin holds a structured consolidation phase. ETF inflows and macro signals continue to guide sentiment as the market waits for a breakout that could validate the move toward a new cycle high.
TLDR:
- ONDO has rallied over 100% from its local lows and is now testing major Fibonacci resistance.
- Elliott Wave structure suggests the current move may still be a corrective rally within a bearish trend.
- A breakout above $0.598 could invalidate the bearish setup and support further upside momentum.
- Ondo’s RWA narrative gains traction through ties with JPMorgan, Mastercard, and Ripple pilots.
The ONDO price is shifting toward whether ONDO can sustain momentum or face renewed selling pressure at overhead resistance.
ONDO Price Analysis Signals Caution Near Major Resistance
ONDO has posted an aggressive recovery since bouncing from the February capitulation zone near $0.19. The move delivered a strong upside reaction after months of sustained downside pressure across the broader altcoin market.
The current rally has now pushed the price directly into the $0.486 to $0.598 region. This zone represents the 50% to 61.8% Fibonacci retracement of the prior decline, making it a critical technical barrier.
In Elliott Wave analysis, this area often acts as the termination point for wave 4 recoveries before the broader downtrend resumes.
Although price action has remained constructive, the structure of the rally continues to raise caution. The advance shows overlapping internal moves rather than the clean breakout behavior usually associated with a fresh bullish impulse. This suggests the recent recovery may still be corrective.
The bearish structure remains valid while ONDO trades below $0.598. If price fails to clear this resistance cluster, downside pressure could return quickly. The first major downside trigger remains a break below $0.35, which would suggest the rally has likely topped.
In that scenario, ONDO could revisit the $0.24 support zone initially. Additional weakness may expose the prior capitulation floor near $0.19 once again.
Institutional RWA Narrative Keeps ONDO in Spotlight
Despite technical caution, ONDO continues attracting strong attention due to its expanding role in tokenized finance.
The recent collaboration involving JPMorgan Chase, Mastercard, Ripple, and Ondo Finance has strengthened market confidence in the project’s long-term narrative.
The pilot reportedly demonstrated tokenized US Treasury settlement across institutions in under five seconds. This development addresses one of traditional finance’s major inefficiencies by improving settlement speed and cross-border liquidity movement.
As tokenized Treasuries gain traction, ONDO is increasingly being positioned within the infrastructure layer of the Real World Asset market.
Analysts view this as a strong narrative catalyst, especially as institutions continue exploring blockchain settlement solutions.
From a technical perspective, maintaining support above $0.35 to $0.40 keeps the medium-term bullish structure intact. However, a confirmed breakout above $0.598 remains the most important trigger for trend continuation.
If bulls secure that move, ONDO could open a path toward $0.70, with momentum potentially extending toward the $0.85 region in the next expansion phase.
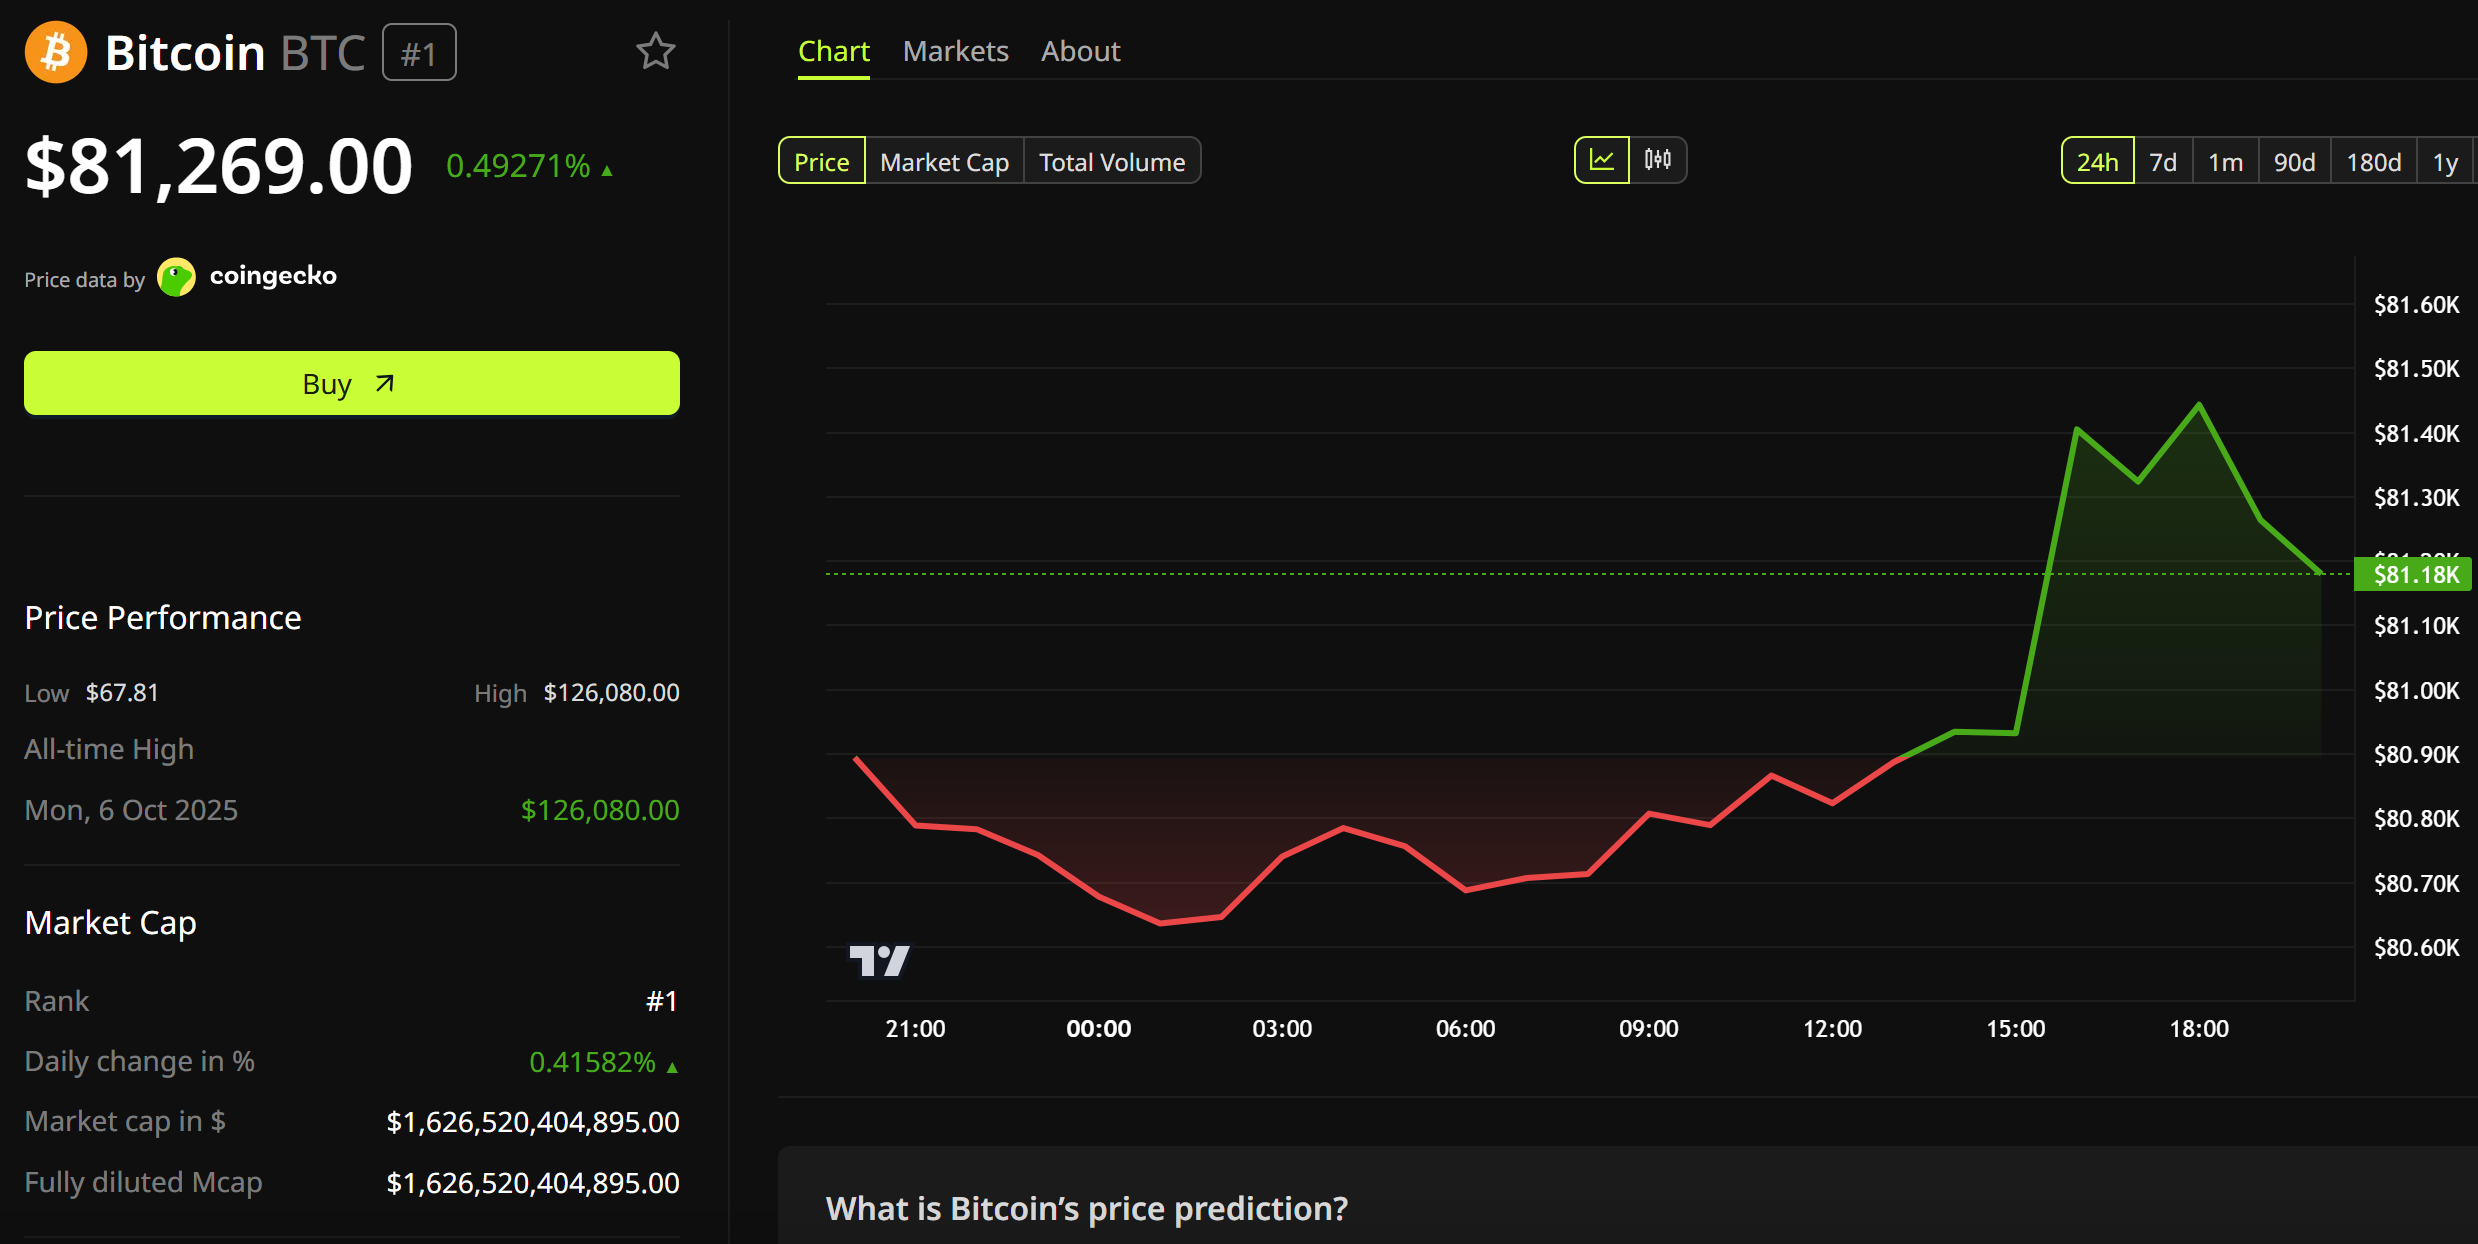
Bitcoin (BTC) climbed above $81,000 over the weekend, drawing trader caution as inflation data and political tension collide this week. The next technical target sits at $83,400 based on Fibonacci projections, with a rising RSI suggesting momentum continues to build.
Investors now face Tuesday’s Consumer Price Index (CPI) print, Wednesday’s Producer Price Index (PPI), and Thursday’s retail sales reading. OPEC’s monthly report also lands midweek. Friday marks Jerome Powell’s final day as Federal Reserve Chair.
Trump’s Iran Warning Adds Geopolitical Risk
Donald Trump accused Iran of stringing along the United States for 47 years. The post singled out former President Barack Obama. Trump claimed Obama’s administration handed Tehran billions, including $1.7 billion in physical cash.
Trump described the transfer as a windfall the regime “had no idea what to do with.” He argued it gave Iranian officials a financial lifeline. The president did not announce new sanctions or military steps.
The remarks landed as Bitcoin’s weekend rally tested resistance near $81,000, sharpening focus on geopolitical risk across crypto markets.

Macro Calendar Tests Bitcoin’s Momentum
Tuesday’s CPI release remains the most consequential print for Federal Reserve policy expectations. Cooler-than-expected readings typically support risk appetite, while hot inflation tends to push out rate-cut timing. April data could reshape pricing for the next two FOMC meetings.
Wednesday adds PPI alongside OPEC’s monthly oil outlook, with Thursday’s retail sales and Friday’s industrial production rounding out the calendar. Each release could shift Fed rate-cut bets within minutes.
Whether Bitcoin reaches $83,400 or retreats depends on how Trump’s Iran rhetoric collides with US data this week. Powell’s final session as Fed Chair adds another wildcard.
“Never trust a $BTC weekend pump,” remarked Trader Killa in a post.
Bitcoin Channel Pattern Targets $83,400 if BTC Clears 200-Day EMA
Meanwhile, Bitcoin traded at $81,269 as of this writing, holding within a month-long ascending channel as price approached the 200-day exponential moving average (EMA) resistance at $82,036.
The token recovered roughly 35% from February lows near $60,000, supported by renewed spot Bitcoin ETF inflows. However, momentum indicators show mixed signals as BTC stalls just below a long-term trend line that has capped every rally attempt since late January.

Bitcoin RSI Climbs Above 65 as Overbought Risk Builds
The Relative Strength Index (RSI) on the daily chart sits at 65.56, with its moving average trailing at 61.89. Both readings remain firmly above the neutral 50 line, confirming that buyers control short-term price direction.
This momentum reading tracks Bitcoin’s steady recovery from the February capitulation. RSI has climbed without interruption since the indicator briefly pierced oversold conditions three months ago, mirroring the parallel rebound visible across BeInCrypto’s bear market analysis coverage.
Yet the current strength carries a warning. The 70 threshold marks entry into overbought territory, and the indicator now prints its highest reading since the breakdown began in January. Historical precedent shows that daily RSI pushes above 70 typically precede short-term cooling phases for BTC.
A clean breakout still needs volume confirmation. If buyers fail to drive the RSI through 70 while price holds below the 200-day EMA, bearish divergence could form between price highs and momentum highs. A daily close that drops the RSI back below 50 would flip the signal and validate sellers regaining control of the trend.
Bitcoin Price Prediction Eyes $83,400 if Channel Holds
Bitcoin trades inside a clean ascending channel that began in early April near the $60,000 floor. Price action has respected the channel midline as dynamic support throughout the rally, with each pullback finding buyers within the structure.
The 200-day EMA at $82,036 currently caps the upside. This level coincides with a heavy supply zone that rejected price multiple times during the January through February breakdown. A daily close above $82,036 would mark Bitcoin’s first reclaim of this trend line in nearly four months, validating the May outlook projected by several analysts.
Should BTC clear that hurdle, the 61.8% Fibonacci retracement at $83,399 becomes the next logical target. This level sits at the upper boundary of the channel, creating a confluence zone that could trigger profit-taking.
A measured move from the channel projects toward roughly $86,500 over subsequent weeks if buyers absorb supply at $83,400.
The bearish invalidation sits at the 50% Fibonacci level of $78,915. A daily close below this support would break the channel structure and open the door to a retest of the 38.2% Fibonacci retracement at $74,431.
Below that, the 23.6% retracement at $68,884 marks the final support before the recovery thesis breaks, in line with the broader long-term forecast for BTC in 2026.
Continued spot ETF demand remains the primary catalyst. Net inflows totaled roughly $2.7 billion across nine consecutive sessions in late April, with BlackRock’s IBIT and Fidelity’s FBTC capturing the majority share.
Total assets across U.S. spot Bitcoin products have now passed $100 billion, providing a steady bid that has held the lower channel boundary intact despite bearish risk factors flagged earlier in 2026.
Whether Bitcoin clears the 200-day EMA or rejects from it within the next two weeks will set the directional tone for the trend heading into June.
The post Bitcoin Eyes $83,400 But Trump’s Iran Warning and CPI Week Spark Trader Caution appeared first on BeInCrypto.
TLDR:
- Pompliano declared confidence that Bitcoin’s cycle bottom was established at the $60K price level.
- Institutional accumulation by buyers like MicroStrategy created consistent demand against Bitcoin’s fixed supply.
- Pomp argues volatility compression has broken Bitcoin out of its traditional four-year market cycle.
- Bitcoin, stablecoins, and tokenization are the assets Pompliano sees surviving and leading crypto’s next phase.
Bitcoin’s recent price action has renewed debate over whether the market has already seen its cycle low. Anthony Pompliano, widely known as “Pomp,” made a bold claim, stating, “I’m pretty confident that was the bottom at $60K.”
His comments came during a broader discussion on Bitcoin’s fundamentals, institutional adoption, and long-term outlook. The statement has since drawn significant attention from investors watching Bitcoin’s next move closely.
Pompliano Points to $60K as the Cycle Bottom
Pompliano’s confidence in the $60K bottom is rooted in Bitcoin’s core fundamentals. He described Bitcoin as offering “certainty” that traditional assets simply cannot provide.
Unlike gold or U.S. Treasuries, Bitcoin’s fixed supply and transparent monetary policy give investors a clear picture of what they own. That clarity, he argues, is what separates Bitcoin from every other asset class available today.
He also noted that the shift from fear to confidence among investors played a major role in establishing that floor. When prices hovered around $60K, many retail and institutional participants were still hesitant.
Pompliano described this period as one where the market needed to move from “fear to confidence” before a sustained recovery could take hold. That transition, in his view, defined the bottom.
Institutional activity also supported the case for $60K as a turning point. Buyers like Michael Saylor and MicroStrategy were accumulating during that period, adding consistent demand against a fixed supply.
However, Pompliano was careful not to overstate any single buyer’s role, calling the recovery a “confluence of events” rather than the result of one catalyst. Each factor reinforced the other, creating a durable floor.
Pompliano also challenged the traditional four-year Bitcoin cycle, arguing that “volatility compression” has changed how the market behaves entirely. Price movements now happen faster and with less dramatic drawdowns than in previous cycles.
If that pattern holds, the $60K level may represent the deepest pullback of this cycle. Investors waiting for lower prices, he suggested, may have already missed their entry point.
Bitcoin’s Fundamentals Back the Bullish Case
Beyond the price call, Pompliano laid out the structural reasons Bitcoin is well-positioned from here. He described Bitcoin as “the only asset” offering digital scarcity, decentralization, and a predictable monetary policy at the same time.
In periods of geopolitical tension and economic volatility, those qualities attract serious capital. Investors seeking certainty are finding fewer alternatives outside of Bitcoin.
He also addressed the growing intersection of artificial intelligence and crypto. Pompliano argued that AI systems will increasingly require assets like Bitcoin and stablecoins to operate, framing both industries under the broader theme of “automation.”
Crypto infrastructure, therefore, becomes a foundational layer for the emerging automation economy. Venture firm a16z has already raised a dedicated fund targeting exactly this convergence.
On surviving assets within crypto, Pompliano was direct and unambiguous. He expressed strong conviction in Bitcoin, stablecoins, equity infrastructure, and tokenization as the areas that will endure.
Most altcoins and meme coins, he argued, are unlikely to recover meaningfully. The smarter approach, in his words, is to “provide the venue” for speculation rather than being the one speculating.
While acknowledging that Bitcoin’s days of delivering 100x returns are behind it, Pompliano remains firmly bullish on its long-term performance. He expects Bitcoin to outperform equities over a sustained period.
For investors who missed the $60K entry, his message is straightforward — “the bottom,” by his assessment, is already in.
TLDR:
- Digital Asset is targeting $300M at a $2B valuation, with a16z crypto set to lead the funding round.
- Canton Network has processed over $6 trillion in tokenized assets, drawing major institutional backers globally.
- A16z crypto raised $2.2B for its fifth fund, bringing total dedicated crypto capital to roughly $10 billion.
- Crypto venture deal counts dropped sharply to 97 in Q1 2026, down from 427 in the same quarter last year.
Digital Asset Holdings, the company behind the Canton Network blockchain, is in talks to raise approximately $300 million at a valuation of around $2 billion.
Bloomberg reported the round on Sunday, citing sources familiar with the matter. The financing, led by a16z crypto, is expected to close within weeks. Final figures could still shift before the deal is sealed.
a16z Crypto Takes the Lead in Major Institutional Blockchain Bet
The raise marks a sharp jump from Digital Asset’s earlier funding rounds. In June 2025, the company secured $135 million led by DRW Venture Capital and Tradeweb Markets. Goldman Sachs, Citadel Securities, and DTCC also participated in that round.
A follow-on raise of $50 million came in December 2025 from BNY Mellon, Nasdaq, S&P Global, and iCapital. The new $300 million round would therefore represent a substantial step up in both size and valuation.
For a16z crypto, the investment follows the firm raising $2.2 billion for its fifth dedicated crypto fund. That brings the firm’s total crypto capital to roughly $10 billion across five vehicles.
A16z general partner Ali Yahya addressed the privacy question directly in January, writing that privacy is “the critical missing feature preventing global finance from fully moving onchain.”
That view aligns directly with what Canton Network offers. Unlike Ethereum or Solana, Canton is built with protocol-level privacy and confidentiality guarantees. Those features are central to its pitch for institutional adoption.
Canton Network Gains Traction Across Institutional Finance
Canton is a public, permissionless Layer 1 blockchain with configurable privacy tools. It supports smart contracts written in Digital Asset’s open-source language, Daml.
The network is designed to handle tokenized asset workflows while keeping transaction data confidential between parties.
Institutional momentum has been building steadily. More than $6 trillion in tokenized assets have been issued or processed on the network. In March, Visa became a Canton Super Validator, marking the payments company’s first blockchain governance role.
Visa later added Canton to its stablecoin settlement pilot in April, alongside Base, Polygon, Arc, and Tempo. Also in March, a project called Zenith completed atomic swaps between Canton and an EVM-compatible environment, opening a potential bridge to Ethereum developers.
In November, Canton Strategic Holdings raised $540 million to build a Canton Coin treasury. Backers included DRW, ARK Invest, and Kraken. The broader venture picture, however, remains uneven.
Quarterly crypto deal counts fell to 97 in Q1 2026, down from 427 in the same period a year earlier, per The Block. Some historically active crypto funds are increasingly shifting focus toward AI and robotics.
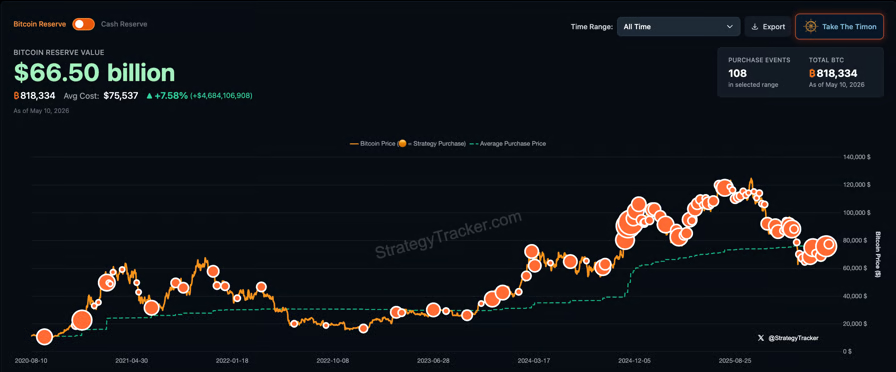
Michael Saylor, co-founder of Strategy, signaled that the Bitcoin treasury company will resume its BTC purchases this week, following an earnings call on Tuesday, during which he said the company may periodically sell portions of its treasury.
“Back to work, BTC,” Saylor said in an X post on Sunday, messaging that has previously preceded a BTC purchase, which typically the day after his posts.
The company last purchased BTC on April 27, buying 3,273 coins for about $255 million, which brought its total holdings to 818,334 BTC. Those holdings were worth about $61.8 billion, according to Strategy’s website at the time of publication.

Strategy’s history of Bitcoin purchases since 2020. Source: SaylorTracker.com
The company paused its BTC buying streak for one week ahead of Tuesday’s first quarter 2026 earnings call, in which Saylor said that the company could sell portions of its Bitcoin holdings periodically to pay dividends to holders of its credit instruments.
The announcement appeared to contradict the company’s previous stance of never selling BTC, and the sales could weigh on Bitcoin’s market price by introducing new selling pressure, critics of the move say.
Related: Bitcoin’s recent rally is largely fueled by Strategy purchases: Bitwise’s Hougan
Strategy CEO says dividend-funding sale could “inoculate” the market
“We’ll probably sell some Bitcoin to fund a dividend, just to inoculate the market, just to send the message that we did it,” Saylor said during Strategy’s Q1 earnings call.
The announcement drew mixed reactions from the Bitcoin community, with some, like Strategy investor Adam Livingston, arguing that periodic sales will be accretive for the company’s treasury, allowing it to finance the purchase of more BTC in the future.

Strategy’s Bitcoin per share since 2020, measured in sats, the base unit of Bitcoin. Source: SaylorTracker.com
Bitcoin advocate Samson Mow said Strategy’s ability to sell BTC gives it optionality and greater room to maneuver in the financial markets.
Others social media sentiment posited that Strategy’s Bitcoin sales and credit instruments will create a “doom loop” that suppresses the spot market price of BTC.
Strategy CEO Phong Le clarified that the company would only sell BTC in specific instances, including paying dividend yields and deferring taxes, and that neither its sales nor purchases should affect Bitcoin’s market price.
Bitcoin’s average daily trading volume of more than $60 billion could easily absorb Strategy’s $1.5 billion in annual dividend payments owed to holders of its corporate credit products, he said.
“I don’t think we’re driving the price up or down,” Le told CNBC, adding that the company owns about 4% of the total BTC supply.
Magazine: Big Questions: Can Bitcoin save you from the dreaded Cantillon Effect?
Crypto World
Bitcoin’s Realized Cap Turns Positive, Signaling Fresh Capital Inflows After February Slump
TLDR:
-
- Bitcoin’s realized cap monthly growth has returned to +0.25%, ending a steep -2.6% decline recorded in February 2025.
- The February correction triggered realized losses as investors who bought BTC at higher prices exited their positions.
- The downturn reflected a weak-to-strong hands transfer, with patient buyers absorbing supply from loss-realizing sellers.
- Analysts now watch whether rising profit-taking will slow recovery or if fresh demand will sustain the positive cap trend.
- Bitcoin’s realized cap monthly growth has returned to +0.25%, ending a steep -2.6% decline recorded in February 2025.
Bitcoin’s realized cap has moved back into positive monthly growth, posting a gain of +0.25% after a steep decline.
This shift follows a difficult correction period that pushed the metric to -2.6% in February. The realized cap tracks the difference between realized profits and realized losses in the market.
It is considered one of the clearest measures of capital movement. Analysts are now watching closely to see whether the trend can hold as market conditions improve.
Realized Cap Drop Reflected Investor Losses During Correction
The February decline in Bitcoin’s realized cap came as investors sold holdings at a loss. Many of those investors had purchased BTC at higher price levels earlier in the cycle. As selling pressure grew, the realized cap pulled back sharply, reflecting capital destruction in the market.
Crypto analyst Darkfost explained the pattern on X, noting that the realized cap measures “the difference between realized profits and realized losses.” During the downturn, this balance tilted heavily toward losses. That shift dragged the monthly growth rate deep into negative territory.
The correction phase also produced a shift in ownership. Investors unwilling to absorb further losses exited their positions and transferred holdings to buyers at lower prices.
This process is commonly referred to as a transfer from weak hands to strong hands. It is a pattern that has appeared in previous Bitcoin market cycles.
Even so, overall sentiment during the correction remained cautious. New capital did not immediately return to the market after prices fell. Buyers waited for valuations to reach levels they considered attractive before committing fresh funds to Bitcoin.
Positive Shift Suggests New Capital Is Returning to Bitcoin
Now that the realized cap has turned positive again, the market dynamic appears to be changing. According to Darkfost, “investor sentiment is improving as capital begins flowing back into the market.”
That change is reflected in the monthly growth figure moving above zero for the first time since the downturn.
The +0.25% reading is modest on its own. However, coming directly after a -2.6% monthly decline, it carries weight as a directional shift. Analysts tend to look at this kind of recovery as an early sign that buyers are returning with confidence.
Capital inflows at this stage often reflect improved sentiment among both retail and institutional participants. When new money enters the market, it tends to push realized profits higher. That, in turn, supports further growth in the realized cap over subsequent months.
The central question, as Darkfost noted, is whether this recovery can continue as more investors take profits. If selling pressure increases alongside rising prices, the growth rate could stall again. However, if demand absorbs that supply, the realized cap is likely to continue its upward trend.
XRP Ledger Builds Liquidity Stack with XRP at Core of Protocol Design

Knicks tie NBA playoff record for first-half 3-pointers as they eye sweep of 76ers

Sharp & Roku launch first joint QLED TV in the UK
Manchester United reach agreement with Casemiro over contract clause amid transfer speculation

US brings back mandatory military draft registration

Steven Gerrard disagrees with Gary Neville over ‘shock’ Chelsea and Arsenal claim | Football

Everyone Is Lying to You for Money | Official Trailer UHD

Day 93 Trying to Win MONEY from the Coin Pusher! #shorts #arcade #money

#watch #money #america #news #viral #work #society #car #food #apple #ps5 #reaction #economy #sad
-
 Crypto World2 days ago
HarrisX Poll Found 52% of Registered Voters Support the CLARITY Act
-

 Crypto World4 days ago
Upbit adds B3 Korean won pair as Base token gains Korea access
-

 Fashion2 days ago
Weekend Open Thread: Marianne Dress
-

 Tech6 days ago
Image AI models now drive app growth, beating chatbot upgrades
-
 NewsBeat4 days ago
NCP car park operator enters administration putting 340 UK sites at risk of closure
-
 Business1 day ago
Ignore market noise, India’s long-term story intact, say D-Street bulls Ramesh Damani and Sunil Singhania
-

 Politics2 days ago
Politics Home Article | Starmer Enters The Danger Zone
-

 Entertainment7 days ago
Olivia Wilde Reacts To Viral ‘Corpse’ Comparison
-

 Sports7 days ago
Inter Milan Win Serie A Title After Victory Over Parma
-

 Sports7 days ago
La Liga: Vinicius Jr scores twice as Real Madrid win to keep Barcelona waiting for title
-

 Crypto World5 days ago
UAE Free Zone Deploys Blockchain IDs to Verify Registered Firms
-
 Sports7 days ago
Every word of Arne Slot’s heated rant after Manchester United win vs Liverpool
-

 Sports7 days ago
Joel Embiid urges Sixers fans not to sell playoff tickets to Knicks fans
-
 Sports6 days ago
2026 NHL playoff picks: Second-round predictions, series odds, Stanley Cup bracket
-

 Entertainment7 days ago
Moroccan Reacts To Nick Cannon’s Dating Rules For His Sister
-
Entertainment7 days ago
Jennifer Lawrence’s Mary Jane Sneakers Are Spring’s It-Girl Shoe
-

 Entertainment7 days ago
Kylie Jenner and Timothee Chalamet Hold Hands in NYC Outing
-

 Crypto World4 days ago
BlackRock CEO Larry Fink Discusses a New Asset Class
-

 Crypto World4 days ago
Robinhood says Wall Street is building onchain
-

 Entertainment7 days ago
Post Malone Delays Tour With Jelly Roll Amid Ongoing Backlash
You must be logged in to post a comment Login