
Crypto World
Polymarket Breaks $478 Million Record

Polymarket recorded a single-day notional trading volume of $478 million, with the politics category alone accounting for $220 million, nearly half of total daily activity.
Elsewhere, rival prediction market Kalshi was on the receiving end of user backlash after a controversial contract over the Khamenei market.
Polymarket Sets Historic Record as Geopolitical Tensions Drive Crypto Betting
Prediction markets surged to historic highs as the United States and Israel launched coordinated strikes on Iran.
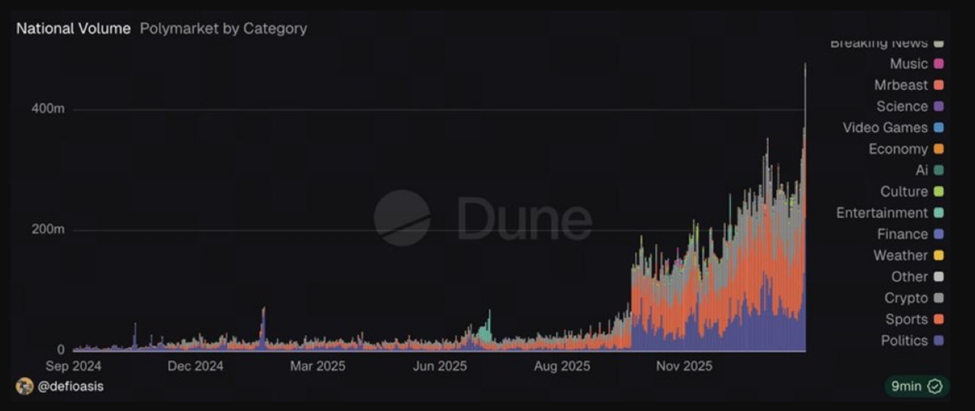
Polymarket reached an all-time high across the platform and its political markets. According to data aggregated by Defioasis, Polymarket’s spike coincided directly with the strikes.
It signals the platform’s capacity to price geopolitical events faster than TradFi markets or polling models.
Certain strike-timing contracts set their own records, with individual trades clearing up to $90 million, reflecting the massive liquidity flowing into the platform.
However, the traction was also marred by allegations of insider trading, with Bubblemaps identifying at least six addresses that profited approximately $1.2 million from bets tied to the Iran conflict.
The surge in activity shows how prediction markets are increasingly blurring the line between financial speculation and geopolitical forecasting, drawing attention from traders, lawmakers, and regulators.
The timely pricing of real-world events demonstrates the efficiency of blockchain-based markets. However, it also raises concerns about transparency and fairness, particularly when wallets appear to perfectly anticipate outcomes.
Kalshi Faces Backlash Over Khamenei Market, CEO Defends Settlement and Ethics
Meanwhile, Kalshi, a US-regulated prediction market, faced its own controversy with the contract titled “Ali Khamenei out as Supreme Leader?”
The market, which had accumulated over $50 million in total volume, saw roughly $20 million traded on strike day alone.
Following Khamenei’s reported death during the strikes, critics argued the platform had effectively created a proxy death market, despite its stated rules against profiting from death outcomes.
Kalshi CEO Tarek Mansour addressed the backlash on X (Twitter), emphasizing that all positions would be settled at pre-death last-traded prices. Meanwhile, post-death positions would be fully reimbursed, including all trading fees.
Mansour defended the market’s design as consistent with U.S. regulations. He noted that leadership changes in Iran carry significant geopolitical, economic, and national security implications. This, he said, makes such markets relevant without directly incentivizing death.
“A market on Ali Khamenei’s out as Supreme Leader was important because leadership changes in Iran have a major impact on the world order,” Mansour wrote, outlining that traders could still profit or lose based on legitimate political outcomes rather than mortality.
The settlement process, he explained, adhered strictly to the CFTC-filed contract terms, which referenced the last-traded price prior to Khamenei’s death, even amid ambiguities in reporting timelines.
On the one hand, Polymarket is setting new benchmarks for trading volume amid geopolitical tension. Meanwhile, Kalshi is facing ethical scrutiny.
Both events highlight the potential and the risks of prediction markets. These platforms offer unprecedented speed and transparency in pricing world events.
However, as February 28 demonstrated, they also amplify ethical dilemmas and regulatory attention during crypto-driven speculation.


TLDR
- The American Bankers Association disputed the White House analysis on stablecoin risks.
- Bankers said policymakers must study a market where stablecoin yield remains allowed.
- Lawmakers drafted a compromise to restrict yield-like rewards on stablecoins.
- The Senate Banking Committee has not scheduled a hearing on the bill.
- Senator Cynthia Lummis called for urgent action to advance the legislation.
U.S. banking leaders have challenged a White House report that downplayed risks from stablecoins. They argue that stablecoin yield could draw deposits away from traditional banks. The dispute has stalled the Digital Asset Market Clarity Act in the Senate.
Bankers Dispute White House Findings on Stablecoin Yield
The American Bankers Association rejected a recent Council of Economic Advisers report. The group said the report examined the wrong policy scenario. It argued that economists should have studied a market where stablecoin yield remains permitted.
ABA economists wrote, “The CEA paper minimizes the core risk by starting from the wrong question.” They said a ban on yield for payment stablecoins would protect insured deposits. They also said such a rule would support stablecoins as payment tools rather than deposit substitutes.
Bankers warned that allowing yield could speed deposit migration. They said returns from stablecoins may exceed bank interest rates. They argued that customers would move funds to chase higher rewards.
The ABA estimated that stablecoin markets could grow from $300 billion to $2 trillion. It said yield would act as the main driver of that expansion. It added that growth at that scale would reshape deposit flows.
Senate Negotiations Stall Over Crypto Bill
Lawmakers have struggled to advance the Digital Asset Market Clarity Act. The bill seeks to set rules for U.S. crypto markets. However, disagreements over stablecoin yield have delayed committee action.
Senators from both parties considered bankers’ concerns about deposit flight. They discussed how depositors fund lending activities. They then drafted a compromise to limit certain reward structures.
The compromise would ban yield on holdings that resemble deposit accounts. It would allow activity-based rewards similar to credit card programs. Still, banks have not publicly endorsed the proposal.
Senator Cynthia Lummis urged action on the social media platform X. She wrote, “America needs Clarity.” She also said the time to move the bill forward is “now or never.”
The Senate Banking Committee has not scheduled a hearing. Lawmaker advocates had expected a session before the month’s end. As of this week, no official date appears on the calendar.
Bank representatives have kept a lower public profile. However, they continue to circulate policy papers and letters. They argue that early safeguards would limit systemic shifts.
The White House economists had said banks face limited risk. They examined a scenario where Congress bans yield. Bankers countered that lawmakers must assess a no-ban environment.

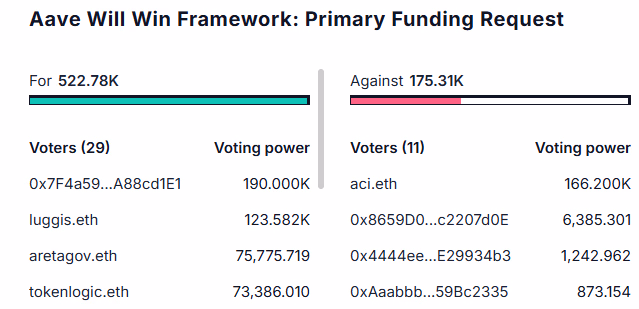
‘Aave Will Win’ passed with 75% support, awarding Aave Labs a $25 million stablecoin grant and 75,000 AAVE in exchange for directing 100% of product revenue to the DAO treasury.
The Aave DAO on Sunday approved the first binding component of the “Aave Will Win” framework, which founder Stani Kulechov calls “the most important proposal in Aave’s history,” directing 100% of revenue from all Aave-branded products to the DAO treasury and consolidating economic rights under the AAVE token.
The vote closed with roughly 75% support, a significantly stronger result than the initial Temp Check in early March, which narrowly cleared amid concerns that Aave Labs-linked addresses had tipped the balance.

The approved package includes a $25 million stablecoin grant from the DAO’s Collector Contract, split between an immediate $5 million allowance and streamed payments over six and 12 months, plus 75,000 AAVE tokens vesting linearly over 48 months from the Ecosystem Reserve, double the timeline outlined in the original temp check.
In exchange, Aave Labs commits to routing all revenue from Aave Pro, the Aave App, Horizon, Aave Kit, and swaps on aave.com to the DAO treasury, a stream that Kulechov said is already generating $10 to $20 million on top of protocol revenue, which hit $140 million in 2025.
“If you own AAVE, you own not just the economic rights of the protocol, but the brand, the users, and the integrations,” Kulechov wrote on X, laying out an ambitious multi-year roadmap spanning consumer products, fintech integrations, and regulatory licensing.
The proposal resolves a governance crisis that erupted in December when a delegate discovered that Aave Labs had been redirecting roughly $200,000 per week in interface fees, previously flowing to the DAO, to itself via a CowSwap integration. That controversy spiraled into a broader confrontation over tokenholder rights, brand ownership, and the power balance between Labs and the DAO.
The fallout was severe. BGD Labs, one of the core teams working on Aave V3, announced its departure in February. The Aave Chan Initiative followed in early March. And last week, risk management firm Chaos Labs became the third major contributor to exit.
The AAVE token has lost roughly 75% of its value since its August 2025 high near $356, though it rallied approximately 5% following the vote to trade near $95.
The vote comes just two weeks after Aave V4 launched on Ethereum mainnet, introducing a hub-and-spoke architecture that allows independent lending markets to share liquidity through a unified system. The framework formally ratifies V4 as the protocol’s long-term technical foundation.
Under the new framework, Kulechov outlined a zero-tolerance policy on “value leakage,” requiring that all service providers build exclusively for Aave with measurable performance goals.
Aave is DeFi’s largest lending protocol with roughly $25 billion in total value locked across multiple chains.
This article was written with the assistance of AI workflows. All our stories are curated, edited and fact-checked by a human.
XRP price is down by 2% in a week, with the Fear & Greed Index pinned at 16, but an analyst comes up with a prediction that creates an unusual tension right now. Technical signals suggest XRP may be approaching a structural bottom, but the longer-term debate on just how high this asset can realistically go has reignited in force.
Financial commentator Jake Claver told the Paul Barron podcast that XRP could reach $1,000 by the end of 2026 if institutions, including BNY Mellon, Fidelity, Citi, Franklin Templeton, and JPMorgan, fully adopt Ripple’s settlement infrastructure.
Ex-Goldman Sachs analyst Dom Kwok echoed the target on a longer timeline, projecting $1,000 by 2030 on the back of regulatory clarity and institutional inflows.
Meanwhile, Vandell of Black Swan Capitalist offered a more grounded framework: in a world of perpetual fiat debasement, asset price ceilings are effectively theoretical.
“No one knows exactly how these things will play out,” he said, “but based on probabilities and the dynamics that actually drive price… over time it becomes natural for the price to rise.”
The macro backdrop, such as dollar weakness, institutional crypto infrastructure buildout, and Ripple’s ongoing acquisition activity, keeps the structural bull case alive even as short-term charts look exhausted.
Discover: The best pre-launch token sales
XRP Price Prediction: Hit $1,000? What the Charts Say First
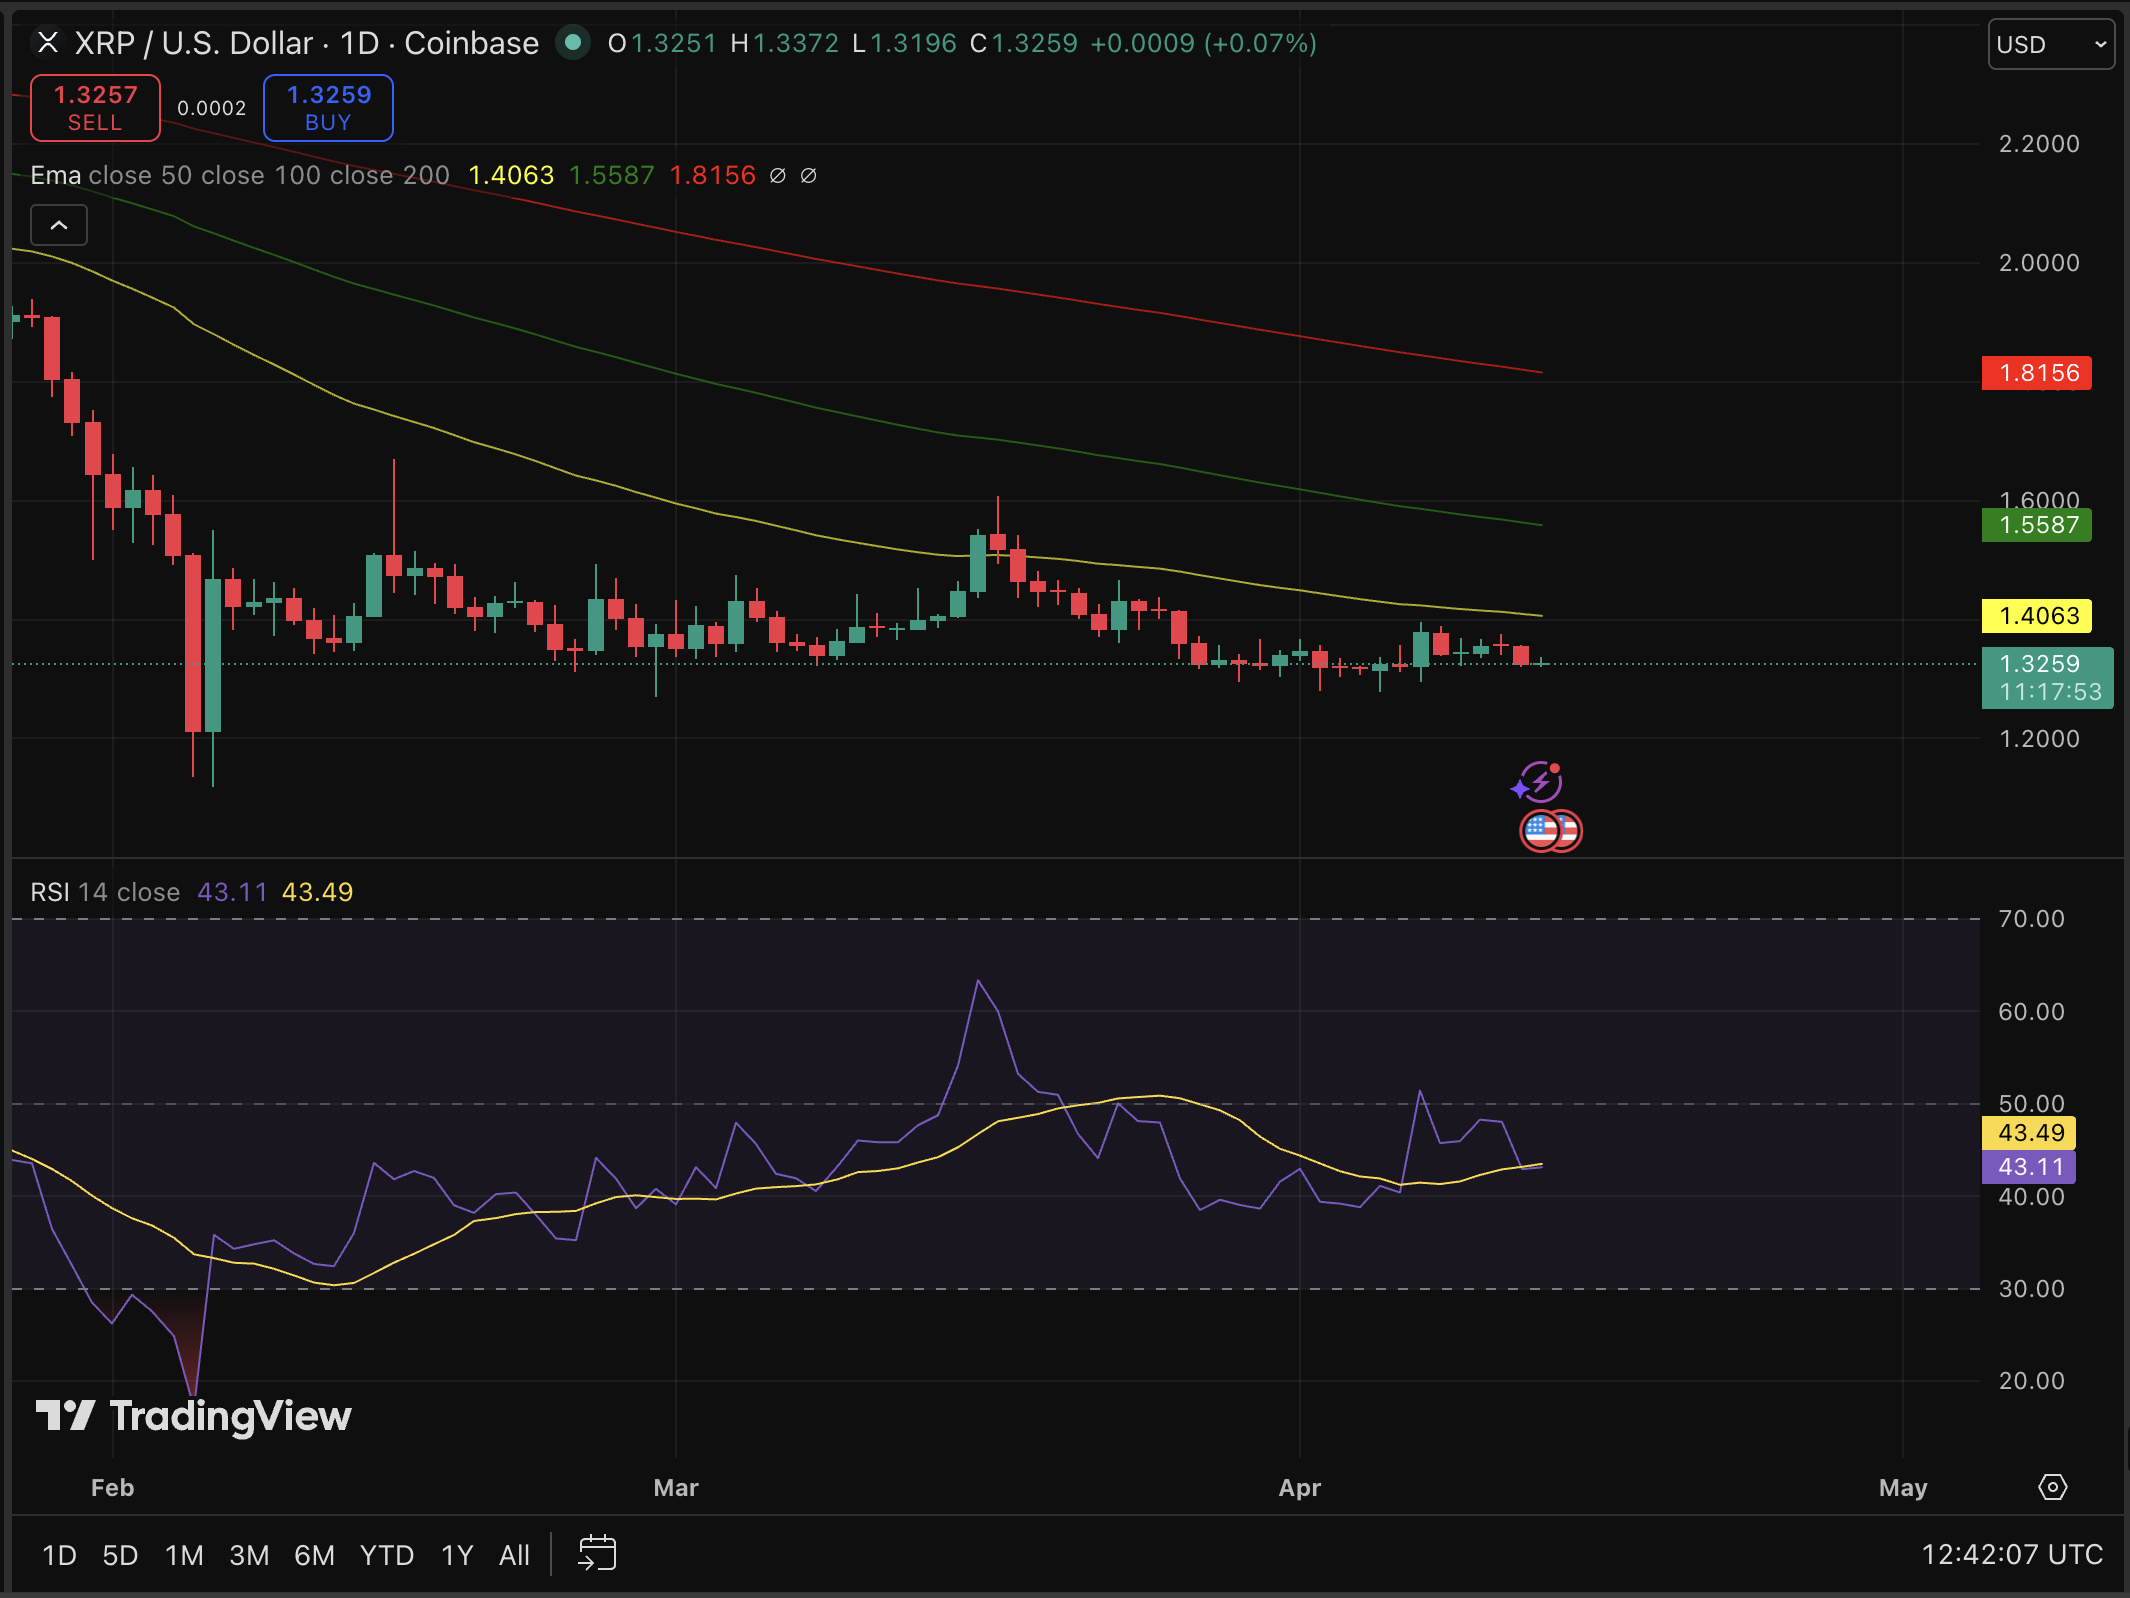
XRP’s current print of $1.32 sits below its 50-day SMA of $1.40, a meaningful technical warning. RSI at 43 reads neutral, with only 40% of the last 30 days closed green for the price.
Support clusters around $1.30, which aligns with algorithm-derived base-case floor estimates for 2026. Resistance sits at the $1.60, a level that would represent a +20% move, which has been putting a ceiling on the current range twice.

If institutional bank adoption accelerates, Ripple partnerships close, and XRP reclaims $1.40, it could open the path toward analyst Fibonacci targets of $4.50 over 6–12 months.
The $1,000 target requires a market cap north of $57 trillion at current supply, which is the math skeptics cite. What Vandell’s framework suggests is that the denominator (fiat value) shifts, too. Dismissing it entirely misses the point. Treating it as a 2026 certainty misses it even harder.
Discover: The best crypto to diversify your portfolio with
Bitcoin Hyper Eyes Early-Stage Upside While XRP Grinds Through Resistance
XRP’s $81 billion market cap means even a doubling to $2.6 is a $80 billion capital injection requirement. That’s not impossible, but it’s not the risk/reward profile of an early-stage position.
Traders rotating out of large-cap consolidation plays are increasingly scanning presales for asymmetric exposure. That’s where Bitcoin Hyper enters the frame.
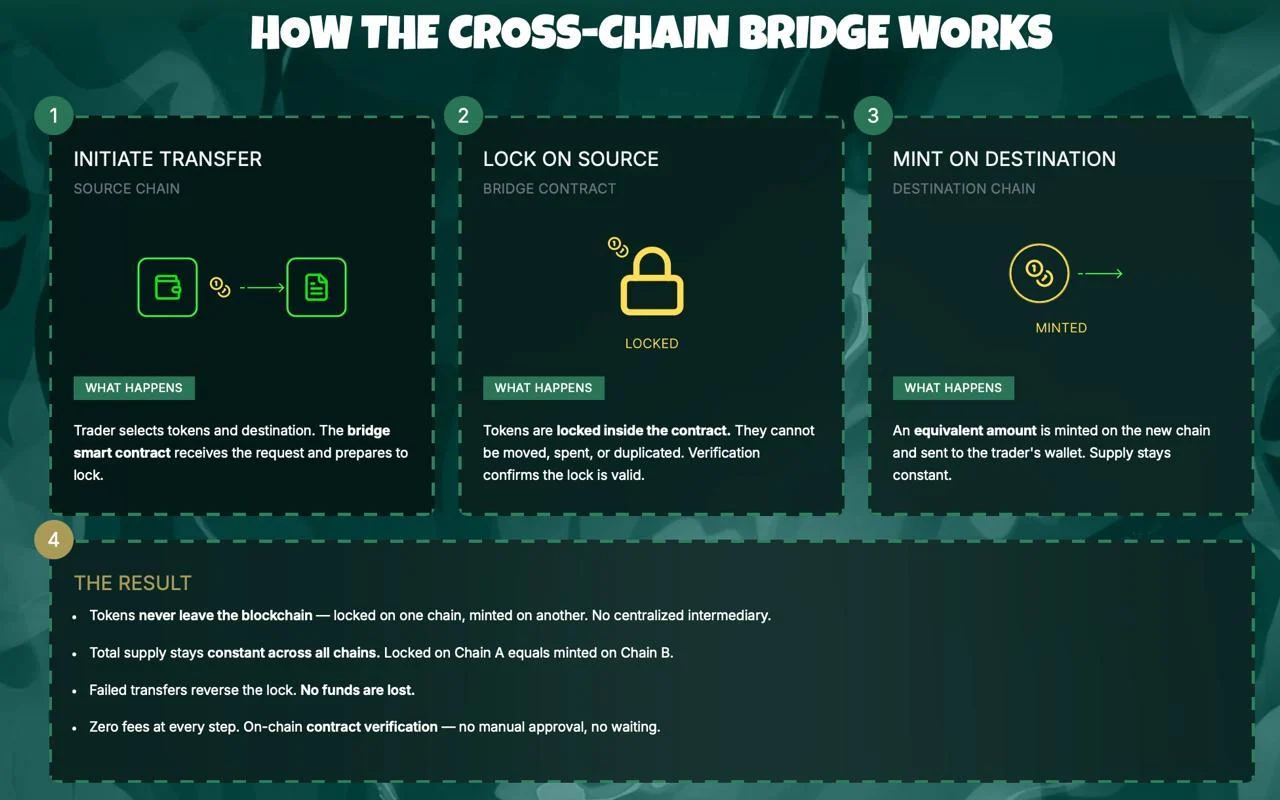
Bitcoin Hyper ($HYPER) is building the first-ever Bitcoin Layer 2 with Solana Virtual Machine (SVM) integration, combining Bitcoin’s security with smart contract execution that outpaces Solana on latency.
The presale has now raised a huge $32 million milestone at a current token price of just $0.0136, with 35% APY staking live for early participants.
The core thesis: Bitcoin’s $1 trillion+ ecosystem currently lacks programmability and speed. HYPER targets that gap directly, offering a decentralized canonical bridge for BTC transfers alongside high-speed, low-cost execution.
Research Bitcoin Hyper and review the presale details here.
The post XRP Price Prediction: $1,000 Is Not Impossible appeared first on Cryptonews.


Kraken’s Chief Security Officer Nick Percoco has revealed that the crypto exchange is being extorted by criminals who are threatening to leak videos of client data.
Percoco shared the news on X today, detailing how it identified two instances of its staff accessing its client systems and leaking them online.
He claims that in 2025, the exchange discovered one of its support staff had leaked client data after somebody tipped the firm off about footage circulating on criminal forums.
Read more: Hyperbridge exploited less than two weeks after April Fools’ day hack prank
In this instance, Percoco says the firm was able to revoke the staff member’s access and enact additional security controls.
Percoco says the firm has since learned of another more “recent” breach, and as before, it terminated the individual’s access to company systems.
He claims that Kraken then received extortion demands.
“The criminals threatened to distribute materials from both the February 2025 incident and the recent incident to media outlets and on social media if we did not comply. We will not pay these criminals,” he said.
Clients included in the leaks were informed, and Percoco said it only affected “approximately 2,000 in total (0.02% of clients).”
Read more: Kraken customer data allegedly for sale on dark web
He added that the firm believes “there is sufficient evidence to support the identification and arrest of those responsible.”
“We are actively working with federal law enforcement across multiple jurisdictions to pursue all individuals involved and bring them to justice,” he said.
Protos contacted Kraken for further details about the extortion and why it disclosed the February 2025 breach over a year later, and was told by a spokesperson, “A criminal group is threatening to release information about a security incident if we do not meet their extortion demands.
“We will not negotiate with bad actors and have therefore transparently shared what happened in a post on X.”
Stolen data from Kraken appears to have been listed for sale earlier this year on Russian-speaking criminal forums. The vendor claimed to sell “panel access” login credentials that would give buyers read-only access to Kraken’s know your customer documentation, transaction histories, and support tickets.
Billion-dollar crypto exchange Coinbase was also extorted in 2025 after its customer support staff leaked customer data.
In this case, cybercriminals bribed staff and then used the leaked data to try to blackmail Coinbase out of $20 million.
Protos has reached out to Kraken for comment and will update this piece should we hear anything back.
Got a tip? Send us an email securely via Protos Leaks. For more informed news and investigations, follow us on X, Bluesky, and Google News, or subscribe to our YouTube channel.


Kraken is facing an extortion attempt after uncovering two insider incidents involving support staff access to limited client data.
The exchange’s Chief Security Officer, Nick Percoco, insists its systems and funds were never compromised.
Kraken Insider Extortion Case Exposes Growing Support Staff Security Risks
Crypto exchange Kraken disclosed two separate incidents of insider access involving support staff who viewed limited client data, which later prompted an extortion attempt by a criminal group.
The firm’s CSO says no systems were breached and funds remained secure after acting immediately on each alert. Support access was revoked quickly in both cases, according to the Kraken security update statement.
“We are currently being extorted by a criminal group threatening to release videos of our internal systems with client data shown if we do not comply with their demands,” Percoco wrote in a post.
According to the company, only about 2,000 client accounts, roughly 0.02% of its user base, may have been viewed during the incidents.
Notifications were sent to affected users. Kraken says the exposure was limited to support systems, not trading infrastructure, and no funds were affected.
Kraken Rejects Extortion Demand
The incidents escalated when a criminal group began demanding payment, threatening to release internal videos and data unless Kraken complied.
Reportedly, Kraken refused, stating it would not negotiate with bad actors. The exchange confirmed it is working with law enforcement across jurisdictions and has gathered sufficient evidence for identification efforts.
“We are actively working with federal law enforcement across multiple jurisdictions to pursue all individuals involved and bring them to justice,” he added.
The case reflects a wider industry issue involving attempts to recruit or bribe customer support employees at crypto and tech firms.
It mirrors Coinbase’s 2025 case, where bribed overseas agents leaked customer information. In both, no systems were breached, client funds remained safe, and the exchanges refused extortion demands while cooperating with law enforcement.
Security teams across the sector have increased monitoring and access controls in response. Similar tactics have been observed in the gaming and telecom sectors, according to industry reports.
Notwithstanding, some users question offshore support hiring practices, arguing that geography influences security risk perception.
“Why don’t you hire people from developed countries? I won’t put my money on a platform that I have to hope for their third world support staff to not get bribed by criminals to expose my data. Banks don’t hire support staff in third world countries either,” one user expressed.
Kraken has not commented on those claims but emphasized access controls over location as the primary safeguard.
The post Criminals Blackmail Kraken With Alleged Client Data Leak appeared first on BeInCrypto.


Tom Duff Gordon, the vice president of international policy at U.S.-listed cryptocurrency platform Coinbase (COIN), has left the firm for pastures green.
Duff Gordon, who had been with Coinbase for close to 4 years, left the exchange to join OpenAI as head of EMEA Policy, a Coinbase spokesperson said via email.
Duff Gordon had previously spent 8.5 years working as a banker at Credit Suisse. He did not immediately respond to a request for comment.
An expert on crypto regulations, Duff Gordon recently pointed out that U.K. banks are blocking millions of customers from accessing legal and compliant services, by failing to distinguish between Financial Conduct Authority-registered firms with low fraud rates and higher-risk operators.

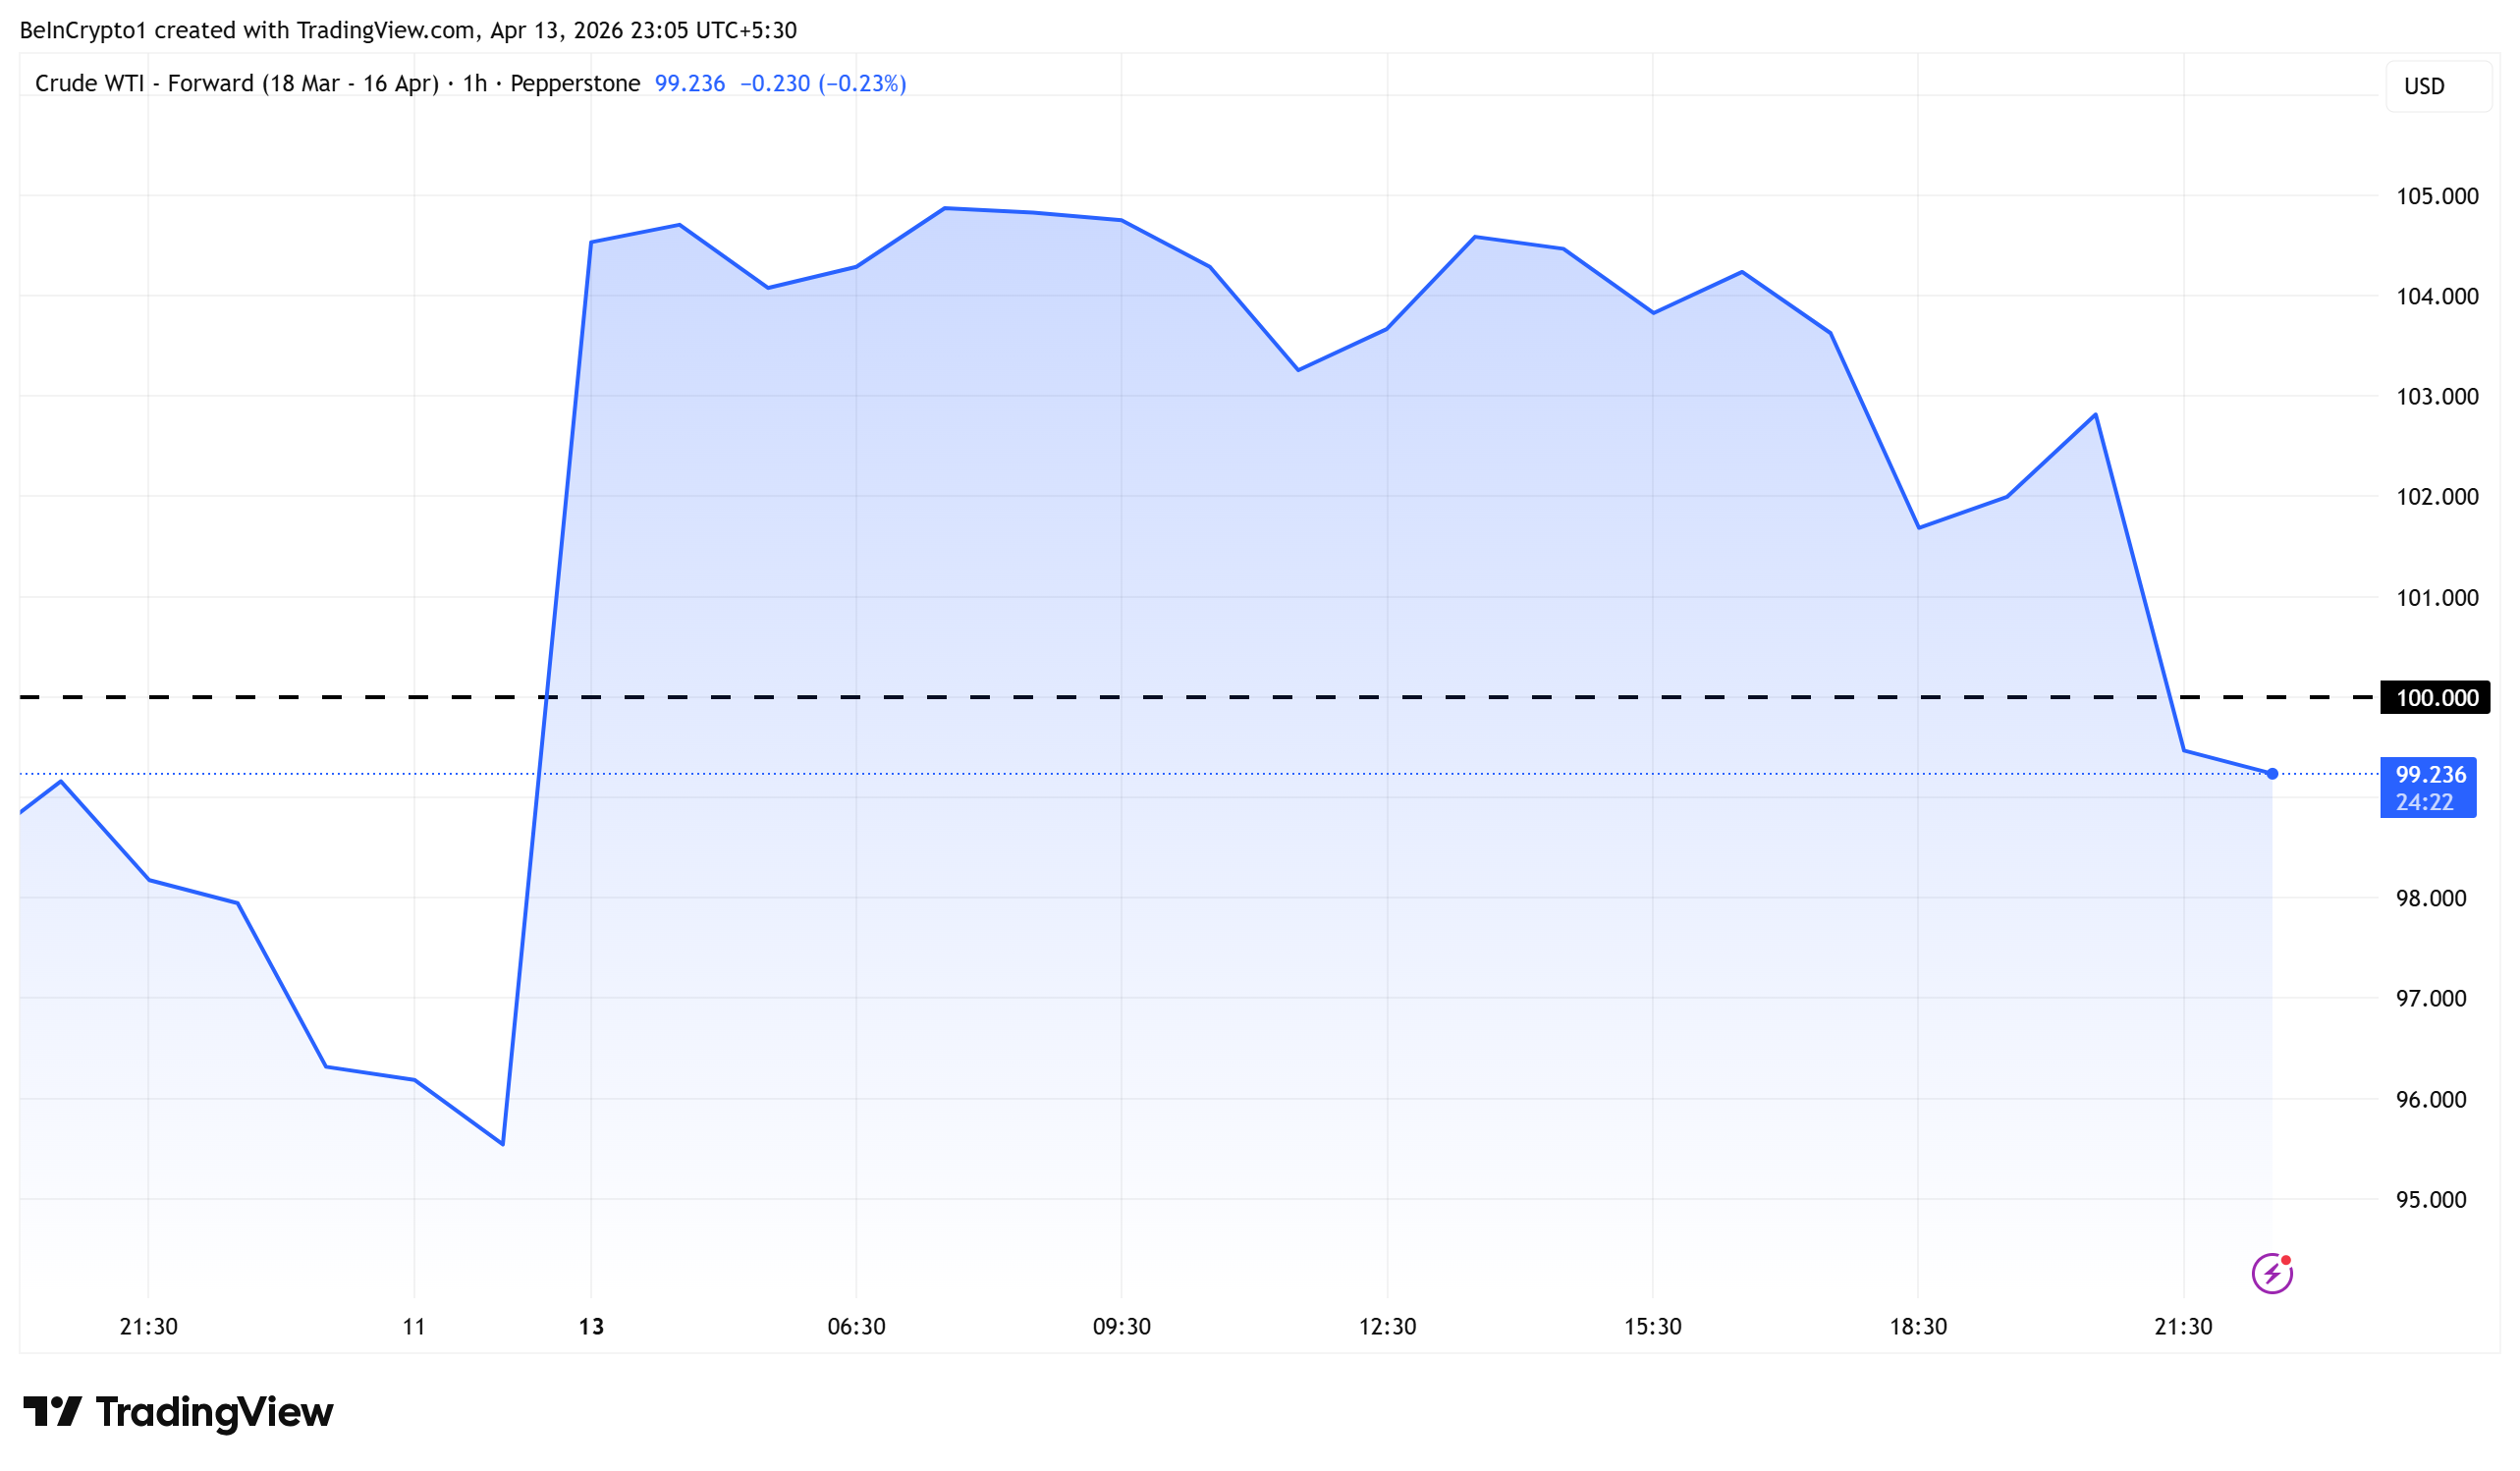
US oil prices fell back below $100 per barrel on Monday after a volatile session, reversing gains that pushed crude above $104 earlier in the day.
The sharp pullback came as China’s Defense Minister Admiral Dong Jun signaled that Chinese vessels would continue transiting the Strait of Hormuz under existing agreements with Iran.
China Challenges US Naval Blockade
Admiral Dong Jun delivered a pointed message to the Trump administration and the US Navy. He confirmed that Chinese ships are actively moving through the Strait of Hormuz and that Beijing will honor its trade and energy agreements with Tehran.
“Iran controls the Strait of Hormuz and it is open for us,” the Hormuz Letter reported, citing Admiral Dong Jun.
The statement reframes the standoff. What began as a bilateral US-Iran confrontation now involves a direct challenge from the world’s second-largest economy.
Analysts noted the repricing in oil markets reflects traders reassessing the blockade’s effectiveness now that China has entered the frame.
Notably, the US blockade of Iran affects China’s interests, as China is Iran’s largest oil export destination.
Trump Sets New April 27 Deadline
Speaking from the Oval Office, President Trump issued a fresh two-week ultimatum to Iran. He warned the situation “won’t be pleasant” if Tehran fails to reach a deal by April 27.
The deadline follows the collapse of US-Iran talks in Islamabad on April 12, which prompted Washington to declare a full naval blockade of the strait.
Brent crude had jumped more than 8% to above $103 following that announcement before reversing.
Markets now face a new variable. China’s willingness to test the blockade could determine whether oil stabilizes or enters another leg higher as the April 27 deadline approaches.
However, reports suggest that a tanker bound for China forced to turn back under the U.S. blockade.
“I believe the US intends to use this opportunity to pressure China to help urge Iran to reach an agreement, although this action is not specifically targeted at China,” one user commented.
The post Oil Price Slides Below $100 as China Defies US Hormuz Blockade appeared first on BeInCrypto.


The White House’s main crypto adviser, Patrick Witt, said that work is still being done to lock in the compromise that he thinks will move the Digital Asset Market Clarity Act forward in the U.S. Senate, though he said several other points are also being worked out behind the scenes.
In an interview on CoinDesk TV Monday, the executive director of the President’s Council of Advisors for Digital Assets suggested Monday that the common ground that key senators from both parties said they’d secured on stablecoin yield seems to be intact.”We’re hopeful that the compromise that has been reached will be durable and will hold,” Witt said. “Solving that was a must-have before we could get onto the other outstanding issues,” which he said he’s now pivoted to, though some of the issues have already been resolved.
Apart from the question of yield on stablecoins, over which bankers had successfully convinced some in the Senate that their deposit base could be in peril, the Clarity Act had a number of other potential hangups. Among those have been the illicit financial protections in the decentralized finance (DeFi) space, and a request from Democrats that senior government officials (most pointedly, President Donald Trump) be barred from profiting off of the crypto sector.
Though Witt wouldn’t identify the topics that have been settled in the ongoing talks, he said that the negotiations “made considerable progress in the background” while the yield argument between banks and crypto firms got most of the attention.
“We’re very close to closing them out,” he said. “All of these issues felt intractable and unsolvable at one point in time. So the fact that we’ve been able to close out a lot of them gives me confidence that we can close out these other ones, too.”
The Clarity Act would need a markup hearing in the Senate Banking Committee before it can be advanced toward a final Senate vote. It had been close to such a hearing at the beginning of the year, but the bank lobbyists raised objections to stablecoin yield that delayed the process.
Last week, White House economists issued a report that downplayed the threats the banking sector contended are posed by giving stablecoin holders a return that resembles interest from a bank account. On Monday, the American Bankers Association answered back, saying the White House argument was flawed. Witt said the view of bankers is wide-ranging, depending on how close they are to the technology.
“They’re grappling with it,” he said. “These are all important issues to their members.
And, you know, some of them are going to view stablecoins more positively. Some are going to be a little bit more threatened by them.”
Read More: Trump’s crypto adviser rejects Jamie Dimon on treating yield-bearing stablecoins like banks
Crypto World
Bitcoin Price Prediction: BTC Needs All Year for $120,000 but $750 in This Presale Could Return $225,000 From One Listing
The bitcoin price prediction just hit a turning point. BTC posted back to back quarterly losses for the first time since 2022, dropping 23% from its January price of $87,500, but April has closed green 9 out of 13 times since 2013 with a 69% win rate per 24/7 Wall St.
The pattern is clear: BTC falls hard then bounces harder. While that recovery builds over months from a $1.3 trillion cap, the wallets chasing the biggest return are not waiting on BTC.
They are filling Pepeto because a working exchange, a confirmed Binance listing, and $8.9 million in committed capital tell them the setup is already in place.
Bitcoin Price Prediction Shifts as April Win Rate Meets Quarterly Reset
BTC lost 23% in Q1 after falling from $87,500, and Q4 2025 also closed red, marking the first back to back quarterly losses since 2022 per 24/7 Wall St.
But April’s 69% win rate is one of BTC’s strongest months on record, and CME FedWatch shows 98% expect the Fed to hold at the April 28 meeting per 24/7 Wall St.
When BTC falls to levels that historically trigger rebounds and the Fed removes the threat of more rate hikes, the bitcoin price prediction shifts from fear to timing.
BTC at $71,140 and Pepeto at $8.9M: Where the Pattern Repeats
Pepeto: The Same Pattern That Made Every Early Crypto Fortune
What if you could go back and buy BTC at $100? Or catch BNB at $0.15? Or enter Pepe before $11 billion? Every one of those followed the same pattern: a real product, early fear, and a crowd that showed up late. Pepeto is following that exact pattern right now, except this time you are not late.
The exchange is already live. PepetoSwap handles every trade at zero cost so your gains stay whole, the bridge sends your assets between ETH, BNB, and Solana chains for free, and the scanner catches dangerous contracts before your money goes anywhere near them.
The mind behind the original Pepe, the meme token that hit $11 billion on nothing but hype and 420 trillion supply, built Pepeto with real tools and a Binance listing already confirmed. SolidProof audited every contract with results on chain for anyone to check. More than $8.9 million flowed in while the market sat in fear, and that is the tell. The people inside are not waiting and hoping. They already see where this goes. Staking pays 185% APY, growing your position every day before listing day arrives.
At $0.0000001862 per token, analysts project 100x to 300x once the Binance listing opens trading. Let those numbers sink in. $750 at 100x becomes $75,000. At 300x that same $750 becomes $225,000. How often does a setup like this land in front of you with a working exchange, a clean audit, and a confirmed listing all at less than a penny? The presale is filling fast and the listing will end this price for good.
Bitcoin Price Prediction: Levels, Targets, and What the Quarterly Reset Means
BTC trades near $71,140 with a $1.42 trillion cap, down 43% from its October 2025 all time high near $126,000 per CoinMarketCap.
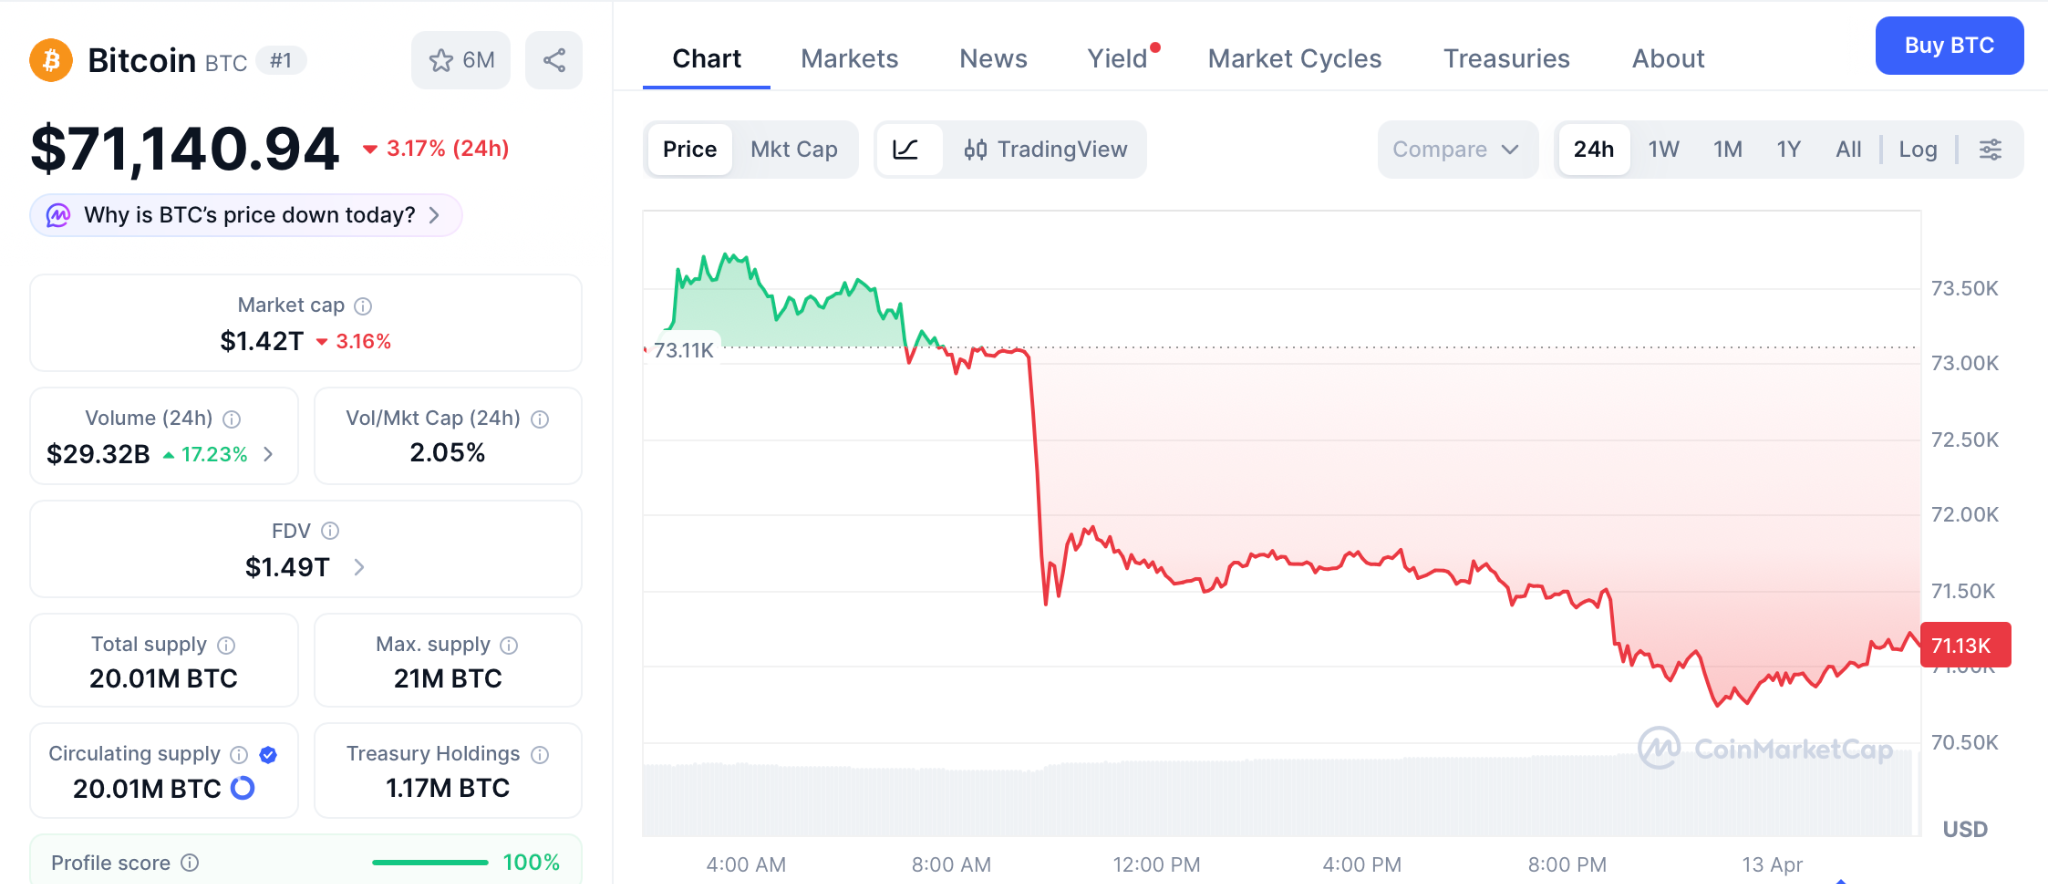
The $75,000 level is the key resistance, and a clean break with volume opens the path toward $85,000 by summer.
Standard Chartered targets $120,000 by year end, and the CLARITY Act markup in late April is the next catalyst. Even the bull case at $120,000 delivers 67% from current levels, strong for a $1.3 trillion asset but taking the rest of the year to play out.
Conclusion
BTC carries the store of value story and April’s 69% win rate says the bounce is likely coming. But here is what it comes down to. Do you want 67% over the rest of the year from a $1.3 trillion token? Or do you want to be the person who put $750 into a presale and watched it become $75,000 to $225,000 from one listing?
Every fortune built in crypto started with one moment where someone moved while everyone else was still reading about it. BTC at $100. BNB at $0.15. Pepe at zero. The same creator who built that last one is behind Pepeto, and the Binance listing is the event that turns this presale price into history. The wallets already inside are the ones who will tell this story next year. The only question left is whether your wallet is one of them.
Click To Visit Pepeto Website To Enter The Presale

FAQs
How do back to back quarterly losses change the bitcoin price prediction?
BTC’s first back to back quarterly losses since 2022 pushed prices lower, but April’s 69% win rate signals a bounce, while Pepeto at presale pricing delivers returns one listing can produce.
Can a presale outperform the bitcoin price prediction this cycle?
BTC at $71,140 targeting $120,000 delivers 67% over months, but $750 inside Pepeto at 100x becomes $75,000 from one Binance listing, making the presale at the Pepeto official website the faster path.
Disclaimer: This is a Press Release provided by a third party who is responsible for the content. Please conduct your own research before taking any action based on the content.

Scope of Interfaces to Be Covered
The Commission outlined covered user interfaces as websites, browser extensions, or applications associated with crypto wallets. These applications assist users to plan and start transactions on blockchain platforms or smart contracts. Also in the guidelines, there are platforms that provide routing information, pricing and cost estimates of transactions. Such interfaces provide support to users that make use of self-custodial wallets to conduct crypto asset securities trades. They might also contain aggregators and swap platforms that show execution paths. As a result, the SEC acknowledges their functions in operations but does not differentiate them from the traditional intermediaries.
The SEC, however, added that it will not object to some platforms functioning without registration of a broker-dealer in some circumstances. The platforms should enable users to customise the parameters of transactions and offer educational aids to make informed choices. In addition, they should not give instructions to the users on certain securities transactions. The Commission highlighted that platforms should be neutral when offering trading options. The interface providers can provide default execution facilities, but they are not able to rank or favor specific trades. Therefore, it requires compliance by ensuring that the user is in control and restricting access to the results of transactions.
Section 15 of the Exchange Act that regulates the registration of brokers is referred to as the guidance. Though certain interfaces might fit the definition of brokers, the SEC made it clear that there are situations in which the enforcement might not be applicable. Moreover, such a strategy is an indication of a loose reading of the law on securities. The research head of Galaxy Digital Alex Thorn claimed that the SEC is moving forward with market structure without legislation. He observed that the agency is developing rules that resemble the ones suggested in the CLARITY Act. Furthermore, he emphasised the fact that the guidance provided to the staff might change with time.
Also, the guidance can facilitate future exemption of innovation covered by the SEC leadership. This may go as far as tokenised securities trading via automated systems and decentralised applications. The agency therefore keeps on demarcating operational limits of new crypto services. The crypto regulation debate in the U.S. Senate is set to be reintroduced in the near future. The legislators can proceed with official reviews and amendments of the suggested bill. The schedule indicates that there will be ongoing liaison between regulatory and legislative action.

(VIDEO) Harlan Goode Delivers Show-Stopping Australian Idol Grand Finale
Senate Bill Faces Delay Over Stablecoin Yield Debate

The Best Modern MCU Show Leans R-Rated, Isn’t Trying To Sell Toys


-

 Politics3 days ago
US brings back mandatory military draft registration
-

 Fashion3 days ago
Weekend Open Thread: Veronica Beard
-
 Sports3 days ago
Man United discover Nico Schlotterbeck transfer fee as defender reaches Dortmund agreement
-

 Tech6 days ago
How Long Can You Drive With Expired Registration? What Florida Law Says
-

 Politics1 day ago
World Cup exit makes Italy enter crisis mode
-

 Crypto World4 days ago
Canary Capital Files SEC Registration for PEPE ETF
-

 Business3 days ago
Tesla Model Y Tops China Auto Sales in March 2026 With 39,827 Registrations, Beating Cheaper EVs and Gas Cars
-

 Crypto World5 days ago
Bitcoin recovers as US and Iran Agree a Ceasefire Deal
-

 Politics4 days ago
Malcolm In The Middle OG Turned Down ‘Buckets Of Money’ To Appear In Reboot
-

 Fashion6 days ago
Let’s Discuss: DEI in 2026
-
 NewsBeat21 hours ago
Pep Guardiola and Gary Neville agree over Arsenal title problem that benefits Man City
-

 Business3 days ago
OpenAI Halts Stargate UK Data Centre Project Over Energy Costs and Copyright Row
-

 Business2 days ago
Ireland Fuel Protests Enter Day 5 as Blockades Spark Shortages and Government Prepares Support Package
-

 Crypto World1 hour ago
The SEC Conditionalises DeFi Platforms to Be Avoided for Broker Registration
-

 Politics4 days ago
LBC Presenter Mocks Trump Over Iran War Failures
-

 Crypto World3 days ago
Federal judge blocks Arizona from bringing criminal charges against Kalshi
-

 Tech4 days ago
A version of Windows 10 released a decade ago is now eligible for additional security patches
-
 NewsBeat2 days ago
JD Vance announces ‘no agreement’ with Iran over nuclear weapons fear
-

 Business3 days ago
IMF retains floor for precautionary balances at SDR 20 billion
-
Business3 days ago
Coreweave CSO Venturo sells $5.5m in class a common stock
You must be logged in to post a comment Login