

Crypto World
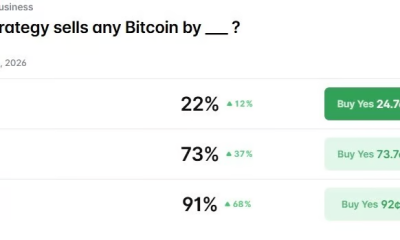
Polymarket upholds ‘No’ ruling in disputed Strategy Bitcoin sale market


Polymarket has finalized a disputed prediction market with a “No” outcome after 98.6% of voting power backed the decision in a final UMA review, despite Strategy disclosing that it sold 32 Bitcoin before the market’s May 31 deadline.
Summary
- Polymarket finalized the disputed Strategy Bitcoin sale market with a “No” outcome after 98.6% of UMA voting power backed the decision.
- Traders challenged the ruling because Strategy disclosed that it sold 32 Bitcoin between May 26 and May 31, before the contract deadline.
- The dispute has fueled debate over whether prediction markets should be resolved based on when an event occurred or when it was publicly confirmed.
According to Polymarket’s market data, the contract asking whether Strategy would sell any Bitcoin by May 31 completed its final review on Wednesday, ending a dispute that had already triggered two previous “No” resolutions and subsequent challenges.
At the center of the disagreement is Strategy’s June 1 regulatory filing, which revealed that the company sold 32 BTC for roughly $2.5 million between May 26 and May 31.
Traders who supported a “Yes” outcome argued that the sale itself occurred before the deadline stated in the market question. Others maintained that the transaction was not publicly confirmed until after the deadline had passed.
Days before the final review concluded, Polymarket added a note to the market page stating that “confirmation achieved outside of the market’s time frame does not qualify.” The clarification became a key point in the debate over how the contract should be resolved.
Traders challenge resolution standards
Across social media, several traders criticized the decision and questioned whether the outcome matched the original wording of the contract.
Among the most vocal participants was trader 0xDinosaur, who previously disclosed that he had purchased 49,695.76 “Yes” shares for about 35,000 USDC.
In a public statement issued before the final ruling, he argued that the contract referred to whether Strategy sold Bitcoin by May 31 and did not explicitly require the sale to be publicly disclosed before that date.
“My position was aggressive, and maybe I was greedy,” 0xDinosaur wrote on X. “But risk-taking does not change the facts, and it does not allow a platform to apply an unclear or unwritten rule after real money has already been placed.”
Earlier reporting on the dispute noted that Strategy’s filing showed the company sold 32 Bitcoin during the final week of May, while still holding 843,706 BTC as of May 31. The filing stated that proceeds from the sale were expected to support preferred stock distributions.
Elsewhere on X, trader willo2 argued that UMA voters were obligated to follow Polymarket’s published rules rather than their personal interpretation of the outcome.
“Even if UMA voters think that this outcome is ridiculous… they are forced to ratify it,” willo2 wrote. “This is because UMA is forced to respect the rules as written by Polymarket. Polymarket changed the rules, and now the outcome is literally in the rules.”
The trader claimed to have lost $500,000 after placing large “Yes” positions on June 1, alleging that the market remained open for betting after information about the sale had emerged.
Debate expands beyond a single market
Beyond the financial losses reported by traders, the dispute has drawn attention to how prediction markets handle events that occur before a deadline but become public afterward.
Galaxy Research said the controversy was less about the outcome itself and more about which set of rules should govern the contract’s resolution.
“The core issue is whether the original rules (event-based) or the post-trade clarification (confirmation-based) governs,” Galaxy Research wrote on X. “Traders correctly predicted the future. The platform is about to tell them they were wrong anyway.”
It argued that prediction markets should prioritize the occurrence of an event rather than reinterpretations introduced after trading has taken place.
“Prediction markets should price what happens, not how the oracle will reinterpret rules after the fact,” the firm said, adding that clearer listing criteria, deterministic resolution methods for verifiable events, and structural changes ahead of potential regulatory oversight could help prevent similar disputes.


Production of NVIDIA processors is concentrated in Taiwan via TSMC, making the company sensitive to US trade policy. In the first quarter of fiscal 2026, NVIDIA recorded a $4.5bn write-down due to restrictions on H20 chip exports to China. At the same time, the revenue structure remains resilient — around 69% of revenue comes from the US domestic market, where hyperscalers continue to increase purchases of accelerators for data centres.
In the fourth quarter of fiscal 2026, revenue reached $68.1bn, representing a 73% year-on-year increase, while full-year revenue totalled $215.9bn (+65%). In late March, the company announced an expansion of its strategic partnership with Marvell Technology, including a $2bn investment and integration via the NVLink Fusion ecosystem, further extending its presence in the Physical AI and robotics segment. However, the overall macroeconomic backdrop remains subdued.
Technical picture
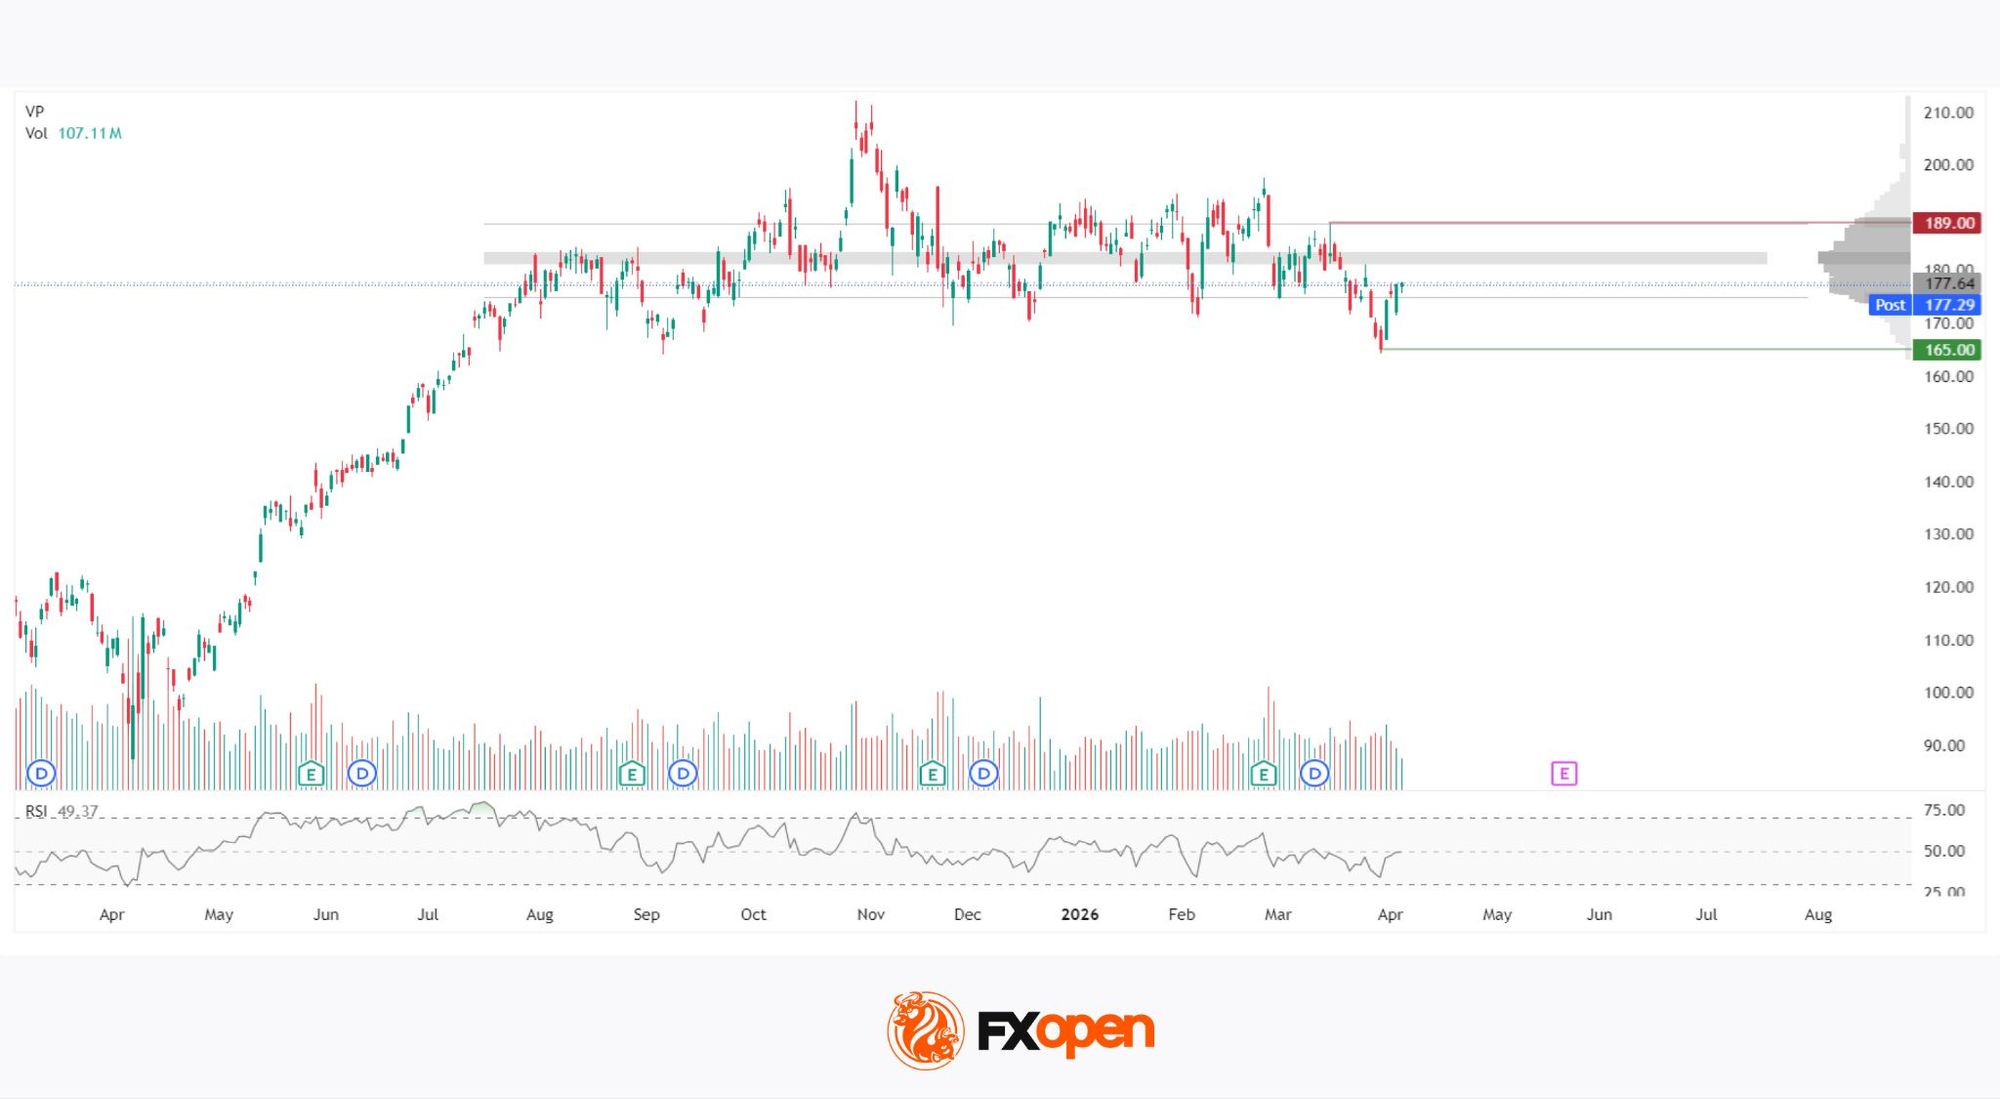
After reaching an all-time high near 210 in November 2025, the stock entered a corrective phase. The low of this correction was marked at 165 on 30 March 2026. A rebound followed from this level; however, the price remains around 177, without showing a convincing recovery. The horizontal volume profile provides further clarity.
The highest concentration of trading activity over the period under review is located in the 181–183 zone, where the point of control (POC) is situated. This area reflects the most active trading over several months, making it a key reference zone for market participants. Above current levels, the volume profile remains dense up to 189, which coincides with the local highs from the second half of 2025 and acts as the nearest resistance level.
The RSI stands at 49.37 and remains in neutral territory, offering no clear directional advantage. The latest session’s volume reached 107.11 million shares, indicating sustained market participation. However, it should be noted that the most pronounced spikes in volume and volatility have historically occurred ahead of and following quarterly earnings releases. As a result, the stock may continue to consolidate within the current range until new fundamental catalysts emerge.
Key takeaways
NVIDIA remains in a prolonged consolidation phase, supported by strong operational performance but a muted macroeconomic backdrop. The volume profile shows a significant supply overhang above current price levels, while the RSI does not favour either side. Market participants continue to assess incoming signals without committing to a sustained directional bias.
Buy and sell stocks of the world’s biggest publicly-listed companies with CFDs on FXOpen’s trading platform. Open your FXOpen account now or learn more about trading share CFDs with FXOpen.
This article represents the opinion of the Companies operating under the FXOpen brand only. It is not to be construed as an offer, solicitation, or recommendation with respect to products and services provided by the Companies operating under the FXOpen brand, nor is it to be considered financial advice.


- Bitcoin ETF outflows remain negative for 11 straight days, pressuring BTC.
- $749 million in liquidations have accelerated the Bitcoin price drop.
- RSI below 18 shows oversold conditions, but trend stays bearish.
Bitcoin (BTC) has been under sustained pressure, trading around the $63,548 level after a sharp multi-week decline that has erased a large portion of its recent recovery.
Notably, the BTC price decline reflects a combination of institutional selling, forced liquidations, and weakening market structure that continues to dominate short-term price action.
Even though technical indicators now show deeply oversold conditions, the broader flow of capital suggests that downside risk remains active.
The current setup places Bitcoin in a zone where short-term relief rallies are possible, but sustained recovery has yet to form.
Bitcoin ETF outflows weigh heavily on the BTC price
One of the most consistent pressures on Bitcoin has been the ongoing withdrawal of capital from US spot Bitcoin exchange-traded funds.
Data shows a stretch of 11 consecutive days of net outflows, including a single-day redemption of roughly $519 million on June 2.
Over the past ten days from May 25, 2026 to June 3, 2026, Bitcoin ETFs have witnessed over 3 billion worth of outflows according to CoinGlass data.
This pattern has effectively removed a major source of steady institutional demand.
According to Citi analysts, ETF flows account for about 45% of weekly return variation, highlighting how strongly prices now respond to institutional positioning.
With flows turning negative for nearly two weeks, Bitcoin has been left without its primary demand driver at a time when selling pressure is already elevated.
This shift is important because ETFs were previously absorbing large amounts of Bitcoin supply during the recovery phase.
The current reversal means that instead of acting as a stabilizing force, ETFs are now contributing to downside momentum.
Without a clear return of net inflows, price stability above the mid-$60,000 range has remained difficult to sustain.
Liquidations and macro pressure amplify the decline
Alongside ETF outflows, leveraged positions in the derivatives market have added fuel to the downturn.
More than $749.982 million in leveraged long positions have been liquidated within a 24-hour window during the sell-off, according to market data.

These forced closures have accelerated price movement lower rather than allowing gradual adjustment.
Bitcoin’s drop below key technical zones has triggered additional selling, reinforcing a cascading effect where falling prices lead to further liquidation pressure.
At the same time, macroeconomic conditions have reduced the overall appetite for risk assets.
Strong US employment data has pushed expectations for Federal Reserve rate cuts further into the future, reinforcing a “higher-for-longer” interest rate environment.
This has reduced liquidity flowing into speculative markets, including crypto.
In addition, geopolitical tensions, particularly renewed instability involving Iran and broader global risk concerns, have also contributed to defensive positioning across financial markets.
In this environment, Bitcoin has continued to trade in line with high-risk assets rather than acting independently.
Technical structure shows oversold conditions but no confirmed reversal
From a technical perspective, Bitcoin is showing some of the most extreme oversold readings in recent months.
The 14-day Relative Strength Index has dropped to around 17.7–18, a level that typically reflects heavy selling exhaustion.
Historically, readings this low have often preceded short-term relief rallies.
However, other technical indicators present a more cautious picture.
Bitcoin is currently trading below all major exponential moving averages, including the 10-day, 20-day, 50-day, 100-day, and 200-day EMAs. This alignment signals a strong bearish trend across multiple timeframes.

Looking at the short-term Bitcoin price projections, the immediate support zone sits near $62,964, while a broader structural floor is located around the $60,000 region, which also aligns with long-term trend indicators.
A breakdown below $62,964 would increase the likelihood of a move toward lower liquidity zones near $60,000 and potentially $55,000.
On the upside, Bitcoin would need to close above $69,124 to shift short-term momentum. If that level is reclaimed, the next resistance zone is positioned near $71,589, which would signal early signs of structural recovery.
But until then, the trend remains heavily influenced by downside momentum rather than reversal signals.
Ethereum price has slid about 10% over the past week as on-chain demand collapsed and liquidations spiked.
The chain is clear. Spot ETFs have bled for 17 straight sessions, the most loyal holders pulled back hard, and stretched funding then set off forced selling.
Ethereum Spot ETF Outflows Set the Stage
The selling started with the institutions. Ethereum spot ETF demand has vanished, with the funds now bleeding for 17 straight sessions.
Want more token insights like this? Sign up for Editor Harsh Notariya’s Daily Crypto Newsletter here.
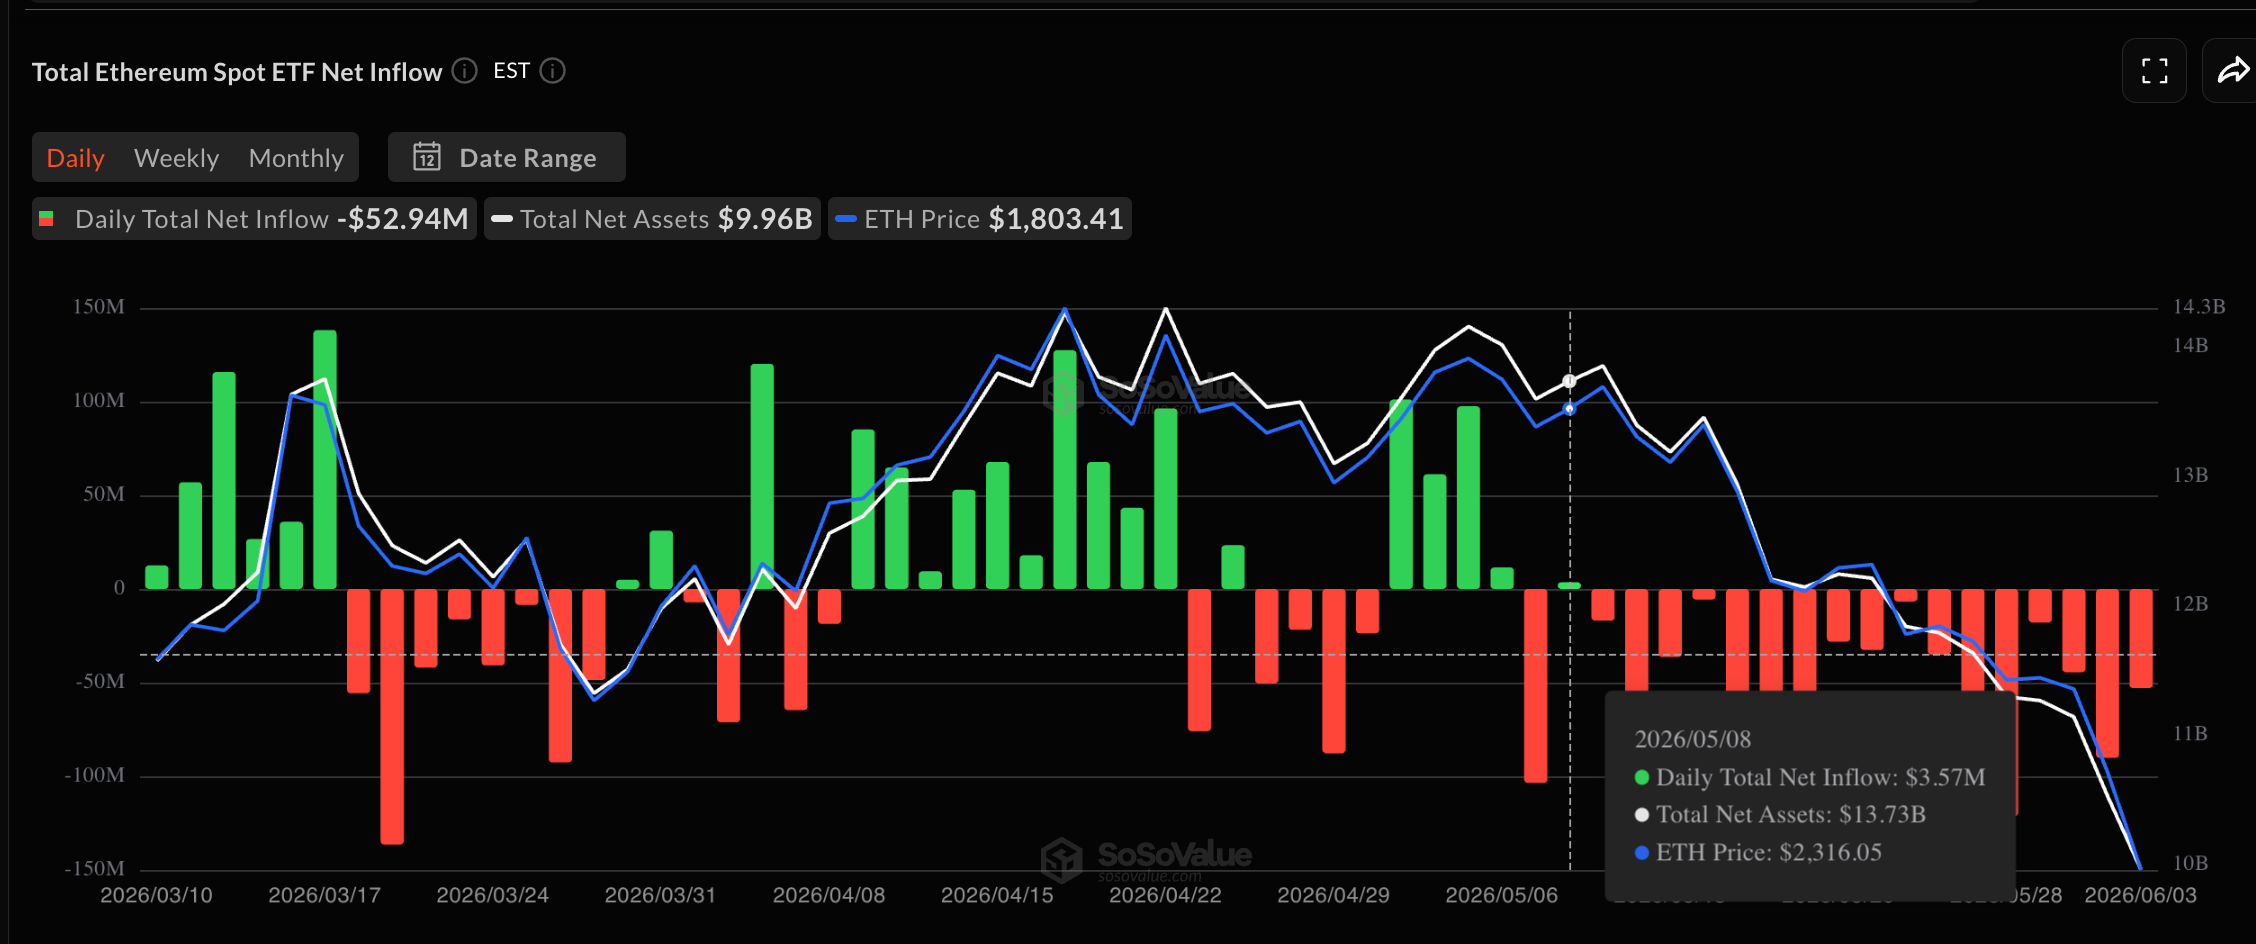
The last day of net inflows was May 8. Every trading day since has been an outflow, and the latest reading showed about $52.94 million leaving the funds.

That run has cut total ETF net assets to roughly $9.96 billion. A streak this long is the clearest sign yet of institutional apathy toward ETH. When the steadiest buyers disappear for weeks, other holders take notice. The most loyal on-chain cohort cracked next.
Long-Term Holders Slash Their Buying
The most patient holders followed the institutions out. Glassnode’s hodler net position change tracks the monthly change in supply held by coins older than 155 days. It had been climbing into June.
It peaked at 339,222 ETH on June 1, the start of the new month. By June 3, it had collapsed to 68,470 ETH as they possibly felt that the ETF demand was returning.
That is a drop of about 80% in two days. Even the most loyal holders sharply slowed their buying, pulling a key source of demand out of the market.

With both institutions and hodlers stepping back, the door opened for leverage to do damage.
Funding Rates Spike and Liquidations Pile Up
Thin spot demand left the market leaning on leverage. CryptoQuant flagged that Ethereum funding rates on Binance hit their highest level since early 2026.
Funding rate is the periodic payment between traders holding long and short perpetual futures. A high positive rate means longs are crowded and paying to keep their bets open. CryptoQuant warned the setup raised the risk of long liquidations as Bitcoin slid. That risk played out fast.
Over the past 24 hours, about $368.63 million in Ethereum long positions were liquidated, or force closed. That was part of a $1.61 billion wipeout across crypto.

With demand gone and forced selling underway, the price chart shows where the damage landed.
Ethereum Price Levels to Watch After the Breakdown
The Ethereum price chart explains the cascade. Ethereum price broke down on June 2, slicing below the neckline of an inverted cup and handle.
An inverted cup and handle is a bearish reversal pattern, a rounded top followed by a small handle. It projects a downside target once the neckline breaks. The measured drop is about 21%.
That bearish target sits near $1,550. ETH now trades near $1,795 after the breakdown, with a long lower wick showing some buyers returned.

The setup stays bearish on the breakdown path. A fall of about 5% under $1,714 would open the way toward $1,550.
To turn the tide, ETH must reclaim $1,893 and then $2,004. A move back above $2,004 would erase most of the recent losses.
Still, sell volume remains steady, so the weakness likely holds until buyers reclaim $1,893. For now, $1,714 separates a slide toward $1,550 from a recovery attempt back toward the $2,000 zone.
The post Ethereum Buying Falls 80% as ETF Outflows Hit a 17-Session Streak appeared first on BeInCrypto.
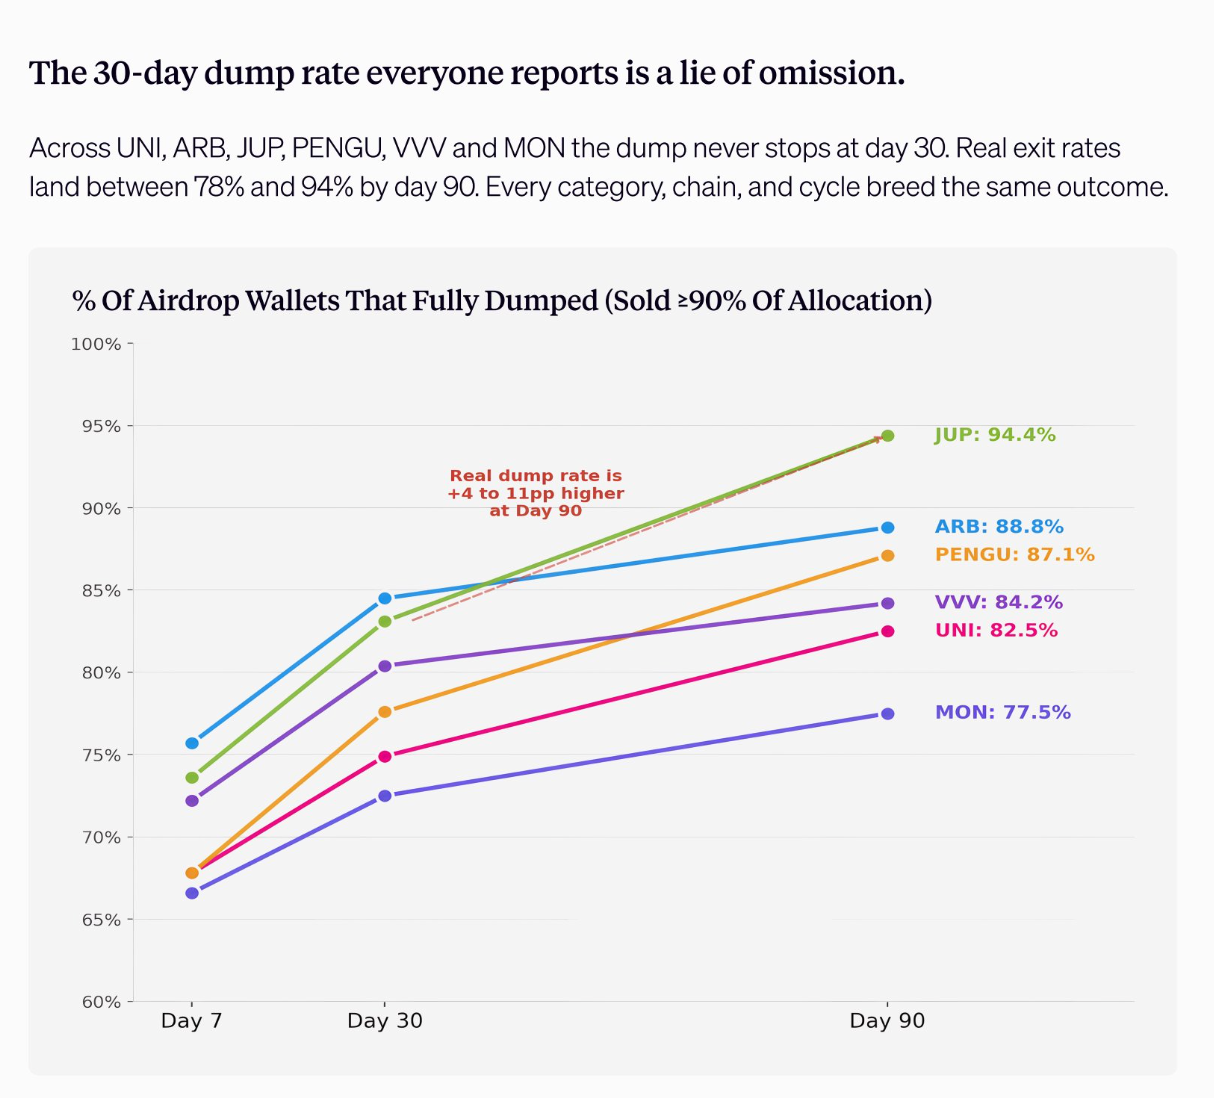
Delphi Digital says the airdrops are over, after finding that 78% to 94% of recipient wallets across six major tokens sold most of their allocation within 90 days.
The research firm tracked 3.7 million wallets over five years, arguing that free token giveaways now produce sellers rather than committed holders.
Are Airdrops Dead? Delphi Says Up to 94% of Wallets Dump Within 90 Days
Airdrops became a standard way for projects to seed communities and reward early users. However, the model has faced scrutiny lately.
Delphi studied Uniswap (UNI), Arbitrum (ARB), Jupiter (JUP), and Pudgy Penguins (PENGU), among other tokens spread across four chains. Exit rates rose over time rather than settling down.
Follow us on X to get the latest news as it happens

Delphi found real dump rates ran 4 to 11 percentage points higher at day 90 than at day 30. The widely cited 30-day figure, therefore, understates the number of recipients who leave.
The firm made four core arguments for why it could get worse for airdrops. First, the cost of running fake “sybil” wallets is collapsing toward zero as automated tools make farming cheap and detection unreliable.
Second, the next wave of issuers, including tokenized treasuries and regulated DeFi, won’t send tokens to anonymous wallets. Third, the acquisition math fails, with Arbitrum paying an estimated $1.16 billion to users who left within a month.
Finally, the firm also said that outlier wins prove little. Hyperliquid (HYPE) absorbed sales through buybacks, funded by more than $1 billion in revenue. Jito (JTO) avoided farming because its eligible group stayed small.
“Token economics are starting to require real protocol performance. MegaETH locked 53% of its supply behind performance targets. Pendle routes roughly 80% of revenue into buybacks for stakers. Token distribution is moving from handouts to performance,” Delphi added.
Independent tracking had already pointed the same way. A trader previously logged 30 airdrops received since December 2024, finding only one still trading above its launch price at the time. Several had collapsed almost entirely, reinforcing the pattern.
Subscribe to our YouTube channel to watch leaders and journalists provide expert insights
The post Delphi Says Airdrops Are Over as 94% of Wallets Dump Within 90 Days appeared first on BeInCrypto.

Key Takeaways
- Uber has allocated approximately $500 million to self-driving technology firm Nuro via a combination of upfront capital and performance-based payments.
- This arrangement forms part of a trilateral partnership involving Nuro and Lucid to launch 35,000 autonomous taxis across Uber’s platform.
- These vehicles will utilize Lucid Gravity SUVs equipped with Nuro’s autonomous driving technology.
- Nuro has successfully achieved its initial benchmarks, triggering the release of the first installment of performance-tied financing.
- Future disbursements depend on driverless trials scheduled for later this year, completely autonomous passenger services by year’s end, and expanded deployment in 2027.
On June 4, Reuters disclosed that Uber Technologies (UBER) has pledged approximately $500 million to self-driving vehicle developer Nuro, according to confidential sources. UBER stock registered a 0.10% gain following the announcement.
This financial commitment exceeds Uber’s original contribution and combines equity investment with performance-contingent funding mechanisms. The move expands upon Uber’s involvement in Nuro’s $203 million financing round, which assigned the startup a $6 billion valuation.
Nuro’s investor roster includes Nvidia and SoftBank, providing substantial financial backing as the company accelerates its self-driving technology initiatives.
The central objective involves deploying 35,000 autonomous taxis built on Lucid Gravity SUVs, alongside upcoming midsize vehicle variants. These automobiles will incorporate Nuro’s autonomous driving platform and function within Uber’s ride-sharing ecosystem.
Uber previously announced a $500 million investment in Lucid, positioning itself as a significant financial participant throughout various segments of the value chain — spanning vehicle manufacturing, software development, and service delivery.
Performance Benchmarks Trigger Initial Funding
The performance-based component of this agreement follows a structured framework built around specific development and operational objectives. Reuters’ sources indicate that Nuro has already met the first series of these predetermined targets.
This achievement has triggered the distribution of the initial performance-contingent capital allocation to Nuro. Subsequent payments hinge on conducting driverless trials later this year, launching completely autonomous passenger services before December, and implementing widespread service availability in 2027.
Nuro is presently conducting trials with safety operators in California’s San Francisco Bay Area in preparation for a public launch scheduled for later this year.
This past April, Nuro obtained California regulatory approval to test autonomous Lucid Gravity vehicles without safety operators across designated counties. The following month in May, the company secured permission to transport passengers during supervised trial operations.
Nuro Transitions From Package Delivery to Passenger Transport
Nuro initially developed compact autonomous delivery vehicles before strategically shifting in 2024 toward licensing its self-driving software to automotive manufacturers and transportation service providers. The Uber partnership represents a cornerstone of this strategic realignment.
This robotaxi deployment would constitute a significant milestone in that transformation, repositioning Nuro from a specialized delivery solution provider to a competitive force in the passenger transportation sector.
Meanwhile, Uber maintains a diversified strategy across multiple autonomous vehicle collaborations. The company has established self-driving partnerships with Baidu, Rivian, and Wayve, while also facilitating Waymo services in specific American markets.
UBER’s present price-to-earnings ratio stands at 17.88, accompanied by a GF Score of 83 out of 100. Recent insider transactions over the previous three months reveal $2.2 million in stock disposals, including a single sale of 30,000 shares.
Nuro’s latest California regulatory clearance, issued in May, permitted passenger transport during supervised testing phases — an essential prerequisite before launching any completely driverless commercial operations.


Key Highlights
- Google’s parent company completed an $84.75 billion equity financing round — marking the biggest AI-linked capital raise in market history
- The final amount exceeded the originally announced $80 billion target and features a $10 billion private transaction with Berkshire Hathaway
- Major Wall Street firms Goldman Sachs, JPMorgan, and Morgan Stanley served as joint book-running managers
- Anthony Gutman, Goldman Sachs International co-CEO, described the transaction as entering “unprecedented territory” in capital markets
- Shares of GOOGL finished Wednesday’s session down 0.76% at $358.68 as market participants assessed potential shareholder dilution
Shares of Alphabet (GOOGL) ended Wednesday’s trading session at $358.68, declining 0.76% following the tech giant’s decision to expand its equity fundraising to $84.75 billion — a significant increase from the $80 billion initially disclosed earlier this week.
This fundraising represents one of the most substantial equity capital events ever executed in connection with artificial intelligence expansion. In an exclusive conversation with CNBC, Anthony Gutman, co-CEO of Goldman Sachs International, characterized the transaction as pushing capital markets into uncharted waters.
“Let’s start by saying this is unprecedented territory, so we all enter it with a degree of humility and caution,” Gutman said in an exclusive interview Wednesday on CNBC’s Europe Early Edition.
The stock experienced downward pressure as market participants digested the implications of shareholder dilution. By expanding the total share count, existing stockholders face potential value compression unless the company delivers returns that justify the increased capital base.
The company stated the proceeds will be deployed toward AI computational infrastructure to address what it characterized as “unprecedented customer demand.” Its Gemini application has attracted nearly 900 million monthly active users.
Within the broader offering, Berkshire Hathaway committed $10 billion through a private placement arrangement. Under the leadership of Greg Abel, who succeeded Warren Buffett, Berkshire is providing anchor investor support for the transaction.
The trio of Goldman Sachs, JPMorgan Chase, and Morgan Stanley are managing the underwritten component as joint book-runners. Goldman additionally serves as the placement agent for the private portion.
Investor Sentiment and Market Reception
According to Gutman, demand from institutional investors for substantial equity issuances continues at elevated levels. When evaluated as a proportion of overall equity market capitalization, the offering appears “very manageable,” he noted.
“The Alphabet issuance yesterday augurs well for the pipeline. That was just a record level of issuance on any level,” he added.
Broader market indices displayed mixed performance on Wednesday. The S&P 500 retreated 0.74% to finish at 7,553.68. The technology-heavy Nasdaq declined 0.89%, closing at 26,854.
Among technology sector competitors, Meta posted gains of 4.24%, ending at $622.98. Microsoft experienced a 3.17% decline to close at $427.34.
The Broader Capital Markets Environment
Alphabet’s capital raise arrives as 2026 positions itself to become a banner year for capital markets transactions.
SpaceX has scheduled its initial public offering for June 12, pursuing a $1.75 trillion valuation on the Nasdaq exchange — which would establish it as the largest IPO in financial market history.
Artificial intelligence companies OpenAI and Anthropic have similarly revealed intentions to pursue public listings before year-end.
Gutman referred to these as “exceptional companies” and expressed confidence in their ability to successfully raise capital provided they execute the process correctly.
Since its 2004 market debut, Alphabet’s stock has appreciated 14,202%. The company currently commands a market capitalization of $4.3 trillion.
Wednesday’s trading activity for GOOGL occurred within a range of $358.10 to $366.39, with approximately 2 million shares changing hands — substantially below the 28.9 million share average daily trading volume.
Investors will be closely monitoring the company’s forthcoming quarterly earnings release and capital spending projections to evaluate whether returns from AI infrastructure investments will validate the massive capital deployment.

Bitcoin’s (BTC) brief plunge toward the $60,000 area triggered more than $600 million in long liquidations, raising doubts over whether the latest rebound marks a real bottom or only a relief bounce after a leverage flush.
BTC price may rebound toward $70,000 next
BTC fell to roughly $61,300 on Thursday before recovering 5.52% to around $64,690, with the rebound coinciding with reports that Israel and Lebanon had agreed to implement a ceasefire.
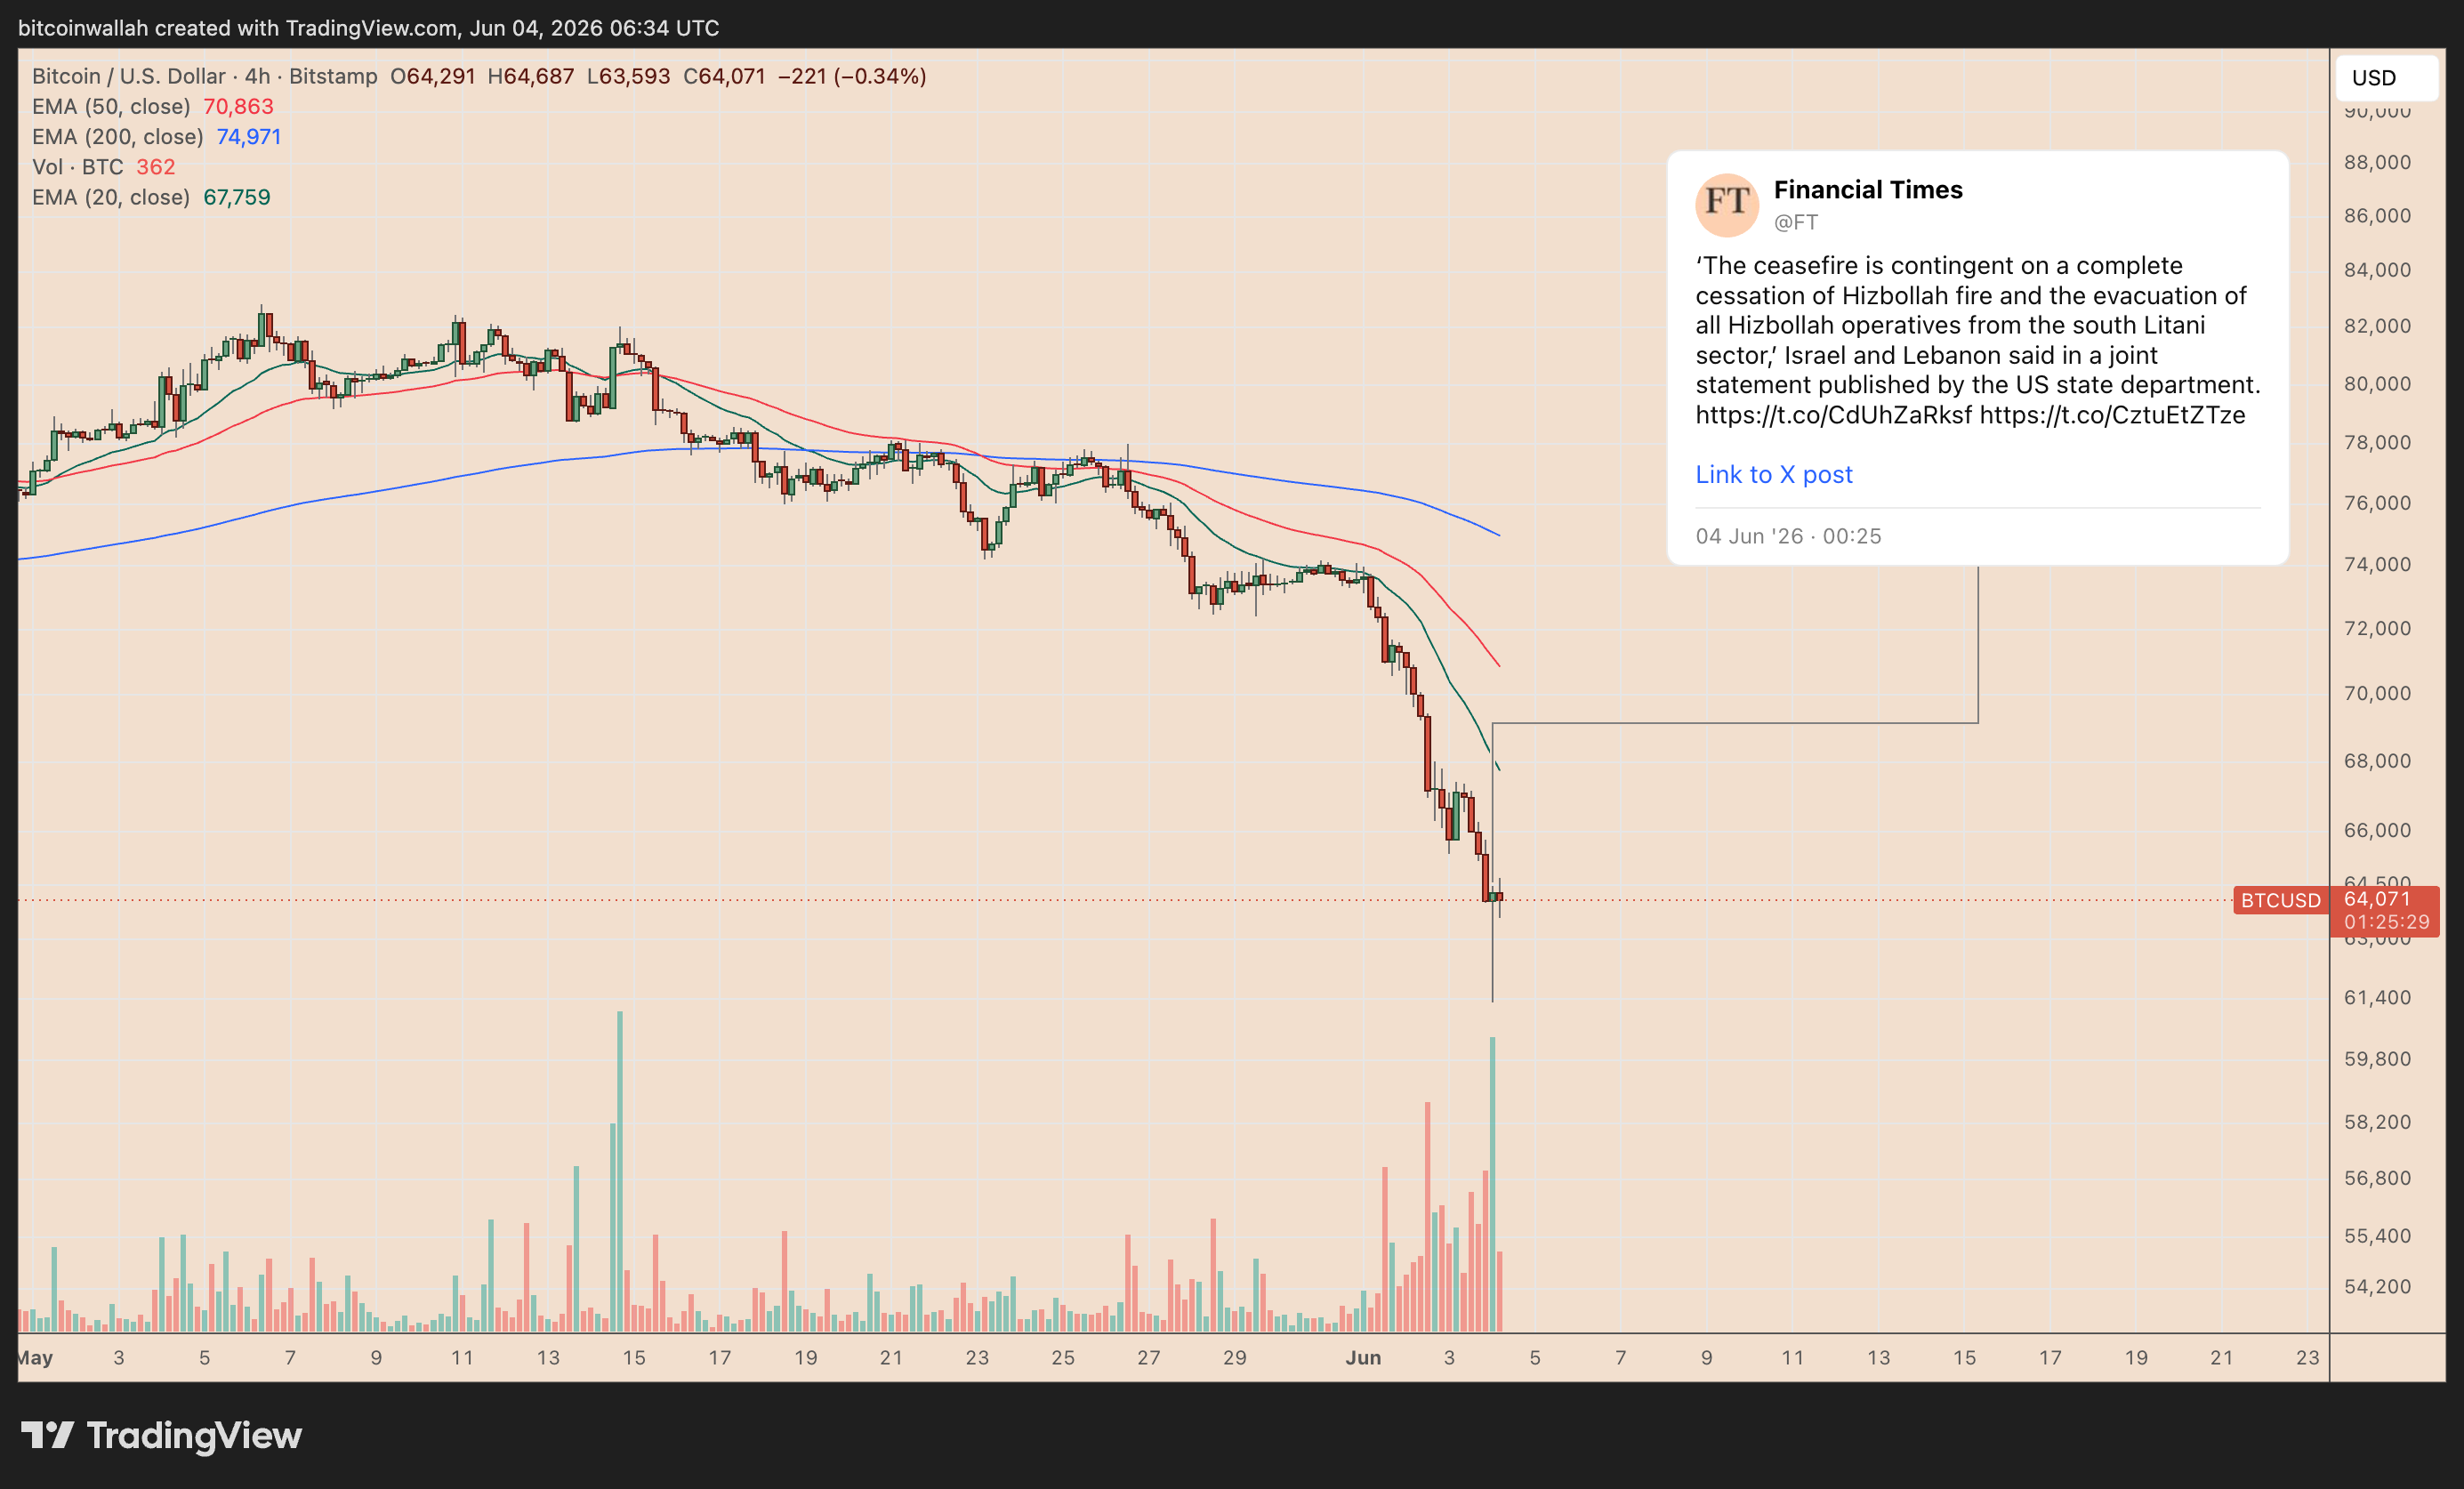
BTC/USD four-hour chart. Source: TradingView
The volatile move liquidated over $737 million in BTC positions on a 24-hour rolling basis, with long traders taking most of the hit, according to data resource CoinGlass.
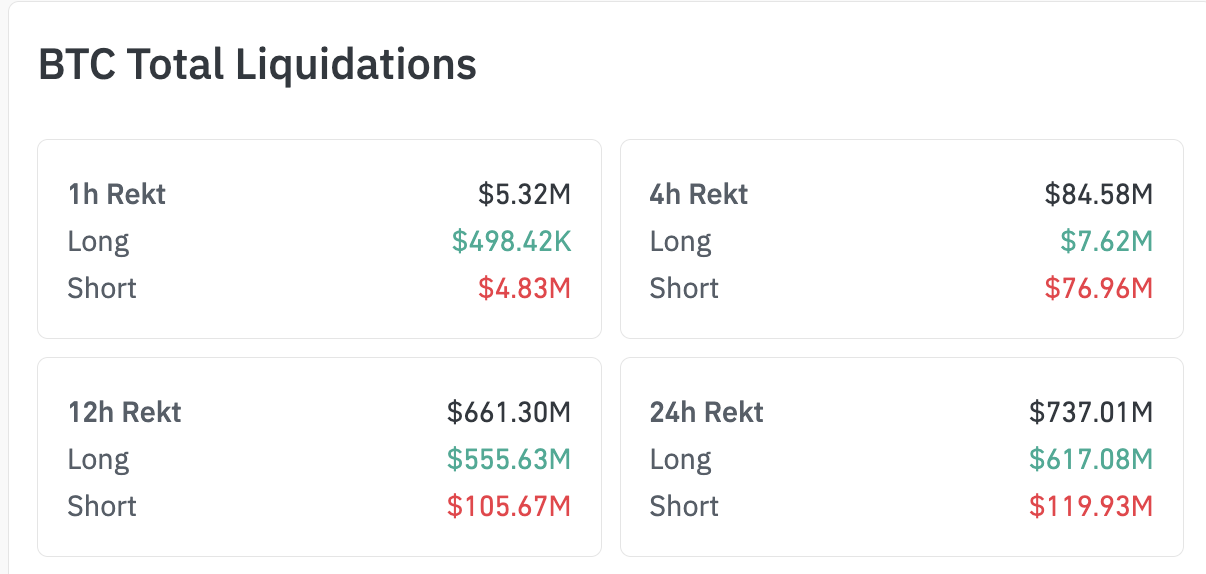
BTC total liquidations. Source: CoinGlass
Over $617 million in long positions were wiped out, showing how aggressively bullish traders were positioned before the sell-off.
Still, Bitcoin’s sharp 5.52% rebound encouraged some traders to call for a bottom.
Trader RidaaXBT said BTC could stage a relief bounce toward the $69,000–$70,000 range, implying that the liquidation-driven selloff may have exhausted near-term sellers.
Related: Analyst says Bitcoin’s $60K bottom signals weaken bear-market forecast
Analyst ZordXBT shared a similar view, pointing to Bitcoin’s long downside wick as a sign that buyers stepped in aggressively near the lows.
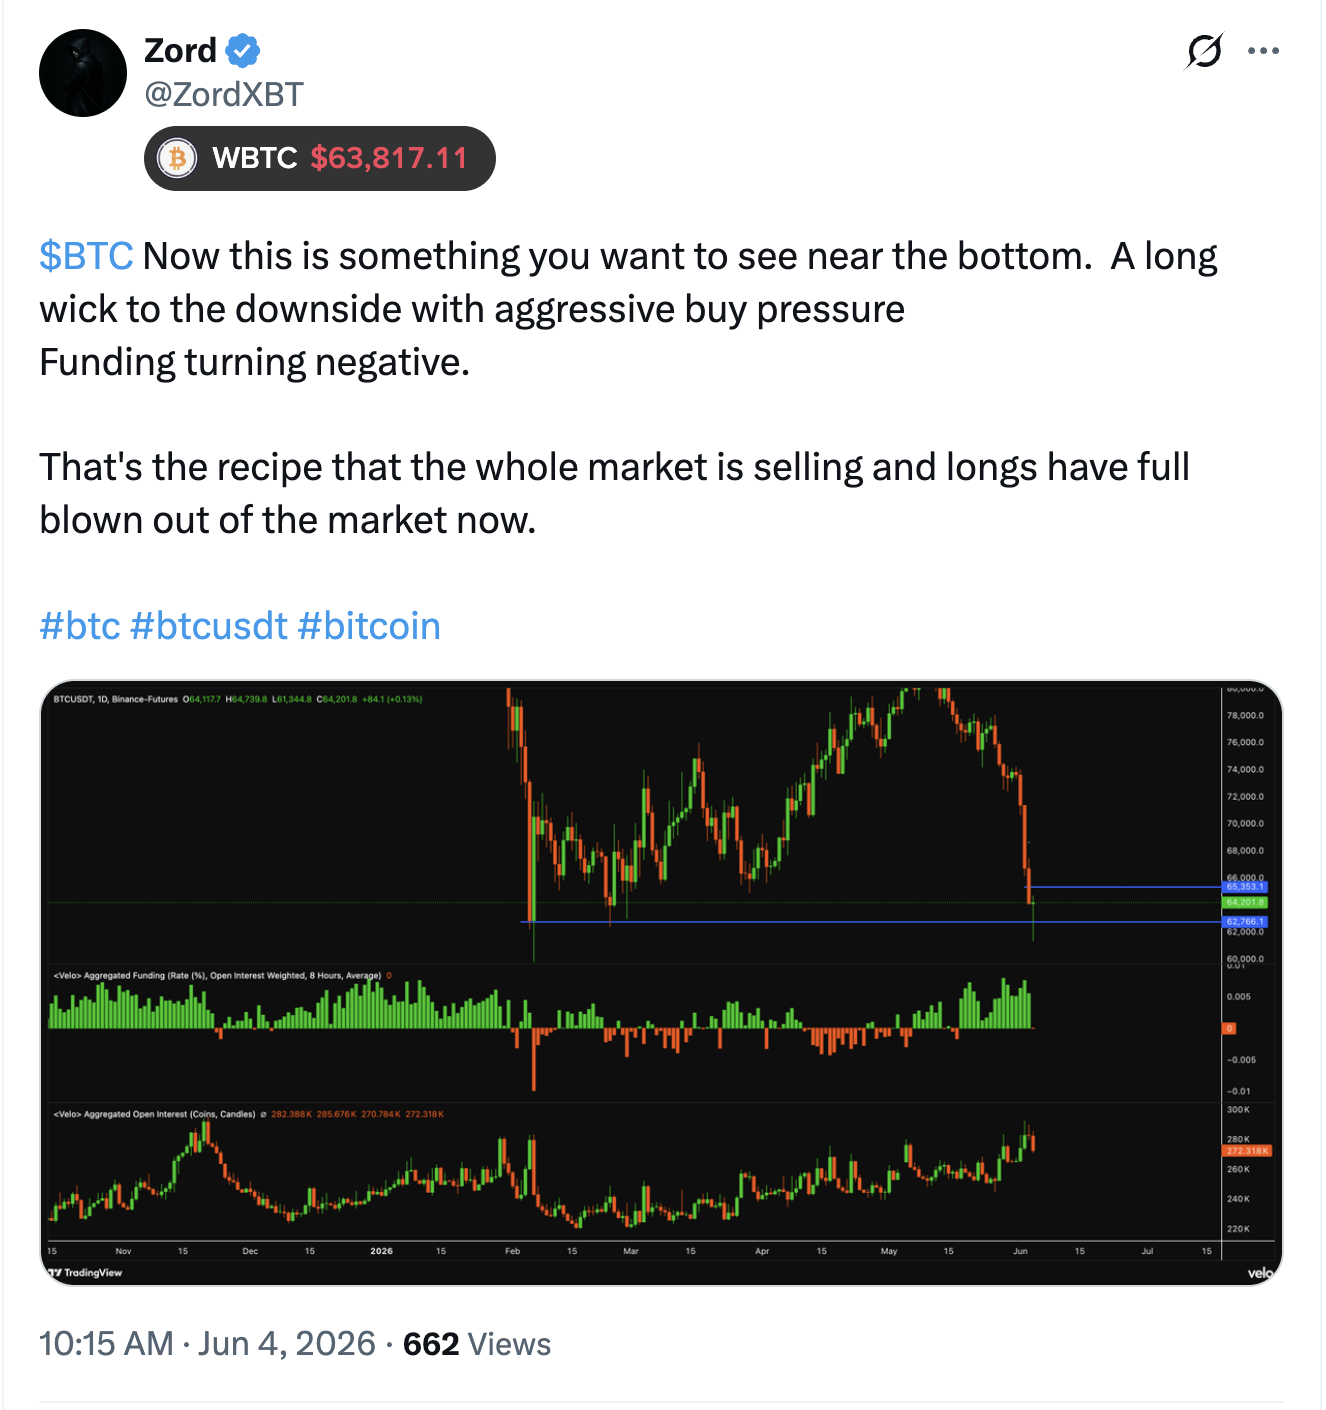
Source: X
On the other hand, crypto trader Hitman42.eth warned that BTC bulls may be celebrating too early, noting that the Bitcoin bounce may end up trapping bulls.
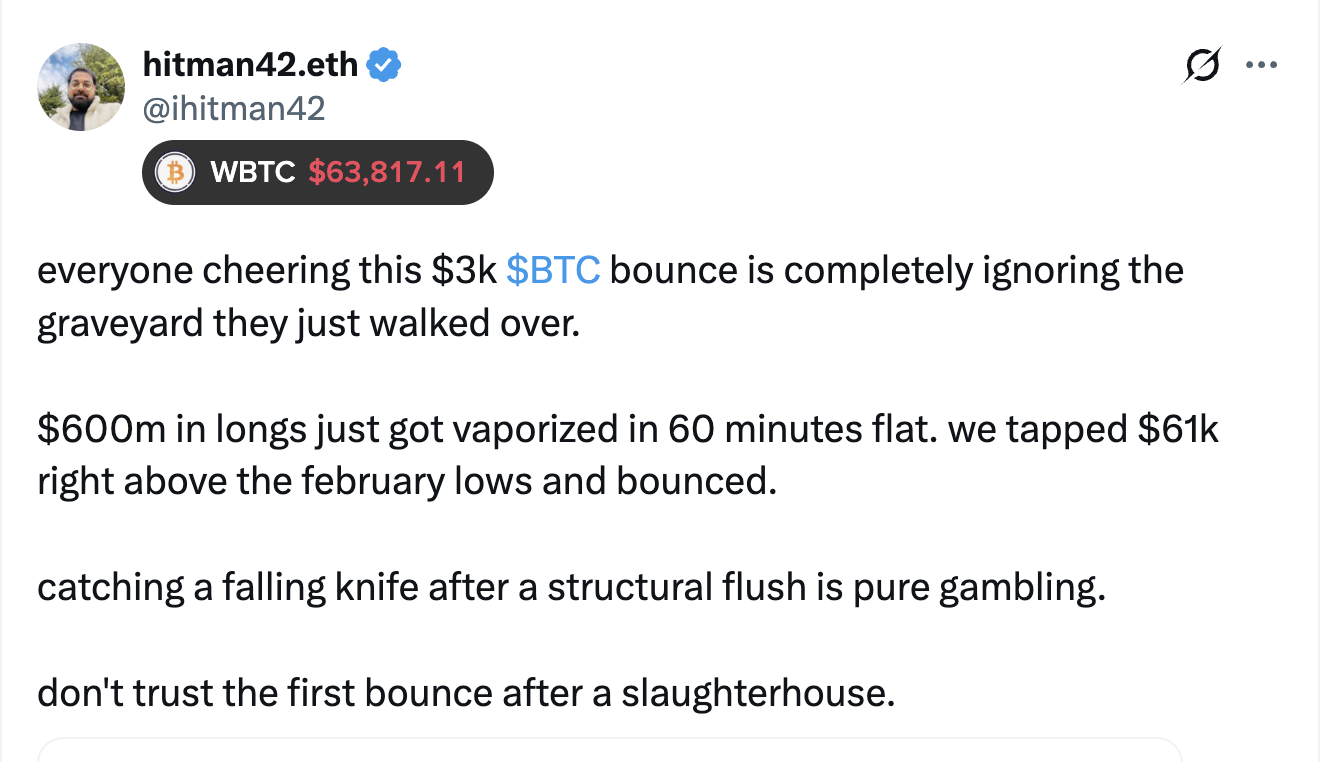
Source: X
Bitcoin bear flag keeps $50K target in play
Bitcoin’s weekly chart still shows a bear flag breakdown in progress, keeping the risk of a deeper drop toward the $50,000–$52,000 area alive. The setup follows BTC’s failure to reclaim the flag’s upper trend line, with rising volumes adding weight to the downside move.
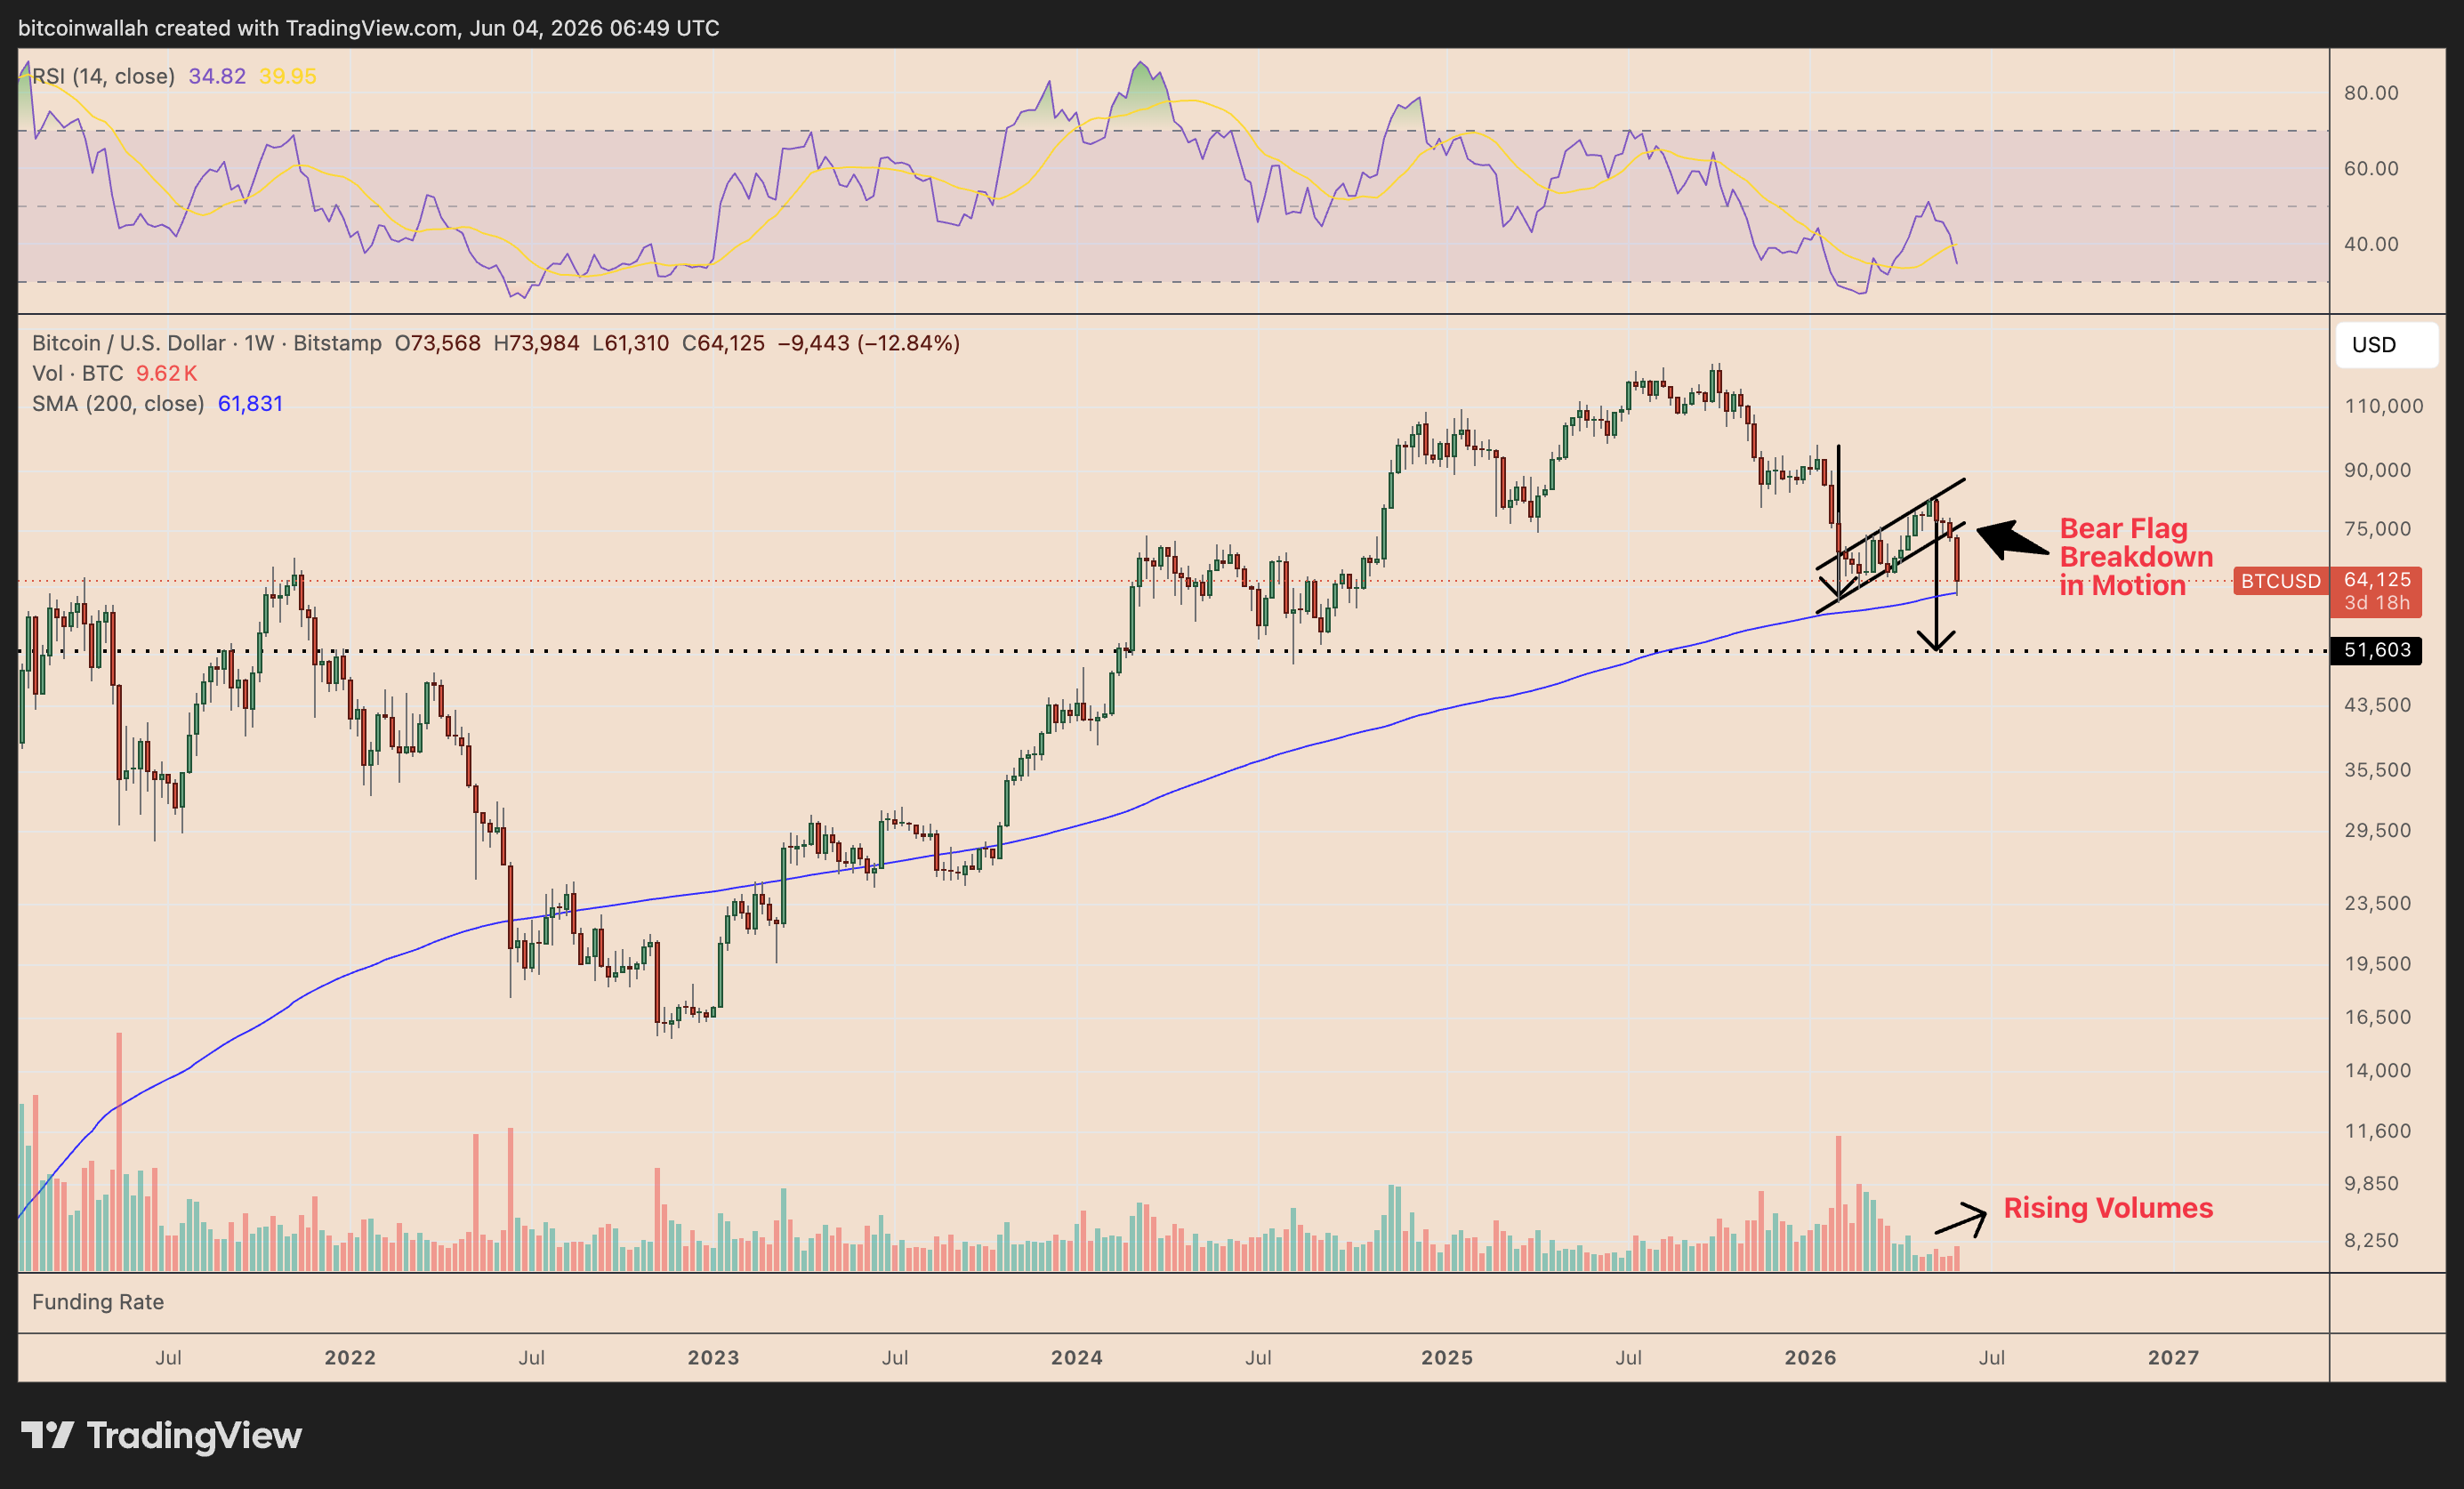
BTC/USD weekly chart. Source: TradingView
However, the bearish scenario is not confirmed as long as BTC trades above its 200-week simple moving average (200-week SMA, blue line) at around $61,800. This level has acted as a major cycle-bottom zone in past Bitcoin bear markets, including 2015, 2018 and 2020.
A strong rebound from the 200-week SMA would weaken, or potentially invalidate, the bear flag breakdown, putting BTC price in position to test $70,000 as the next upside target.

Lessons Traditional Finance Can Learn from Decentralized Finance
For years, the relationship between Wall Street and Decentralized Finance (DeFi) seemed adversarial.
Traditional finance (TradFi) viewed DeFi as an experimental corner of the internet filled with speculative assets, anonymous developers, and untested protocols. Meanwhile, DeFi advocates often portrayed banks and financial institutions as outdated middlemen destined to be replaced by code.
Yet beneath the headlines and ideological debates, something interesting has been happening.
Many of the world’s largest financial institutions have begun studying, testing, and in some cases adopting concepts pioneered by DeFi.
The reason is simple: DeFi has become one of the largest real-world experiments in financial infrastructure ever conducted. It has processed trillions of dollars in transactions, coordinated global liquidity without centralized operators, and demonstrated new models for market-making, lending, settlement, and asset ownership.
Wall Street may not be embracing DeFi publicly, but it is paying close attention.
DeFi Built Financial Infrastructure from Scratch
Traditional financial systems evolved over decades.
Banks, clearinghouses, brokers, custodians, payment processors, and regulators all became layers within a complex ecosystem. While this structure provides stability, it also creates friction.
A simple securities transaction can require multiple intermediaries, delayed settlement periods, and extensive reconciliation between institutions.
DeFi approached the problem differently.
Instead of building around institutions, it built around programmable rules.
Smart contracts automate functions traditionally handled by intermediaries:
- Lending
- Borrowing
- Trading
- Settlement
- Collateral management
- Yield distribution
The result is a financial system capable of operating continuously, globally, and transparently.
For Wall Street, this raises an important question:
What if financial infrastructure could become software?
The Efficiency of 24/7 Markets
Traditional financial markets have operating hours.
Stock exchanges close. Banks observe weekends. International transfers can take days.
DeFi never sleeps.
Protocols operate twenty-four hours a day, seven days a week, across every time zone.
Liquidity remains accessible regardless of geography, holidays, or business hours.
While regulators and institutions may not be ready for fully nonstop markets, they recognize the efficiency advantages.
As global finance becomes increasingly digital, the expectation of continuous access may become difficult to ignore.
Transparency as a Competitive Advantage
One of DeFi’s most overlooked innovations is radical transparency.
In traditional finance, market participants often operate with limited visibility into:
- Liquidity positions
- Counterparty risk
- Reserve holdings
- Settlement activity
DeFi changes that.
Every transaction is publicly verifiable on-chain.
Users can inspect protocol reserves, lending activity, treasury balances, and historical performance in real time.
Transparency does not eliminate risk.
However, it significantly reduces information asymmetry.
For institutions increasingly focused on compliance, auditing, and risk management, transparent systems offer powerful advantages.
Automated Market Making Changed Liquidity
Perhaps no DeFi innovation has attracted more institutional attention than Automated Market Makers (AMMs).
Before DeFi, electronic markets largely relied on order books and professional market makers.
Protocols such as automated liquidity pools demonstrated that liquidity could be supplied algorithmically by participants worldwide.
This innovation transformed how markets could function.
Even institutions that never directly interact with decentralized exchanges have studied AMM mechanics because they reveal alternative approaches to liquidity provision.
The broader lesson is that market infrastructure can be redesigned rather than merely optimized.
Instant Settlement Is Hard to Ignore
One of the highest costs in traditional finance comes from settlement delays.
Trades often require multiple layers of verification and clearing before final ownership is finalized.
DeFi introduced near-instant settlement.
Transactions execute, settle, and become visible on-chain within minutes or seconds.
This dramatically reduces:
- Counterparty risk
- Operational complexity
- Capital lock-up requirements
- Reconciliation costs
Financial institutions have taken notice because settlement efficiency directly impacts profitability.
The possibility of tokenized securities settling in real time is becoming an increasingly serious topic among banks and asset managers.
Tokenization Is the Bridge Between Worlds
Among all DeFi concepts, tokenization may have the greatest long-term impact.
Tokenization transforms real-world assets into blockchain-based representations.
Examples include:
- Real estate
- Bonds
- Stocks
- Commodities
- Private credit
- Money market funds
For Wall Street, tokenization offers a path toward:
- Faster settlement
- Fractional ownership
- Increased liquidity
- Global accessibility
- Reduced administrative overhead
Rather than replacing traditional assets, tokenization modernizes how those assets move through financial systems.
This is one reason many institutions are exploring blockchain infrastructure despite remaining cautious about cryptocurrencies themselves.
Open Innovation Moves Faster
Traditional finance often innovates through large organizations, lengthy approval processes, and significant regulatory oversight.
DeFi innovates through open-source collaboration.
Developers worldwide can contribute improvements, launch new protocols, or experiment with novel economic models.
This creates a rapid feedback loop.
Ideas are tested in months rather than years.
Not every experiment succeeds.
In fact, many fail.
But the pace of innovation remains unmatched.
Wall Street increasingly understands that some of the most valuable financial innovations may emerge from open networks rather than corporate research departments.
What TradFi Should Learn
The most important lesson is not that banks should become decentralized.
It is hoped that financial infrastructure can become more efficient, transparent, and programmable.
TradFi can learn from DeFi in several key areas:
1. Transparency Builds Trust
Users increasingly expect visibility into how systems operate.
2. Automation Reduces Costs
Smart contracts demonstrate how software can replace manual processes.
3. Settlement Speed Matters
Capital efficiency improves when transactions settle faster.
4. Open Systems Accelerate Innovation
Collaborative development can uncover solutions faster than closed ecosystems.
5. Global Accessibility Creates Opportunity
Financial services no longer need to be constrained by geography.
Conclusion
The future of finance is unlikely to be purely traditional or purely decentralized.
Instead, it will probably be a hybrid system that combines the strengths of both worlds.
Traditional finance brings regulatory experience, institutional trust, and deep pools of capital.
DeFi contributes transparency, programmability, efficiency, and innovation.
That is why Wall Street is quietly studying DeFi.
Not because decentralized finance has already won, but because it has proven that many assumptions about how financial systems must operate are no longer fixed.
The institutions that learn these lessons early may be the ones that define the next generation of global finance.
REQUEST AN ARTICLE
Crypto World
WISeKey (WKEY) Shares Drop as WISeSat Progresses Toward Nasdaq Launch Under WSAT Symbol

Key Takeaways
-
WISeKey shares retreat as WISeSat subsidiary progresses with Nasdaq listing under WSAT symbol.
-
Satellite subsidiary submits updated confidential SEC registration for anticipated public market debut.
-
Stock faces downward pressure following disclosure of SPAC transaction advancement.
-
WISeSat pursues independent Nasdaq presence through WSAT ticker while parent company shares decline.
-
Parent company experiences continued selloff as satellite unit completes regulatory filing milestone.
Shares of WISeKey International Holding (WKEY) declined following disclosure of a regulatory filing advancement for its satellite subsidiary WISeSat’s forthcoming Nasdaq debut. The stock settled at $8.25, representing a 6.99% decrease, and continued sliding to $8.17 during pre-market activity. The decline reflected investor concerns surrounding the proposed space technology merger transaction.
WISeKey International Holding AG, WKEY
Satellite Subsidiary Progresses With Public Market Plans
According to WISeKey’s announcement, WISeSat.Space Holdings Corp. filed an updated confidential Form F-4 registration draft with the Securities and Exchange Commission on May 29, 2026. This submission advances the satellite company’s merger with Columbus Acquisition Corp. Upon deal completion, the merged entity anticipates commencing Nasdaq trading operations under the WSAT ticker symbol.
The transaction stems from a Business Combination Agreement executed November 9, 2025, involving WISeSat, CAC, Pubco, WISeKey, and WISeSat Merger Sub Corp. Following consummation, both WISeSat and CAC will operate as Pubco subsidiaries. The arrangement remains contingent upon SEC clearance, Columbus Acquisition shareholder consent, and Nasdaq listing authorization.
The satellite division operates via WISeSat.Space AG, concentrating on protected orbital infrastructure solutions. Its mission encompasses secure communications channels, digital authentication systems, encrypted data transmission, and defense-oriented space technologies. The enterprise leverages WISeKey’s established expertise in cybersecurity protocols, identity verification, and semiconductor engineering.
Parent Company Shares Decline Despite Regulatory Milestone
Trading activity for WKEY remained bearish following the filing disclosure. Shares concluded regular trading at $8.25 following the 6.99% drop, then extended losses by 0.96% before market open. This movement brought the pre-market price to $8.17, demonstrating persistent selling pressure.
The negative market response accompanied the transaction’s progression into additional regulatory stages. While a confidential amended registration draft represents forward movement, it doesn’t finalize the combination. Furthermore, the public Form F-4 remains pending effectiveness with the SEC.
WISeKey disclosed the advisory team supporting the merger. Maxim Group LLC serves as sole financial advisor to WISeKey. Legal counsel includes Ellenoff Grossman & Schole representing WISeSat and Pubco, alongside Loeb & Loeb advising CAC.
Company Overview and Strategic Direction
WISeKey’s core operations span cybersecurity solutions, digital identity platforms, and internet-connected device security. The company maintains dual listings under WIHN on Switzerland’s SIX Exchange and WKEY on Nasdaq. Its WISeSat division represents expansion into orbital secure connectivity infrastructure.
The satellite subsidiary focuses on quantum-resistant communication networks delivered through protected space-based systems. WISeSat intends to integrate orbital services with verification technologies, digital identity frameworks, and protected information exchange protocols. Target markets include government agencies, corporate entities, and industries requiring encrypted communications.
The planned WSAT listing would establish WISeSat as an independent publicly-traded entity. Nevertheless, the arrangement awaits final documentation and shareholder authorization. During this interim period, WKEY shares remain under selling pressure as investors evaluate transaction completion risks.
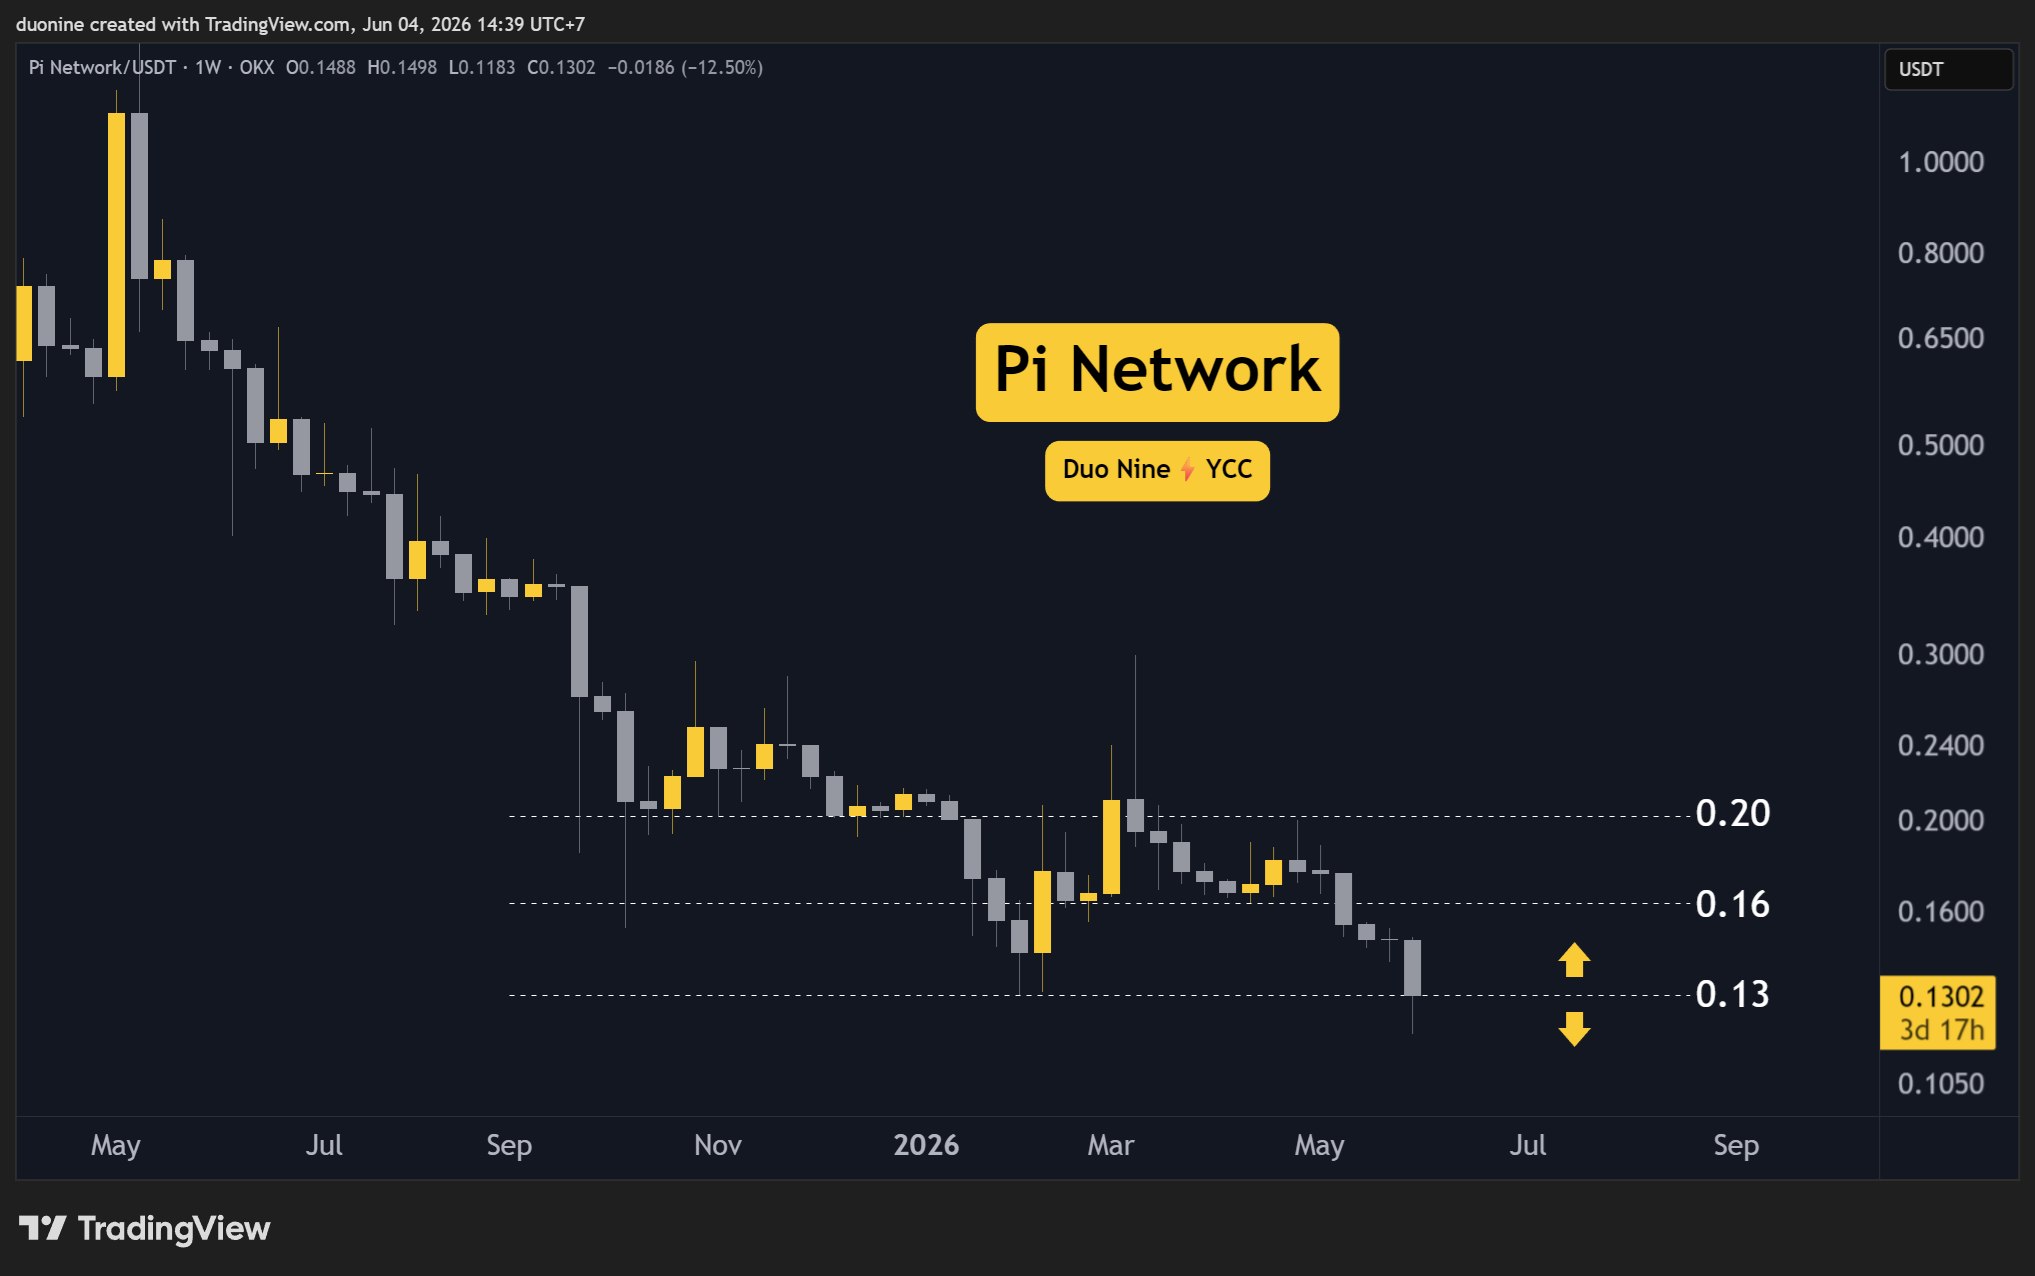
PI crashed 10% this week. Will the key support hold?
PI Network (PI) Price Predictions: Analysis
Key support levels: $0.13, $0.10
Key resistance levels: $0.16, $0.20
Market Crash Sends PI to Key Support
This week, PI set a new record low after crashing by 10%. This has driven the price to the $0.13 key support level. Buyers have returned here, but the outlook remains bearish as selling volume has been increasing over the past few days.
Because the price made a lower low, the downtrend remains intact and may continue to make new lows. For that to be confirmed, the current support at $0.13 has to turn into resistance.
Sellers Dominate
On the 3-day timeframe, sellers have dominated for 8 consecutive candles and pushed the price 30% lower. This aggressive selloff started as soon as the support at $0.16 failed to contain sellers.
If $0.13 also becomes resistance in the future, a similar pattern could materialize, with the downtrend accelerating and reaching new lows. If so, the next key target will be $0.10.

Daily RSI is Oversold
This most recent price drop has pushed the daily RSI into oversold territory, at under 30 points. At the time of this post, the RSI is around 25 points with no signs of a reversal and lower levels likely.
Nevertheless, this also indicates that sellers are getting greedy here, and a bounce or relief rally is more likely in the future. Therefore, best to watch the price action at $0.13. If that holds as support, buyers could have an opening to return.

The post Pi Network (PI) Price Predictions for This Week (June 4) appeared first on CryptoPotato.
Reliance traders said to game plan in case RBI raises rates

NVDA Shares Approach Strong Resistance

Andoni Iraola’s Liverpool era begins


-

 Tech6 days ago
Waymo dominates autonomous vehicle registrations as Tesla trails behind
-

 News Videos6 days ago
This is BROKEN! INSANE 5x MONEY CAR WASH WEEK! The NEW GTA Online UPDATE Today! (GTA5 New Update)
-
 Tech5 days ago
SpaceX just won a second Golden Dome contract. This one is $4.16 billion.
-

 Business3 days ago
Jade Biosciences, Inc. (JBIO) Discusses Positive Interim Results From JADE101 Phase I Healthy Volunteer Study and Development Plans Transcript
-

 News Videos6 days ago
SHE IS KILLING XRP!!! WATCH URGENT AND ACT FAST
-
 NewsBeat5 days ago
FIRST NIGHT REVIEW: Take That bring the Circus back to life in spectacular sun-soaked style
-

 Business5 days ago
Is the Spurs Phenom Already Better Than Prime Diesel?
-
Crypto World6 days ago
CFTC Has Approved the First Regulated Bitcoin Perpetual Contract in the U.S.
-

 Politics5 days ago
The House | Inside Andy Burnham’s Makerfield Campaign: “Nobody Thinks This Is In The Bag”
-

 Sports2 days ago
French Open 2026 results: Alexander Zverev beats Rafael Jodar and will play Jakub Mensik in semi-finals
-
 NewsBeat6 days ago
Novak Djokovic v Joao Fonseca LIVE: French Open latest scores and results after Jannik Sinner’s shocking collapse
-
 Entertainment5 days ago
Weak ‘Supergirl’ Box Office Tracking Amid Milly Alcock Backlash
-
 Crypto World6 days ago
Snowflake (SNOW) Stock Rallies on Strong Q1 Results and AI Product Growth
-

 Entertainment6 days ago
Maddox Jolie-Pitt Legally Requests to Drop Brad’s Surname
-

 Tech2 days ago
CryZENx Releases Fresh Playable Content Deep Inside Jabu-Jabu for His Ocarina of Time Remake
-

 Business5 days ago
Demand Conditions Improve In Chemicals Sector In April 2026
-
 Entertainment5 days ago
One of the Greatest Sitcoms of All Time Shoots Up Apple TV’s Charts 11 Years Later
-
 Crypto World6 days ago
MicroStrategy Moves $30 Million in BTC to Coinbase Prime: Is the Bitcoin Sell-Off Already Here?
-

 Tech6 days ago
This Week In Security: Ubiquiti Fixes, And FreeBSD Joins The Club You Don’t Want To Join
-
 Entertainment6 days ago
Bruce Willis’ Generosity Resurfaces Amid His Dementia
You must be logged in to post a comment Login