

Crypto World
Protocol Bankruptcy Courts – Smart Liquidity Research

How DeFi Could Handle Failure Without Chaos Decentralized finance has mastered many things: permissionless trading, algorithmic lending, automated market making. But one problem still sits awkwardly in the background — what happens when a protocol fails?
In traditional finance, companies that collapse enter structured legal processes like Chapter 11 bankruptcy, where courts coordinate creditors, restructure debt, and distribute remaining assets fairly. In DeFi, the equivalent often looks more like Twitter threads, governance drama, and panic withdrawals.
What if blockchains had their own Protocol Bankruptcy Courts?
The Missing Layer in DeFi: Orderly Failure
Protocols fail for many reasons:
-
Smart contract exploits
-
Insolvent lending pools
-
Governance attacks
-
Market collapses
-
Oracle manipulation
Events such as the collapse of Terra and the liquidation cascades across Celsius Network and FTX showed how chaotic unwinding can be when billions of dollars in digital assets are involved.
Unlike traditional companies, most DeFi protocols lack a formal mechanism to restructure obligations when something breaks.
Instead, we see:
-
Emergency governance votes
-
Ad-hoc treasury bailouts
-
Community-driven compensation plans
-
Legal interventions outside the chain
A Protocol Bankruptcy Court would aim to solve this by embedding structured crisis resolution directly into smart contracts and governance systems.
What Is a Protocol Bankruptcy Court?
A Protocol Bankruptcy Court (PBC) is a decentralized system that activates when a protocol becomes insolvent or unable to fulfill obligations.
Instead of shutting down chaotically, the protocol enters a structured recovery phase governed by predefined rules.
Think of it as a smart-contract-powered restructuring process.
Key functions could include:
1. Automatic Insolvency Detection
Smart contracts continuously monitor protocol health metrics:
-
Collateral ratios
-
Liquidity reserves
-
Treasury solvency
-
Withdrawal pressure
If thresholds are breached, the protocol automatically triggers Bankruptcy Mode.
2. Creditor Registry
All stakeholders are mapped on-chain:
-
Depositors
-
Liquidity providers
-
Token holders
-
Bond markets
-
DAO treasury claims
The court system creates a transparent creditor registry so everyone knows who is owed what.
No hidden liabilities. No off-chain spreadsheets.
3. Claim Prioritization
A core function of bankruptcy is deciding who gets paid first.
Protocols could encode priority layers such as:
-
User deposits
-
Secured collateral lenders
-
Liquidity providers
-
Governance token holders
This hierarchy could be voted on beforehand through DAO governance.
4. On-Chain Restructuring Proposals
Instead of chaotic community debates, restructuring proposals are submitted through a structured system.
Examples:
-
Treasury-backed compensation plans
-
Tokenized debt issuance
-
Recovery tokens (similar to post-crisis IOUs)
-
Liquidity lock extensions
Voting would determine which recovery plan becomes active.
5. Asset Liquidation Engines
Remaining assets could be distributed through:
Everything happens transparently on-chain.
The Concept of Recovery Tokens
A common tool in restructuring is the issuance of recovery tokens.
After a protocol collapse, affected users receive tokens representing their claim on future revenue.
These tokens could:
-
Earn a portion of protocol fees
-
Be tradable on secondary markets
-
Appreciate it if the protocol recovers
This approach transforms losses into long-term claims instead of instant write-offs.
Why DeFi Needs This
DeFi’s biggest weakness isn’t innovation — it’s crisis management.
Traditional finance has centuries of legal infrastructure for handling insolvency. Blockchains do not.
Protocol Bankruptcy Courts could:
-
Prevent panic bank runs
-
Provide fair creditor coordination
-
Reduce legal uncertainty
-
Preserve the surviving protocol value
-
Turn catastrophic collapses into structured recoveries
Instead of “rug → chaos → lawsuits,” the process becomes “failure → restructuring → recovery.”
The Governance Challenge
Who should run these courts?
Possible models include:
DAO Jury System
Randomly selected token holders review restructuring proposals.
Delegated Arbitration
Specialized governance delegates evaluate claims.
Automated Rules
Smart contracts execute pre-programmed recovery paths.
In reality, a hybrid system is likely.
Risks and Limitations
Protocol Bankruptcy Courts are not a perfect solution.
Challenges include:
-
Governance manipulation during crises
-
Disputes about creditor priority
-
Smart contract rigidity
-
Legal conflicts with real-world jurisdictions
Still, even an imperfect on-chain restructuring process could be far better than today’s improvisation.
A Future Where Protocols Can Fail Safely
Failure is inevitable in experimental financial systems.
The question isn’t whether protocols will collapse, but how they collapse.
If DeFi wants to mature into global financial infrastructure, it needs systems not just for growth, but for orderly failure.
Protocol Bankruptcy Courts could become one of the most important missing layers in decentralized finance — transforming collapse from a chaotic event into a managed, transparent restructuring process.
In a world where code governs capital, perhaps even bankruptcy should be programmable.
REQUEST AN ARTICLE

Crypto World
BTC, ETH at a Crossroads After Reclaiming Key Levels, ADA Whales on the Move: Bits Recap March 6th
Here’s everything most interesting surrounding BTC, ETH, and ADA.
The past few days have been quite positive for Bitcoin (BTC) and Ethereum (ETH), whose prices soared to a one-month peak.
Cardano’s ADA also headed north, but the bears intercepted the move, and the asset is now deep in red territory on a weekly scale. The correction aligns with recent whale behavior, suggesting they may be scaling back their exposure to the token.
BTC’s Performance
Nearly a week ago, the US and Israeli forces attacked Iran, thus marking the start of a new major military conflict that stunned the world and sent shockwaves through the financial and crypto markets. BTC reacted with an immediate plunge below $64,000, but just hours later, it rebounded above $67,000 following reports that the supreme leader of the Asian country, Ali Khamenei, had been killed.
The primary cryptocurrency continued its uptrend, reaching a monthly high of nearly $74,000 on March 4. Some of the potential catalysts behind the rally could be the initial indications that Iran is willing to discuss terms for ending the war, as well as the growing interest in the asset from large investors.
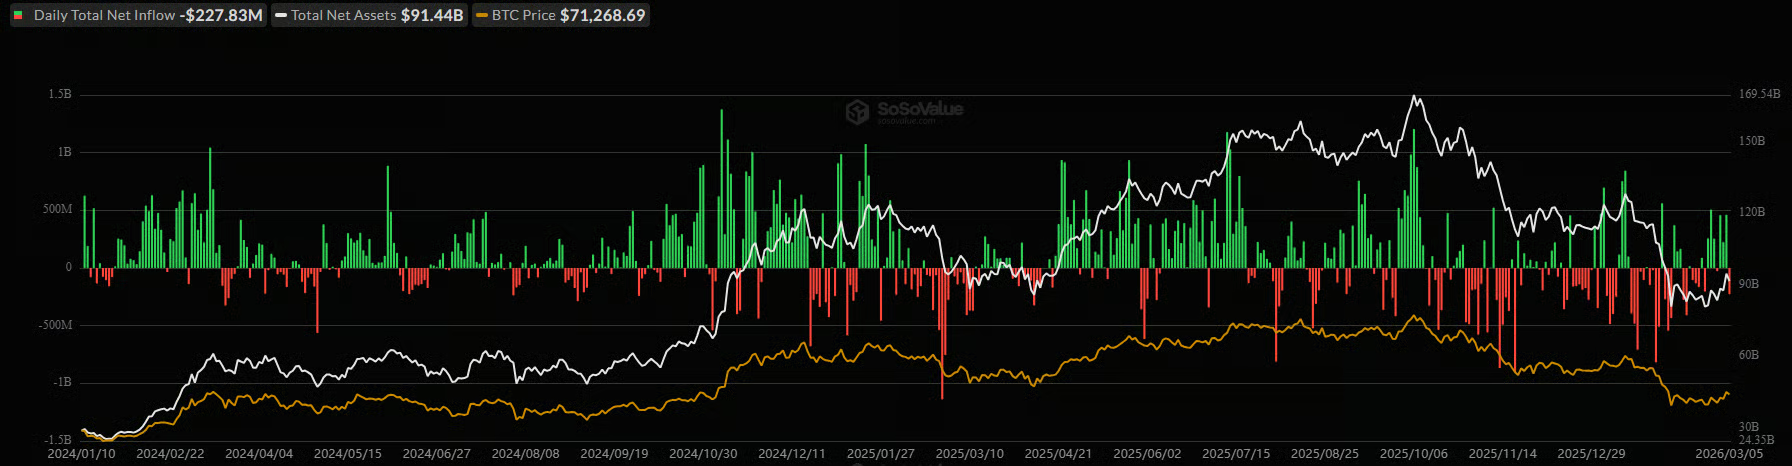
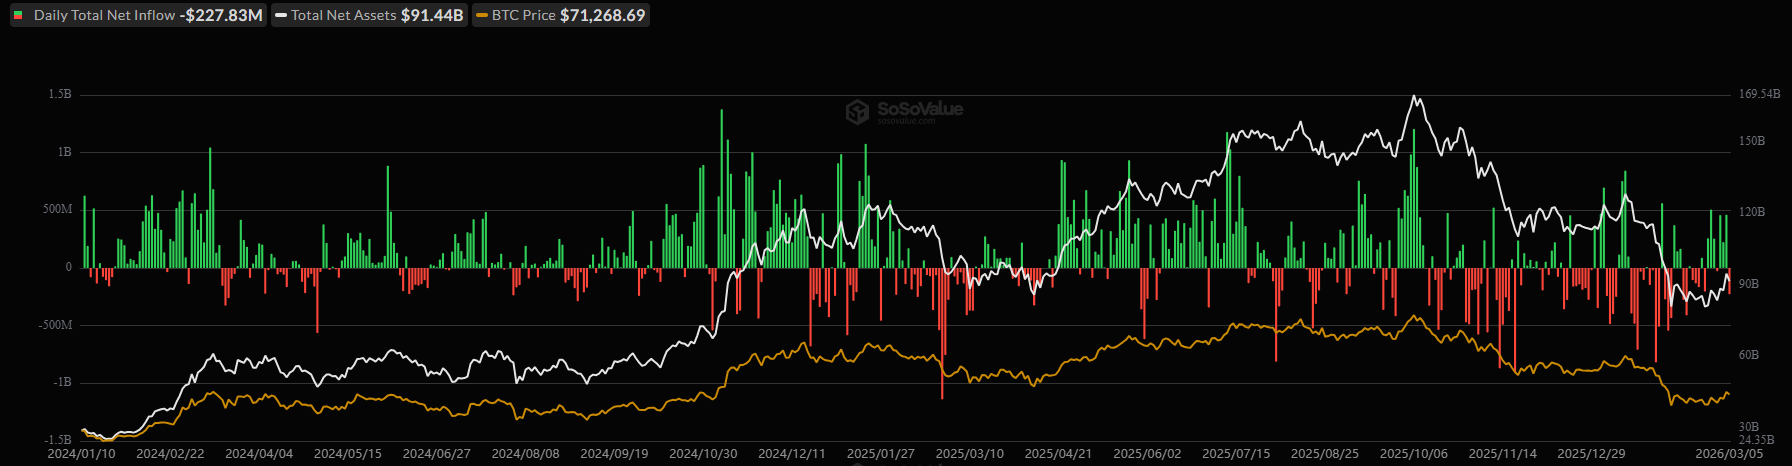
Data from SoSoValue show that inflows into spot BTC ETFs have been substantial over the past several days. The trend indicates that big investors, such as hedge funds and pension funds, have been increasing their exposure to the asset through these funds, whose issuers must buy real Bitcoin to back these purchases.
Some analysts, such as Ali Martinez, believe BTC could post much more significant gains in the short term. Earlier this week, he underlined the importance of reclaiming the $70,685 resistance level, adding that the $72,000-$81,000 zone has very little supply and describing it as “open air in that range.”
“The next major supply clusters appear around $83,307 and $84,569, which could act as the significant resistance zones,” he claimed.
Others were not so bullish. X user Ted reminded that shortly after Russia’s invasion of Ukraine in 2022, BTC showed a similar upside move before undergoing a severe correction, suggesting history could repeat itself.
You may also like:
How’s ETH Doing?
The second-largest cryptocurrency followed BTC’s footsteps, posting a painful decline below $1,900 but later rising to almost $2,200. As of this moment, it trades at around $2,060, representing a 4% increase on a seven-day scale.
Earlier this week, Ali Martinez assumed that a sustained close above $2,147 could set the stage for a further ascent to $2,335 or even $2,542. On-chain indicators such as the plummeting supply of ETH stored on exchanges support the bullish case.
Recently, the balance plunged to 15.93 million tokens, the lowest point since the summer of 2016. This means that investors continue to abandon centralized trading venues and move their holdings to self-custody, thereby reducing immediate selling pressure.
On the other hand, analysts like X user Emirhan suggested that a break below the key $2,109 level could open the door to a drop to under $1,900. The price did indeed slip beneath that mark, and we have yet to see whether an additional decline will come next.
The ADA Whales
Cardano’s native token tried to reclaim $0.30 but failed, and it is now worth around $0.26 (per CoinGecko’s data), representing a 7% decrease over the last week.
According to Martinez, the big investors have “redistributed” 230 million tokens in the span of just seven days. His graph displays a reduction in their total holdings, which can be interpreted as a major sell-off that could impact the price for several reasons.
This development increases the amount of ADA circulating on the open market, and without a corresponding rise in demand, the additional supply could suppress the valuation. Additionally, whale distribution signals fading confidence that may unsettle smaller players and prompt them to cash out as well.
It is important to note that the big investors had a much different strategy in recent months, accumulating roughly 820 million ADA between August 2025 and February this year.
Binance Free $600 (CryptoPotato Exclusive): Use this link to register a new account and receive $600 exclusive welcome offer on Binance (full details).
LIMITED OFFER for CryptoPotato readers at Bybit: Use this link to register and open a $500 FREE position on any coin!
Crypto World
Kazakhstan central bank to invest up to $350 million in crypto and digital asset markets


Kazakhstan’s central bank revealed plans to allocate up to $350 million from its gold and foreign exchange reserves to investments linked to cryptocurrencies and digital assets.
The bank’s governor, Timur Suleimanov, said the institution is developing a list of acceptable investments, which will extend beyond direct cryptocurrency holdings, according to a Reuters report on Friday.
The country became a major bitcoin mining hub after China’s 2021 mining ban pushed operators abroad. In 2025, Astana-based Fonte Capital introduced central Asia’s first spot bitcoin ETF (BETF), offering regulated, physically backed exposure to bitcoin.
The investment strategy is expected to include shares of high-tech companies connected to digital assets, cryptocurrency infrastructure firms and index funds whose performance tracks crypto markets.
Deputy central bank chair Aliya Moldabekova said the investments would be made in April and May, emphasizing that authorities are taking a measured approach.
“We are not talking about any large investment in cryptocurrencies,” Moldabekova said, according to Reuters. “We are currently selecting companies that deal with digital assets, for example those involved in cryptocurrency infrastructure.”
The allocation represents only a small share of the country’s overall reserves. As of Feb. 1, the central bank held $69.4 billion in gold and foreign exchange reserves, while the country’s national fund, which accumulates oil revenues, held $65.23 billion in assets, according to the central bank data.

Bitcoin (BTC) and global equity markets have stabilized above key psychological price levels, shaking off an early-week sell-off triggered by geopolitical tensions in the Middle East.
While Bitcoin is trading firmly above $70,000 and the S&P 500 has recovered lost ground, the bond market is signaling that the coast is far from clear.
Yields on U.S. Treasuries have surged for four consecutive days, warning traders that the combination of energy shocks and sticky inflation could keep the Federal Reserve hawkish for longer.
Discover: The best new crypto around!
Bitcoin and Stocks: Reading the Risk-On Signal in the Price Charts
The price of Bitcoin is around $70,500 as of Friday, marking a resilient 6% rebound for the week. The leading cryptocurrency briefly touched $73,470 on Wednesday, recovering sharply from a slide to near $63,000 over the weekend. That initial drop was driven by a spike in oil prices following reports of blocked transit in the Strait of Hormuz, a move that rattled risk assets globally.
The recovery has been mirrored in the equity markets. S&P 500 futures bounced from a multi-week low of 6,718 to reclaim the 6,840 level, stabilizing after the U.S. pledged naval escorts to secure energy transport routes.
This synchronized price action highlights a rising correlation between crypto and traditional equities. Bitcoin briefly reclaimed $73k despite war chaos, yet its tight coupling with the S&P 500 suggests it remains vulnerable to broad macro sentiment rather than acting as a detached safe haven.
If Bitcoin can maintain support above $72,000, it builds a base to challenge the $74,000 local high. However, if the correlation with equities holds and stocks roll over, the $65,000 level becomes the critical invalidation point for this relief rally.
Bond Yields Flash Warning: Why Traders Can’t Ignore the Macro Noise
While equity traders are buying the dip, bond traders are pricing in risk. The yield on the 10-year U.S. Treasury note has climbed from 3.93% to 4.15% in just four days. Bond prices move inversely to yields, and this sharp move suggests capital is demanding a higher premium for inflation risk.
The two-year yield, which is highly sensitive to Fed policy expectations, has jumped to nearly 3.60%. This repricing directly impacts risk appetite; higher yields typically drain liquidity from speculative assets like crypto by offering a more attractive risk-free return.
Fed rate cut hints had previously sent BTC flying past $72k, but the bond market is now effectively taking those chips off the table.
Data from CME Fed funds futures confirms the shift in sentiment. Investors now see less than a 50% chance of two rate cuts this year, a steep drop from the nearly 80% probability priced in before the conflict began.
If the 10-year yield breaks above 4.20%, it could exert heavy downward pressure on Bitcoin’s price. If yields stabilize or retreat below 4.00%, it would likely greenlight the next leg up for risk assets.
While some point to recent surges in altcoin ETFs as evidence of persistent institutional appetite, cautious analysts note that oil shock impacts are often delayed. If energy prices bleed into broader inflation data, the Federal Reserve may have to hold rates high, capping the upside for Bitcoin and stocks alike.
The Levels That Change Everything: What Traders Are Watching
Traders are focusing on three critical levels to determine the market’s next direction:
First, watch Bitcoin at $74,000. This is the immediate resistance cap; a daily close above this level would signal that the market has fully absorbed the geopolitical shock.
Second, monitor the 10-Year Treasury Yield at 4.2%. This is the danger zone for risk assets. If yields push through this level, expect algorithmic selling to hit both the S&P 500 and Bitcoin.
Finally, the invalidation level sits around $63,000. If the current stabilization fails, a break below this support would suggest the downtrend is resuming.
Discover: The best pre-launch crypto sales!
The post Bitcoin Price and Stocks Stabilize as Bond Market Signals Ongoing Macro Risk appeared first on Cryptonews.

Quick Summary
- Quarterly earnings per share reached $4.58, surpassing analyst expectations of $4.55; total revenue of $69.6 billion exceeded the $69.3 billion forecast
- Comparable sales across stores increased 7.4%, while digitally-driven comparable sales jumped 22.6%
- Net income increased nearly 14% compared to the prior year, reaching $2.035 billion
- Revenue from membership fees expanded 13.6% to $1.355 billion; paid membership base grew to 82.1 million
- COST shares gained 14% year-to-date but declined 0.2% during premarket hours following the earnings release
Costco reported strong fiscal second-quarter 2026 results that exceeded Wall Street’s projections on most important performance indicators. The warehouse retailer’s net income advanced nearly 14% from the same period last year to $2.035 billion, translating to $4.58 per diluted share and beating the consensus forecast of $4.55.
Total revenue reached $69.6 billion, modestly surpassing the anticipated $69.3 billion. Comparable sales across the company’s warehouse locations increased 7.4% overall, or 6.7% when adjusted for gasoline price fluctuations and currency exchange impacts.
This marks an acceleration from the prior quarter ending in December, when adjusted comparable sales grew 6.4%. Sequential monthly trends also demonstrated strengthening momentum — comparable sales climbed 7% in December, 7.1% in January, and accelerated to 7.9% in February.
Costco Wholesale Corporation, COST
The company’s digital operations delivered particularly impressive results. Comparable sales through digital channels surged 22.6%, supported by a 32% increase in website visitors and a 45% jump in mobile app traffic throughout the quarter. Personalized product recommendation features alone generated more than $470 million in online revenue.
COST stock traded 0.2% lower in premarket activity on Friday following the earnings announcement, although shares remain 14% higher year-to-date — positioned to fully recover the losses experienced during the previous year.
Membership Revenue and Profitability Remain Strong
Income from membership fees increased 13.6% year-over-year to $1.355 billion. Approximately one-third of this growth stemmed from the membership fee adjustment implemented in September 2024 across U.S. and Canadian locations. When excluding the fee increase and foreign exchange impacts, membership income still expanded 7.5%.
The total paid membership count reached 82.1 million, representing a 4.8% increase from the prior year. Executive-level memberships climbed to 40.4 million, up 9.5%. The global renewal rate remained stable at 89.7%, unchanged from the previous quarter.
Renewal rates in the U.S. and Canada decreased 10 basis points sequentially to 92.1%, which management attributed to online membership enrollments — which historically renew at marginally lower rates compared to in-warehouse signups.
Gross profit margin expanded to 11.02% from 10.85% in the year-ago period. Core-on-core margins improved by 22 basis points, with improvements spanning food, non-food, and fresh merchandise categories. Selling, general, and administrative expenses rose modestly to 9.19% of sales from 9.06% last year, partially driven by increased general liability reserves.
Tariff Environment, Store Growth, and Forward Outlook
CEO Ron Vachris described the tariff landscape as “extremely fluid.” Recently eliminated IEEPA tariffs have been substituted with new global tariffs scheduled to remain in place for at least 150 days. Costco filed legal action in the Court of International Trade to preserve its ability to claim refunds if those tariffs were invalidated — which occurred in February.
Vachris noted the retailer did not transfer complete tariff costs to members in numerous instances. Should refunds materialize, the company intends to pass that value back through reduced prices and enhanced promotional offers. The company has already reduced prices on eggs, cheese, coffee, select paper goods, and certain tariff-impacted merchandise including textiles and cookware.
The retailer operated 924 warehouses globally at quarter-end. Management projects 28 net new location openings in fiscal 2026 and aims to sustain 30-plus new openings annually moving forward. Capital expenditures for the full year are estimated at approximately $6.5 billion.
February net sales totaled $21.69 billion, increasing 9.5% year-over-year. Total comparable sales rose 7.9% for the month (7.0% adjusted). Digital-enabled sales climbed 21.8%.
No special dividend was declared. The board indicated it would continue evaluating the possibility, but stated there were no announcements to make at this time.

Bitcoin (BTC) traded 4.5% below the $74,000 high reached on Thursday, with traders conflicted over whether this level may have marked the local top for BTC price.
Key takeaways:
-
Bitcoin charts still show similarities to the 2022 bear cycle, suggesting another leg down below $60,000 is possible.
-
Others say the bottom is in and expect a breakout rally to $75,000–$80,000 to be next.
Is the 2022 BTC price cycle repeating?
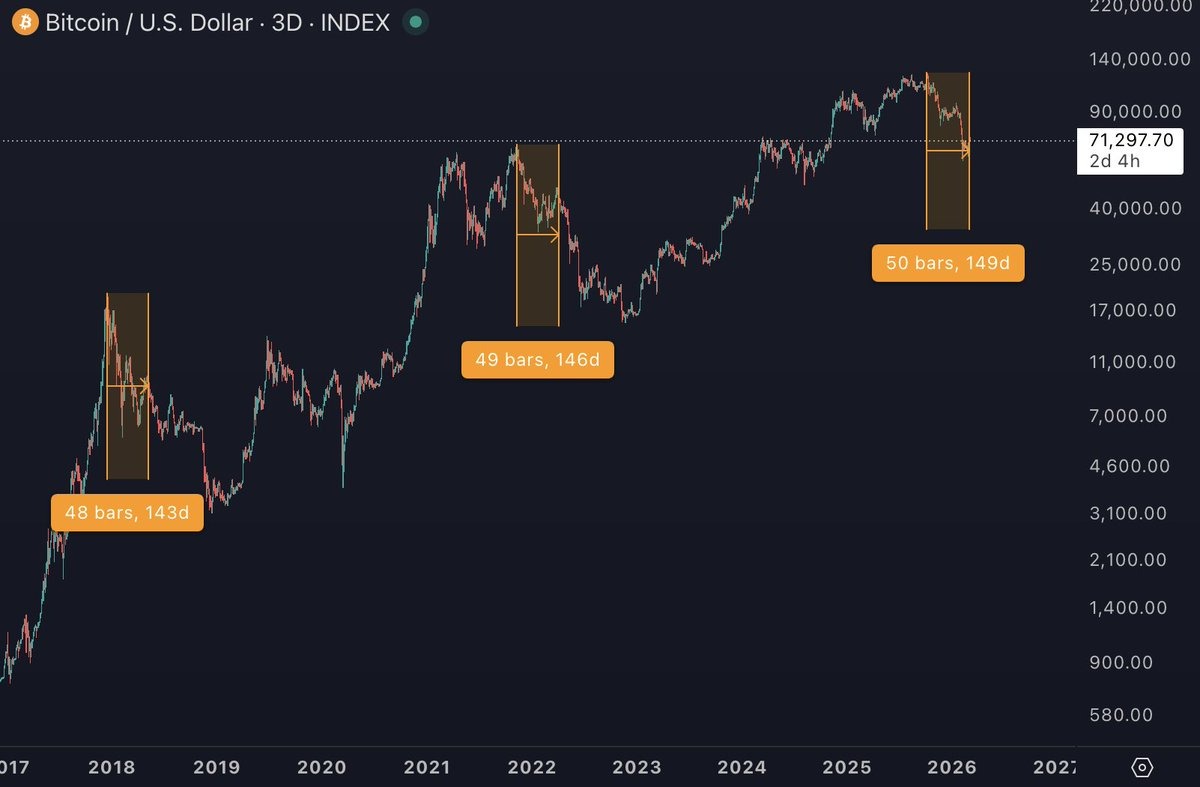
BTC’s current technical structure, following the latest recovery from $60,000, shows similarities with the middle of past bear cycles.
Bitcoin’s latest rise to $74,000 came 149 days after its bull market peak of $126,000 in October 2025.
Related: Bitcoin ‘anomalous’ outflow sees 32K BTC leave exchanges in a single day
“$BTC made a local high around 140–150 days after its all-time high in the previous two cycles before pushing lower,” said analyst Bitcoin Hyper in an X post on Thursday.

Echoing this view, pseudonymous trader Bitcoin Isaiah called the rally to $74,000 a “perfect local top indicator,” pointing to premature celebrations by the bulls as a signal for further dumping.
The analyst referred to the 2022 cycle, when similar euphoria preceded a 68% crash from $48,200 to $15,500, suggesting that history could repeat with a revisit to sub-$60,000 levels.

Master of Crypto said that the brief pump above $70,000 was a liquidity trap, wiping out both shorts and longs before targeting lower zones between $62,000-$65,000 where more ask-orders are located, adding:
“The price usually goes where the bigger money sits.”
As Cointelegraph reported, signs of a pullback emerged this week after the rally to $74,000, namely a classic bearish chart pattern and major overhead resistance.
Is Bitcoin’s relief rally over?
The bulls, however, argue that $60,000 was the likely market bottom, marking a structural shift.
For example, crypto analyst Bitcoin Munger said the 2022 Bitcoin bear fractal was not a “reason to be bearish” because this cycle is different.
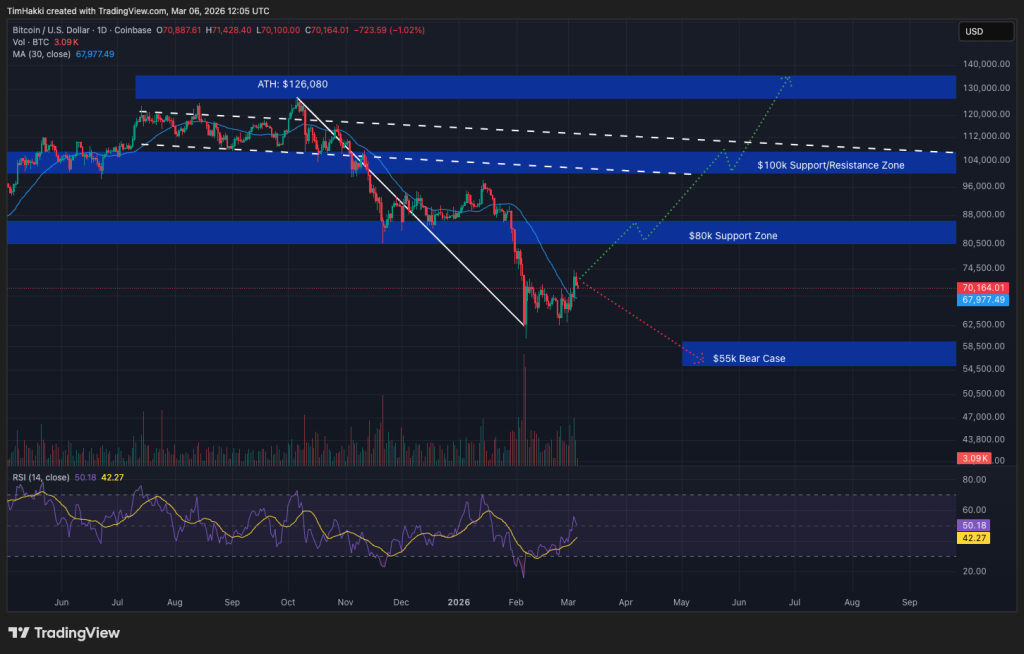
An accompanying chart showed that while the 2022 drawdown saw the price “cut through” the 200-week exponential moving average (EMA), the current only retested the trend line and bounced.

Meanwhile, analyst Mister Crypto says the BTC/USD pair is breaking out of an ascending triangle with the expectation of a “strong move to the upside,” if the upper trend line at $70,000 holds as support.

Other differences from the 2022 cycle include strong institutional ETF inflows and tightening supply, which may help Bitcoin avoid another crash and set it up for a rally to $75,000-$80,000.
This article does not contain investment advice or recommendations. Every investment and trading move involves risk, and readers should conduct their own research when making a decision. While we strive to provide accurate and timely information, Cointelegraph does not guarantee the accuracy, completeness, or reliability of any information in this article. This article may contain forward-looking statements that are subject to risks and uncertainties. Cointelegraph will not be liable for any loss or damage arising from your reliance on this information.

The resilience of the Swiss economy and inflation remaining below 1% have made the Swiss franc an attractive safe-haven asset amid an extremely tense geopolitical backdrop and elevated gold prices. As the USD/CHF chart shows, the US dollar fell against the Swiss franc below 0.7650 in February — the lowest level since summer 2011.
However, the pair has since begun forming higher lows, suggesting that strong support is emerging in this area. The outbreak of intensified military activity in the Middle East this week has led to a rise in the USD, with the dollar also strengthening against the franc. Market participants may be starting to view the Swiss currency as an overvalued safe-haven asset.
Notably:
→ This week could mark the second-largest weekly gain since the beginning of 2025.
→ The Swiss National Bank (SNB) has already hinted at the possibility of currency interventions due to the “excessive strength of the franc”.
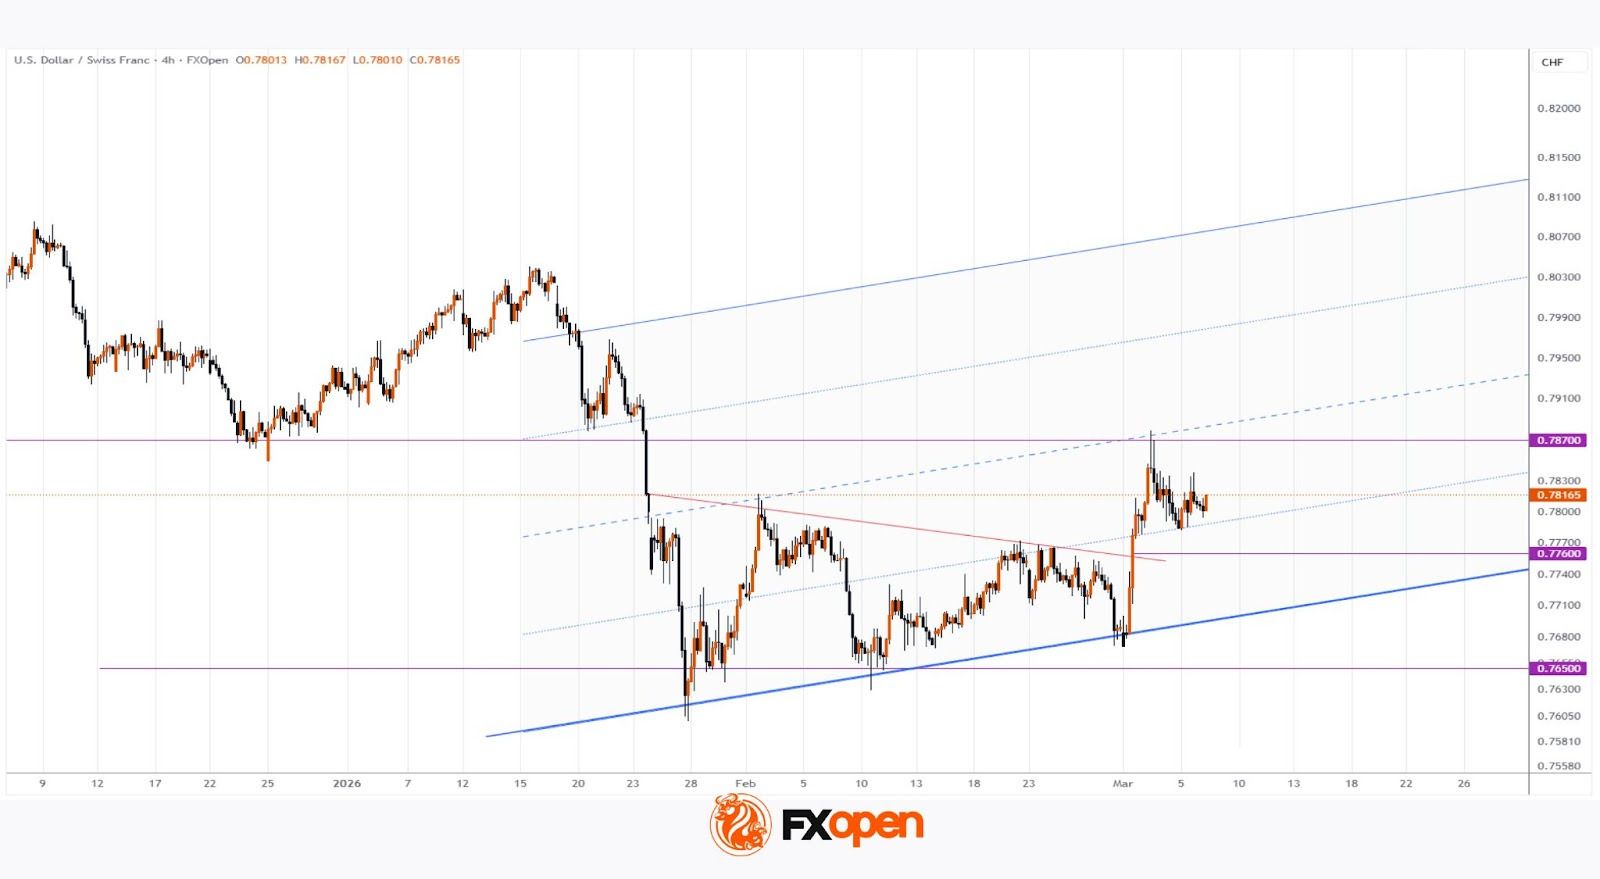
Technical Analysis of the USD/CHF Chart
From a bearish perspective:
→ The 0.7870 level, which acted as support throughout 2025 (before being broken), has predictably served as resistance this week.
→ The rebound from the February low may be interpreted as a bearish flag pattern within the broader long-term downtrend, suggesting the potential continuation of that trend.
From a bullish perspective:
→ Buying pressure has clearly broken through local resistance (the red trend line), meaning the 0.7760 level may now act as support.
→ Price movements are forming the outlines of an ascending channel.
Given that USD/CHF is trading near multi-year lows, it is reasonable to assume that the projected blue trajectory may not represent merely a temporary rebound within a multi-month bearish trend, but could instead be part of a significant bullish reversal. In this scenario, the lower blue trend line takes on strategic importance.
Trade over 50 forex markets 24 hours a day with FXOpen. Take advantage of low commissions, deep liquidity, and spreads from 0.0 pips (additional fees may apply). Open your FXOpen account now or learn more about trading forex with FXOpen.
This article represents the opinion of the Companies operating under the FXOpen brand only. It is not to be construed as an offer, solicitation, or recommendation with respect to products and services provided by the Companies operating under the FXOpen brand, nor is it to be considered financial advice.


Strike received a BitLicense and money transmitter license from the New York State Department of Financial Services, clearing the way for the bitcoin financial services firm to operate in the state.
“Receiving our BitLicense is a defining milestone for Strike,” said Jack Mallers, founder and CEO of Strike. “With our BitLicense, we can now bring that mission to New York, the global center of finance.”
Strike’s entry into New York is part of its expansion plans outlined in November 2025, when Mallers said his platform would add bitcoin-backed lending to allow users to borrow fiat currency while continuing to hold their bitcoin. The move would place Strike in a sector that saw several high-profile failures in 2022, when lenders including BlockFi, Celsius and Genesis filed for bankruptcy during the crypto market downturn.
The approval, announced Thursday, allows Strike to offer its products to individuals and businesses across New York, one of the most tightly regulated digital asset markets in the U.S. The company can now provide services that include buying and selling bitcoin, salary deposits converted into bitcoin and bill payments made from a bitcoin balance.
Strike can also offer tools such as recurring purchases and price-triggered orders that execute trades when bitcoin reaches a set level. Users can also convert up to 100% of direct-deposited wages into bitcoin, with conversion fees waived on deposits up to $20,000 each month.
Strike said customer bitcoin and cash balances remain held one-to-one and are not lent or used for company operations.
The license places the company under the New York State Department of Financial Services’ supervision, which includes audits, capital reserve rules and cybersecurity examinations.


U.S. banking regulators have clarified how tokenized securities should be treated under existing capital rules, stating that blockchain-based versions of traditional financial instruments will generally receive the same regulatory treatment as their conventional counterparts.
Summary
- The Federal Reserve and other U.S. banking regulators said tokenized securities should receive the same capital treatment as traditional securities if they confer identical legal rights.
- Regulators emphasized that bank capital rules are technology neutral, meaning the use of blockchain does not change the regulatory classification of an asset.
- The guidance aims to provide clarity as banks increasingly explore tokenization and distributed ledger technology in financial markets.
Regulators clarify capital rules for tokenized securities
In a set of frequently asked questions released by the Board of Governors of the Federal Reserve System, alongside the Federal Deposit Insurance Corporation and the Office of the Comptroller of the Currency, regulators said the capital framework applied to banks is designed to remain “technology neutral.”
Tokenized securities are digital representations of traditional assets, such as stocks or bonds, whose ownership rights are recorded and transferred using distributed ledger technology rather than traditional financial infrastructure.
According to the regulators, if a tokenized security confers legal rights identical to the underlying traditional security, it should receive the same regulatory capital treatment as the non-tokenized form.
“The technologies used to issue and transact in a security do not generally impact its capital treatment,” the agencies said in the guidance.
The clarification also states that banks should not apply different capital treatment depending on whether the tokenized security is issued on a permissioned or permissionless blockchain, reinforcing the technology-neutral stance.
Additionally, eligible tokenized securities that meet regulatory definitions may qualify as financial collateral, allowing banks to recognize them as credit risk mitigants under existing capital rules if all other requirements are satisfied.
The agencies said the FAQs were issued in response to growing interest among banks and financial institutions exploring blockchain-based financial infrastructure and tokenization.
Tokenization has emerged as one of the fastest-growing segments of the digital asset industry, with proponents arguing that blockchain-based securities could enable faster settlement, round-the-clock trading and improved market liquidity.
While the guidance does not introduce new regulations, it aims to provide clarity to banks considering tokenized securities activities and confirms that existing prudential standards will continue to govern these exposures.
Crypto World
Coinbase (COIN) CLO Offloads $233K in Shares Just Before Being Named in Shareholder Suit

Key Points
- Paul Grewal, Coinbase’s Chief Legal Officer, offloaded 1,314 shares of COIN on February 27, valued at roughly $233,000
- The transaction was reported through an SEC Form 4 filing
- On March 3, a derivative lawsuit was filed targeting Coinbase CEO Brian Armstrong and other senior leaders
- The complaint claims executives made misleading representations from April 2021 through June 2023, resulting in regulatory sanctions
- The exchange has previously settled with NY DFS for $100M and paid New Jersey $5M for compliance violations
Paul Grewal, who serves as Coinbase’s chief legal officer, disposed of 1,314 shares of COIN on February 27, based on an SEC Form 4 disclosure. The transaction value came to roughly $233,000.
The filing appeared on February’s final trading session, adhering to mandatory disclosure protocols for company insiders.
Executive stock sales don’t necessarily indicate negative developments. Company leaders frequently liquidate holdings for personal wealth management, tax obligations, or investment rebalancing strategies.
However, the chronology sparked interest — within days, a Coinbase investor initiated a derivative action against multiple senior executives at the cryptocurrency platform.
Kevin Meehan launched the legal action on March 3 in New Jersey’s U.S. District Court, representing Coinbase’s interests. Named defendants include Chief Executive Brian Armstrong, company co-founder Fred Ehrsam, Chief Legal Officer Paul Grewal, and Chief Financial Officer Alesia Haas.
The complaint asserts that leadership made inaccurate or deceptive statements spanning April 2021 to June 2023. These representations allegedly subjected Coinbase to regulatory consequences.
Previous Regulatory Actions
The litigation references two particular enforcement settlements. During early 2023, Coinbase reached a $100 million agreement with New York’s Department of Financial Services addressing deficiencies in its anti-money laundering protocols.
Concurrently, Coinbase received a $5 million penalty from New Jersey’s Bureau of Securities for offering unregistered securities on its platform.
The lawsuit demands financial recovery for Coinbase, modifications to the firm’s compliance framework, and reimbursement of executive compensation earned during the specified timeframe.
Relief Sought in the Complaint
Derivative actions are initiated by investors acting for the corporation, not for individual benefit. Any monetary awards would flow to Coinbase directly rather than the shareholder bringing the case.
The complaint challenges the board’s purported inability to adequately supervise compliance protocols and disclosure duties during a pivotal expansion phase for the business.
Grewal’s identity appears in both the stock disposition report and among the lawsuit defendants, although no direct link between these matters has been established.
Coinbase’s public market debut occurred in April 2021 — marking the beginning of the timeframe referenced in the complaint — and the company has encountered persistent regulatory challenges subsequently.
The platform introduced equity trading capabilities for customers this year, diversifying its offerings beyond digital assets.
COIN shares were changing hands at approximately $177 when Grewal executed his February 27 transaction, according to the reported sale amount.
The New Jersey lawsuit remains in preliminary stages with no scheduled hearings, and Coinbase hasn’t issued a public statement addressing the legal matter.
Crypto World
Bitcoin (BTC) price by short-termism as rally fades ahead of U.S. payrolls report: Crypto Daybook Americas
By Francisco Rodrigues (All times ET unless indicated otherwise)
Cryptocurrency prices are falling as some holders look to cash in on the mid-week bounce to $74,000 and others prefer less risky assets as the war in the Middle East escalates.
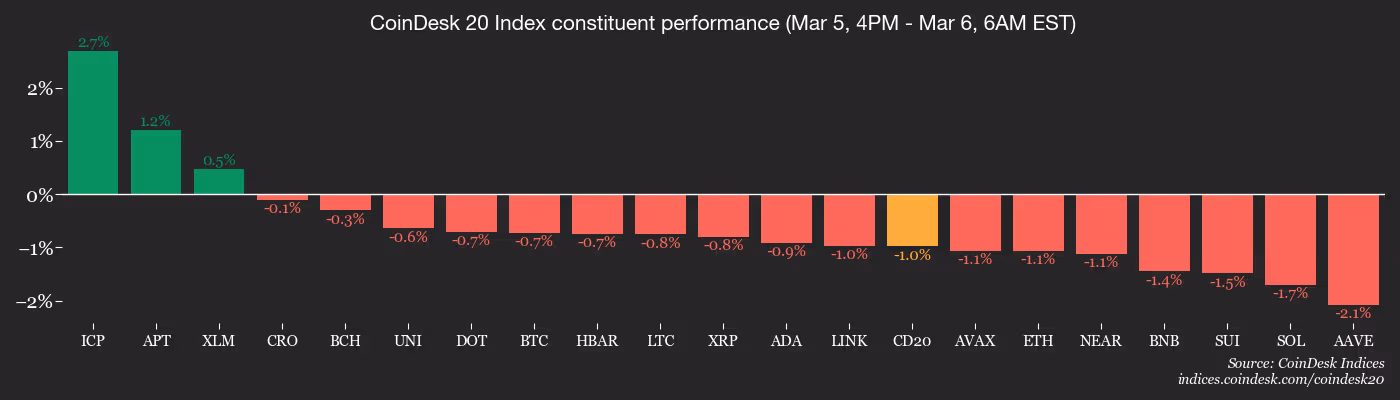
Bitcoin has lost 3.7% in the past 24 hours, holding just above $70,000, while the wider CoinDesk 20 (CD20) index dropped 3.5% as momentum from the rally earlier in the week cools. Bitcoin cleared $74,000 on Wednesday and is still up more than 6% over five days.
Illia Otychenko, lead analyst at CEX.IO, said the decline reflects selling pressure from short-term traders who bought the recovery. “Despite the recent recovery, there is still limited conviction that the rally will continue,” Otychenko told CoinDesk.
Meanwhile, derivatives markets show growing pessimism. Funding rates remain deeply negative, meaning traders are paying to hold onto short positions.
But underlying demand hasn’t gone anywhere. Otychenko noted that stablecoin movements into exchanges recently reached their highest levels in 2026 while spot bitcoin ETF flows turned positive.
“This creates a clear conflict in the market. Institutional spot buyers are accumulating Bitcoin, while derivatives traders are increasing short positions,” he added. “Historically, when spot accumulation coincides with negative funding, it often ends in a short squeeze, where short sellers are forced to close positions and the price moves higher. However, that outcome is not guaranteed.”
Geopolitics remains a factor. Brent crude is up more than 22% in the past week after U.S. and Israeli strikes on Iran and retaliatory attacks disrupted oil shipments through the Strait of Hormuz, a chokepoint carrying roughly 20% of global supply.
“Hormuz tanker traffic is still down 92%, Goldman is warning oil could hit $100, and the curve is flattening again as the short end reprices inflation risk with the 2Y backing up to 3.51%,” said Bryan Tan, a trader at Wintermute in a note.
The surge in energy prices is feeding inflation concerns, prompting traders to reconsider interest-rate cut expectations. Bond markets are already reflecting that shift, with U.S. Treasury yields rising as investors price in the risk that inflation will remain elevated.
And don’t forget, there’s also the U.S. jobs report later today, which will also feed into the Fed’s interest-rate decisions. Stay alert!
Read more: For analysis of today’s activity in altcoins and derivatives, see Crypto Markets Today
What to Watch
For a more comprehensive list of events this week, see CoinDesk’s “Crypto Week Ahead“.
- Crypto
- Macro
- March 6, 8:30 a.m.: U.S. nonfarm payrolls for February Est. 59K (Prev. 130K)
- March 6, 8:30 a.m.: U.S. unemployment rate for February Est 4.3% (Prev. 4.3%)
- March 6, 8:30 a.m.: U.S. average hourly earnings MoM for February Est. 0.3% (Prev. 0.4%)
- Earnings (Estimates based on FactSet data)
- March 6: Metalpha (MATH), pre-market
Token Events
For a more comprehensive list of events this week, see CoinDesk’s “Crypto Week Ahead“.
- Governance votes & calls
- No major governance votes & calls.
- Unlocks
- March 6: Hyperliquid (HYPE) to unlock 2.72% of its circulating supply worth around $288.77 million.
- Token Launches
Conferences
For a more comprehensive list of events this week, see CoinDesk’s “Crypto Week Ahead“.
Market Movements
- BTC is down 1.15% from 4 p.m. ET Thursday at $70,398.30 (24hrs: -2.89%)
- ETH is down 1.58% at $2,055.24 (24hrs: -3.01%)
- CoinDesk 20 is down 1.22% at 2,008.56 (24hrs: -3.52%)
- Ether CESR Composite Staking Rate is down 8 bps at 2.83%
- BTC funding rate is at -0.011% (-1.2209% annualized) on Binance

- DXY is unchanged at 99.23
- Gold futures are up 0.69% at $5,100.10
- Silver futures are up 1.64% at $83.03
- Nikkei 225 closed up 0.62% at 55,620.84
- Hang Seng closed up 1.72% at 25,757.29
- FTSE 100 is unchanged at 10,415.70
- Euro Stoxx 50 is unchanged at 5,760.30
- DJIA closed on Thursday down 1.61% at 47,954.74
- S&P 500 closed down 0.56% at 6,830.71
- Nasdaq Composite closed down 0.26% at 22,748.99
- S&P/TSX Composite closed down 0.98% at 33,610.00
- S&P 40 Latin America closed down 3.12% at 7,318.90
- U.S. 10-Year Treasury rate is up 7 bps at 4.15%
- E-mini S&P 500 futures are unchanged at 6,804.50
- E-mini Nasdaq-100 futures are unchanged at 24,905.25
- E-mini Dow Jones Industrial Average futures are unchanged at 47,804.00
Bitcoin Stats
- BTC Dominance: 59.47% (-0.02%)
- Ether-bitcoin ratio: 0.02917 (-0.24%)
- Hashrate (seven-day moving average): 1,026 EH/s
- Hashprice (spot): $30.66
- Total fees: 2.75 BTC / $198,402
- CME Futures Open Interest: 104,755 BTC
- BTC priced in gold: 13.8 oz.
- BTC vs gold market cap: 4.71%
Technical Analysis

- The ratio of altcoins (excluding top 10) to bitcoin is looking likely to close above the 50-week exponential moving average, implying no clear breakout for altcoinss relative to BTC.
- With no clear RSI divergences it is unlikely we will see a sustained rally from the broader altcoin universe.
Crypto Equities
- Coinbase Global (COIN): closed on Thursday at $205.71 (–1.54%), –0.40% at $204.89 in pre-market
- Galaxy Digital (GLXY): closed at $22.73 (–6.61%), –0.70% at $22.57
- MARA Holdings (MARA): closed at $8.77 (–5.60%), –0.91% at $8.69
- Riot Platforms (RIOT): closed at $15.60 (–5.63%), –0.71% at $15.49
- Core Scientific (CORZ): closed at $16.00 (+1.01%)
- CleanSpark (CLSK): closed at $9.95 (–6.66%), –0.50% at $9.90
- Exodus Movement (EXOD): closed at $11.18 (–8.06%)
- CoinShares Bitcoin Mining ETF (WGMI): closed at $39.25 (–4.73%)
- Circle Internet Group (CRCL): closed at $105.74 (+0.45%), –0.43% at $105.29
- Bullish (BLSH): closed at $35.02 (–4.99%), unchanged at $35.00
Crypto Treasury Companies
- Strategy (MSTR): closed at $139.81 (–4.53%), –0.30% at $139.39
- Strive Asset Management (ASST): closed at $9.25 (–3.85%)
- Sharplink (SBET): closed at $7.93 (–2.46%), –1.01% at $7.85
- Upexi (UPXI): closed at $0.96 (–10.93%)
- Lite Strategy (LITS): closed at $1.13 (–7.38%)
ETF Flows
Spot BTC ETFs
- Daily net flows: -$227.9 million
- Cumulative net flows: $55.7 billion
- Total BTC holdings ~ 1.29 million
Spot ETH ETFs
- Daily net flows: -$90.9 million
- Cumulative net flows: $11.74 billion
- Total ETH holdings ~ 5.68 million
Source: Farside Investors
While You Were Sleeping
Britney Spears’ Ex Jason Alexander Defends Her Amid Arrest

The Best Pull-On Work Pants

911 calls reveal pain, despair at ICE’S largest detention camp

Smart energy pays enters the US market, targeting scalable financial infrastructure

Why Israel is blocking foreign journalists from entering

Bitcoin: We’re Entering The Most Dangerous Phase

I made money on one design! I’m sewing this dress in batches for sale

What They REALLY Think Of Crypto #cryptocurrency #bitcoin #crypto #stablecoins #shortsfeed

Oregon cost of living report shows rising debt, financial hardship across the state
-

 Politics3 days ago
Alan Cumming Brands Baftas Ceremony A ‘Triggering S**tshow’
-

 Fashion7 days ago
Weekend Open Thread: Iris Top
-

 Tech5 days ago
Unihertz’s Titan 2 Elite Arrives Just as Physical Keyboards Refuse to Fade Away
-

 NewsBeat6 days ago
Abusive parents will now be treated like sex offenders and placed on a ‘child cruelty register’ | News UK
-
 NewsBeat6 days ago
Dubai flights cancelled as Brit told airspace closed ’10 minutes after boarding’
-
Sports6 days ago
The Vikings Need a Duck
-
 NewsBeat6 days ago
The empty pub on busy Cambridge road that has been boarded up for years
-

 NewsBeat5 days ago
‘Significant’ damage to boarded-up Horden house after fire
-

 Tech1 day ago
Bitwarden adds support for passkey login on Windows 11
-

 Entertainment4 days ago
Baby Gear Guide: Strollers, Car Seats
-
 Sports19 hours ago
499 runs and 34 sixes later, India beat England to enter T20 World Cup final | Cricket News
-
Politics5 days ago
FIFA hypocrisy after Israel murder over 400 Palestinian footballers
-
 NewsBeat5 days ago
Emirates confirms when flights will resume amid Dubai airport chaos
-

 NewsBeat4 days ago
Is it acceptable to comment on the appearance of strangers in public? Readers discuss
-

 Tech5 days ago
Viral ad shows aged Musk, Altman, and Bezos using jobless humans to power AI
-

 Video4 days ago
How to Build Finance Dashboards With AI in Minutes
-

 Business2 days ago
Guthrie Disappearance Enters Fifth Week as Family Visits Memorial
-
 Crypto World5 days ago
US Judge Lets Binance Unregistered Token Class Action Proceed
-
 NewsBeat4 days ago
Ukraine-Russia war latest: Belgium releases video showing forces boarding Russian shadow fleet oil tanker
-

 Fashion5 days ago
On the Scene at the 57th Annual NAACP Image Awards: Teyana Taylor in Black Ashi Studio, Colman Domingo in Yellow Sergio Hudson, Chloe Bailey in Christian Siriano, and More!