

Crypto World
Q1 2026 Filings Reveal Massive De-Risking Across Wall Street’s Largest Portfolios

TLDR:
- Q1 2026 filings show a widespread reduction in mega-cap tech exposure across major institutional portfolios.
- Hedge funds executed aggressive exits from Microsoft, Google, Nvidia, and select industrial positions.
- Berkshire Hathaway reshaped holdings, trimming assets and expanding cash reserves to near-record levels.
- Capital allocation trends show rotation toward liquidity and defensive positioning across global funds.
Wall Street’s biggest funds entered Q1 2026 with a noticeable change in posture. They are stepping back from crowded trades in mega-cap tech while rebuilding liquidity buffers across global portfolios.
Berkshire Hathaway’s Structural Reallocation and Liquidity Expansion
Berkshire Hathaway’s latest portfolio reshaping under Greg Abel reflects a notable contraction in equity breadth alongside a sharper focus on liquidity.
The holdings base was reduced from 40 positions to 26, marking one of the most concentrated structural adjustments in recent cycles.
The firm fully exited Amazon, UnitedHealth, and Domino’s while trimming Chevron and Bank of America exposure.
At the same time, Berkshire added a $2.65 billion position in Delta Air Lines and increased exposure to Alphabet. Cash reserves expanded toward $397 billion, reinforcing a defensive allocation stance.
Operating performance remained stable with $93.68 billion in revenue and $10.11 billion in net income. Insurance underwriting and BNSF rail operations contributed to an 18 percent rise in operating earnings.
Share buybacks resumed at $234 million, signaling selective capital deployment amid elevated liquidity positioning.
Hedge Fund Exits Signal Technology De-Risking Cycle
Across hedge fund filings, a clear rotation away from concentrated technology exposure emerged during Q1 2026.
Bill Ackman nearly fully exited Alphabet, reducing both Class A and Class C holdings by more than 94 percent. The move reflected a decisive exit rather than incremental trimming.
Chris Hohn’s TCI Fund reduced Microsoft exposure from 10 percent of its portfolio to just 1 percent, citing AI-driven disruption risk to enterprise software economics.
Daniel Loeb also fully exited Microsoft while cutting Nvidia exposure by more than 93 percent, alongside sharp reductions in Union Pacific and multiple industrial names.
This wave of exits extended beyond single names into broader portfolio compression, with Loeb closing 20 positions in total.
The pattern shows a shift from concentrated high-growth bets toward liquidity and risk dispersion. Capital flows increasingly moved into cash equivalents and lower volatility allocations.
The collective repositioning reflects how institutional capital is adjusting to valuation pressures and structural uncertainty in technology-heavy portfolios.
Liquidity buffers are rising, while exposure to mega-cap equities is being reduced in favor of capital preservation strategies. Portfolio rotations are now being closely tracked across global fund disclosures.


The FIFA World Cup’s round of 16 matches are set to kick off on July 4, and football, or soccer as it’s known in the United States, has become the biggest driver of activity on prediction platforms, diverting attention from the political and macroeconomic markets they were originally built around.
This is according to data from research firm CryptoRank, which shows that the tournament has pushed prediction market volumes from just $65 million on June 1 to a monthly peak of $5.6 billion on June 22.
World Cup Drives Record Activity Across Prediction Platforms
Per CryptoRank’s data, throughout June, total trading volume across major prediction venues rose rapidly, from the aforementioned $65 million on June 1 to $340 million on June 8, just days before the World Cup started. A week later, on June 15, the volume had jumped to $2.2 billion, with 15 matches played, including the USA’s memorable 4-1 win over Paraguay in Los Angeles.
By the time 42 games had been played on June 22, trading on the platforms had gone up even higher, with CryptoRank reporting that volume had hit a high of $5.6 billion before showing a slight reduction seven days later, when about $5.4 billion in trades was recorded on June 29.
In a post on X on July 2, the firm said that Kalshi had accounted for much of that June activity, with its dashboard at the time of writing showing open interest, or the total value of active positions that have yet to be settled, standing at $1.84 billion. Of that amount, roughly $1.45 billion was on Kalshi while Polymarket held about $390 million.
During the previous week, open interest remained relatively stable on Kalshi at around $1 billion, while on Polymarket, it peaked at $475 million on June 30, the day Norway, Sweden, and the Netherlands were knocked out of the competition in dramatic style.
BitMart pointed to similar trends on its own platform. With multiple research institutions projecting that the total global trading volume on prediction markets could reach $10 billion, the crypto exchange said that most of that traffic has so far been directed to centralized platforms like it, given their lower barriers to entry compared to on-chain prediction products that require private keys and gas fees as well as contract approvals that need several steps to complete.
As such, the CEX reported that its monthly prediction market volumes skyrocketed 1,500% from May after the World Cup started. It also said active users increased 4.6 times, while completed orders went up nearly 9 times.
Furthermore, according to the exchange, nearly 44% of newly registered users placed their first trade through its prediction markets, with football markets being the main attraction for the newcomers before some of them expanded into crypto price predictions.
An Industry With Some Baggage
Polymarket’s more subdued performance in the World Cup month compared to Kalshi has come against a backdrop of criticism on several fronts. For instance, a Wall Street Journal (WSJ) investigation published in June alleged that the platform has been using staged winning bets in promotional videos.
There was also a recent dispute that made headlines, in which a user accused Polymarket of changing the rules of a market tied to Strategy’s Bitcoin sale, raising questions about how such firms resolve contested outcomes.
The post World Cup Fever Fuels $5.6B Explosion in Prediction Markets appeared first on CryptoPotato.
MicroStrategy chief executive Phong Le has called Bitcoin (BTC) the “United States of money.” On-chain tracker Arkham says the $1 million bet he made on the firm’s preferred stock is back to break-even.
The purchase, in a securities filing, doubles as a personal wager on the company Le runs. Strategy, formerly MicroStrategy, is fighting to hold its Stretch preferred stock (STRC) near par after a Bitcoin slump.
$1 Million Bet Back at Break-Even
A June 22 filing shows Le bought 11,000 STRC shares through his family trust. He paid a weighted-average $90.80 apiece, or about $998,756. He framed it as a long-term hold, not a trade.
That price was below STRC’s stated $100 value. Strategy designed the stock to trade near that $100 par value, adjusting its dividend monthly to defend the peg.
The company has since lifted STRC’s annual dividend to 12%, up from 9% at its July 2025 debut. That has pulled the shares back toward par. Arkham now pegs Le’s position at break-even.
The recovery matters because STRC anchors a preferred-stock stack now worth more than $13 billion. MicroStrategy recently outlined a new Bitcoin sales policy that could fund those dividends by selling some of its holdings.
“I bought $1 million of $STRC today. Will hold it until it reaches par, likely longer,” Le described the buy in a June post.
Follow us on X to get the latest news as it happens
Why Le Calls Bitcoin the United States of Money
Le laid out his case for Bitcoin, describing it as money set by transparent rules and a fixed supply that no government can inflate away. The asset, he argued, shields wealth from inflation, censorship, and political pressure.
“Bitcoin is the United States of money. It aspires to do for money what the American Constitution aspired to do for government: create a system governed by transparent rules rather than the discretion of individuals…But beyond that, Bitcoin is hope,” he stated.
He tied the view to his own past. He linked his family’s refugee journey from Vietnam to the belief that people should control their own money. Le has predicted Bitcoin could become a global reserve asset within a decade.
The conviction carries weight because Le runs Strategy, the largest corporate Bitcoin holder at 818,334 BTC.

Founder Michael Saylor pioneered that treasury model in 2020. Le points to banks like Goldman Sachs and Citi adding Bitcoin services as proof that the shift is real.
Not everyone shares the optimism. Bitwise has said Strategy is no longer Bitcoin’s dominant buyer. The firm also booked a $12.5 billion quarterly loss as bitcoin fell. Rival corporate Bitcoin treasuries have kept accumulating through the slump.
Whether the break-even holds depends on how STRC and Bitcoin’s bear market play out from here. For now, Le’s balance sheet and his personal account are pointing in the same direction.
The post MicroStrategy CEO Calls Bitcoin ‘United States of Money’ appeared first on BeInCrypto.
Crypto exchange Kraken has started accepting select tokenized stocks and exchange-traded funds (ETFs) as collateral for futures and margin trading. The change is designed to let eligible users open leveraged positions without first selling the tokenized assets they already hold.
Kraken’s initial rollout supports 10 tokenized instruments, including tokenized shares of major US technology companies such as Apple, Nvidia, and Tesla, alongside tokenized ETF and strategy-related products such as Strategy, the SPDR S&P 500 ETF, and Invesco QQQ Trust.
Key takeaways
- Kraken will accept tokenized stocks and ETFs as margin and futures collateral for eligible clients.
- The initial list includes Apple, Nvidia, Tesla, Strategy, the SPDR S&P 500 ETF, and Invesco QQQ Trust, among others.
- Assets receive collateral haircuts that reduce their effective lending value, with broad ETFs discounted by 10% and certain higher-volatility names discounted by 30%.
- Collateral limits vary by asset type, including up to $1 million for broad-market ETFs and up to $250,000 for most individual stocks.
- Support is limited to eligible clients outside the United States, with different collateral rules depending on the jurisdiction.
How Kraken will treat tokenized collateral
Kraken says each eligible tokenized asset is subject to a collateral “haircut,” a risk-based adjustment that lowers the amount it can contribute to a user’s borrowing power. In the exchange’s rollout, broad-market ETFs receive the lowest haircut at 10%, while more volatile stocks—including Strategy and Robinhood—are discounted by 30%.
Alongside haircuts, Kraken also sets collateral caps per asset. Broad-market ETFs are limited to up to $1 million in collateral value, while most individual stocks are capped at $250,000. Kraken also applies lower caps to tokenized gold and Circle shares, which it places at $100,000.
Importantly for active traders, Kraken notes that both collateral limits and haircuts will be reviewed periodically and remain subject to change.
Which tokenized assets are included at launch
The feature initially covers 10 tokenized stocks and ETFs. The list named by Kraken includes tokenized Apple, Nvidia, and Tesla, as well as tokenized Strategy. It also includes tokenized broad-market exposure such as the SPDR S&P 500 ETF and Invesco QQQ Trust.
Beyond these examples, Kraken’s announcement indicates that some higher-volatility holdings are assigned larger discounts. In particular, the exchange cited a 30% haircut for Strategy and Robinhood, illustrating how collateral treatment may differ materially even within single-stock collateral categories.
Regional access and venue-specific support
Kraken restricts the service to eligible clients outside the United States. The exchange further differentiates where each use case is available.
Kraken states that tokenized stocks can be used as collateral for futures trading in the European Economic Area. For margin trading, Kraken says tokenized collateral support applies in other eligible jurisdictions outside the EEA.
For users, this means they may need to check both their residency and the specific product they intend to trade—futures collateral rules may not mirror margin collateral rules across regions.
Why this fits the push for tokenized assets in mainstream finance
Kraken’s move aligns with a broader industry trend: converting traditionally held financial instruments into tokenized formats that can plug into crypto-native trading, settlement, and financing workflows. In recent months, multiple market participants have focused on expanding the utility of tokenized real-world assets (RWAs) beyond simple custody or spot trading—particularly by making them eligible collateral in regulated-style market infrastructure.
Earlier this year, Franklin Templeton and Binance launched a program that allows institutions to use tokenized money market fund shares as trading collateral while the underlying assets remain in regulated off-exchange custody. BlackRock’s tokenized US Treasury fund, BUIDL, is also described as accepted collateral on Binance, as well as on Crypto.com and Deribit.
Other examples highlight how tokenization is being tested at the level of market operations. Earlier this week, Tradeweb reportedly executed what it said was the first real-time purchase and sale of a tokenized US Treasury settled against tokenized cash on the Canton Network. Taken together, these developments point to experimentation not just with new assets, but with how those assets move through financial plumbing.
RWA.xyz estimates that tokenized real-world assets have grown to roughly $32.6 billion in distributed value, while tokenized stocks rose to about $2 billion from roughly $381 million a year earlier. While these totals don’t measure trading volume alone, they offer a sense of how much tokenized equity exposure has expanded over the past year—making exchanges’ collateral policies more consequential as tokenized products multiply.
What to watch next
With Kraken saying haircuts and collateral limits will be reviewed over time, traders using tokenized stock and ETF collateral should monitor future updates to the eligible asset list and any changes to discount rates. The next key question is whether Kraken expands eligibility beyond the initial 10 instruments and how collateral treatment evolves as tokenized stock and ETF liquidity develops.
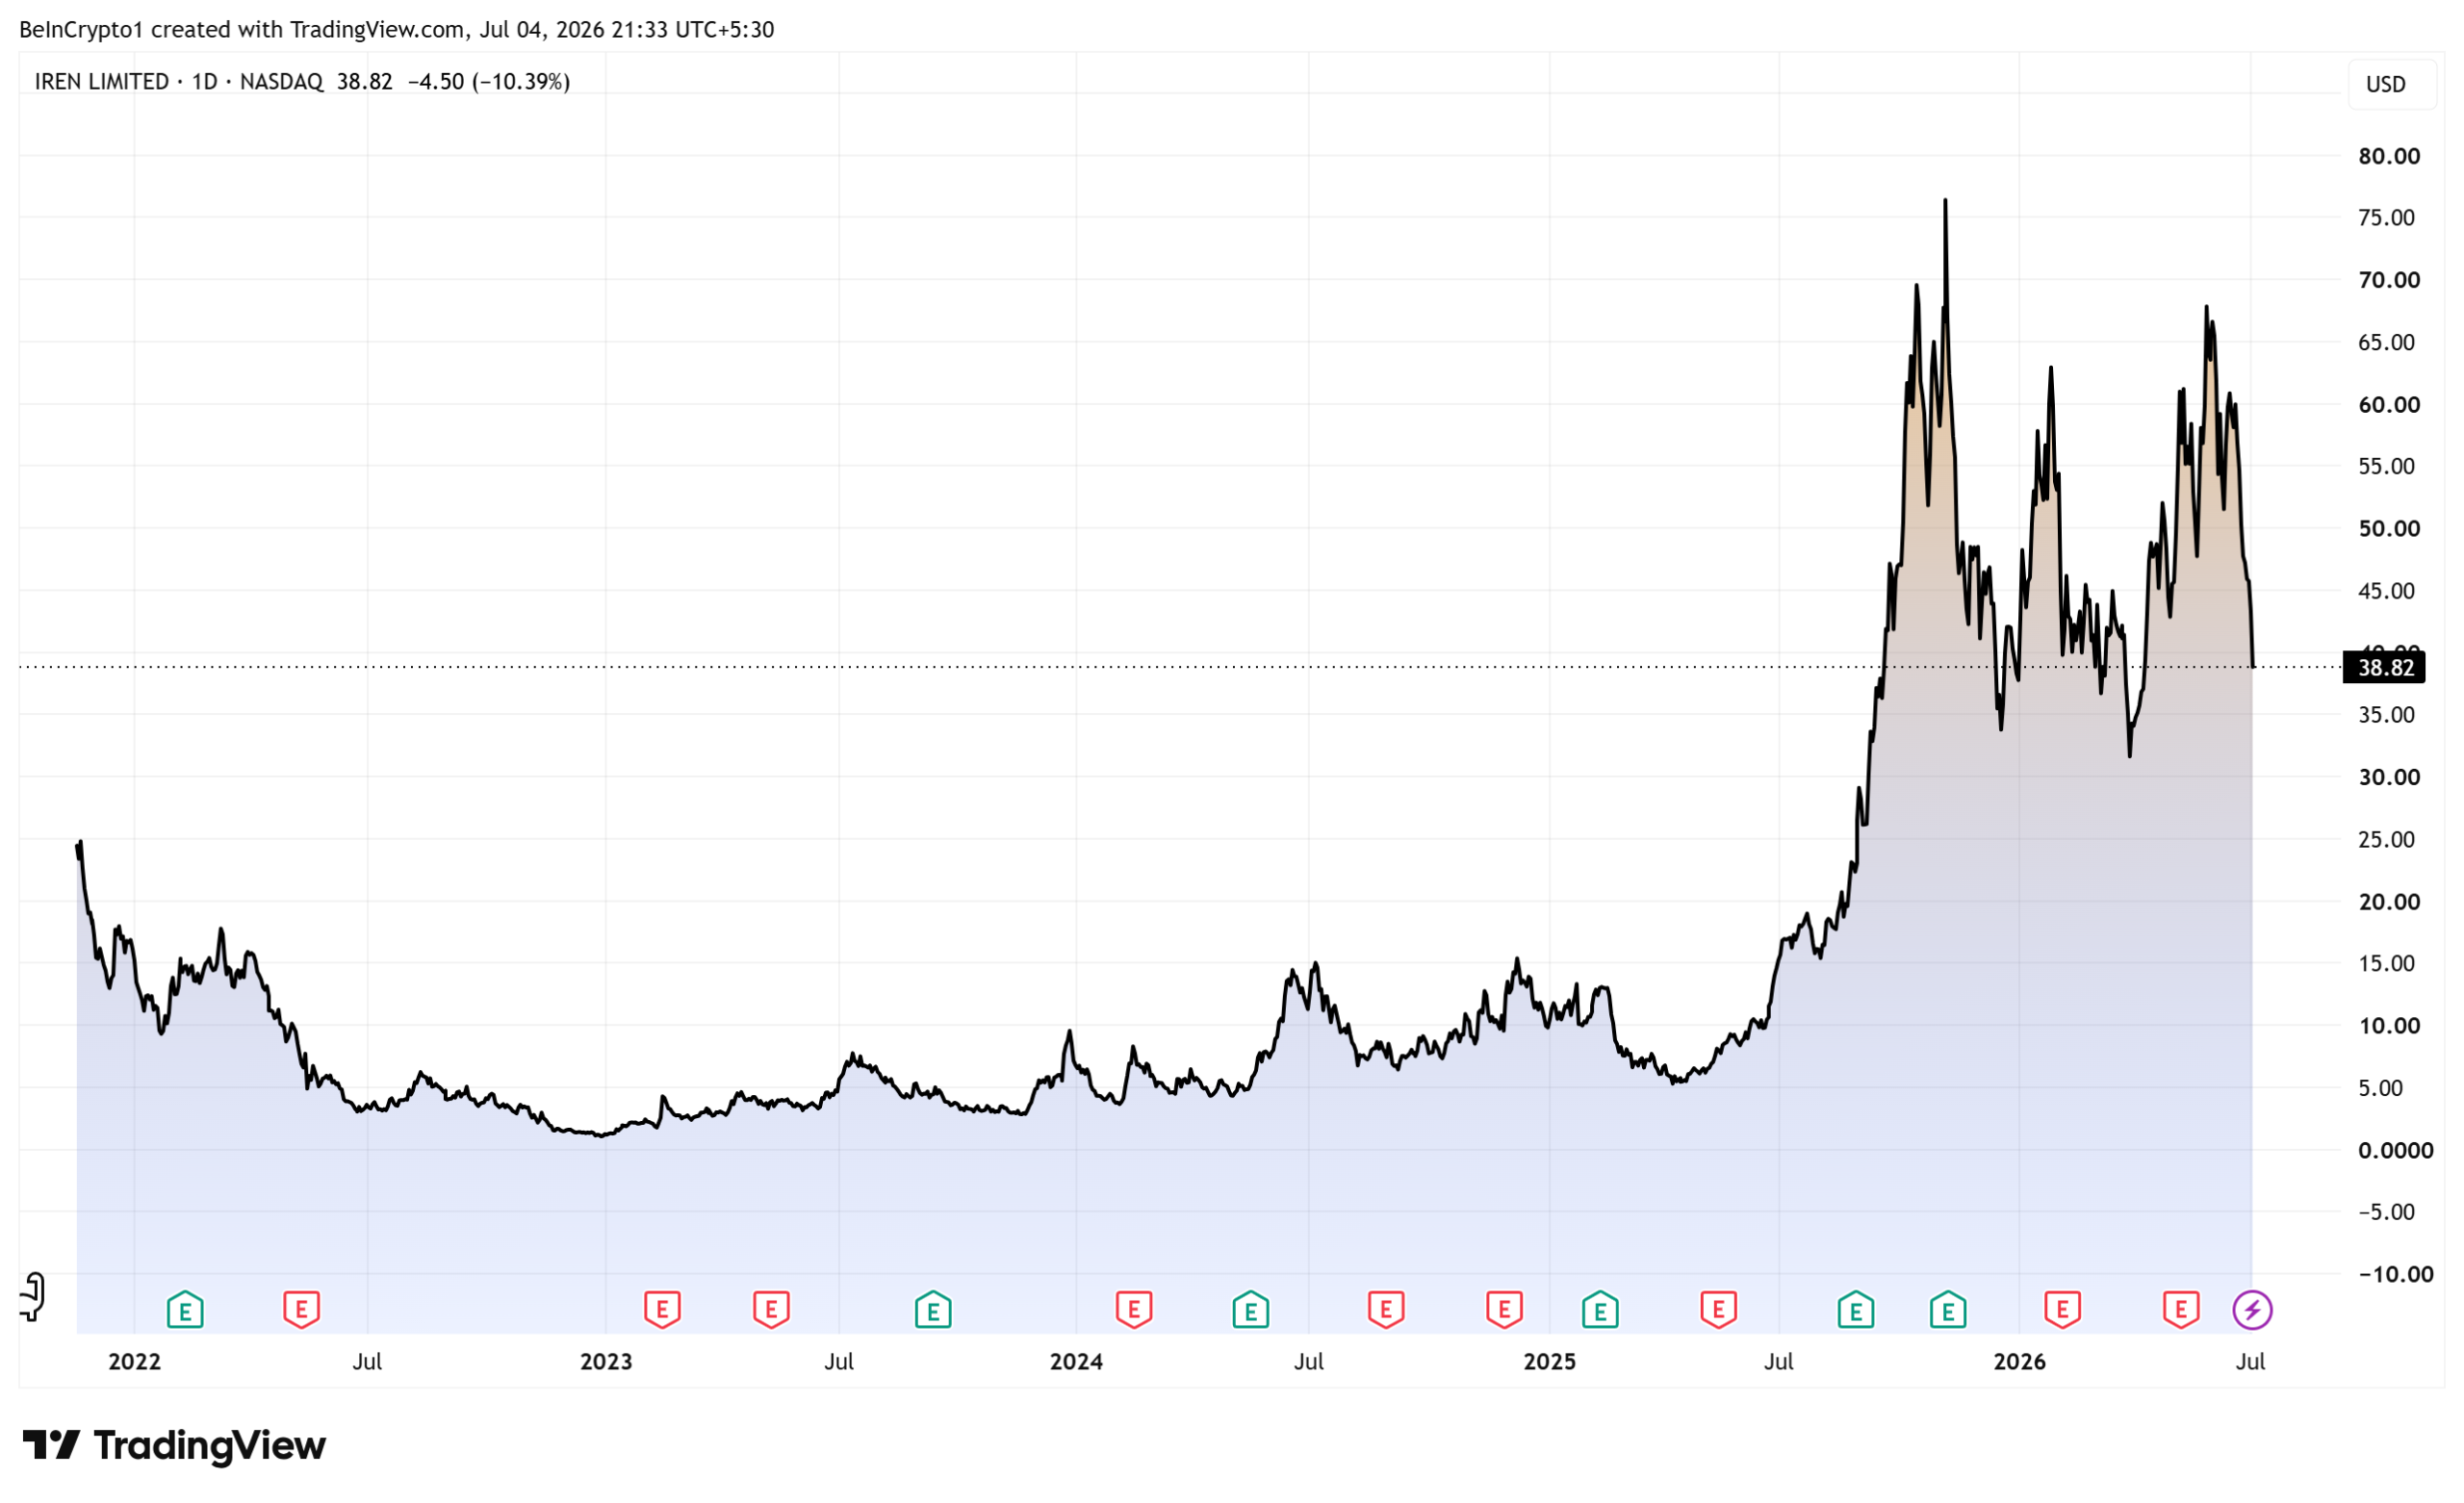
IREN handed its two co-CEOs 18.2 million restricted stock units worth about $700 million, a grant equal to roughly 5% of the company and locked up through fiscal 2033.
The award went to Daniel and William Roberts, the former Macquarie bankers who founded IREN in 2018. Its calendar stretches to the end of the decade, ending on the year a rare piece of founder control expires.
A Grant Built to Run Until 2033
IREN sits among the Bitcoin miner stocks retooling for AI. The board approved 9,099,328 units for each brother on June 30. The units vest over four years, and each tranche is subject to a two-year sale ban.
The last shares come free only in fiscal 2033. Neither executive can collect another equity grant before fiscal 2031.
The timing is not incidental. IREN was listed on Nasdaq in 2021, and the brothers each hold one B Class share that carries 15 votes for every ordinary share they own, per the IPO prospectus.
That gap is wide. In August, each founder held 2.3% of the equity but 21.8% of the vote, IREN’s proxy shows. Together they command nearly 44%.
Those rights expire around November 2033. The Council of Institutional Investors urges dual-class sunsets of seven years or fewer.
The dilution thins their grip further. Share count rose from about 272 million last August to 341 million by March, funding its pivot toward AI compute.
Investors Sold the News
IREN stock fell about 10% to $38.82 on July 2, according to TradingView data. The drop stung even by the standards of volatile crypto mining stocks.

Short seller Jim Chanos flagged the size. He put the award near 17% of IREN’s projected cumulative adjusted net income from fiscal 2027 through 2030. The shares vest on time served, not performance.
Follow us on X to get the latest news as it happens
IREN’s board said it weighed performance and hybrid designs first. It cast the award as the close of a multi-year pay plan.
“The Equity Grants are designed to retain and incentivize the Co-CEOs to lead the Company through its next phase of growth and the execution of its long-term strategic plan,” IREN said in its filing.
By fading founder votes and locking fresh stock to 2033, the deal reads as alignment or entrenchment. The answer will follow the wider mining-to-AI transition and what the brothers deliver.
The post Bitcoin Miner IREN Falls After $700 Million CEO Stock Award appeared first on BeInCrypto.
Kraken has started accepting select tokenized stocks and exchange-traded funds (ETFs) as collateral for futures and margin trading, enabling eligible customers to take leveraged positions without first selling those tokenized holdings.
The feature initially covers 10 tokenized instruments, including major single-name equities such as Apple, Nvidia, and Tesla, as well as tokenized ETFs including Strategy, the SPDR S&P 500 ETF, and Invesco QQQ Trust.
Key takeaways
- Kraken now accepts specific tokenized stocks and ETFs as collateral for futures and margin trading, reducing the need to liquidate existing positions.
- Eligible assets receive risk-based collateral “haircuts,” with broad-market ETFs discounted less than more volatile stocks.
- Collateral limits apply per asset class, with broad-market ETFs capped at up to $1 million in collateral value.
- Access is limited to eligible clients outside the United States; futures collateral in the European Economic Area and margin collateral in other eligible jurisdictions.
How Kraken’s collateral framework works
According to Kraken, each supported tokenized stock or ETF is assigned a collateral haircut, which reduces the lending value of posted collateral depending on perceived risk. Broad-market ETFs receive the lowest discount at 10%, while certain more volatile holdings are discounted more heavily—Kraken states that Strategy and Robinhood are discounted by 30%.
In addition to haircuts, Kraken also set collateral limits for each asset. Broad-market ETFs can be posted up to $1 million in collateral value. Most individual stocks have a limit of $250,000. Tokenized gold and Circle shares are capped at $100,000.
The exchange emphasized that both the haircut percentages and the collateral limits are subject to periodic review and may change over time.
Scope: which tokenized assets are included
Kraken’s initial rollout supports 10 tokenized stocks and ETFs. The list includes widely followed names such as Apple, Nvidia, and Tesla, along with Strategy.
For broad market exposure, the exchange includes tokenized ETF products such as the SPDR S&P 500 ETF and Invesco QQQ Trust. The collateral program also extends to tokenized gold and Circle shares, though these carry different collateral caps compared with the equity and ETF set.
Geographic limits and trading use cases
Kraken said the collateral support is available only to eligible clients outside the United States. Tokenized stocks can be used as collateral for futures trading in the European Economic Area.
Margin collateral support is available in other eligible jurisdictions outside the European Economic Area. Kraken did not indicate that the tokenized-collateral feature is generally available worldwide, so customers should confirm eligibility in their region before planning trades around it.
Why this matters for tokenized markets
Kraken’s decision aligns with a broader push to expand the real-world utility of tokenized assets beyond simple trading. The core investor benefit is straightforward: if tokenized securities can be posted as collateral, they can help users access leverage and financing-style trades without triggering a sale that may be subject to liquidity constraints or other execution considerations.
It also fits into a wider pattern of exchange and market infrastructure developments aimed at making tokenized securities usable across more parts of capital markets—particularly as collateral, settlement components, and building blocks for structured lending.
For example, earlier this year, Cointelegraph reported that Franklin Templeton and Binance launched a program allowing institutions to use tokenized money market fund shares as trading collateral while the underlying assets remained in regulated off-exchange custody. Separately, BlackRock’s tokenized US Treasury fund, BUIDL, has been accepted as trading collateral on platforms including Binance, Crypto.com, and Deribit, reflecting growing interoperability for tokenized government and cash-like instruments.
Other market plumbing has also been advancing. Cointelegraph noted that Tradeweb executed what it described as a first real-time purchase and sale of a tokenized US Treasury settled against tokenized cash on the Canton Network. While those developments differ in mechanism from Kraken’s collateral haircuts, they collectively point to a trend: tokenized assets are increasingly being integrated into the operational flows that support trading and financing.
Market growth signals: tokenized stocks remain a fast-rising segment
Data compiled by RWA.xyz suggests tokenized real-world assets have grown to roughly $32.6 billion in distributed value. Within that broader total, tokenized stocks reportedly increased to about $2 billion from approximately $381 million a year earlier.
That growth backdrop helps explain why exchanges are moving to make tokenized holdings more functional. As the number and variety of tokenized securities increase, collateral acceptance can become a competitive differentiator—especially for users who want to maintain exposure while accessing leverage or margin capacity.
For readers tracking the sector, RWA.xyz maintains an accessible overview of tokenized stock distribution, including categories under RWA.xyz stocks.
Going forward, investors and traders should watch for Kraken’s next rounds of updates: whether additional tokenized equities and ETFs are added, how haircuts and collateral caps change with volatility and market conditions, and how the exchange expands availability across jurisdictions outside the United States.


NYLIM was the latest entrant to the list of asset management giants making moves in tokenization, teaming up with Centrifuge (CFG) to bring one of its high-yield corporate bond strategies onchain.
For NYLIM, tokenization is less about launching blockchain versions of existing funds than improving how portfolios are assembled.
Sy said customized investment strategies often combine ETFs, bonds, private credit and other assets, creating operational complexity that makes personalization difficult to scale.
“The end goal is to embed the customization within the asset itself, rather than the customization sitting around the operations around the different assets,” he said.
Tokenization could also streamline transfer agency, settlement and other back-office processes, reducing costs that ultimately benefit investors.
“If you can bring that down by 10% or 20%, that’s a better outcome for our clients,” Sy said.
DeFi awaits
Sy said stablecoins have become the first practical bridge bringing traditional financial institutions onchain.
The stablecoin market has grown to over $300 billion, and its increasingly used for cross-brder payments
As banks, payment firms and fintech companies adopt stablecoins for cross-border payments and treasury management, many will eventually look for institutional-grade tokenized assets where those balances can earn yield instead of remaining in cash.
“Stablecoins were probably one of the biggest unlocks in the past two years,” Sy said. “Adopting stablecoins was the gateway to get them onchain.”
Crypto exchange Kraken has begun accepting select tokenized stocks and exchange-traded funds (ETFs) as collateral for futures and margin trading, allowing eligible users to open leveraged positions without selling their holdings.
The feature initially supports 10 tokenized stocks and ETFs, including Apple, Nvidia, Tesla, Strategy, the SPDR S&P 500 ETF and Invesco QQQ Trust. Eligible users can post those holdings as collateral without selling them first.
Each eligible asset is assigned a collateral haircut that reduces its lending value based on risk. Broad-market ETFs receive the lowest haircut at 10%, while more volatile stocks such as Strategy and Robinhood are discounted by 30%.
Kraken also imposed collateral limits on each asset, with broad-market ETFs capped at up to $1 million in collateral value, most individual stocks at $250,000 and tokenized gold and Circle shares at $100,000. The exchange said both collateral limits and haircuts will be reviewed periodically and remain subject to change.
The feature is available only to eligible clients outside the United States. The exchange said tokenized stocks can be used as collateral for futures trading in the European Economic Area, while margin collateral support is available in other eligible jurisdictions outside the bloc.
Related: STS Digital launches structured crypto platform with Kraken as first partner
The launch comes about a week after Kraken partnered with Maple to launch an onchain warehouse financing facility for institutional crypto lending, allowing the exchange to expand its lending business through blockchain-based structured credit.
Tokenized assets gain broader financial utility
Kraken’s move adds to a series of efforts aimed at expanding the role of tokenized real-world assets in financial markets. Recent launches have focused on using blockchain-based securities as collateral, settlement assets and components of institutional lending infrastructure.
In February, Franklin Templeton and Binance launched a program allowing institutions to use tokenized money market fund shares as trading collateral while the underlying assets remained in regulated off-exchange custody. BlackRock’s tokenized US Treasury fund, BUIDL, is also accepted as trading collateral on Binance, as well as Crypto.com and Deribit.
Earlier this week, Tradeweb executed what it said was the first real-time purchase and sale of a tokenized US Treasury settled against tokenized cash on the Canton Network.
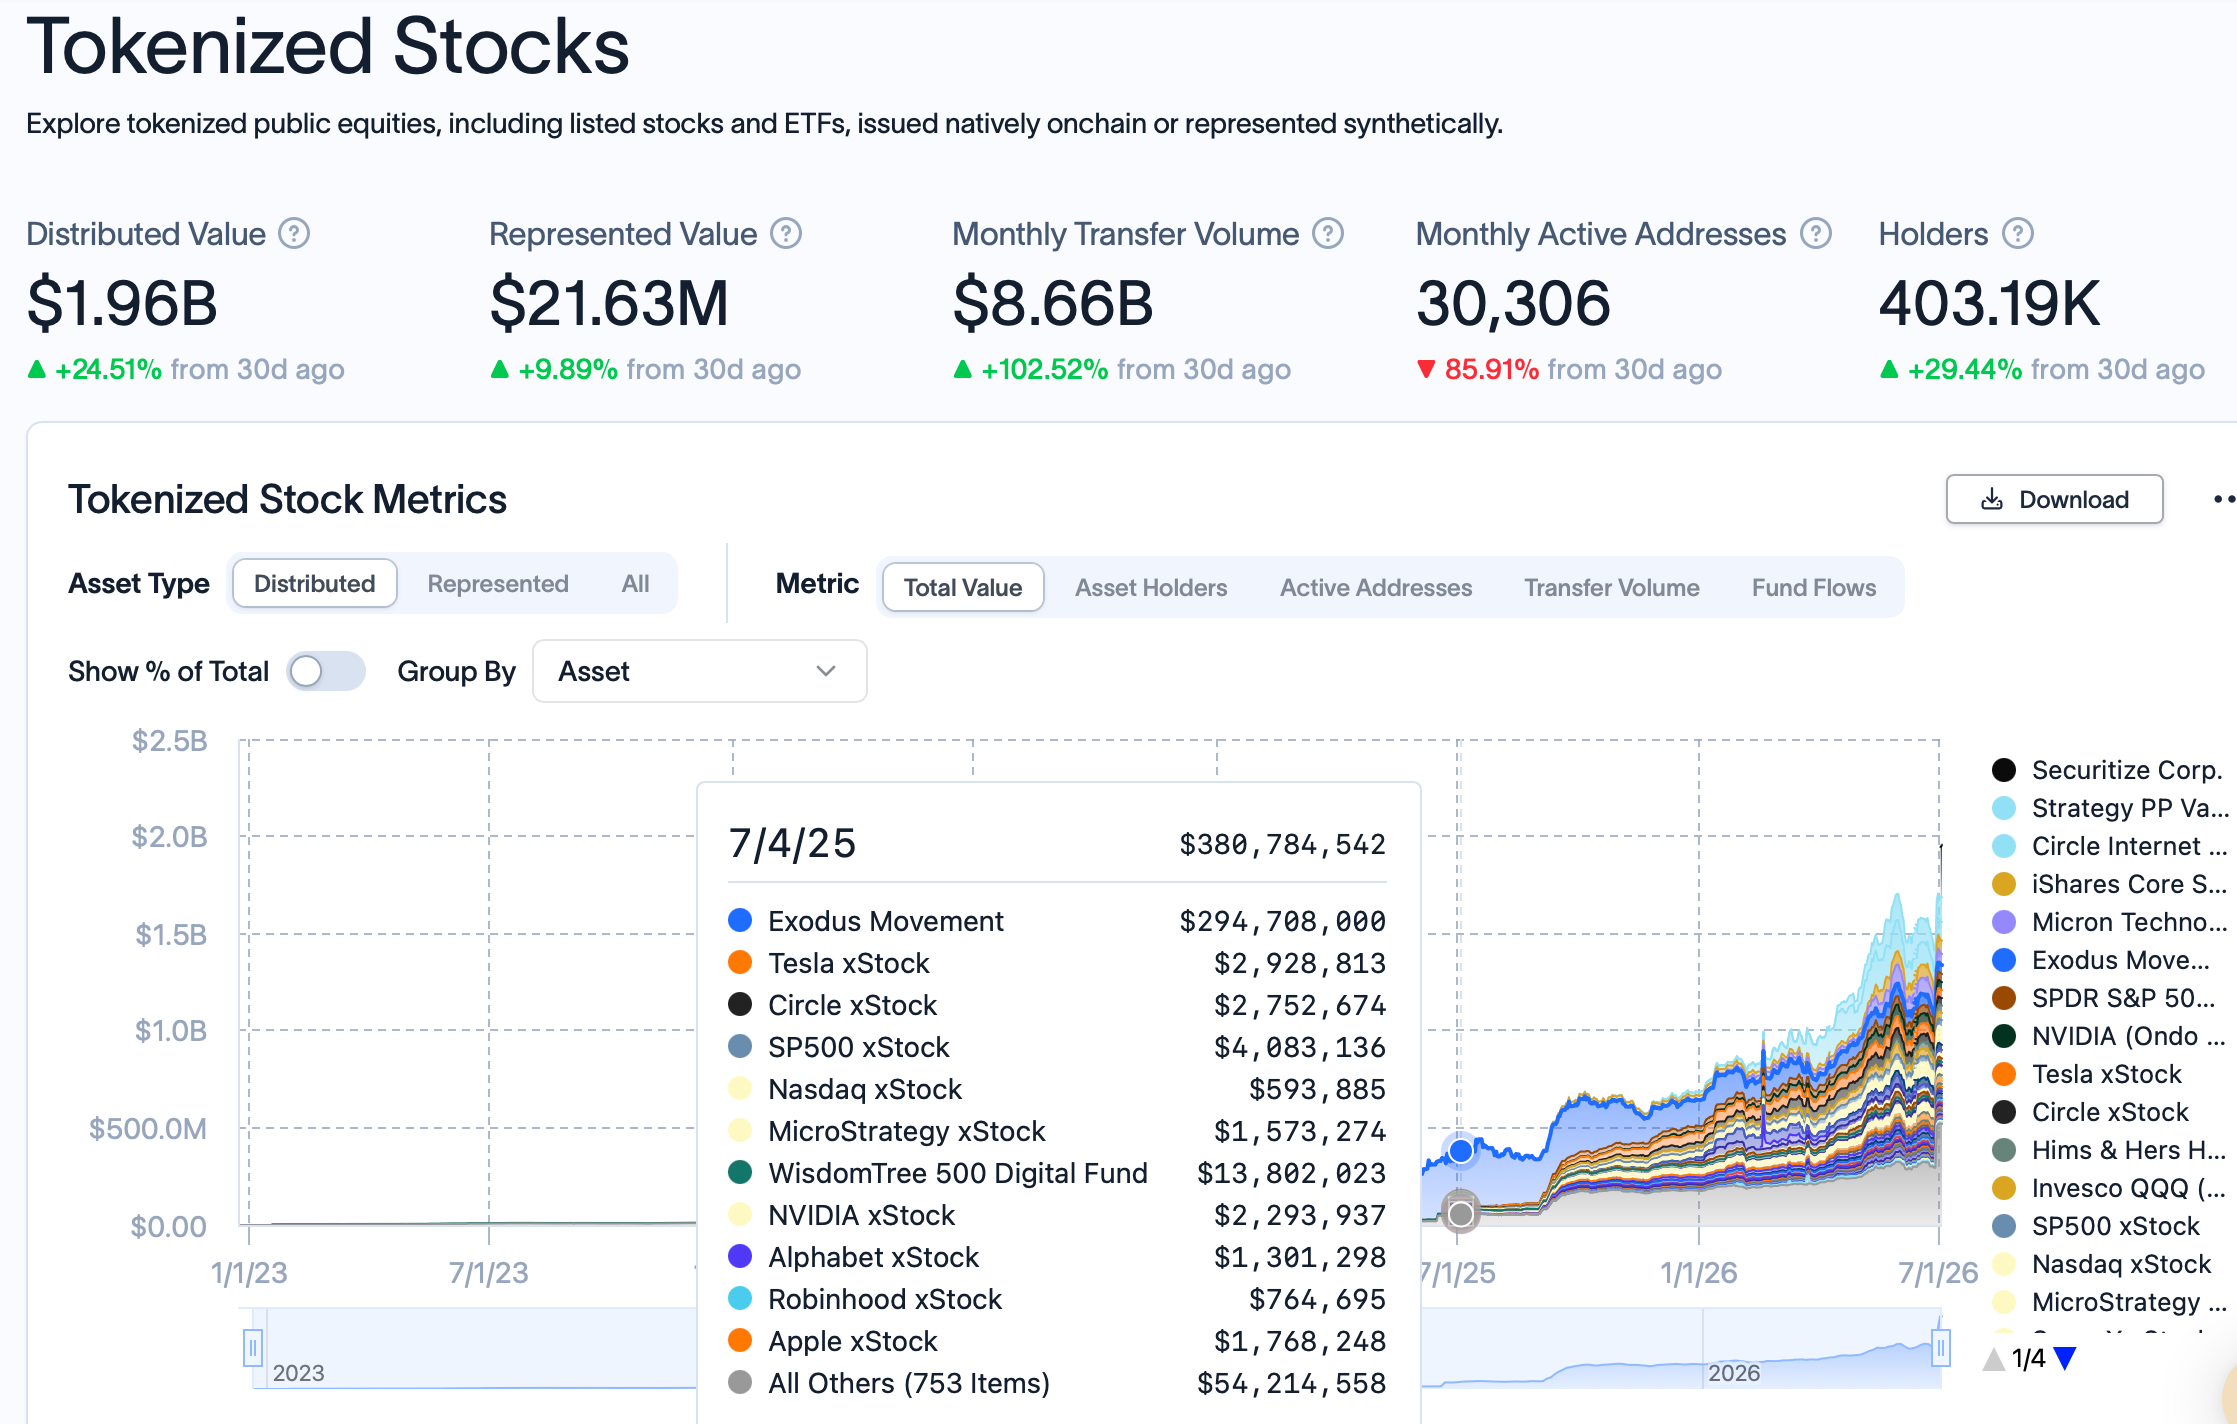
According to RWA.xyz, tokenized real-world assets have grown to roughly $32.6 billion in distributed value, while tokenized stocks have climbed to about $2 billion from roughly $381 million a year earlier.
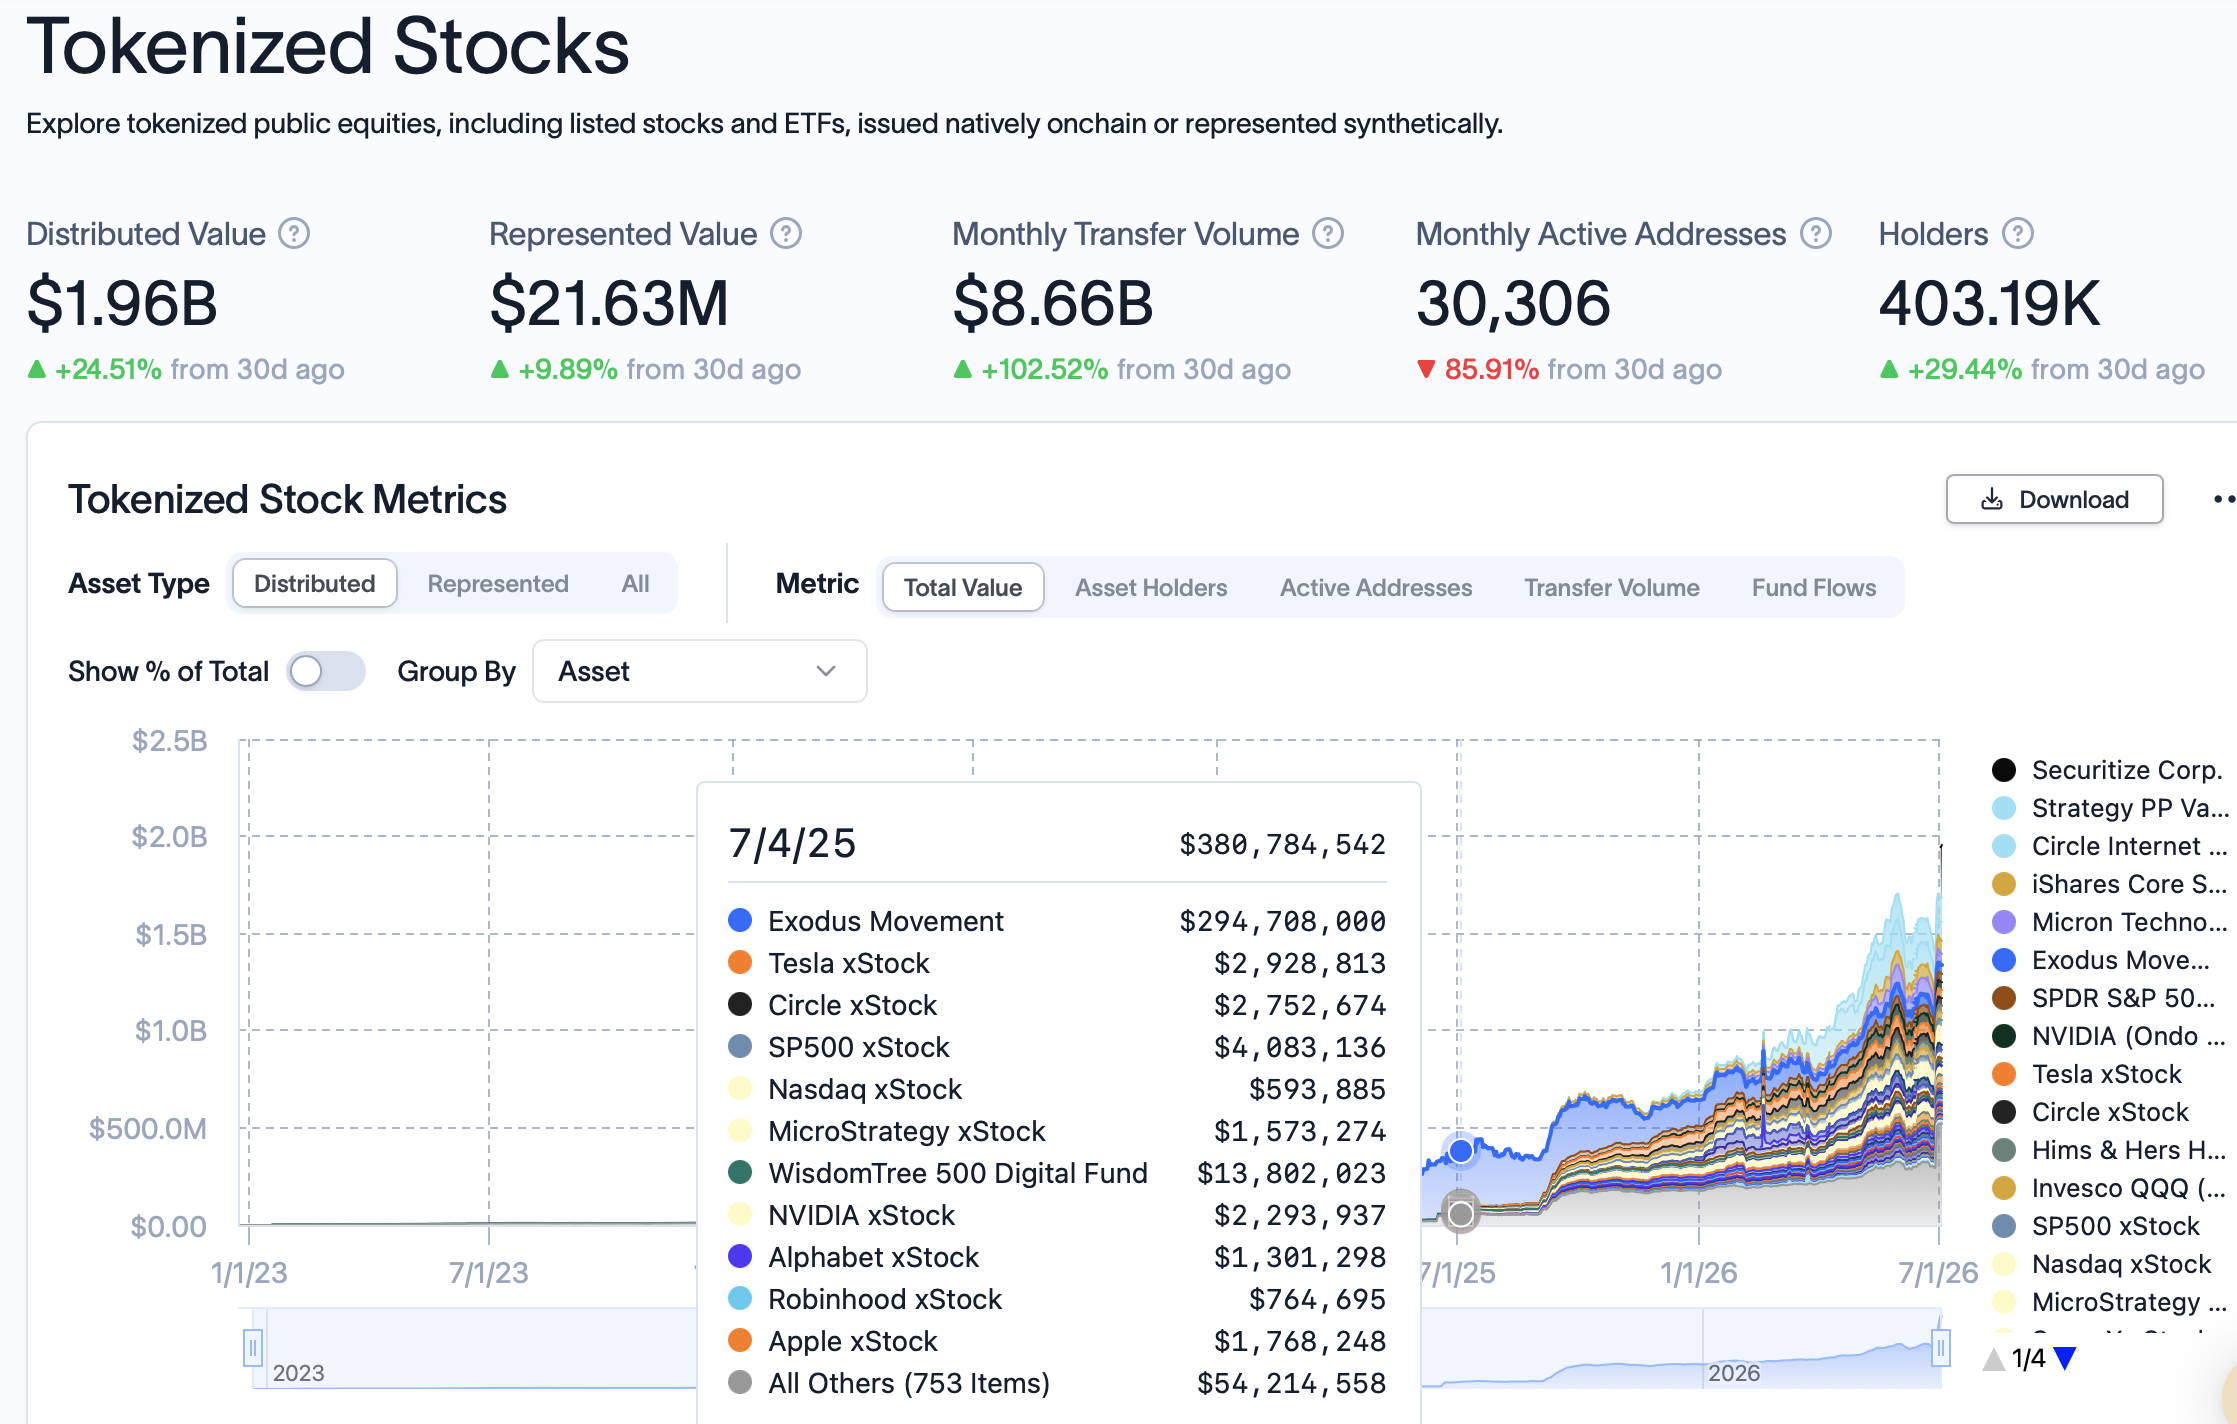
Source: RWA.xyz
Magazine: Japanese pension fund tips 1% in crypto, G7 urges action on NK hackers: Asia Express
The last trading day of the previous business week finally brought some more net inflows rather than consistent outflows for the spot Bitcoin ETFs in the United States.
The products tracking the world’s largest altcoin had even more to celebrate at the end of the week, but still closed in the red.
The Good and the Bad: BTC ETF Edition
There’s no need to sugarcoat the end result – the week was still dominated by the bears. Investors pulling out funds from the spot Bitcoin ETFs withdrew $526.64 million throughout the four-day trading week. This means that the overall negative streak continues as the products have not seen a single green week in almost two months.
Within this timeframe, the total cumulative flows have dumped from $59.34 billion to $51.08 billion. July 1 saw the most daily withdrawals, with $294.62 million leaving the funds, according to SoSoValue data. Another $222.64 million went out on June 30 and $231.10 million on June 29. That’s all on the negative side.
The bright side was July 2. After 10 consecutive days of only net inflows, the streak was broken as investors poured in $221.72 million. Moreover, this was the highest single-day inflow recorded since May 5. Friday was a non-trading day due to the July 4 holiday, meaning that the week ended on a more positive note.

Ethereum ETF Edition
The daily performance of the financial vehicles tracking ETH was even more promising. The Ethereum ETFs saw more modest $30.04 million withdrawals on June 29 and $27.60 million on June 30. However, the tides turned during the next two business days.
Investors poured in $14.89 million on Wednesday and $29.08 million on Thursday, marking a near-monthly high. Nevertheless, the week still ended in the red, with total net outflows of $13.67 million. As such, the negative streak of the Ethereum ETFs continues, with eight straight weeks in the red. The total cumulative flows are down from $12.09 billion in early May to $10.89 billion on Thursday.
On the more positive side, though, it was a lot less harmful than the $273.34 million taken out during the previous business week.
The post Bitcoin ETF Recap: Another Tough Week Despite a Few Bright Spots appeared first on CryptoPotato.


June delivered the worst month in the history of United States spot Bitcoin ETFs, with more than $4 billion pulled and 2026 flows turning negative for the first time. Over the same 2 weeks, the largest wallets on the network absorbed 270,000 BTC. One of these cohorts is going to be wrong, and the last 3 cycles say which one it usually is.
Summary
- U.S. spot Bitcoin ETFs saw record June outflows, with more than $4 billion leaving as institutional risk appetite weakened.
- Whale wallets accumulated about 270,000 BTC worth $16.7 billion during the same period, signaling strong on-chain buying.
- The split suggests Bitcoin’s next move depends on whether ETF flows recover or macro pressure forces another leg lower.
Two things happened in the Bitcoin market in the second half of June, and they cannot both be right.
The first happened in brokerage accounts. United States spot Bitcoin ETFs bled $4.06 billion in June, the worst calendar month since the products launched in January 2024, surpassing the previous record of $3.56 billion set in February 2025.
Depending on where the cutoff lands, some counts put the figure closer to $4.5 billion. The bleeding was not a single bad week: it followed a record 13-day outflow streak from mid-May that had already drained $4.37 billion, and by month-end the funds were net negative for 2026 as a whole, the first time cumulative yearly flows have gone red since the ETFs existed. The largest fund did most of the draining, shedding roughly $3.55 billion on its own.
The second happened on-chain. Over the final 2 weeks of that same stretch, wallets classified as whales accumulated more than 270,000 BTC, roughly $16.7 billion at prevailing prices, according to Bitfinex analysts. The buying happened while the spot premium, a gauge of how aggressively United States buyers are bidding, stayed negative, meaning the demand was not coming from American spot desks. Glassnode’s cohort data confirmed the shift from a second angle: long-term holders flipped back to net accumulation across wallet sizes at the start of July, even as the ETF prints stayed red.
$4 billion walked out one door while $16 billion walked in another. That is not noise. That is the two most-watched capital cohorts in this market taking opposite sides of the same trade at the same prices, and the resolution of that disagreement is the Bitcoin story for the rest of the year.
The month that broke the ETF narrative
The scale of June’s institutional retreat deserves its own accounting, because the spot ETFs were supposed to be the structural bid that made this cycle different.
The pitch, repeated across 2 years of allocator decks, was that regulated wrappers would convert Bitcoin from a sentiment asset into an allocation, with sticky advisory money arriving in measured percentages and staying through drawdowns the way it stays in equity funds.
For most of 2024 and 2025, the pitch held: inflows compounded, the products swallowed multiples of new mined supply, and every dip met a wrapper-shaped bid. June was the first month that tested the sticky part of the story at scale, and the answer was unambiguous. Faced with a real macro shock, the allocation behaved exactly like every other risk allocation in the book, which is to say it left, on schedule, through the most liquid exit, without ceremony.
Price told the top-line story: Bitcoin fell from around $74,000 to near $58,000 across the month, touched 21-month lows, and closed a week below its 200-week moving average for the first time since 2023, a line that has historically marked deep cycle lows and long accumulation zones. Sentiment followed price into the basement, with the Fear and Greed Index pinned between 11 and 15, deep in extreme fear, through the back half of the month. Retail’s search behavior matched the mood: queries for Bitcoin going to 0 hit record highs earlier this year, and broader crypto search interest has only recently begun recovering from 1-year lows.
The flow mechanics beneath the price were the real damage. As crypto.news reported when the record was confirmed, the Coinbase Premium stayed negative through June, apparent demand stayed deeply negative, and ETF redemptions became the dominant driver of daily price action, averaging out to roughly $180 million to $200 million in net selling per trading day. When the products finally printed a green day on July 2, a $221 million inflow that ended a 10-day losing streak, the breadth told its own story: One fund took in $166 million while the largest fund was still bleeding $40 million on the day flows supposedly turned.
Three forces stacked up to produce the exodus. Macro did the heavy lifting: May inflation printed a hot 4.2%, the Federal Reserve spent June sounding restrictive, and institutional risk mandates de-allocate mechanically when real-rate expectations rise, without any view on Bitcoin specifically. Regulatory whiplash added a second layer, with the market structure fight in the Senate stalling and starting through the month, leaving custody and licensing frameworks unresolved for exactly the institutions the ETFs serve. And a third force was more mundane: competition for risk capital.
The SpaceX listing raised $75 billion in the middle of the drawdown, the largest liquidity event in market history, and some of the money that would otherwise have sat in crypto risk simply had somewhere more exciting to be, a dynamic that carried straight into the tokenized trading frenzy around the stock.
Whatever the weights on those three, the conclusion the flows describe is uniform: the marginal institutional holder of wrapped Bitcoin spent June getting out.
Inside the machine that sold
The phrase ETF outflows compresses a mechanical process worth uncompressing, because the mechanics explain why the selling was so relentless and why it can reverse just as mechanically.
Spot Bitcoin ETFs do not hold sentiment; they hold coins against shares. When holders sell more shares than buyers absorb, authorized participants redeem the excess, the fund sheds Bitcoin, and the coins hit the market as programmatic supply. Through June, that redemption machine ran nearly every session, and the composition mattered as much as the total.
The largest fund was the epicenter, accounting for roughly $3.55 billion of the month’s bleed on its own, which reads less as 1,000 small investors leaving and more as a handful of very large allocators de-risking through the deepest door available. Smaller funds bled proportionally less, and when the streak finally broke on July 2, the breadth stayed poor: the $221 million net inflow decomposed into one rival fund absorbing $166 million while the flagship still lost $40 million.
A genuine flow regime change looks like several consecutive green days across the complex, led by the largest fund; one day of one fund catching a falling knife does not qualify, and desks that trade these flows professionally treat anything less than 3-5 confirming sessions as noise.
The forced-seller identity question has a partial answer in the parallel stress that ran through the corporate treasury complex during the same weeks. Strategy’s preferred shares sold off hard enough that Bitwise published a note framing the episode as a late-cycle leverage unwind, with over-extended structures deleveraging while institutions positioned to replace them as the marginal buyer. Miners added their own supply, with MARA’s reported $1.5 billion Bitcoin sale putting the biggest corporate mining treasury on the sell side just as ETF redemptions peaked.
Add the SpaceX raise vacuuming $75 billion of risk appetite out of the same investor base, and June’s selling resolves into something more specific than fear: a synchronized deleveraging across every wrapped, leveraged, and mandated form of Bitcoin exposure at once, while the unwrapped form of the asset quietly changed hands underneath.
That specificity matters for what comes next. Deleveraging events are finite by construction: forced sellers run out of the thing they are forced to sell.
Sentiment-driven bear markets can grind for years, but a leverage unwind ends when the leverage is gone, and several of June’s selling engines, the redemption streak, the preferred-share stress, the miner treasury sales, have visibly decelerated into July.
The buyers who showed up anyway
Now the other side of the ledger, because it is bigger.
The 270,000 BTC that whale wallets absorbed in 2 weeks is not a normal accumulation print. It is more than the entire ETF complex sold in the month, absorbed in half the time, at prices between roughly $58,000 and $62,000. The negative spot premium during the buying window is the detail that locates the buyers: this demand was not United States spot desks and not the ETF creation mechanism. It was large holders, a category that spans exchanges, custodians, early-cycle capital, and entities that never touch a regulated wrapper, taking delivery while the wrapper crowd distributed.
Glassnode’s supply data adds the pain context that makes the accumulation more notable, not less. At the start of July, roughly 10.8 million BTC sat at an unrealized loss against 9.2 million in profit, a ratio that historically appears near capitulation zones, not near tops. Long-term holders turning to net accumulation into that kind of tape is the specific pattern that marked the depths of 2022 and the pre-ETF trough of 2023: the coins move from stressed hands to patient ones before any recovery shows up in price, and the transfer is only visible in hindsight to anyone watching price alone.
The whale cohort’s composition is admittedly opaque, and honest analysis says so. Wallets above 1,000 BTC are a crude proxy that includes exchange consolidation, custodial reshuffling, and over-the-counter settlement alongside genuine conviction buying. But the 2-week scale, the direction, and the corroboration from long-term holder metrics make the benign explanations hard to stretch across the whole print. Someone with size decided that sub-$60,000 Bitcoin was a purchase, at the exact moment the most regulated distribution channel in the asset’s history was running in reverse.
There is also a rotation story inside the accumulation. The buying coincided with capital moving toward on-chain yield and infrastructure rather than away from crypto entirely: tokenized real-world assets crossed $20 billion in on-chain value, and Solana, the strongest major through the drawdown, rose about 15% since early June with tokenized asset transfers on the network up 120% to $8.53 billion, extending the performance gap that has defined the L1 race all year. The pattern suggests large investors were not abandoning the asset class. They were leaving the most liquid, most scrutinized wrapper and taking positions closer to the metal.
That rotation reframes what the ETF outflows even measure. The funds were sold to the world as the institutionalization of Bitcoin, and their flows became the market’s favorite proxy for smart money. June exposed the proxy’s limits: the wrapper tracks one specific investor type, the benchmark-constrained allocator, whose behavior is the most macro-sensitive and least conviction-driven in the entire holder base.
The actual institutional spectrum now runs from those allocators through corporate treasuries, miners, sovereign-adjacent funds, and on-chain natives, and in June those groups pointed in three different directions at once. Reading Bitcoin through ETF flows alone in this market is like reading equities through one mutual fund complex: informative, loud, and structurally incomplete.
What the divergence has meant before
Splits between institutional flows and on-chain accumulation are rare enough to have a track record, and the track record leans one way.
The clearest precedent predates the ETFs: through late 2022 and 2023, while the Grayscale trust traded at a discount that made institutional sentiment look terminal, and every regulated access story was going backward, large wallets accumulated through the low $20,000s and teens. The buyers who tracked institutional sentiment missed the bottom; the ones who tracked coins on the move caught it.
February 2025 offered a smaller rehearsal of the current setup, with the then-record $3.56 billion ETF outflow month arriving alongside stubborn on-chain absorption, followed by recovery once the macro trigger faded. Bitfinex analysts framed June’s version explicitly in those terms: simultaneous institutional selling and whale accumulation is the pattern that has appeared near past cycle lows, where long-term holders take supply off sellers before the recovery reaches price.
The pattern’s logic is structural, not mystical. ETF flows are downstream of mandates, benchmarks, and quarterly reviews, which makes them systematically late in both directions: the wrapper crowd bought the top of the euphoria and is now selling the bottom of the fear, because that is what risk-managed allocation does. On-chain whales answer to no committee. When the two disagree, the disagreement itself is the signal, because it marks the moment coins transfer from mandate-driven hands to conviction-driven ones.
Retail sentiment data rounds out the historical picture from the contrarian side. Record-high searches for Bitcoin going to 0, extreme-fear readings pinned for weeks, and supply majority-underwater have each individually marked accumulation zones in prior cycles; their simultaneous appearance alongside documented whale absorption is the full bingo card. The caveat that keeps the pattern honest is that sentiment extremes date bottoms only in retrospect, and the same indicators flashed for months through late 2022 while price kept sliding. Fear confirms opportunity for buyers with time horizons measured in years. It punishes everyone else.
None of that makes the signal infallible, and the bear case deserves its full weight. A divergence is not a timing tool: whales were also early in 2022, absorbing supply months before the actual low, and anyone who leveraged the accumulation thesis got carried out before being proven right.
The macro trigger has not disarmed, either. The next inflation print is the live variable, and a hot number would reload the exact mechanism that drained $4 billion in June, since nothing about whale accumulation prevents mandate-driven funds from selling more. Bitwise’s read of the parallel stress in Strategy’s preferred shares, that the market is working through a late-cycle leverage unwind, cuts both ways: unwinds end at bottoms, but they end violently, and the last leg is usually the worst one.
Reading the whale cohort honestly
The 1,000 BTC threshold that defines a whale wallet captures several very different animals, and the interpretation of the accumulation depends on which ones did the buying.
The most bullish reading assigns the coins to conviction capital: family offices, early holders reloading, sovereign-adjacent vehicles, and the class of buyer that accumulates through over-the-counter desks precisely to avoid moving the price. The negative spot premium through the buying window supports this reading, since it rules out the visible United States bid, and OTC accumulation into weakness is the classic signature of patient size.
The most boring reading assigns some of the movement to plumbing: exchanges consolidating cold storage, custodians migrating wallets, and settlement flows that inflate cohort statistics without expressing any view. The truth is a blend, and serious on-chain analysts hold the number loosely for exactly that reason.
Two cross-checks tilt the blend toward conviction. The first is the long-term holder metric, which is behavior-based instead of size-based: coins that have not moved in months turning into net accumulation is hard to generate with custodial reshuffling, and Glassnode flagged that shift across cohorts at the start of July. The second is the duration of the pattern. Wallet consolidation is lumpy and episodic; the June accumulation ran daily, through a 2-week window, against a falling price, which is the shape of a program, not a migration. Whoever was executing wanted more Bitcoin every day the price stayed under $62,000, and got it.
It is also worth noting who the whales are buying from, because supply has a face too. The ETF redemptions put a regulated, auditable seller on the tape every session. Miners under margin pressure added inventory. Short-term holders who bought the $70,000s capitulated at 21-month lows, the behavior that pushed over half the supply underwater. The full picture is a wealth transfer with unusually clean bookkeeping: from leveraged, mandated, and exhausted hands into large, unhurried ones, at prices the buyers evidently considered a discount.
The scenario map from $62,000
Divergences resolve, and this one has three plausible endings with watchable triggers.
The repair scenario is the historical base case. Macro softens, the July inflation print cooperates, ETF flows string together green sessions with breadth, and the price reclaims the 200-week average, converting June into another entry in the ledger of cycle lows that on-chain accumulation called early. The whales’ entry zone between $58,000 and $62,000 becomes the level the market defends, because the buyers who own it have shown they defend it. Confirmation looks like the flagship fund flipping to inflows and $62,500 breaking on volume.
The chop scenario is the underpriced one. Inflation stays sticky without spiking, the Fed stays parked, and the market grinds sideways for a quarter while ETF flows oscillate around 0. Whale accumulation in this world is early rather than wrong, the 2022 pattern, where large wallets absorbed supply for months before price agreed with them. The tell is time: patient capital does not mind, leveraged capital dies, and funding rates across the perpetuals complex show which cohort is being tested week by week.
The break scenario is the one the bears own. A hot CPI reloads the redemption machine, the 200-week average rejects the recovery, and $58,000 fails, opening the trapdoor toward the low $50,000s that technicians have flagged since the June breakdown. Even then, the divergence data offers the bears only half a victory: it would mean the whales were early again, not that the transfer did not happen, and every prior cycle says the coins that moved in June do not come back out at these levels regardless of what the next quarter’s candles look like.
There is one more asymmetry the bulls gloss over: the two cohorts do not experience being wrong the same way. If the whales are early, they wait, unleveraged and unbothered, the way they waited through 2022. If the ETF sellers are wrong, they will buy back in at higher prices, book the round trip as risk management, and their investors will barely notice. The divergence is a strong signal about where coins are going and a weak one about when price follows, and conflating those two claims is how retail traders turn a sound accumulation thesis into a liquidation.
The tape since the split
The first days of July have started scoring the disagreement, gently, in the whales’ favor. Fed chair Kevin Warsh acknowledged at the Sintra forum that inflation expectations had come down, and Bitcoin jumped more than 4% through $61,000 on the repricing of rate-hike risk. Two days later, a soft jobs report, 57,000 payrolls against expectations near 100,000 with 74,000 in downward revisions, extended the move, and Bitcoin printed $62,310 on Friday, its strongest level in 10 days, while equities set records and the ETF complex managed its first inflow in 2 weeks.
The checkpoints from here are unusually clean. Flows first: One $221 million day against a month of $4 billion proves nothing, and systematic desks want several consecutive green sessions with breadth across funds, including the largest one, before treating the reversal as a regime change rather than a bounce. Price second: $62,500 is the resistance the whole market is watching, and the 200-week average overhead is the structural line that separates a reclaimed cycle from a broken one. Macro third: the next CPI print either confirms Warsh’s softening or reloads the outflow machine.
And underneath all three sits the quieter metric that started this story: whether the coins keep moving to hands that do not sell on committee schedules. The divergence will close one way or the other, because it always does. Either the ETF sellers return as buyers at higher prices, which is how every prior version of this split resolved, or the whales have mistimed a macro regime that mandate money saw first, which would be a first. $16 billion in 2 weeks says the largest holders in the market have already placed their answer. The exit Wall Street used in June is still open. It is just worth noticing who was standing on the other side of it, catching everything that came through.
Disclaimer: This article is for informational purposes only and does not constitute investment advice. Digital asset markets are volatile, and you can lose your entire investment. Always do your own research. Information current as of July 4, 2026.

Prediction markets logged a striking surge in June, and the catalyst was unmistakable: the 2026 FIFA World Cup. According to DefiLlama, Kalshi processed nearly $9.4 billion in trading volume during the month, compared with about $5.3 billion in May. Polymarket International also rose to roughly $4.3 billion from approximately $3.5 billion the previous month.
The tournament began on June 11 and is the first FIFA World Cup to expand to 48 teams. Earlier coverage from CNBC reported that the competition became the biggest driver of prediction market activity in June, citing Dune Analytics data showing record notional volumes on both Kalshi and Polymarket.
Key takeaways
- Kalshi’s June trading volume nearly reached $9.4B, up from about $5.3B in May, with the World Cup serving as the primary driver.
- Polymarket International climbed to about $4.3B in June from roughly $3.5B in May, mirroring broader interest in football-related contracts.
- World Cup Round-of-16 matchups showed especially heavy participation, with some markets generating tens of millions in volume.
- The growth in trading volume is occurring alongside intensifying U.S. legal and regulatory pressure on prediction markets.
World Cup expansion meets prediction market demand
Football has long been a natural fit for markets where participants want to express views on outcomes. But this year’s tournament offers a larger menu of games and implications. With the World Cup expanding to 48 teams—up from 32 in previous editions—the number of match results, advancement scenarios, and related questions naturally multiplies, giving traders more opportunities to place event-linked bets.
CNBC’s reporting, referenced in the source, framed the World Cup as the dominant driver of June activity. It tied the surge to Dune Analytics figures indicating record notional trading volumes on both platforms, aligning with the month-over-month jump visible in DefiLlama’s protocol-level data.
Round-of-16 matchups pull in the highest volume
As the tournament moved into the knockout stage, trading activity concentrated further around high-stakes fixtures. One example highlighted in the source was Canada’s Round of 16 match against Morocco, scheduled for Saturday. At the time of writing, the match had generated over $48 million in trading volume on Kalshi and over $26.8 million on Polymarket.
Other advancement markets also attracted notable attention in the U.S. Round of 16 matchup. The source states that on Kalshi, a market on which team would advance generated more than $2.1 million in volume as of Saturday. On Polymarket, a comparable market had pulled in around $1.6 million by the same time.
For market participants, these figures underline a practical point: the World Cup doesn’t just bring overall volume—it can also concentrate liquidity into specific, time-sensitive contracts where traders rush to price developments and adjust their expectations as lineups, tactical decisions, and match conditions become clearer.
Trading growth collides with expanding legal pressure in the U.S.
Even as competition-linked volumes climb, prediction markets in the United States remain mired in a rapidly evolving legal debate. The source notes that by March, nearly a dozen U.S. states had taken action against companies including Kalshi and Polymarket. Some states aimed to halt prediction markets, while others sought to bring them under existing gambling laws and state tax frameworks.
Federal regulators have pushed back. The source points to a statement from CFTC Chair Michael Selig, referenced via a CFTC press release, who accused states of pursuing “illegal enforcement actions” against federally regulated exchanges. Selig argued that Congress gave the CFTC sole authority over commodity derivatives markets, which would include prediction markets, warning: “To any state that seeks to nullify federal law and seize authority over these markets, we will see you in court.”
The disagreement has also moved beyond agencies and into the broader legislative arena. In June, casino operators, tribal organizations, and labor groups urged Congress to carve sports-event contracts out of the CFTC’s authority through an amendment to the Digital Asset Market Clarity (CLARITY) Act—arguing those contracts should remain governed by state gambling laws and existing gaming oversight.
Regulators overseas: product substance, not labels
While the U.S. fight has centered on regulatory jurisdiction and enforcement, Europe has emphasized how products are categorized. The source cites an ESMA reminder issued on Friday that many event contracts may already fall under existing restrictions tied to binary options.
Crucially, ESMA’s position—as presented in the source—is that whether a product is regulated depends on its characteristics rather than the presence of an “event contract” label. That means platforms and market operators face a compliance challenge that is less about terminology and more about how specific contract mechanics are structured.
For traders and builders, the key question now is whether the World Cup-driven volume spike will translate into sustained engagement once the tournament ends—or whether liquidity fades as the legal and regulatory backdrop remains unresolved. Readers should watch for further court activity and potential legislative movement around CLARITY, since those outcomes could materially shape what kinds of contracts are allowed, where, and under what rules.
The Sci-Fi Sequel That Ended a $1B Franchise Hits HBO Max This Month

“My financial condition said no not today” #youtubeshorts #btsarmy #bts @YouTube

Harper Beckham won’t get the one 15th birthday present she really wants – a visit from big brother Brooklyn

No Jackpot Winner as $257 Million Prize Rolls Over to $269 Million Monday Draw

Renter of Home in Anne Heche Crash Denies Settlement With Son

Weekend Open Thread: Staud – Corporette.com
“My financial condition said no not today” #youtubeshorts #btsarmy #bts @YouTube

Children s filial piety should not only be reflected in financial aspects but also in thei

Sui & Tang Heroes’ Financial Struggles: Dicky Cheung’s Part-Time Dilemma
-

 Fashion1 day ago
Weekend Open Thread: High Hopes
-

 Tech7 days ago
Bluekit phishing kit adopts browser-in-the-middle for login theft
-

 Tech7 days ago
Claude Code turned every engineer into three. Now companies need more product thinkers
-

 Crypto World5 days ago
Strategy authorizes up to $1.25B in Bitcoin sales under new capital plan
-

 Politics1 day ago
The House | “Reframing the debate from a binary discussion of winners and losers”: Yuan Yang reviews ‘We Are Not Machines’
-

 News Videos6 days ago
MAJOR BITCOIN & MARKET UPDATE!!!! (MUST WATCH ASAP!!!)
-

 Tech5 days ago
Anonymous researcher drops 0-day ‘exploitarium’ repo
-

 Business5 days ago
Australia treasurer says alleged access of prime minister’s bank data ’incredibly concerning’
-
 Business5 days ago
The AI boom won’t burst all at once. It will pop in ‘rolling bubbles’: Macquarie
-

 Sports3 days ago
Broncos roster: OL Ben Powers (No. 74) entering final year of contract
-

 NewsBeat4 days ago
Presenter Caroline Flack’s brother Paul Flack dies aged 55
-

 Crypto World3 days ago
Binance stock trading tops $1B in first month after launch
-

 Crypto World3 days ago
Alibaba-affiliate Ant Group enters the humanoid robot market with 12 deals
-
 NewsBeat3 days ago
New exhibition reflects five decades of movement between island of Ireland and GB
-

 News Videos5 days ago
How to Build INSANE Live Financial Dashboards With Claude
-

 Business3 days ago
Meta Platforms Stock Jumps 7% Today as Bloomberg Reports Company Plans to Enter the Cloud Business
-

 Business2 days ago
What a 10 Percent Drop Means for Buyers, Sellers and Renters
-

 Crypto World2 days ago
Binance Re-Enters Philippines As EU MiCA Rules Restrict Access
-
 Crypto World1 day ago
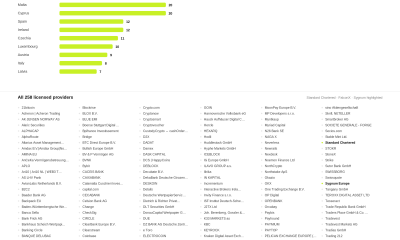
Standard Chartered Secures MiCA License as ESMA Adds 37 New Crypto Firms
-

 Tech5 days ago
The attack that hijacked Claude Code came through Sentry. Datadog, PagerDuty, and Jira have the same exposure.
You must be logged in to post a comment Login