
Crypto World
Rally, Stuck, or Drop Below $1?
XRP price has remained under pressure since the beginning of 2026, extending a steady downtrend that started in early January. The altcoin has repeatedly failed to reclaim major resistance levels.
Weak macro sentiment and geopolitical tensions have limited upside momentum across the broader crypto market. Despite the ongoing decline, several historical and on-chain indicators suggest XRP may be approaching a turning point.
XRP Holders’ Losses Near End
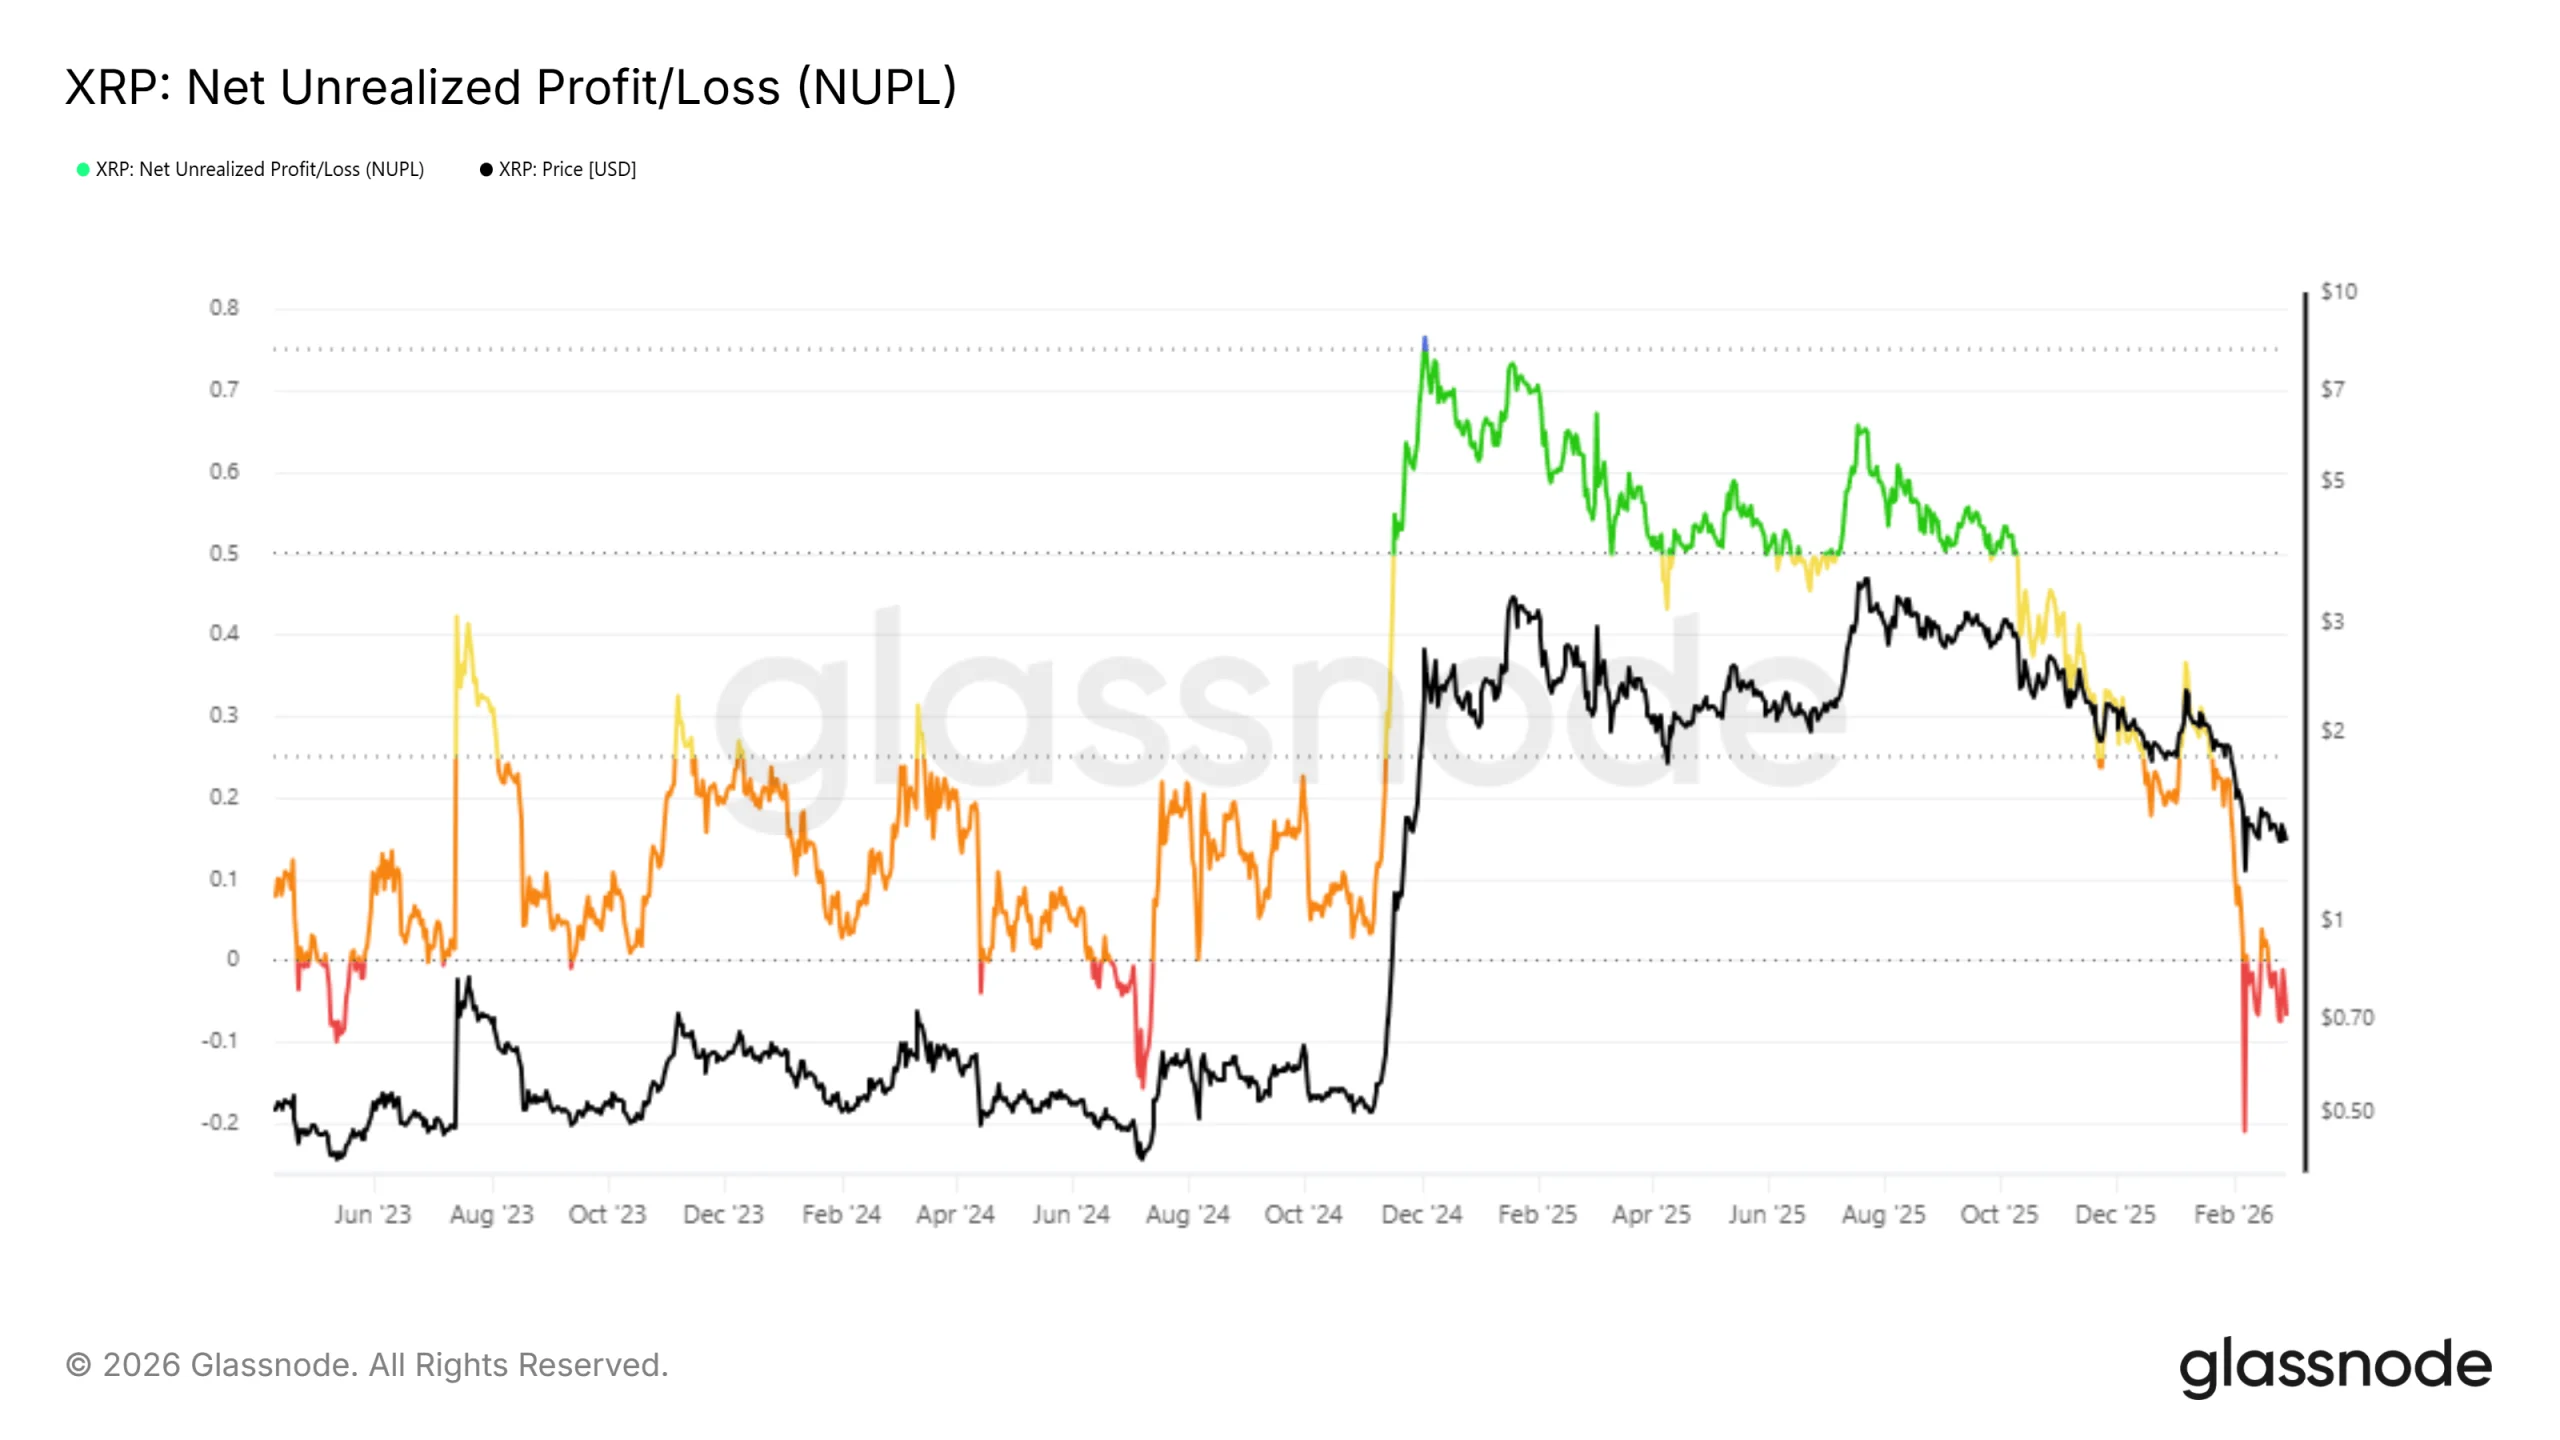
The Net Unrealized Profit and Loss indicator shows XRP remains in capitulation territory. This phase reflects that a majority of holders are sitting on unrealized losses. Capitulation typically marks the late stage of a downtrend rather than the beginning.
Historically, XRP’s capitulation phases have lasted close to one month before reversing. The current stretch began at the start of February. If prior patterns repeat, this period could end for the XRP price in the first week of March. A reduction in panic-driven selling would allow price stabilization and open the door to recovery.
Want more token insights like this? Sign up for Editor Harsh Notariya’s Daily Crypto Newsletter here.

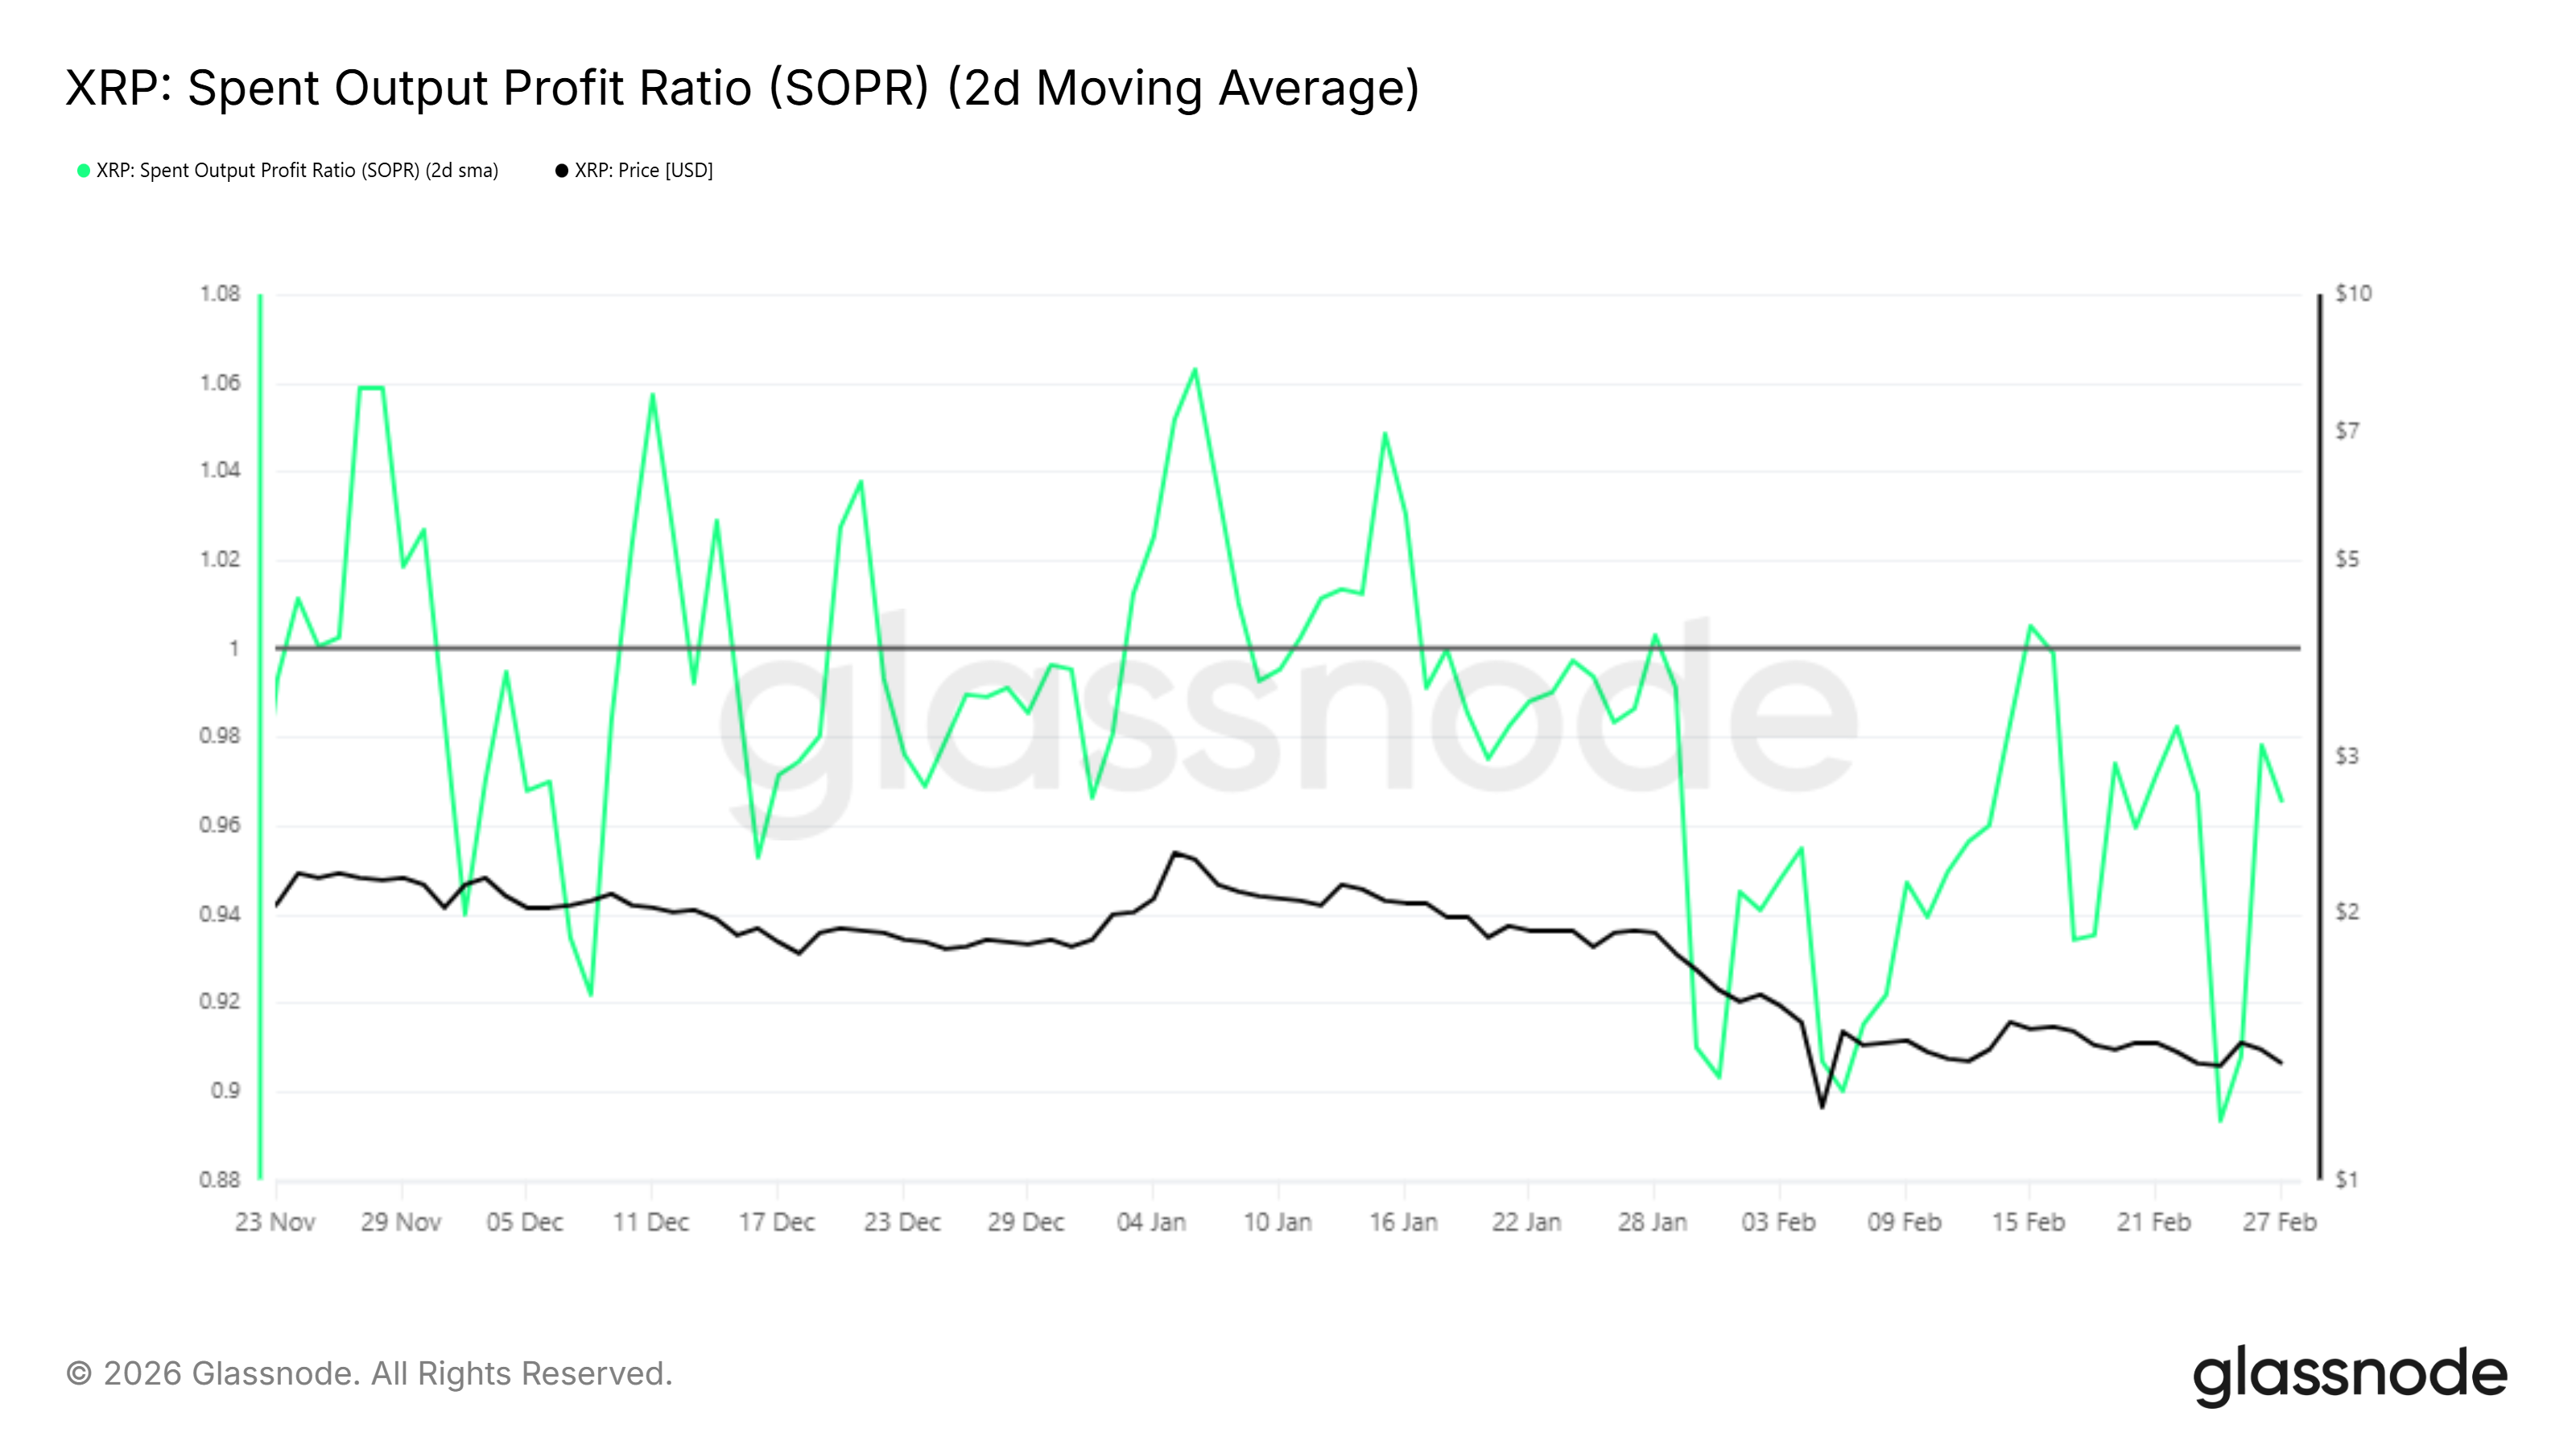
The Spent Output Profit Ratio, or SOPR, confirms that many XRP holders are still selling at a loss. A brief move above 1 occurred in mid-February, signaling temporary profitability. However, the metric quickly fell back below 1, showing renewed selling pressure.
SOPR approaching the 1 level again is significant. A sustained move above this threshold would indicate that coins are being sold at a profit. Historically, this shift often coincides with early recovery phases. If selling continues to saturate, the XRP price may gain room to rebound.
What Does XRP’s Past Say?
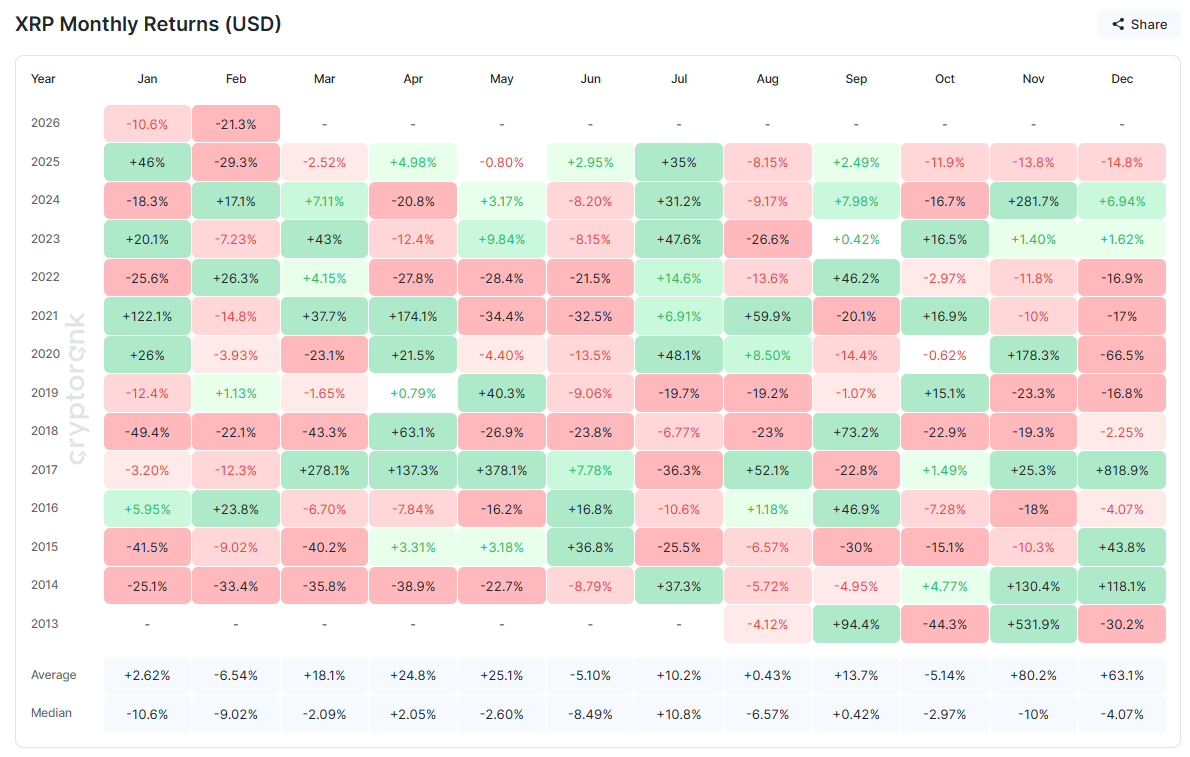
Seasonality data shows that over the past 12 years, March has delivered an average 18% return for XRP. This makes it statistically the strongest month in the first quarter.
While past performance does not guarantee future gains, historical trends matter. However, external risks remain. Escalating geopolitical tensions involving the US and Israel could affect risk appetite. Broader financial instability may delay seasonal bullish tendencies.
XRP Price Levels To Watch
XRP is trading at $1.29 at the time of writing, holding above the critical $1.27 support level. This level aligns with the 23.6% Fibonacci retracement, often referred to as the bear market support floor. Maintaining this threshold is essential to prevent a deeper correction.
If capitulation ends and macro conditions stabilize, XRP could bounce from $1.27 and challenge the descending trendline active since January. A move above $1.51 would confirm a structural shift. This level also coincides with the 61.8% Fibonacci retracement, a key recovery benchmark.
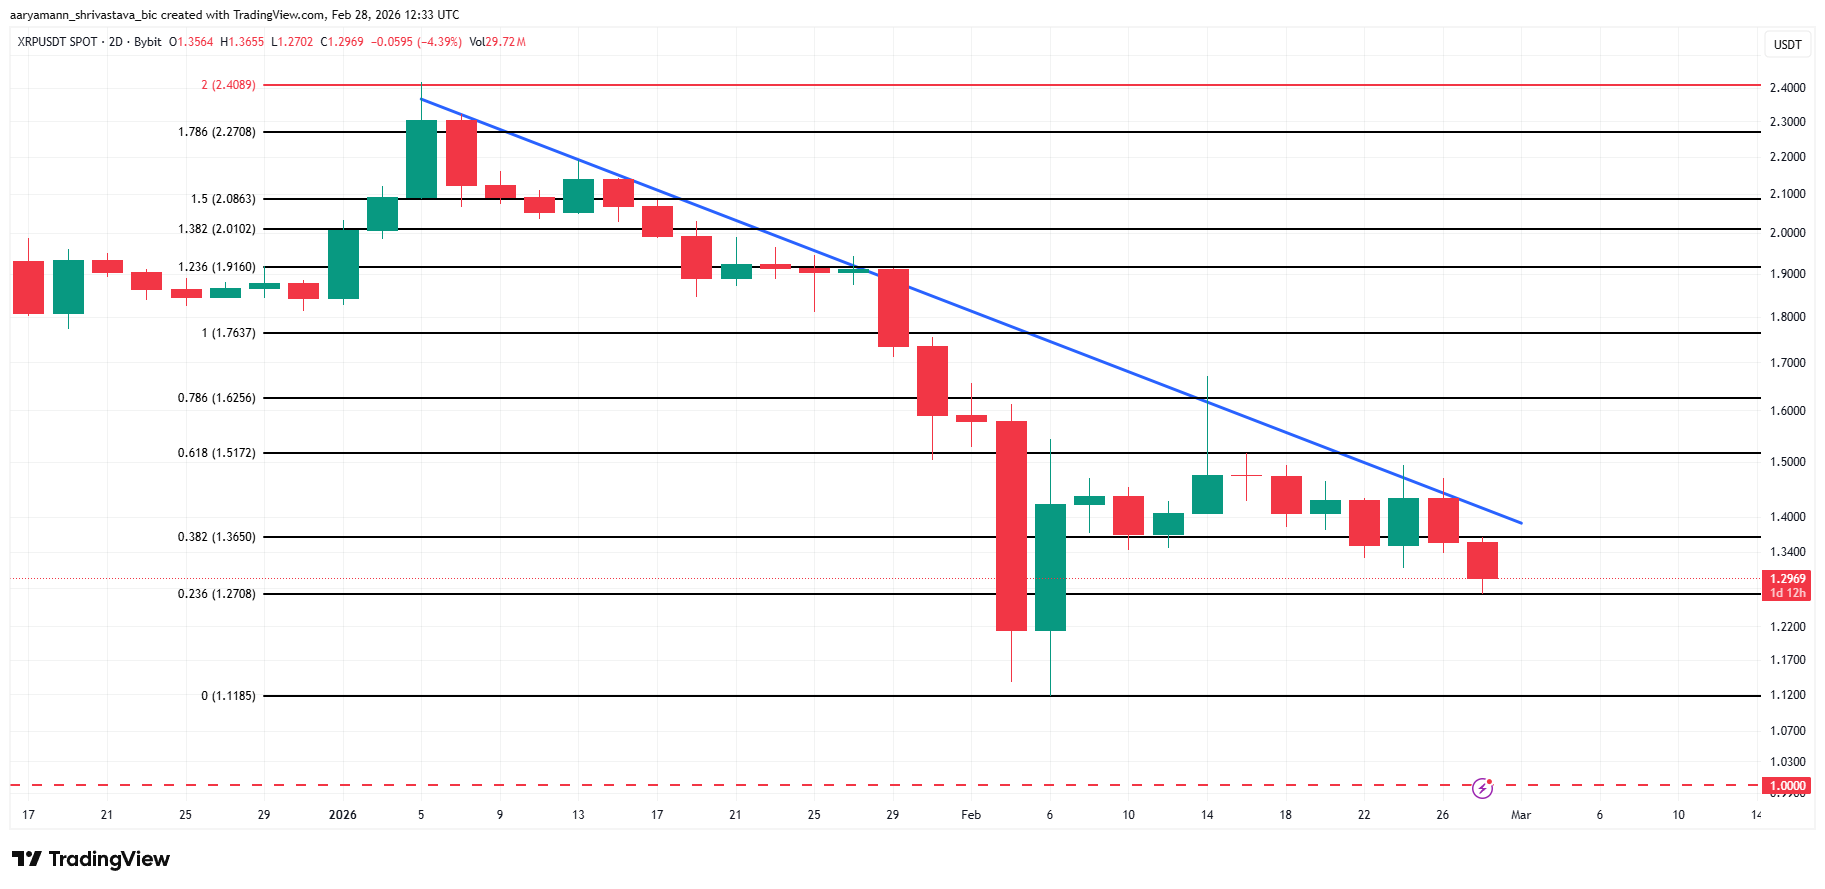
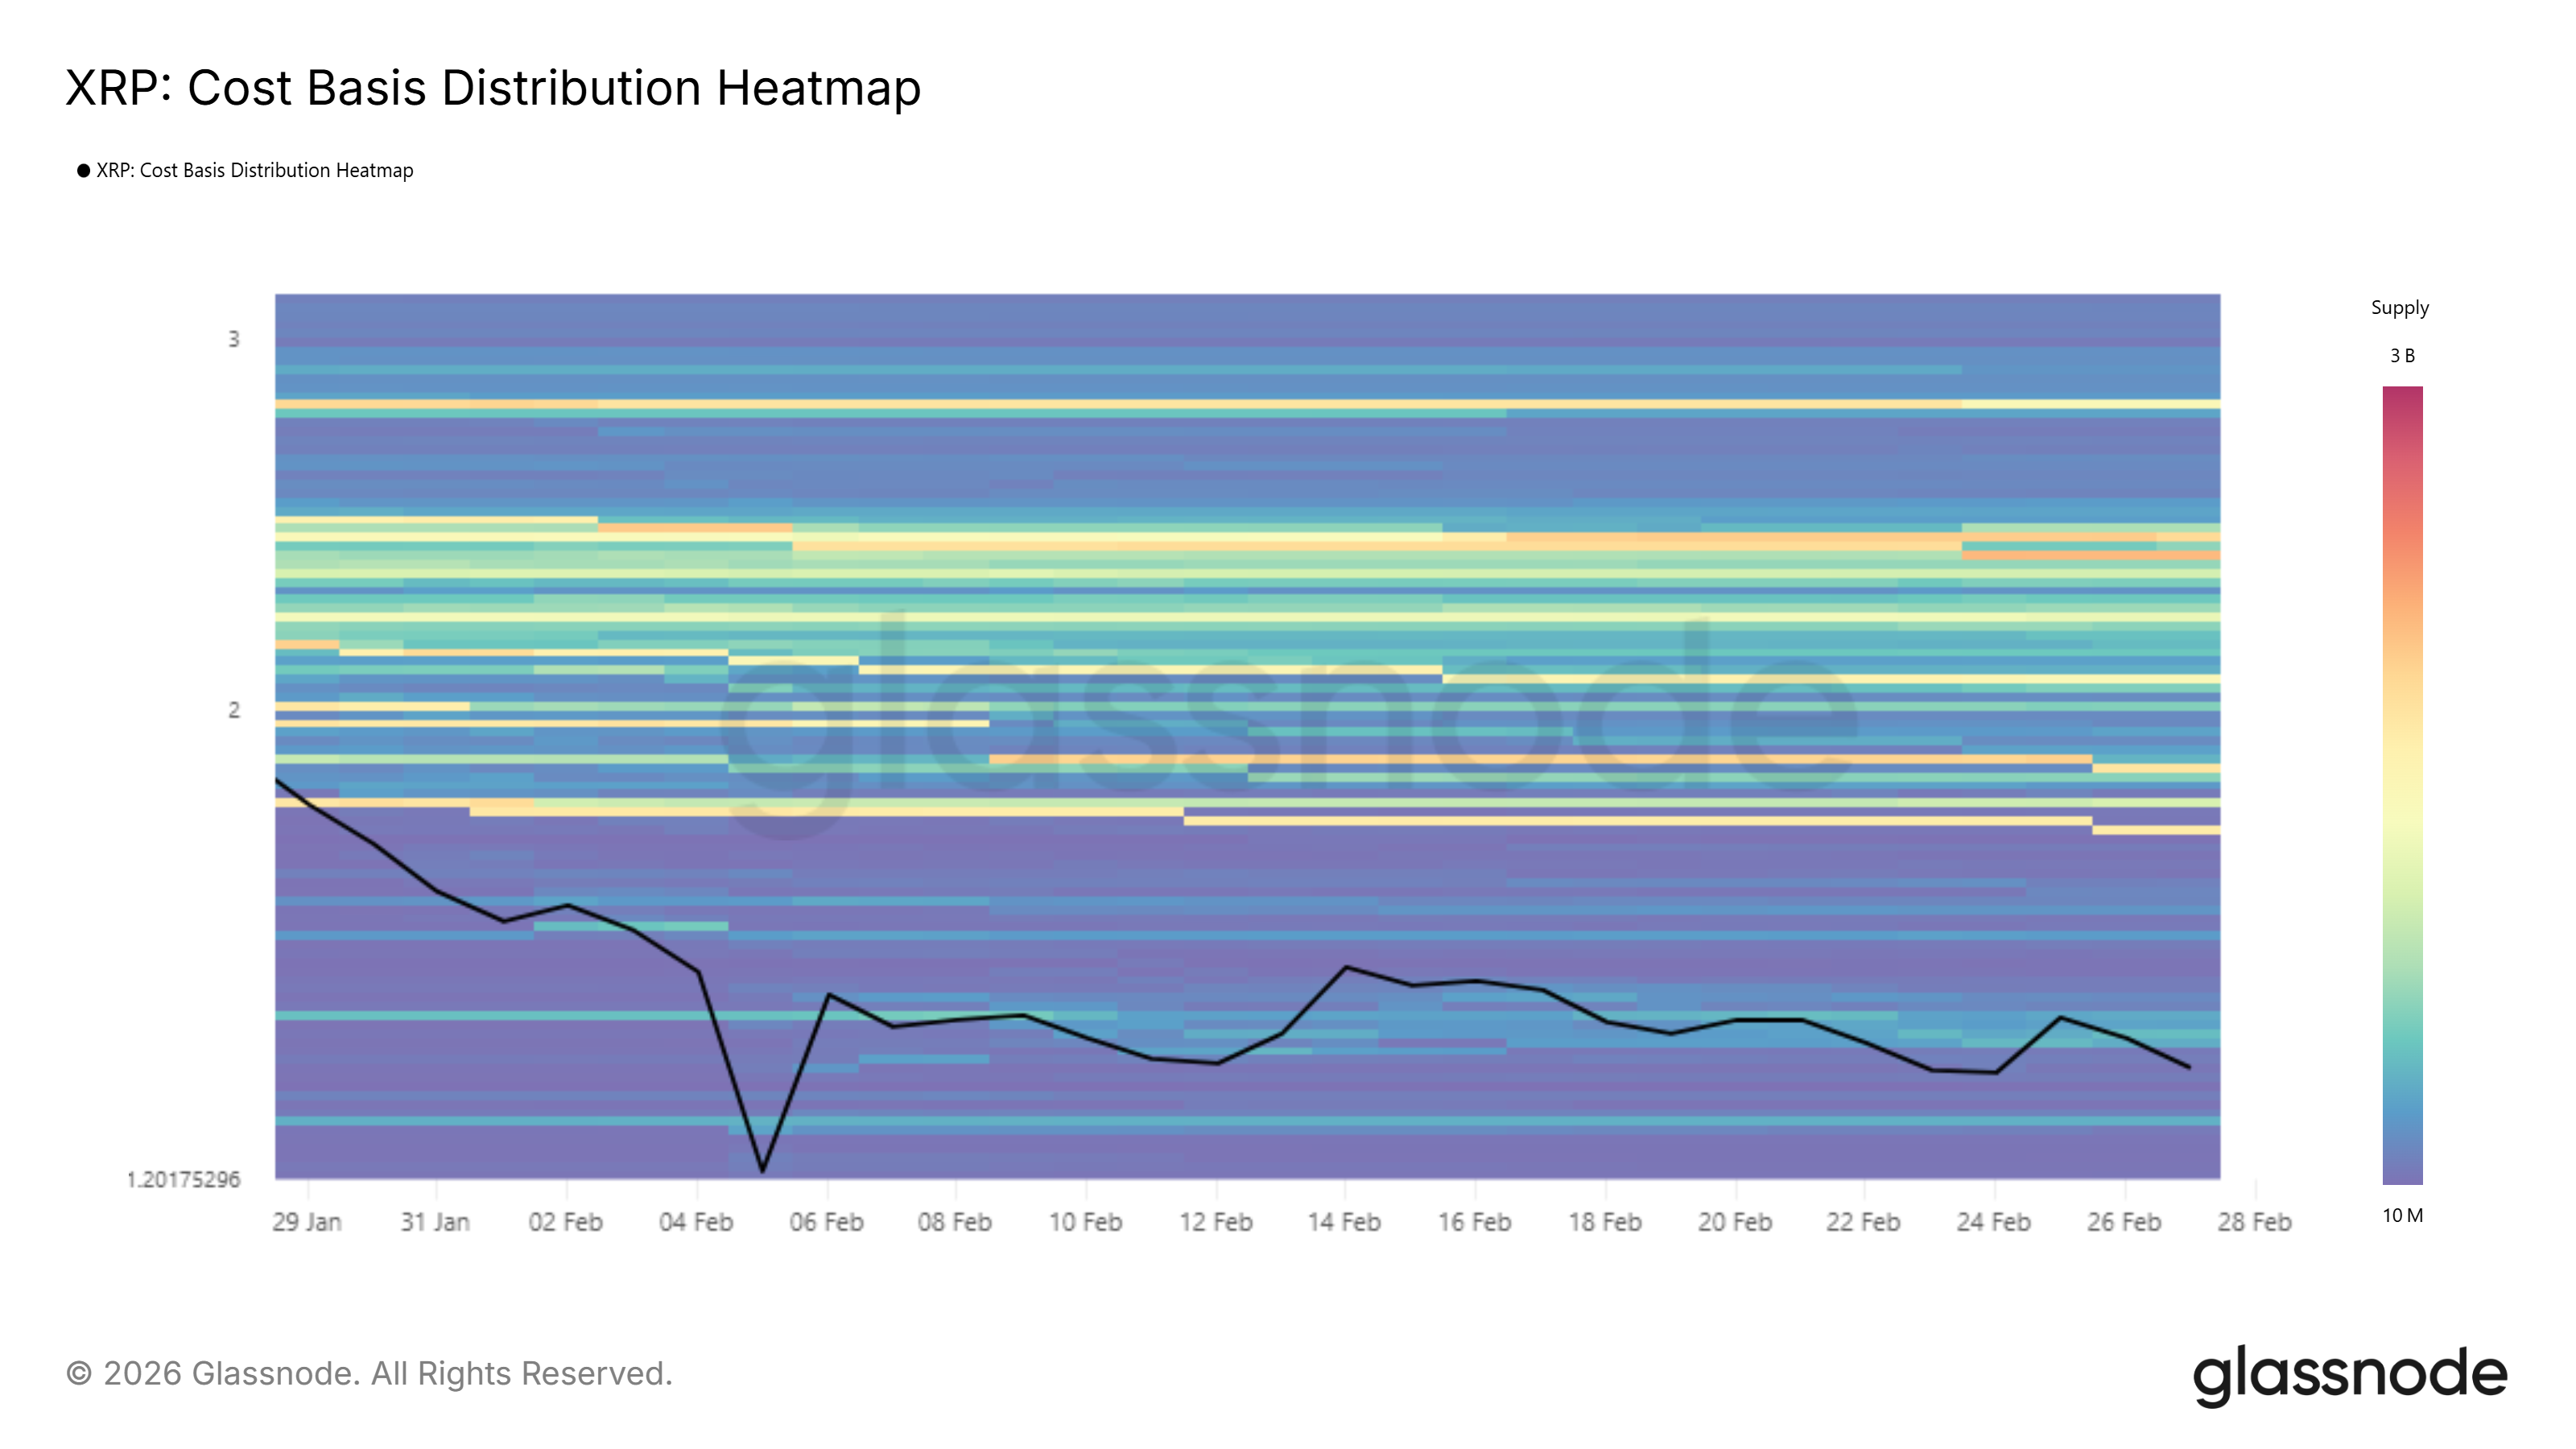
On-chain data suggests limited resistance until the $1.76 to $1.80 range. Approximately 1.85 billion XRP were accumulated within this zone, valued at nearly $2.83 billion. Holders who bought there may sell to break even, creating temporary resistance.
However, failure to hold $1.27 would invalidate the bullish outlook. A breakdown below the bear market support floor could send XRP toward $1.11. Continued sideways consolidation remains possible if global uncertainty persists. For now, March presents both risk and opportunity for XRP price recovery.

Crypto World
The CLARITY Act Is Under Threat of Depayment Delay Although a Stablecoin Deal Is Being Made

Stablecoin Deal Is a Partial Victory
According to recent reports, the Senate leaders and the White House achieved a consensus on stablecoin yields. This move has resolved one of the major conflicts between crypto companies and banks. Thorn, however, said that the progress was good but still needs some work. Thorn pointed to the fact that a number of thorny issues may still delay the passage of the bill through Congress. These are the decentralization of finance monitoring, the security of the developers, and the regulatory framework. Furthermore, ethical considerations can also attract the attention in the process of further discussion.
The policy advisors of the US have noted that the negotiations are not over with the stablecoin issue. Participants of the discussions stated that the lawmakers should resolve the pending issues before the bill is completed. Besides, they characterized the new accord as a significant measure, as opposed to a solution.
Players in the industry have noted that there is a small legislative window in which the CLARITY Act should be passed. Kristin Smith of the Solana Institute told that the lawmakers should hope to pass it by August. In addition, she observed that the congressional timetable is even more restricted when there is greater activity in terms of election matters towards the end of the year. Senator Cynthia Lummis has proceeded to urge the bill to move forward quickly through the Congressional Banking Committee. She noted that the lawmakers would be able to pick the markup step during the Easter recess. Additionally, she has once again stated that timely passage is still relevant in developing the regulation of digital assets.

Mediators Prefer to have an Early Contact
The regional intermediaries have intervened to deliver messages between the two parties. Egypt, Qatar and the United Kingdom have relayed positions as part of early outreach activities. Furthermore, their contacts demonstrate that both Washington and Tehran are examining the possibility of the negotiations framework.Iran has already conveyed rigid terms of getting down to formal negotiations. These are a ceasefire, guarantees of new war and financial compensation. Moreover, the location of Tehran indicates the issues of security in the long term and economic recovery of the city following weeks of conflicts.
The US has also stipulated some conditions that the conflict will come to an end. They are terminated development of missiles during several years and imposed restrictions on the uranium enrichment. In addition to the above, Washington aims at containing the activities of Iran supporting regional factions aligned to its interests.President Donald Trump said that US forces have undermined the military capacity of Iran in the course of operations. He pointed out that there is massive destruction of missile systems among other assets. Therefore, the administration looks at the present development as a foundation of strategy change.
According to Trump, the US is contaminating with a possibility to reduce its military presence in the region. In addition, he associated this action to attainment of major goals against Iranian capabilities. This trend represents the shift of active operations to a diplomatic solution.Oil prices around the world have remained high because it is not clear that there will be a route to supply the product. The Strait of Hormuz is still impacting the market sentiment because it cannot move freely. As a result, the cryptocurrency market is on the alert due to geopolitical risks.The market has reacted to the shifting trends in the war. Prices improved due to the reports of relaxed sanctions of Iranian oil exports. But the volatility has not ended yet because investors are monitoring the military and diplomatic signs closely.
Risk-Off Drips throughout Markets
The world markets became risk-off when geopolitical tension escalated in the Middle East. Further, increasing uncertainty drove investors out of risky in the form of Bitcoin and Ethereum. Equities and commodities, too, reacted by this change, with a more extended response. Due to the oil infrastructure related disruptions in Iran, oil prices went up. Also, increased energy prices were an issue that was of concern to inflation and economic growth. Therefore, investors changed portfolios in order to minimize the exposure of risk sensitive assets.
New information published by the U.S. Bureau of Labor Statistics indicated that producer prices increased than anticipated in February. The Producer Price Index rose by 0.7% on a monthly basis and stood at 3.4% on an annual basis. Therefore, expectations for an interest-rate reduction have been undermined, as monetary risks of inflation still exist. Markets are concerned about the upcoming Federal Open Market Committee meeting. The traders assume that rates will be maintained between 3.50% and 3.75% in the near term. Nevertheless, the lack of clarity in the direction of policy has been promoting investment in crypto assets reduction among investors.
Chain data revealed that short-term Bitcoin owners transferred big amounts to exchanges. Over 48,000 BTC had been deposited in profit on exchanges within one day. This activity indicated that there is intensified selling pressure during the recent price rebounds. Short-term holders kept generating profits as Bitcoin moved to higher resistance levels. Besides, a good number of investors decided to sell off rather than to hold during volatility. This action decreased the upward movement and led to recurring pullbacks. At the report date, the price of Bitcoin was close to 72,229, a daily drop. Ethereum fell to approximately 2,235, although other currencies like XRP and BNB gained losses as well. Moreover, the general market environment continued to be sensitive, with sentiment remaining low.
Crypto World
BTC Miner Inflows to Binance Hit Lowest Levels Since June 2023 Amid Reduced Selling Pressure

TLDR:
- BTC miner inflows to Binance have dropped to their lowest monthly average since June 5, 2023.
- The U.S. ice storm forced miners to sell BTC to cover fixed costs despite reduced operations.
Combined miner inflows across all exchanges currently stand at approximately 4,381 BTC monthly. - Miners are estimated to hold 1.8 million BTC in reserve, making their behavior critical to watch.
BTC miner inflows to Binance have dropped to historically low levels in recent weeks. This follows a sharp spike recorded during the ice storm that struck the United States in late January and early February.
The monthly average now stands at approximately 4,316 BTC. Across all exchanges, the combined figure reaches 4,381 BTC. Analysts view this shift as a reduction in structural selling pressure from the mining cohort.
Ice Storm Forces U.S. Mining Pools to Liquidate BTC Holdings
Several large U.S.-based mining pools slowed down or halted operations during the storm. The extreme weather disrupted normal mining activity across affected regions.
However, fixed costs such as electricity, infrastructure, and operational expenses remained constant. This financial pressure pushed some miners to sell BTC in order to maintain liquidity.
On-chain analyst Darkfost noted the sharp rise in miner inflows during that period. The data showed a clear correlation between the weather event and increased BTC distribution to exchanges.
Miners facing reduced output still needed to cover ongoing operational costs. Selling into the market became the most practical solution for many affected operations.
The spike in inflows was a temporary reaction to an external shock. Once weather conditions normalized, mining activity gradually resumed across the United States.
With operations back online, the need to liquidate BTC eased considerably. The data confirms the increase was event-driven rather than structural.
This pattern is not uncommon when miners face unexpected downtime. External disruptions can quickly shift miner behavior from accumulation toward distribution.
When income drops but costs remain fixed, selling becomes the most immediate option available. The ice storm served as a clear example of how operational risk translates directly into market activity.
Miner Reserves and Reduced Selling Pressure Point to Market Stability
Since the storm subsided, BTC miner inflows have reversed sharply to the downside. The current monthly average of 4,316 BTC marks the lowest reading since June 5, 2023.
This decline points to miners retaining more BTC rather than routing it toward exchanges. Lower exchange inflows typically reflect reduced selling intent from this cohort.
According to Darkfost’s analysis, miners currently hold an estimated 1.8 million BTC in reserves. This represents a large supply pool that could enter the market under shifting conditions.
Any move to increase distribution from these reserves could generate considerable selling pressure. Monitoring miner behavior therefore remains a critical component of broader market analysis.
At present, the data suggests miners are in a conservative distribution phase. The reduction in exchange inflows across both Binance and the wider market supports this reading.
Miner-driven selling pressure appears relatively contained at this stage. This backdrop can support near-term price stability for BTC.
The trend requires continued monitoring as market conditions evolve. If BTC prices decline sharply, miners may resume higher distribution to manage cash flow.
Conversely, rising prices could encourage further holding. Miner inflow data remains one of the more reliable on-chain indicators for gauging supply-side pressure.


Strait interference creates issues with supply
The Strait of Hormuz manages a significant portion of the world oil exports and its blockage has strained the economies relying on imports. As a result, India is in danger because of its dependence on the crude and gas flows via this path. Nevertheless, officials assured that there are no delays in the delivery of fuel shipment, such as that of the United States and Russia.
The Iranian President, Masoud Pezeshkian, encouraged India to take the independent position and apply it to contribute to the diplomatic processes and minimise the tensions. He has noted the role of India as a neutral voice that can have an impact in the conversation between the two. In addition, Tehran sees the current stand of India in global groupings as an avenue to promote de-escalation. In turn, Narendra Modi repeated the emphasis on the stability in the region and the safety of the critical infrastructure. Another point he made was the importance of maintaining open international shipping routes in order to sustain uninterrupted trade. In addition, India recognized Iranian cooperation in making sure that Indian nationals in the region are safe.
The Strait situation was put under further strain with the US President Donald Trump threatening to close the Strait unless Iran opened it within a specified period. Iran reacted with powerful words and this could indicate that retaliations will be taken in case its infrastructure was further assaulted. As a result, the trade has heightened the worry over greater regional instability. Prices of world oil have soared due to the tension that has been experienced and the markets have responded to the supply risks associated with the Strait. Therefore the Indian import bill can go up and this would create a strain on the inflationary pressure and duty of fuel in India. Analysts remark that the disruptions partially alleviated would stabilize the prices and the supply conditions would improve.
Contingency measures are examined by the government
The Indian officials were looking through contingency plans to deal with disruptions in supplies and keep a sufficient fuel supply. Besides, the authorities evaluated other sourcing options to minimize reliance on one route. These measures are intended to provide stability at home markets in the external uncertainty.
TLDR:
- Terafab will produce two chip types; one for Tesla and Optimus, and a space-hardened D3 variant for orbit.
- Solar panels in space run five times more efficiently, making orbital AI cheaper to operate than ground-based systems.
- A lunar electromagnetic mass driver could slash payload launch costs from $1,200 per pound to just dollars in electricity.
- One entity now controls the rockets, chips, robots, and satellites needed to build an off-planet AI supply chain.
Terafab, a semiconductor facility developed by Tesla, SpaceX, and xAI, has officially broken ground. Elon Musk unveiled the project Saturday night at a decommissioned power plant in Austin, Texas.
The facility targets one terawatt of AI compute annually, roughly double the total electricity capacity of the United States.
Around 80% of its chip output is set for space deployment. Musk framed the effort as the start of what he called a galactic civilization.
Terafab’s Chip Strategy and Space-Bound AI Infrastructure
Terafab will produce two distinct types of chips. One type supports Optimus robots and Tesla vehicles. The other, designated D3, is hardened specifically for space.
Most of the facility’s output, roughly 80%, is directed toward orbital deployment. The remainder supports ground-based AI applications and consumer devices.
Musk expects Optimus robot production to reach 10 to 100 times the volume of car manufacturing. That points to billions of chips being produced annually.
The scale makes Terafab central to both commercial and space operations. No existing facility currently targets this combined level of output.
Musk told the Austin audience that solar panels in space operate five times more efficiently than on Earth. Milk Road AI reported this as a central part of its cost argument for orbital AI.
Space also provides uninterrupted sunlight, unlike ground-based installations. Over time, this positions orbital AI as cheaper to run than terrestrial alternatives.
Near-term chip output from Terafab is directed toward a data center under construction in Virginia. That facility serves as the initial hub before full orbital deployment begins.
It connects ground-level production to the broader space strategy. From there, the roadmap extends outward toward the moon.
Lunar Mass Driver and the Road to a Petawatt
Beyond the terawatt lies a petawatt target, one thousand times more powerful. Musk argued that reaching it requires moving manufacturing off-planet.
The moon, with its low gravity and no atmosphere, becomes the logical production site. A lunar base forms the next stage of the infrastructure plan.
Rather than rockets, the plan calls for an electromagnetic mass driver on the lunar surface. This magnetic cannon would launch AI satellites directly into deep space.
A Falcon rocket currently costs around $1,200 per pound of payload. A lunar mass driver could reduce that figure to just dollars per pound in electricity.
Milk Road AI described this as potentially the single biggest reduction in the cost of intelligence in human history, with the caveat that it must first work.
That qualifier is worth noting. No mass driver of this scale has been built or tested. The engineering challenges ahead remain unresolved.
Musk stated his goal to complete the lunar infrastructure within his own lifetime. Terafab has already broken ground, and the D3 chips are currently in design.
The race to place AI infrastructure in space has formally started. One entity now controls the rockets, the robots, the chips, and the satellites required to pursue it.
TLDR:
- Ethereum whales near breakeven signal reduced aggressive selling and late-stage accumulation.
- ETH price on the 4H chart shows an early downtrend with lower highs and key support zones.
- MACD and RSI indicators confirm weakening momentum and potential for further downside.
- Liquidity clusters above and below the current price suggest volatility expansion is imminent.
Ethereum whale unrealized profit ratio has dropped near zero, placing major holders at breakeven or loss. This aligns with weakening short-term price action and tightening liquidity zones, setting the stage for a decisive market move.
Whale Profitability and Market Structure
Ethereum whale unrealized profit ratio shows major holders of 100,000 ETH or more approaching breakeven or unrealized losses. Historically, such readings appear during late-stage bear markets or deep accumulation phases.
Past cycles provide context. Between 2018 and 2019, whale profit ratios dipped toward zero before the post-ICO market bottom stabilized. A similar pattern occurred in 2020 before a strong upward expansion.
Large holders typically have long-term strategies and superior market insight. Their positions reflect structural market conditions rather than short-term sentiment.
Unrealized losses at this scale indicate broad market compression and potential accumulation. Selling pressure often reduces under these conditions.
Whales generally avoid realizing losses unless forced by liquidity constraints, which can stabilize downside momentum. At the same time, accumulation tends to increase quietly.
Large holders often average down or reposition strategically during these periods. Retail sentiment contrasts with this behavior.
As price stagnates or decline, retail participants often panic. In contrast, whales being underwater suggests the market’s strongest participants are experiencing losses, which can indicate a closer proximity to the bottom ranges.
Price Action, Momentum, and Liquidity Zones
Ethereum’s 4-hour chart shows short-term momentum weakening after a peak near $2,300–$2,400. Price has entered a corrective phase with lower highs and mild lower lows, typical of early downtrend structure.
Current price levels around $2,080 sit near a horizontal support zone that previously acted as a consolidation base. Momentum indicators confirm weakness: MACD shows expanding bearish signals, while RSI near 35–40 suggests room for further downside before oversold conditions emerge.
Liquidity clusters define the next potential moves. A dense short liquidation zone exists between $2,180 and $2,220, while a strong long liquidation pool lies near $2,050–$2,100.
Price is currently trapped between these levels, creating a “liquidity sandwich” that often precedes volatility expansion.
Social media commentary reflects this tension: “Price is stuck between two liquidation magnets. One side will be cleared before expansion.” The market is range-bound, awaiting a catalyst.
A downside sweep appears slightly more likely due to recent bearish momentum, which could clear long positions before a potential relief bounce.
Whale positioning adds further insight. If large holders defend current support, the market may stabilize. Otherwise, ETH may search for deeper value before any recovery occurs.
Overall, the market is in a transitional phase with structural weakness balanced by potential accumulation.
TLDR:
- Strategy now holds 761,068 BTC valued at $52.36B amid ongoing purchases.
- Average acquisition cost for holdings stands at $75,696 per bitcoin.
- Moderate leverage and $38B derivatives exposure support the accumulation strategy.
- Bitcoin consolidates near 68.7K after the recent 75–76K peak, showing a short-term pullback.
Michael Saylor’s Bitcoin accumulation continues as Strategy scales its treasury beyond 761,000 BTC. The approach combines moderate leverage, active market participation, and long-term capital allocation in bitcoin despite ongoing price volatility.
Strategy’s Growing Bitcoin Holdings and Market Engagement
Michael Saylor continues to expand Strategy’s corporate bitcoin holdings, posting on X on March 22, 2026, with his signature orange dot chart illustrating ongoing accumulation.
The chart visually tracks the company’s treasury growth despite market swings. A recent purchase of 22,337 BTC increased total holdings to 761,068 BTC, with a current valuation of $52.36 billion and an average acquisition cost of $75,696 per coin.
This reinforces the scale of corporate bitcoin adoption and the long-term focus of Strategy’s capital allocation.
Equity metrics show MSTR trading at $135.66, with a market capitalization of $46.814 billion and an enterprise value of $62.766 billion.
Trading volume reached $3.82 billion, and the 30-day average stood at $2.846 billion. These figures demonstrate active market participation alongside the accumulation strategy.
Leverage, Volatility, and Bitcoin Market Trends
Strategy uses moderate leverage, holding $8.254 billion in total debt alongside $2.25 billion in cash. Net leverage is 11%, indicating a controlled approach while supporting continued bitcoin purchases.
Open interest in derivatives totals $38.137 billion, and implied volatility is 55%, with historical volatility at 74%, reflecting significant market swings.
The bitcoin market currently shows a short-term pullback. Price peaked near 75–76K before consolidating around the 68.7K support region. Momentum indicators such as the MACD are negative, and the RSI hovers in the high-30s, approaching oversold levels.
This suggests sellers dominate the short-term market, while volume patterns indicate limited panic selling.
Key support levels include 68K, with further support near 66–64K, and resistance levels at 70–71K. Tweets from Strategy’s official account continue to emphasize the “Orange March,” signaling that accumulation is ongoing, and institutional confidence remains elevated.
Crypto World
XRP Price Prediction: Pepeto Races XRP Toward 150x as the Binance Listing Draws Near While Solana Signals Recovery
Goldman Sachs became the largest buyer of XRP ETF shares this quarter, and the SEC classified XRP as a digital commodity on March 17, ending years of legal confusion from the Ripple lawsuit.
Amid this development, Pepeto, an exchange presale from the cofounder who built the original Pepe coin to $11 billion, is pulling in wallets that track institutional flows before they reach the headlines. While the xrp price prediction hints at $4, 150x projections around Pepeto turn that target into a race between both entries.
XRP Price Prediction Turns Bullish After SEC Commodity Classification and $1.39 Billion in ETF Inflows
The SEC and CFTC jointly classified XRP as a digital commodity on March 17, placing it alongside Bitcoin and Ethereum under CFTC oversight, according to Phemex.
Spot XRP ETFs have pulled in $1.39 billion with 772 million tokens locked in custody, and Goldman Sachs emerged as the largest institutional buyer, according to Yahoo Finance.
The classification removes the legal overhang from 2020, but from $1.39 the xrp price prediction still measures returns in small multiples over years.
XRP Price Prediction and the Presale That Could Outperform
Pepeto: The Best Opportunity Of 2026
Most traders hear about a token only after it already printed 10x, 100x, or even 1000x in gains. Pepeto is the exchange being built to make sure you are positioned before the move, not reading about it after.
The platform is a complete trading hub designed to protect your capital. You can scan contracts for hidden risks before your wallet connects and stay ahead with tools that flag danger before a single dollar moves. For traders who lose money to scams, bad contracts, and hidden fees, this changes everything.

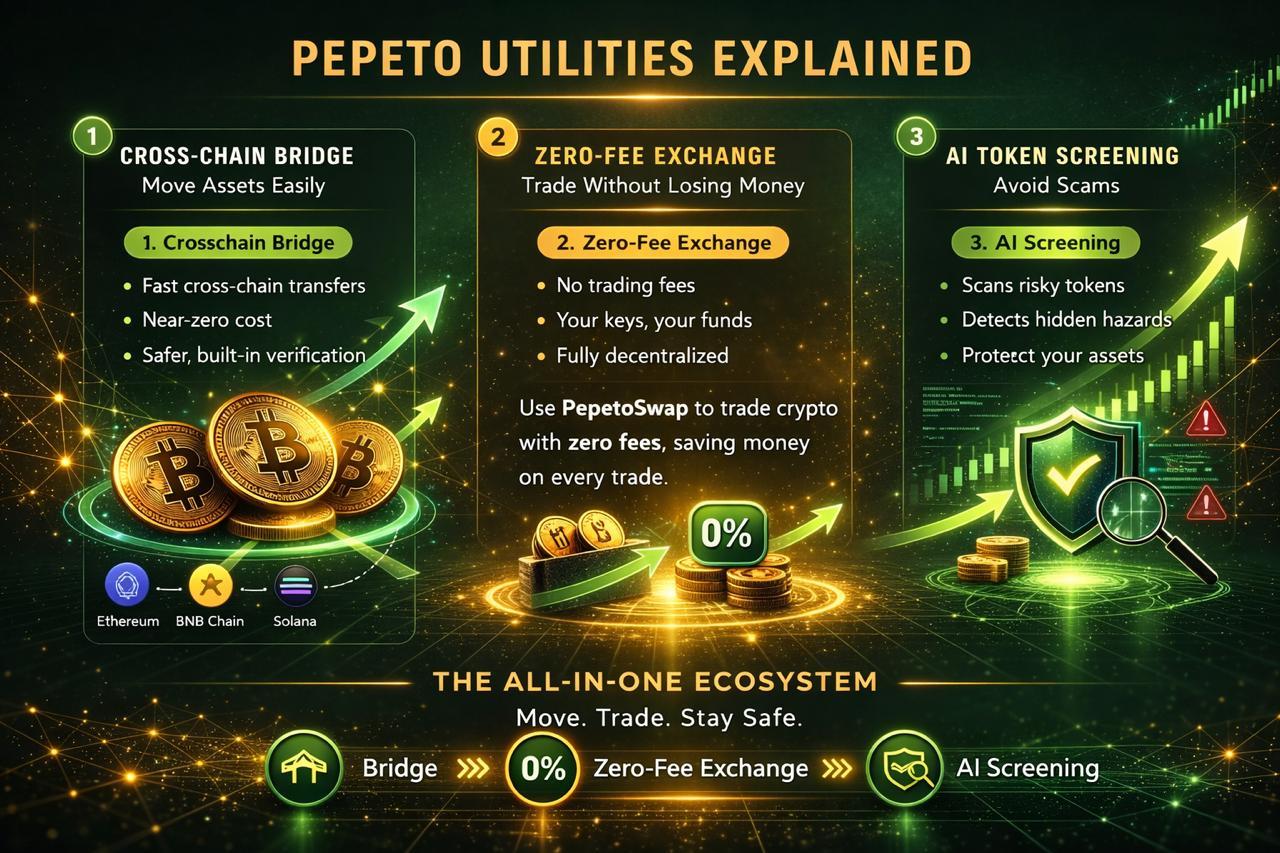
At the core of the exchange are three products that bring the system to life. PepetoSwap runs zero fee trades so your capital works for you instead of paying the platform. The risk scorer examines every contract for traps and scam code, giving you a clear answer in seconds so you never fall for a bad project again.
The presale has raised more than $8 million with the Binance listing approaching, and the cross chain bridge moves tokens between networks at zero cost. The cofounder who built Pepe to $11 billion with the same 420 trillion supply and zero products is now building an exchange. A SolidProof audit verified every contract, a former Binance expert is on the dev team, and 195% APY staking compounds in wallets that committed while others watched.
Pepe reached $11 billion with nothing. Matching that from the current presale entry of $0.000000186 is over 150x, and Pepeto has the exchange infrastructure Pepe never built. The wallets entering now are building the positions the xrp price prediction takes years to match.
XRP Price Prediction: Can XRP Reach $4 After the SEC Clears the Legal Path?
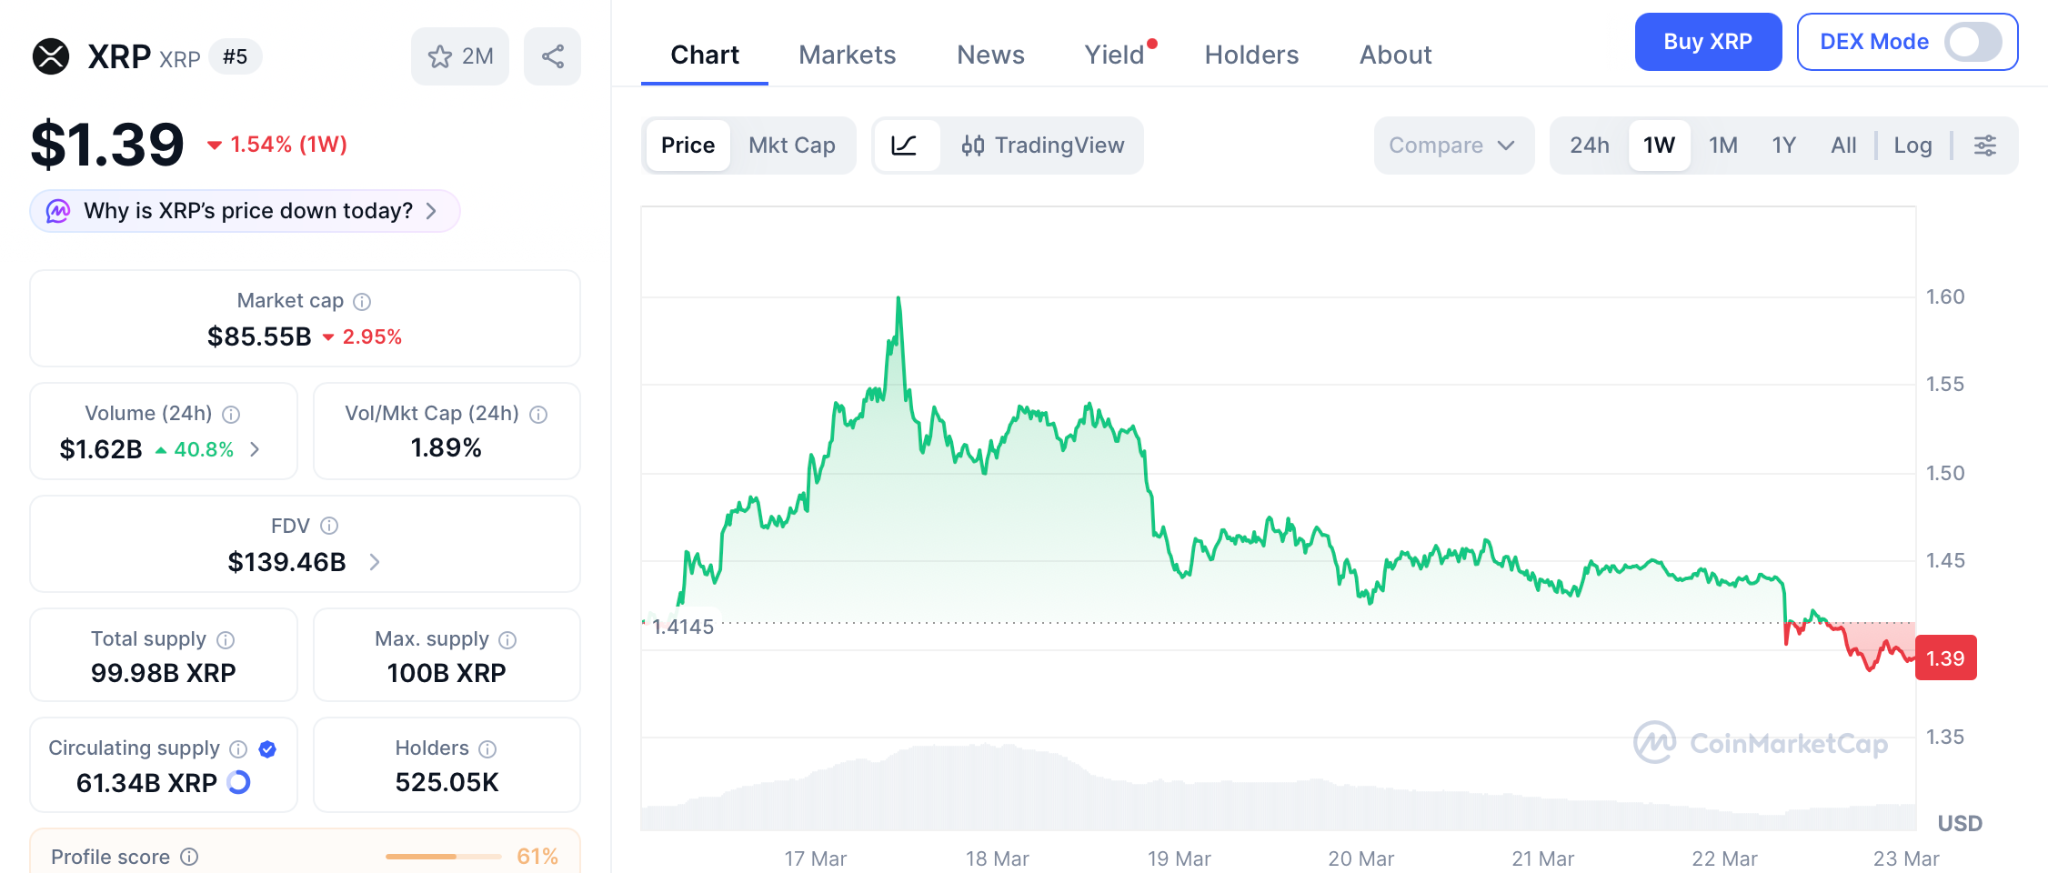
XRP trades near $1.39 as of March 22, up from $1.20 after the commodity classification removed the legal cloud, according to CoinMarketCap.
Analyst Ali Martinez identified a breakout zone and said clearing it could send XRP toward $4, according to TradingView.
More bullish forecasts place XRP at $5 to $6 by year end. But even the aggressive $6 target is a 4x return requiring the full cycle. The xrp price prediction delivers real returns over long timelines, not the 150x a presale to Binance listing compresses into the moment trading begins.
Solana
SOL trades near $87 as of March 22, down 75% from its cycle high above $260, according to CoinMarketCap.
An ascending trendline has provided support, and $100 is possible if it holds. But from $87, a 3x requires a recovery that could take quarters. SOL is signaling recovery, not delivering the entry that changes a portfolio.
Conclusion
The xrp price prediction is real, the commodity classification adds weight, and ETF inflows confirm the direction. But to grab the biggest returns from this shift, a portfolio needs an early entry that delivers multiples a large cap at $1.44 is too established to produce.
The Binance listing compresses that return window into days, and the wallets entering today at presale pricing are building the positions the rest of the market will spend this cycle wishing they had. The Pepeto official website is where the investors who see how rare this setup is are locking in their entries right now.
The xrp price prediction says $4. The Pepeto presale math says 150x, choose which distance defines your cycle.
Click To Visit Pepeto Website To Enter The Presale

FAQs
What is the xrp price prediction for 2026?
Analyst Ali Martinez forecasts XRP could reach $4, with bullish targets at $5 to $6. Pepeto at presale pricing targets over 150x to a market cap the same cofounder already achieved.
Can XRP reach $10 before Pepeto reaches the same level?
XRP at $10 is a 7x move analysts place in 2029 or 2030. Pepeto carries the same supply that took Pepe to $11 billion, making the distance much shorter.
Is Pepeto a better entry than the xrp price prediction right now?
The Pepeto official website offers a presale where matching Pepe’s market cap is over 150x, something the xrp price prediction from $1.39 cannot produce this cycle.
Disclaimer: This is a Press Release provided by a third party who is responsible for the content. Please conduct your own research before taking any action based on the content.
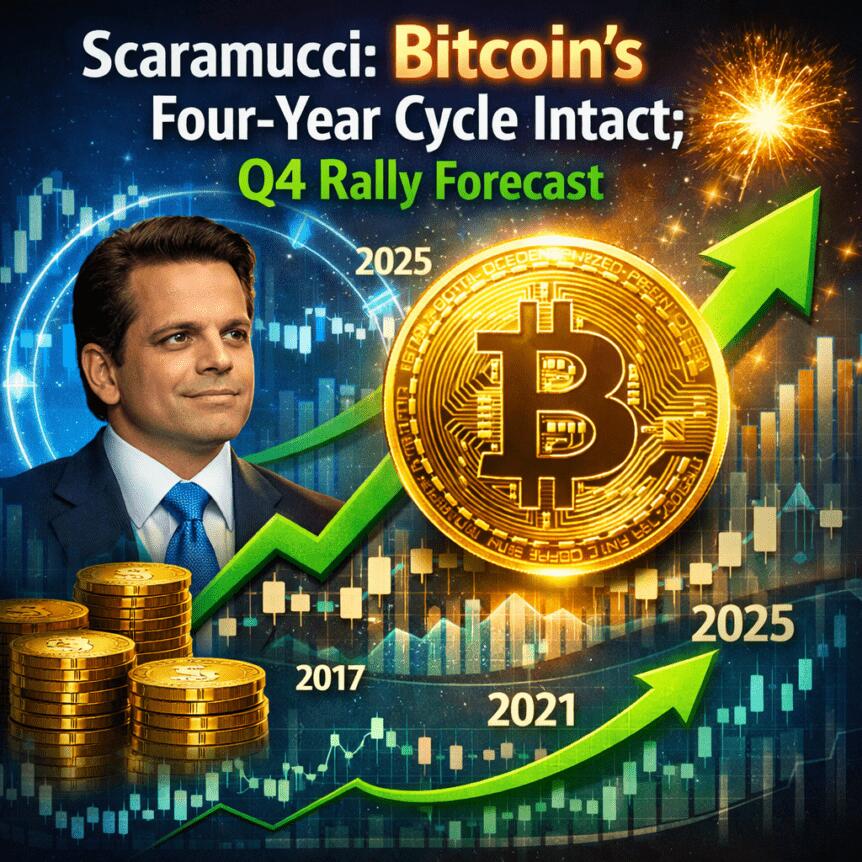
Bitcoin’s bear market has been framed by a familiar prism: the traditional four-year cycle. Yet proponents argue that institutional demand, particularly via BTC-focused exchange-traded funds, has muted volatility and may shape the path of prices through the next cycle. In a recent discussion, Anthony Scaramucci, managing partner of SkyBridge, suggested that while the cycle remains visible, its dynamics have been altered by new liquidity channels and changing market participation.
Speaking with Scott Melker on The Wolf of All Streets podcast, Scaramucci described the four-year pattern as “muted” by ETF inflows that have helped cushion sharp swings. “We’re in a four-year cycle, and there were some traditional whales, some OGs, that believe in the four-year cycle, and guess what happens in life when you believe in something? You create a self-fulfilling prophecy,” he said. The implication is that market psychology and the presence of ETFs have tempered the classic boom-bust rhythm that many investors associate with BTC.
Looking ahead, Scaramucci warned that BTC is likely to remain choppy for most of the year, with a renewed bull market emerging in the fourth quarter of 2026. He noted that the broader market narrative at the time had shifted away from a straightforward ascent toward a more nuanced trajectory, where macro and policy factors would matter just as much as on-chain signals.
The conversation also touched on the expectations that had circulated in late 2024 and early 2025. Market participants, including Scaramucci, had anticipated BTC could surge toward around $150,000 in 2025, driven by broad political momentum and regulatory openness in the United States. That consensus was upended by a sharp October downturn that pulled BTC from a prior peak to a much lower range, underscoring how quickly sentiment can swing in crypto markets.
History has repeatedly shown that price movements often defy prevailing sentiment. Scaramucci pointed to the early 2023 period, when BTC’s price action moved contrary to bright-eyed forecasts in the wake of the FTX collapse in November 2022. After a period of disinterest and malaise, the market reversed into a new upcycle, illustrating how catalysts can reset the mood even when the broader narrative appears unfavorable.
Key takeaways
- The four-year cycle remains a reference framework for BTC, but ETF inflows have muted its volatility and potentially altered how the cycle plays out.
- BTC is expected to experience choppy trading through much of this year, with the next major leg higher anticipated in the fourth quarter of 2026.
- Market expectations for a 2025 surge to around $150,000 were fueled by pro-crypto policy signals and regulatory warming, but an October crash shattered that consensus.
- Historical reactions show BTC can rebound after episodes of apathy or negative catalysts, reinforcing the idea that macro shocks and sentiment swings remain powerful drivers.
- Geopolitical developments and stock-market dynamics can influence BTC through correlations with risk assets, underscoring the need to monitor macro risk sentiment alongside on-chain activity.
The cycle, ETFs, and the evolving market backdrop
In the eyes of Scaramucci, the presence of BTC-focused exchange-traded funds has changed the game. ETFs offer a new, regulated channel through which institutional players can gain exposure, potentially dampening sharp drawdowns and tempering the kind of volatile spikes that once defined BTC cycles. This shift does not erase the cycle’s specter, but it reframes it—turning a potentially binary up- or down-market into a more nuanced, information-rich environment in which policy signals and fund flows matter as much as supply-demand fundamentals.
That framing sits alongside long-standing debates within the crypto industry about whether the four-year cycle remains intact. While some observers point to deviations in late 2025 or 2026, others, including Scaramucci, argue that the cycle still offers a useful heuristic for investors trying to gauge risk, duration, and potential turning points. The market’s sensitivity to events such as regulatory announcements, ETF inflows, or major macro shocks continues to complicate any simple forecast.
From peak to pause: how catalysts have shifted the narrative
The historical arc cited by Scaramucci stretches from BTC’s all-time run toward lofty levels to the subsequent retrenchment that has colored investor psychology for years. The narrative notes that BTC once traded near the upper stratosphere—around a $126,000 range in prior cycles—before the October pullback. From there, the price retraced to the $60,000 area, highlighting how quickly sentiment can reverse and the importance of liquidity and risk appetite in determining the price path.
Beyond these cycles, the market’s reaction to external shocks—such as the FTX collapse in late 2022—has underscored a pattern: even after periods of disillusionment, bitcoin has demonstrated resilience, often resuming an uptrend when investor interest returns and liquidity improves. The early months of 2023, in particular, showed that upside moves can unfold despite a broader backdrop of skepticism or unfavorable headlines.
Another facet of the discussion centers on whether 2025 and 2026 would deliver a fresh bull phase. While the consensus among several participants had anticipated a robust climb in 2025, the trajectory was interrupted by the October downturn and broader risk-off dynamics. The question remains whether the market will reassert its longer-term cycle or whether a new regime—shaped by macro policy, regulatory clarity, and global liquidity—will redefine BTC’s pace and scale.
Geopolitics, risk sentiment, and BTC’s market correlations
Macro shocks have always tested BTC’s claimed role as a hedge or diversifier. The recent wave of geopolitical tension and global risk-off periods have at times coincided with renewed pressure on risk assets, and BTC has not been immune. In the most recent turn, BTC dipped below a key psychological level in the wake of intensifying geopolitical events. At the same time, traditional stock indices have faced renewed selling pressure; the S&P 500 fell around 1.3% as the week closed, dipping below a widely watched moving average and highlighting a possible shift in the correlation between BTC and mainstream markets.
Analysts have warned that if BTC continues to exhibit a sustained positive correlation with equities, its downside could be more pronounced in risk-off environments—potentially amplifying losses in a scenario where macro catalysts favor traditional assets. Yet the crypto market has shown episodic decoupling at different points in history, illustrating that the relationship is not fixed and can diverge as new liquidity channels and market participants come into play.
The ongoing debate about Bitcoin’s cycle, and whether it remains a reliable compass for pricing, continues to draw attention from investors and researchers. Some industry voices argue that structural shifts—such as increasing institutional participation, evolving derivatives markets, and tighter regulation—could render the old four-year narrative less predictive than it once was. Others maintain that the cycle still captures a collective behavior pattern—cyclical expectations that influence trading and risk management, even if the visible price path changes in response to external shocks.
For readers seeking a synthesis, it’s not simply a question of whether the cycle endures, but how its cues interact with a broader market fabric that includes policy developments, ETF demand, and macro risk appetite. The interplay among these factors will likely determine how BTC navigates the remainder of this decade.
Longer-form reflections on the cycle’s fate have appeared in industry circles, including discussions in crypto-focused media that weigh the structural shifts against historical precedent. The tension between a legacy four-year rhythm and new market realities remains a core theme for traders and builders alike, as they assess timing, risk controls, and capitalization strategies in a landscape defined by rapid change and evolving incentives.
As the community weighs these signals, investors should stay alert to ETF flow data, central-bank signals, and regulatory developments that could reshape the calculus of risk and reward. The next few quarters will be telling in terms of whether BTC can establish a fresh breakout or whether the cycle will again be interrupted by macro or policy-driven shocks.
Looking ahead, observers will be watching how the market absorbs geopolitical risks, how the S&P 500 and other risk assets respond to policy news, and how BTC trades as liquidity conditions shift. The implications extend beyond price alone: they touch on institutional adoption, derivative markets, and the broader narrative around crypto’s role in diversified portfolios.
For now, the path remains uncertain but informed by a set of recognizable patterns and new inflows. The pace of ETF participation, the resilience of risk sentiment, and the cadence of regulatory clarity will help determine whether BTC’s next major leg higher lies in late 2026 or in a broader, more gradual re-acceleration beyond that horizon.
Readers should watch for how ETF allocations evolve and whether macro catalysts—such as policy shifts or geopolitical developments—alter the balance of risk and return in the coming months. The question of whether Bitcoin’s four-year rhythm endures or evolves is unlikely to be settled in the near term, but the signals from fund flows, price action, and policy readiness will continue to shape market expectations.
Keely Hodgkinson wins gold as she storms 800m title in record time

The CLARITY Act Is Under Threat of Depayment Delay Although a Stablecoin Deal Is Being Made

US Promotes Iran Peace negotiations as Trump announces military reduction


-

 Fashion2 days ago
Weekend Open Thread: Adidas – Corporette.com
-

 Politics2 days ago
Jenni Murray, Long-Serving Woman’s Hour Presenter, Dies Aged 75
-
 Tech5 days ago
Are Split Spacebars the Next Big Gaming Keyboard Trend?
-

 Crypto World22 hours ago
Best Crypto to Buy Now: Strategy Just Spent $1.57 Billion on Bitcoin During Fear While Early Investors Quietly Enter Pepeto for 150x Potential
-

 News Videos4 days ago
RBA board divided on rate cut, unusually buoyant share market | Finance Report | ABC NEWS
-

 Crypto World23 hours ago
Bitcoin Price News: Bhutan Sells $72 Million in BTC Under Fiscal Pressure, but the Smart Money Entering Pepeto Sees What the Market Does Not
-
 Crypto World2 days ago
NIO (NIO) Stock Plunges 6.5% as Shelf Registration Sparks Dilution Worries
-

 Business6 days ago
Australian shares drop as Iran war enters third week
-

 Crypto World6 days ago
Crypto Lender BlockFills Enters Chapter 11 with Up to $500M in Liabilities
-

 Politics4 days ago
The House | The new register to protect children from their abusers shows Parliament at its best
-

 Fashion6 days ago
25 Celebrities with Curly Hair That Are Naturally Beautiful
-

 Tech3 days ago
inKONBINI Lets You Spend Summer Days Behind the Register
-
 Politics5 days ago
Real-time pollution monitoring calls after boy nearly dies
-

 Crypto World4 days ago
Canada’s FINTRAC revokes registrations of 23 crypto MSBs in AML crackdown
-
 NewsBeat4 days ago
Residents in North Lanarkshire reminded to register to vote in Scottish Parliament Election
-

 Business6 days ago
Meta planning major layoffs as AI spending and automation reshape workforce
-

 News Videos4 days ago
PARLIAMENT OF MALAWI – PAC MEETING WITH REGISTRAR OF FINANCIAL ON AMARYLLIS HOTEL – INQUIRY LIVE
-
Entertainment6 days ago
Oscars reunite Rob Reiner supergroup of 17 stars for emotional tribute: Here's who appeared on stage
-

 Business4 days ago
Who Was Alex Pretti? 5 Key Facts About the ICU Nurse Killed by Federal Agents in Minneapolis
-

 Politics3 days ago
Gender equality discussions at UN face pushbacks and US resistance
You must be logged in to post a comment Login