
Crypto World
Revival to $80K or Brutal Crash Below $30K?
“Are you actually prepared for the longest bear market in history,” one analyst asked.
Bitcoin bears have been in control lately, with the asset trading well below last year’s peak levels.
The question now is whether BTC can stage a decisive comeback or if a new painful pullback is on the way.
The Bullish Scenario
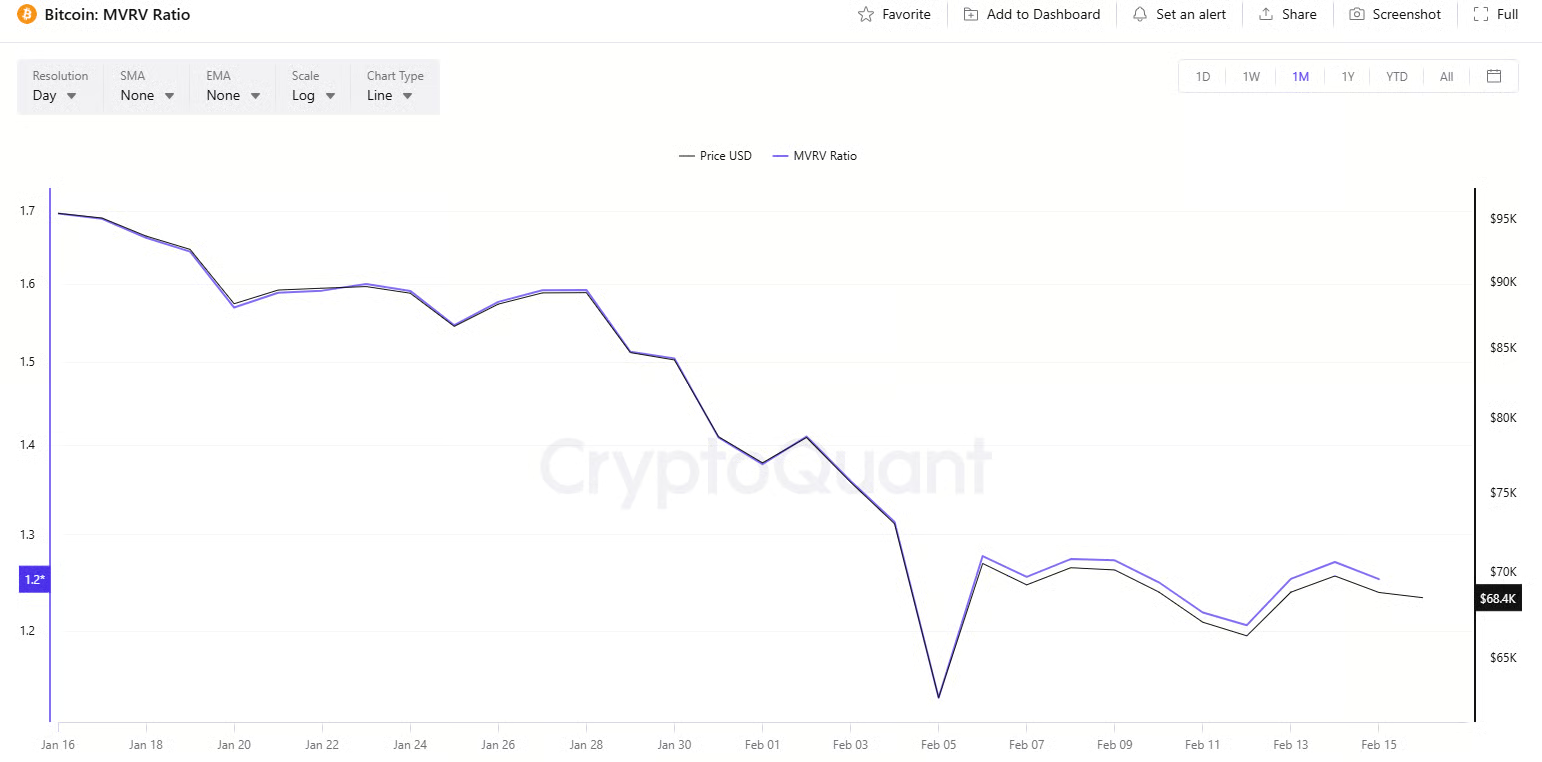
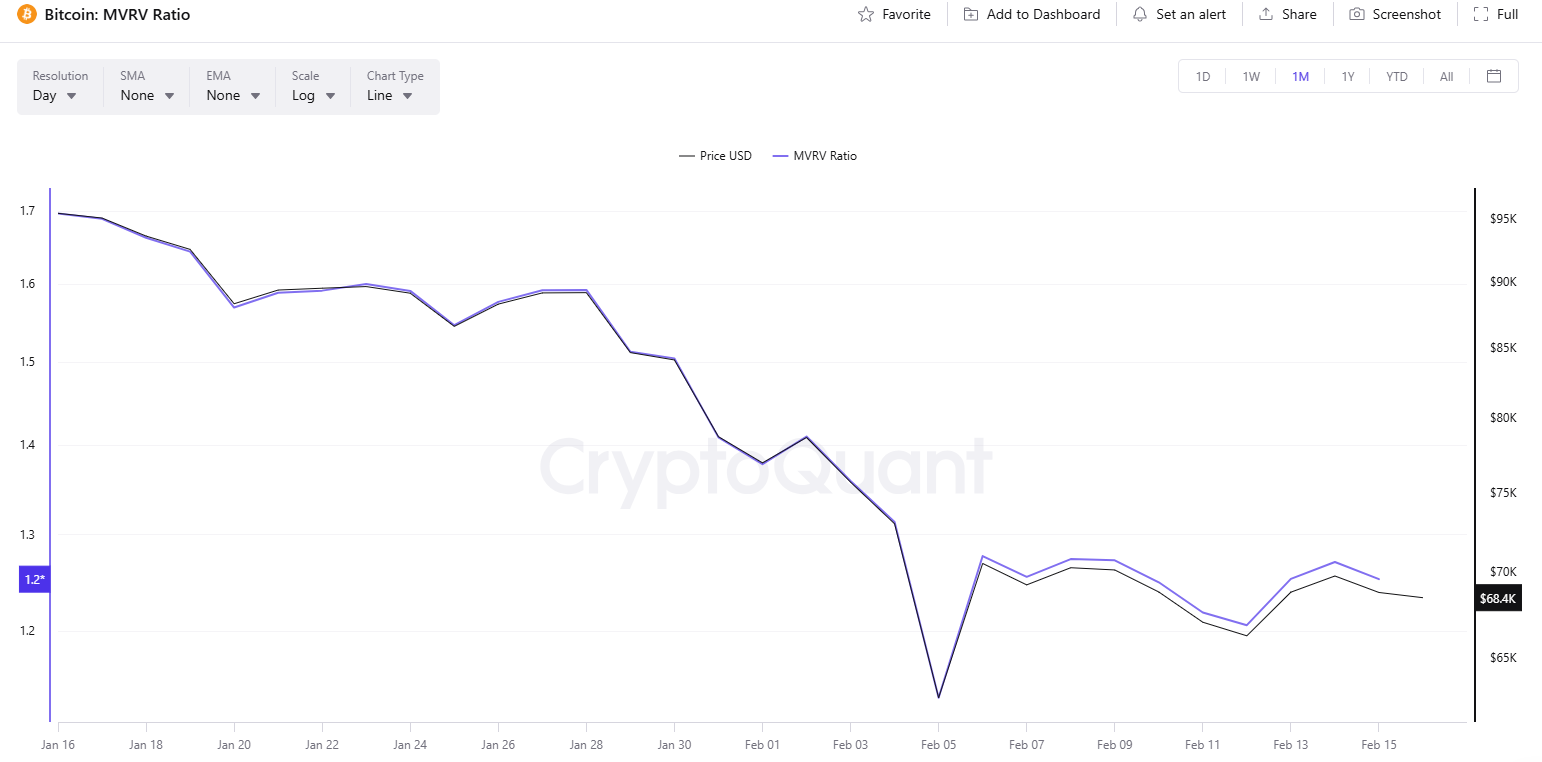
The primary cryptocurrency started the month on the wrong foot, with the correction intensifying on February 6 when it plummeted to around $60K, the lowest point since October 2024. In the following days, it reclaimed some lost ground and currently trades at approximately $68,200 (per CoinGecko’s data).
One person touching upon the most recent price dynamics of BTC is the popular analyst Ali Martinez. He assumed that the asset appears to have formed an “Adam & Eve” pattern, in which a break above $71,500 could trigger an additional pump to $79,000.
The bullish setup consists of two bottoms: a sharp drop (Adam) followed by a rounder one (Eve). Some traders see it as a sign that selling pressure is fading and that the price may post a substantial short-term revival.
Bitcoin’s Market Value to Realized Value (MVRV) supports the bullish outlook. The index compares the current value of all BTC to the price people initially paid to acquire their holdings. High ratios mean that investors are sitting on big profits and could increase selling pressure, whereas low readings might be interpreted as the end of the bear market.
Over the past few weeks, the MVRV has been steadily declining and now sits near 1.25. According to CryptoQuant, ratios above 3.7 indicate a price top, while values under 1 hint that the bottom could have been reached.
You may also like:
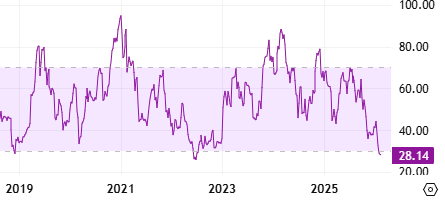
Bitcoin’s Relative Strength Index (RSI) is also worth observing. The technical analysis tool measures the speed and magnitude of recent price changes and provides traders with indications of potential reversal points. It ranges from 0 to 100, with values below 30 seen as buying opportunities and suggesting that BTC may be oversold. On the contrary, ratios above 70 are generally considered a warning of a possible pullback. The RSI has fallen to 28 on a weekly scale.
The Bear Phase Is Just Starting?
Other analysts, including Chiefy, believe another painful decline is the more likely option for BTC in the short term. The X user argued that the asset might be on the verge of a major dump to $29,000 as early as this week and added:
“The final Bull Trap of 2026 is over, and according to this chart, the next crash has already started. Are you actually prepared for the longest bear market in history?”
Meanwhile, BTC balances on centralized exchanges have been climbing in recent weeks. Although this development doesn’t guarantee further downside, it could be interpreted as a bearish sign because it means the number of coins that can be offloaded at any time is increasing.

SECRET PARTNERSHIP BONUS for CryptoPotato readers: Use this link to register and unlock $1,500 in exclusive BingX Exchange rewards (limited time offer).


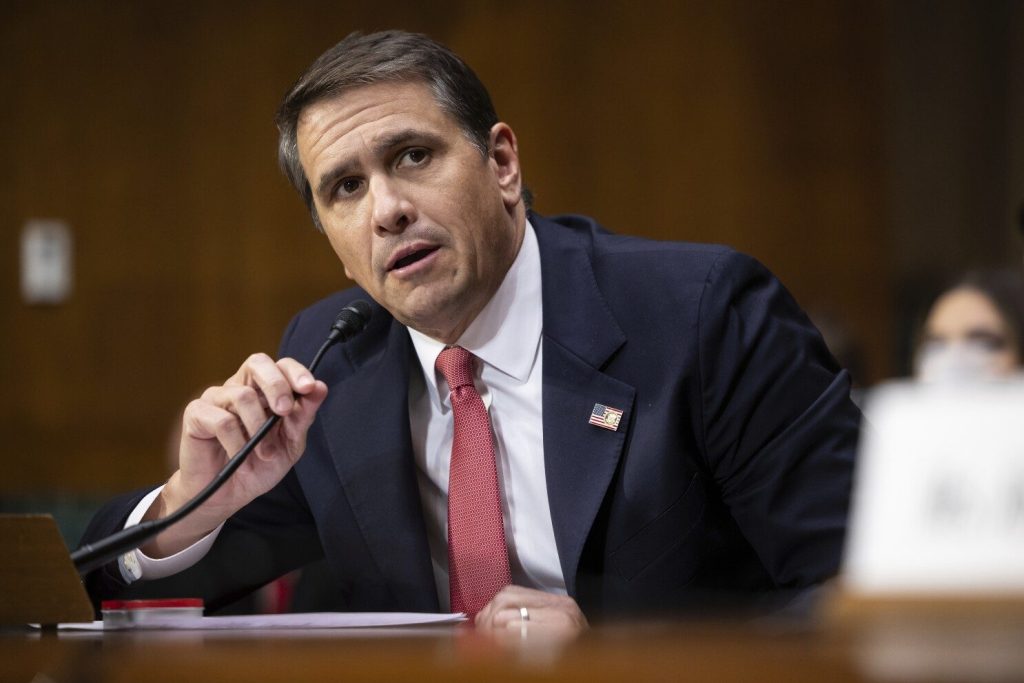
Todd Blanche is now the interim head of the Department of Justice, and the crypto industry is paying attention for a specific reason that has nothing to do with his biography.
President Trump announced Thursday that Blanche, previously serving as deputy attorney general, would replace Pam Bondi as Attorney General. The real headline: the man who authored the DOJ’s crypto enforcement memo now controls the institution that executes it.
Blanche signed the four-page directive in April 2025 that disbanded the DOJ’s National Cryptocurrency Enforcement Team and instructed prosecutors to stand down from regulatory-violation cases against the crypto industry. That document has already reshaped at least one active prosecution. Its author now runs the department.
Key Takeaways:
- Who He Is: Todd Blanche, Trump’s former personal criminal defense attorney, was confirmed as deputy attorney general in March 2025 and is now interim AG following Pam Bondi’s removal.
- What the Memo Did: Blanche’s April 2025 DOJ memo disbanded the National Cryptocurrency Enforcement Team and barred prosecutors from pursuing regulatory violation cases against crypto firms.
- Ethics Exposure: A ProPublica investigation found Blanche held between $159,000 and $485,000 in crypto assets – including BTC, ETH, SOL, and ADA – when he signed the enforcement memo, potentially violating his divestiture pledge.
- Enforcement Scope: The memo’s reach has already been tested in the Southern District of New York’s case against Tornado Cash developer Roman Storm, where one charge was dropped after prosecutors cited it.
- DeFi Regulation Impact: With Blanche now at the top, enforcement posture on DeFi protocols, mixing services, and unhosted wallets is unlikely to harden in the near term.
- What to Watch: Whether Blanche pursues permanent nomination and how his interim tenure intersects with ongoing federal legislative debates – including FIT21 and the GENIUS Act – will determine how durable this enforcement reset actually is.
Discover: The Best Crypto Presales Live Right Now
What the DOJ Crypto Enforcement Memo Actually Does – and Why Todd Blanche Authorship Changes the Calculus
The memo Blanche signed last April did two things simultaneously: it eliminated the DOJ’s dedicated crypto prosecution unit and it narrowed the prosecutorial mandate to fraud and clear criminal conduct, pulling back from the Biden-era framework that treated regulatory non-compliance as a criminal predicate.
The National Cryptocurrency Enforcement Team, formed in 2022, had been the institutional infrastructure for that broader approach.
The document’s downstream effects were immediate. In the SDNY’s case against Tornado Cash developer Roman Storm, prosecutors referenced the DOJ memo before dropping one charge against Storm – a direct application of the new enforcement philosophy to an active DeFi regulation case.
Storm was later convicted on a separate charge and faces retrial on two more, but the memo’s influence on prosecutorial discretion is already on the record.
Blanche’s elevation to interim Attorney General doesn’t change the memo’s text. It does remove any institutional uncertainty about whether it would survive a leadership transition. The man who wrote the policy now sets DOJ priorities at the highest level.
Discover: The Best Crypto to Get Right Now
Blanche as Interim AG – What Shifts for DeFi, Mixing Services, and Offshore Platforms
The immediate enforcement implication is continuity, not escalation. DOJ under Blanche is unlikely to reopen the regulatory-violation runway the memo closed. That matters most for DeFi protocols operating under uncertain legal status and for mixing services that had been in the crosshairs of the prior enforcement framework.
What’s less settled is the ethics exposure Blanche carries into the role. ProPublica reported that Blanche held crypto assets worth between $159,000 and $485,000 at the time he signed the enforcement memo – a potential violation of his divestiture pledge.
His most recent government ethics disclosure shows he subsequently transferred holdings in Bitcoin, Solana, ADA, Ethereum, Polygon, DOT, and Quant to his children and grandchild. That timeline is now a liability, not a footnote.
For exchanges navigating jurisdiction-specific compliance – the kind of localized licensing pressure seen as platforms push into regulated U.S. markets – the Blanche appointment signals that federal enforcement will remain restrained even as state-level regulators operate independently. The divergence between federal pullback and active state enforcement is the tension that defines this moment.
CBS News reported expectations of a prolonged interim tenure, citing Senate confirmation challenges for a permanent AG. Trump praised Blanche on Truth Social as “a very talented and respected legal mind”; Blanche responded on X: “Thank you for the trust and the opportunity to serve.”
With FIT21 and broader crypto market structure legislation still unresolved in the Senate, the durability of Blanche’s enforcement reset depends heavily on whether Congress codifies the regulatory boundaries the memo only sketched – and whether his ethics exposure becomes a confirmation obstacle before that happens.
Explore: The best pre-launch token sales with asymmetric upside potential
The post Crypto Enforcement Architect Todd Blanche Named Interim Attorney General appeared first on Cryptonews.
Crypto World
Hyperliquid Coin Price Prediction: HYPE Gains Traction While Pepeto Lands on CoinMarketCap With 300x Ahead Of Binance Official Launch
Hyperliquid just launched its mobile app and clocked $205 billion in monthly trading volume, and the hyperliquid coin price prediction now targets $41 by April. With the entire decentralized trading category being treated as a serious threat to the old guard, the signal of where capital flows next is confirmed even as major coins correct.
As a result, traders are entering presale entries in large numbers hoping to find the return that established tokens no longer deliver. With the confirmed Binance listing just days away, the opportunity to enter Pepeto at presale price is shrinking fast. This inspired massive capital rotation as the project has been projected by analysts to deliver 100x to 300x.
Hyperliquid Coin Price Prediction: HYPE Launches Mobile App as $17 Million Oil Liquidation Shakes the Platform
Hyperliquid launched its mobile app MVP on Google Play on April 1 and recorded a $17 million Brent oil liquidation after Trump’s Iran speech, the largest single crypto liquidation of the week.
According to CoinEdition, HYPE trades at $35.65 after pulling back from $44 highs with the Keltner Channel pressing the lower band. 99Bitcoins confirmed HYPE is up 20% on the month, making it one of the strongest performers in 2026.
Pepeto and Hyperliquid forecast heading into April
Pepeto: The wallets buying now are the ones who will enjoy the returns when the listing arrives
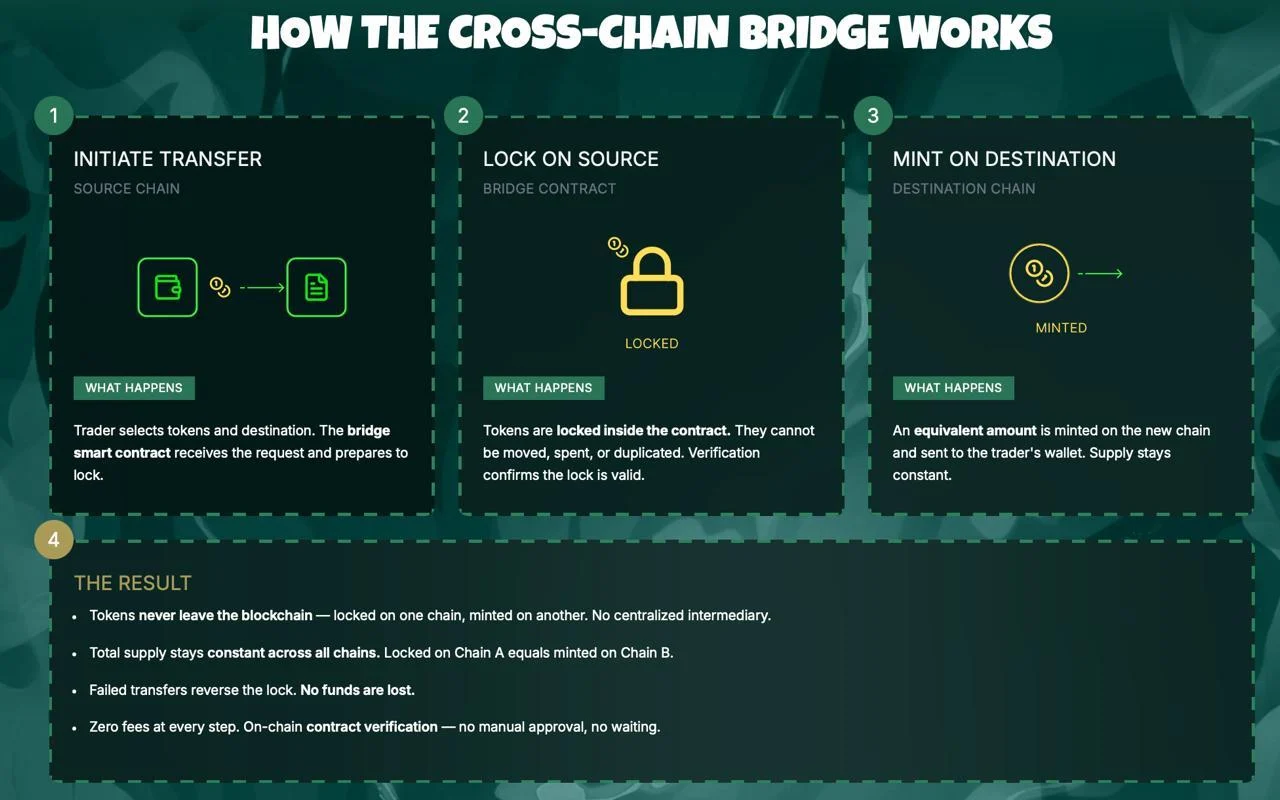
Retail traders often feel like they are running blind in a market where most signals are noise and the real opportunities vanish before you can act. Pepeto just landed on CoinMarketCap, confirming the Binance listing draws closer by the day. The exchange platform eliminates that problem with a working exchange platform that cuts through the chaos.
The cross chain bridge moves meme tokens between networks in seconds and the discovery engine surfaces new projects at their earliest price, making it simple to find entries before the crowd and act before the opportunity fades. The interest in this kind of daily tool is strong because Pepeto raised more than $8 million at $0.000000182 during the worst fear readings since 2022.
Wallets are already rushing in to reserve the presale entry because, in addition to delivering the working exchange, Pepeto also inspired 100x to 300x projections from analysts once Binance volume opens. SolidProof cleared the contract before the presale opened, a cofounder of the original Pepe token leads the project, and a former Binance professional drives the listing from inside the dev team. With 420 trillion tokens, an FDV near $78 million, and staking at 188% APY compounding daily, buying at presale price before the listing is the one decision that turns your capital into 300x returns, and the wallets entering now are locking in that return before the listing sets the price.
Hyperliquid coin price prediction: HYPE targets $41 by April and $58 by year end from $35.65
HYPE trades at $35.65, down from its $59 all time high per CoinMarketCap. According to CoinPedia, the HYPE forecast targets $41 by April and up to $90 by year end in the bull case.
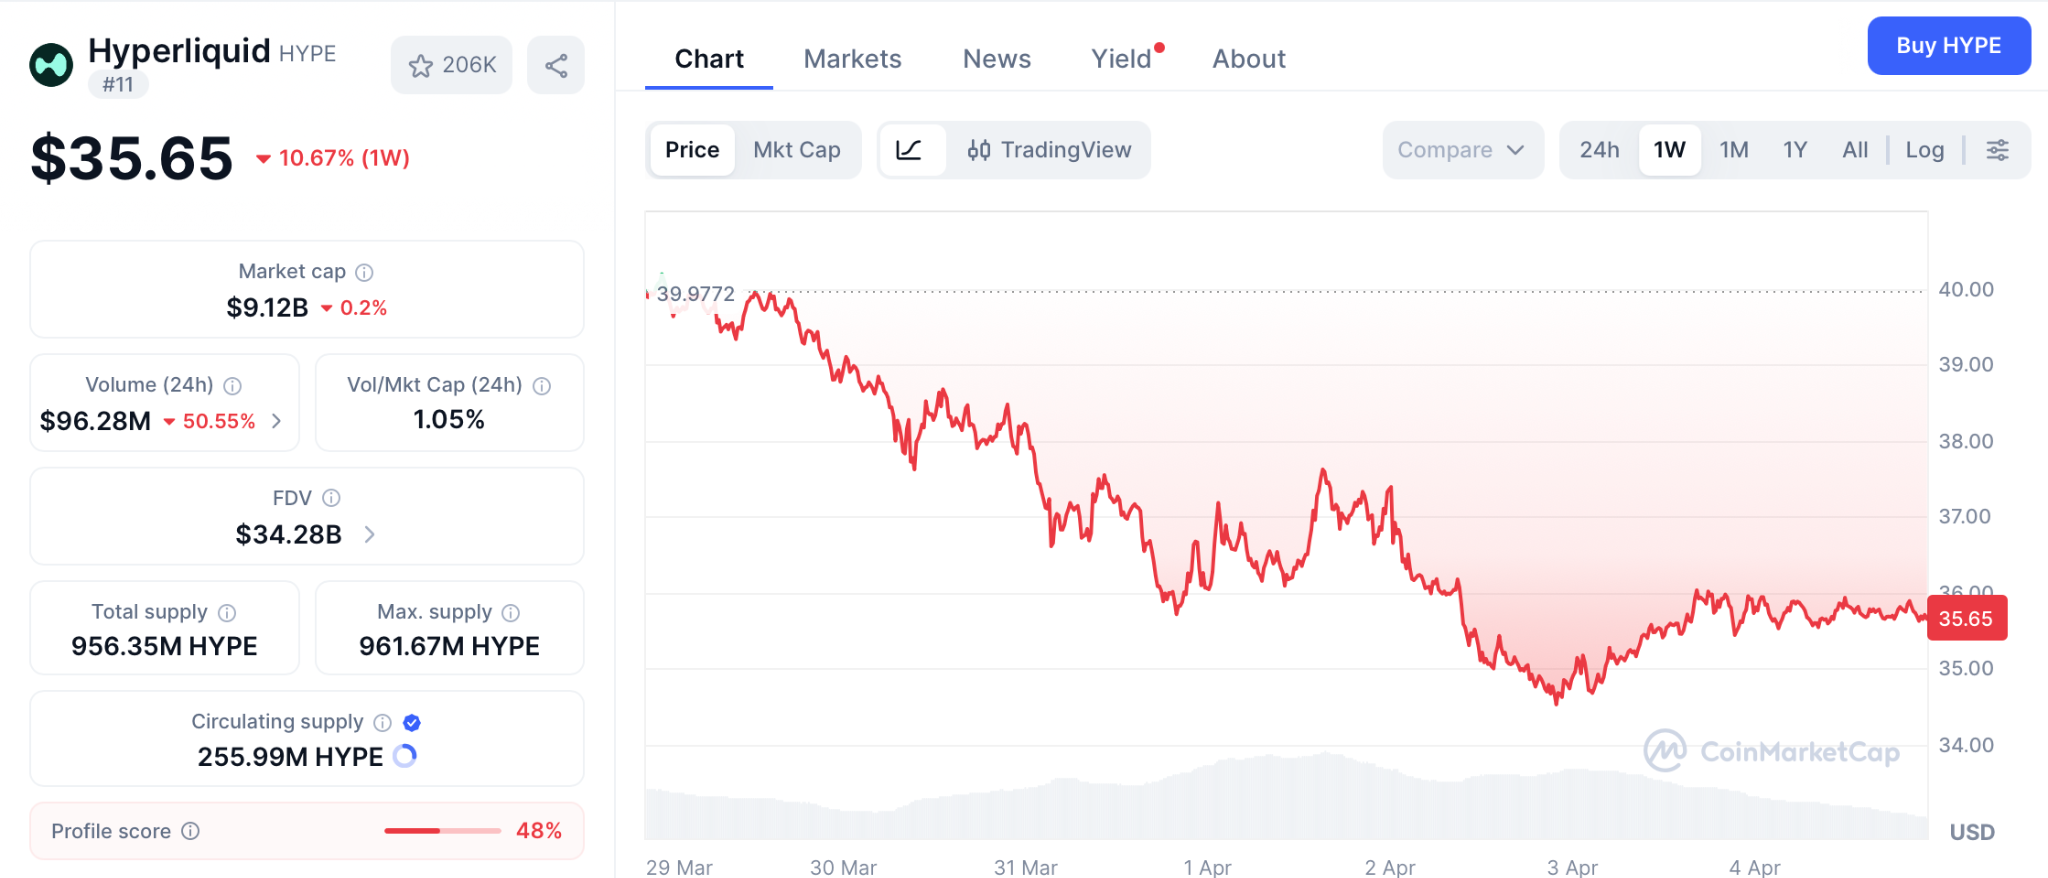
A move from $35.65 to $58 delivers about 66%, strong for a mid cap but structurally limited by a $9.12 billion valuation that needs enormous new capital to deliver more.
Conclusion
The hyperliquid coin price prediction points to limited returns at $9 billion, but despite the Binance listing being days away, Pepeto is still a ground floor play that already has everything necessary to break out, and the wallets entering at presale price are locking in the return that becomes unreachable the moment Binance sets the open market price.
Moonshots are hard to find in a market where HYPE needs billions in new capital to move another 66%, but Pepeto’s working exchange, SolidProof audit, Pepe cofounder, and confirmed Binance listing make the 100x to 300x projection feel grounded because the utility is real, the capital is confirmed, and the listing is the catalyst that converts presale price into the returns that every wallet buying after the listing pays full price to chase.
Visit the Pepeto official website and enter now because buying at presale price before the listing is how the biggest returns in crypto are made and missing this entry means missing the returns the listing delivers.
Click To Visit Pepeto Website To Enter The Presale

FAQs
What is the HYPE forecast for 2026?
HYPE targets $41 by April and $58 to $90 by year end. Pepeto at presale price with a confirmed Binance listing and 100x to 300x projections offers the return ceiling HYPE cannot reach from its $9 billion cap.
Why are hyperliquid coin price prediction followers looking at Pepeto?
HYPE delivers 66% at best from $35.65. Visit the Pepeto official website to see the working exchange and Binance listing that position it for 300x returns from presale price.
Is Pepeto a stronger entry than the HYPE forecast suggests?
HYPE is one of the strongest performers in 2026, but at $9 billion the explosive returns belong to its past. Pepeto at presale price with a confirmed listing is where that kind of return is still available.
Disclaimer: This is a Press Release provided by a third party who is responsible for the content. Please conduct your own research before taking any action based on the content.

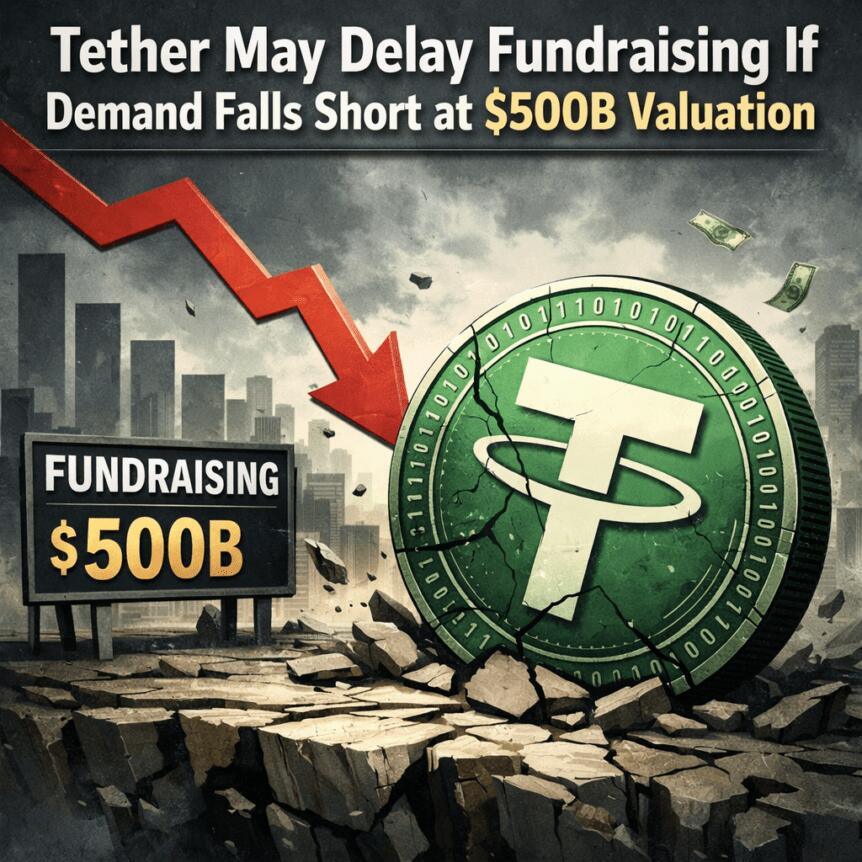
Tether is accelerating a private fundraising push, aiming to secure fresh capital at a stated valuation near $500 billion within a short window. People familiar with the matter say the round could close within roughly two weeks, but management has signaled it may push back the timeline if investor demand falls short of expectations.
The Information reported last Friday that Tether has been seeking new investment since late last year, with the $500 billion target circulating as the implied valuation behind a potential raise. The report notes that if commitments don’t meet expectations, the company is likely to delay the round. The scaled ambition would position Tether among the world’s largest financial firms by market value, far eclipsing most traditional banks outside of JPMorgan Chase, should the round proceed as planned.
According to The Information, the fundraising plan could amount to up to $20 billion in private placements, representing roughly a 3% stake in the company. Cantor Fitzgerald was cited as the lead adviser for the deal. If completed, the round would mark a notable shift for the stablecoin issuer, extending Tether’s reach beyond plain-vanilla stablecoins into broader financial and commodity-related ventures as it frames a multi-line expansion strategy.
Valuation context helps frame the scale. JPMorgan Chase, often cited as the largest bank by market capitalization, sits around $795 billion, with Bank of America at about $353 billion. Tether’s USDt stablecoin — the world’s largest stablecoin by market cap — was around $184 billion at the time of reporting, illustrating the gap between a private fundraising target and the actual on-chain liquidity footprint. Beyond USDt, Tether’s product line includes Tether Gold (XAUt) and Tether EURt (EURt), pegged to gold and the euro respectively, underscoring a broader asset management and distribution strategy alongside its core stablecoin business.
Key takeaways
- The fundraising round aims for a $500 billion implied valuation, with commitments due within about two weeks and a potential delay if demand falters.
- The plan reportedly envisions raising up to $20 billion for roughly a 3% stake, positioning Tether as a major new investor in its own enterprise expansion.
- The Information cites unnamed sources; Cantor Fitzgerald is said to be the lead adviser on the deal.
- Past statements by Tether executives have fluctuated between discussing hypothetical scenarios and signaling active fundraising, with public comments differing from earlier reports.
- Separately, Tether is moving toward a formal audit of USDt, signaling a governance shift as it seeks broader external validation of its reserves and internal controls.
Tether’s fundraising push and the valuation calculus
The Information’s reporting situates Tether’s private fundraising as a strategic attempt to accelerate growth across existing and new business lines — including stablecoins, distribution ubiquity, and potential ventures into AI, commodity trading, energy, and media — by several orders of magnitude, according to statements attributed to the company’s management on X. The publication notes that in September of last year, Bloomberg reported Tether was exploring a raise of up to $20 billion that could value the company around $500 billion, with plans for a private placement that would imply roughly a 3% stake. Cantor Fitzgerald was named as the lead adviser in that report, underscoring the seriousness of the capital-formation effort at a scale rarely seen in the crypto‑fintech space.
Publicly available comments from Tether’s leadership have been nuanced. In February, Paolo Ardoino, Tether’s chief executive, told Cointelegraph that earlier discussions about a $20 billion fundraising scenario were hypothetical rather than an active plan. He argued that the valuation framing reflected the company’s earnings power by comparing it with AI-driven platforms in terms of potential profitability, yet stopped short of articulating a concrete timetable or commitment to raising a specific amount. The company did not respond to Cointelegraph’s requests for comment before publication, leaving investors with a varying degree of clarity about the path forward.
For investors assessing the deal, the implied $500 billion valuation invites comparisons with traditional financial institutions. JPMorgan Chase remains the benchmark large-cap bank by market capitalization, while Bank of America sits notably smaller. USDT’s role in the crypto ecosystem — as the largest stablecoin by market cap at roughly $184 billion — amplifies questions about how a private round and expanded business lines could influence reserve management, liquidity provisioning, and regulatory scrutiny in the months ahead. The market cap figures provide rough scale but do not translate directly into the credit or solvency profile of a private fundraising round; nonetheless, they underscore the magnitude of the ambition behind such a round for a crypto infrastructure firm with a global footprint.
Audits and governance: a shift toward external validation
Beyond fundraising chatter, Tether has moved to bolster governance through formal auditing. The Financial Times reported that Tether has engaged KPMG to conduct its first full audit of USDt’s financial statements, with PwC assisting in preparing internal systems. This marks a shift away from relying solely on reserve attestations from BDO Italia toward a comprehensive audit that would scrutinize assets, liabilities, and internal controls across Tether’s balance sheet. While a reserve attestation provides a snapshot of reserve backing, a full audit promises a more complete view of financial health and governance practices — a development that could affect how market participants perceive USDt’s resilience during stress scenarios.
The push toward external audit coverage aligns with growing calls in the industry for greater transparency around stablecoin reserves and liquidity risk. If successful, the KPMG-led audit could set a new benchmark for the sector and influence conversations with regulators and potential counterparties seeking deeper assurance about stablecoin inventories and treasury management. Tether’s current stablecoin business remains dominant, but how the audit findings are interpreted will likely hinge on the scope, timing, and exact audit opinions delivered by the Big Four firm, alongside any remediation measures the company implements in response to findings.
Related coverage and discussions have emphasized the importance of credible audits to reduce counterparty risk and to bolster confidence among users and institutions that rely on USDt for liquidity, payments, and cross-border transfers. Meanwhile, Tether’s broader product suite — including XAUt and EURt — continues to position the issuer as a diversified, though still crypto-centric, financial services provider. The outcome of the audit process could influence not just USDt’s perceived safety but also investor appetite for any future fundraising rounds and strategic investments tied to the company’s growth plan.
What to watch next in the evolving stablecoin landscape
Several factors will shape the trajectory of Tether’s fundraising, governance initiatives, and broader market impact. First, investor appetite for a multi-hundred-billion-dollar implied valuation hinges on the perceived durability of USDt’s reserves and the credibility of a full audit. Market participants will look for clear outcomes from the KPMG-led audit, including a transparent accounting of assets, liabilities, and internal controls, as well as any findings that could affect reserve adequacy or liquidity management.
Second, regulatory developments across major jurisdictions will influence both the feasibility and timing of large-scale fundraising by a crypto infrastructure firm with a global footprint. While the exact regulatory status of stablecoins remains unsettled in several markets, a demonstrated commitment to external audits can help ease some concerns, though it does not guarantee regulatory approvals or blanket acceptance.
Third, the strategic rationale behind a $500 billion valuation deserves scrutiny. If the fundraising proceeds, investors will want a clear articulation of how proceeds would be deployed to accelerate growth across existing and new business lines, how this expansion would affect the stability and liquidity of USDt, and what governance reforms might accompany scaled operations. The contrast between historical statements that framed funding rounds as hypothetical and the current push toward a defined private placement underscores the need for clarity on governance, risk, and long-term value creation for holders of USDt and related products.
Finally, observers should monitor how market dynamics respond to such a bold capital raise in a sector that already features intense competition among stablecoins, evolving custody and settlement infrastructure, and a continually shifting regulatory climate. The upcoming weeks and months will be telling as Tether balances fundraising ambitions with ongoing governance improvements and broader market sentiment around stablecoins’ role in decentralized finance, cross-border payments, and the broader crypto economy.
In the near term, investors and users will want to see whether the fundraising timing aligns with demand signals, how the 500 billion valuation is justified by growth prospects, and how the audit findings translate into practical steps for risk management and transparency. As Tether elevates its governance and corporate-financial objectives, the broader market will be watching to determine if the company can sustain its leadership role while addressing the scrutiny that accompanies such an ambitious expansion.
The unfolding narrative around USDt — from fundraising ambitions to audit commitments — will likely shape conversations about stablecoin resilience, regulatory expectations, and the path to broader financial integration for crypto-native infrastructure players. Readers should stay tuned for updates on the audit progress, the fundraising milestones, and any formal responses from Tether as it navigates investor feedback and external oversight.
Sources and additional context: The Information reported on the fundraising push and $500 billion valuation plan; September Bloomberg reporting on a potential $20 billion raise with Cantor Fitzgerald as adviser; public statements from Paolo Ardoino on X regarding the fundraising discussions; Cointelegraph coverage of Ardoino’s February comments; Financial Times reporting on Tether engaging KPMG for USDt’s first full audit, with PwC assisting; reserve attestations previously provided by BDO Italia; USDt market capitalization data from CoinMarketCap.
Related coverage: Stablecoin supply dynamics and comparative positioning among major tokens continue to evolve as centralized issuers seek greater transparency and scale.

Bitcoin’s future resilience and decentralization hinge on how conservatively its core node software evolves. Jimmy Song, co-founder of ProductionReady—a non-profit funding open-source Bitcoin node development and education—argues for a “conservative” client approach. In his view, preserving Bitcoin’s monetary properties means resisting large-scale code changes unless there is overwhelming community support.
ProductionReady has a stated bias against major software overhauls, and Song told Cointelegraph the principle is simple: if a change isn’t clearly improving the money itself, it shouldn’t be implemented. A key area of interest for the group is data limits within transactions. Song said the organization intends to restore an 83-byte OP_RETURN data limit for non-monetary information, a move aimed at keeping node storage costs manageable and, by extension, broadening participation in running full nodes. He framed it as a practical way to enhance self-sovereignty: “The more self-sovereign Bitcoin users are, the more decentralized and resilient the network becomes. That means keeping the cost of running a node low enough for ordinary people to do it.”
Song’s stance underscores a broader industry debate: how to balance on-chain capability with decentralization. ProductionReady’s position is that excessive data requirements, if not carefully bounded, can deter everyday users from operating nodes and inadvertently centralize verification power among a smaller group of participants.
Key takeaways
- Conservative node design aims to preserve Bitcoin’s monetary properties and prevent centralization by keeping operational costs accessible to ordinary users.
- ProductionReady advocates restoring the 83-byte OP_RETURN limit for non-monetary data to curb data bloat while preserving self-sovereignty.
- Bitcoin Core’s latest upgrade era has intensified debates over data limits and on-chain spam, prompting renewed attention on node accessibility and network health.
- Bitcoin Knots has gained traction as an alternative node implementation, rising to roughly 4,700 nodes and about 21.7% of the network, according to Coin Dance data.
- The 2024 baseline for Knots was near 1%, highlighting a dramatic shift in the node ecosystem following Core’s changes.
OP_RETURN debate reshapes the node landscape
Central to the discussion is how non-monetary data is handled in Bitcoin transactions. In 2024–2025, the community has grappled with on-chain data limits and their impact on both spam prevention and node operability. The targeted 83-byte cap—designed to allow small metadata without enabling widespread data bloat—has become a focal point for those who see it as essential to maintaining lower running costs and broader participation in network validation. ProductionReady’s approach reflects a cautionary stance: if a protocol change risks making running a node expensive or technically daunting, it should be scrutinized carefully and backed by broad support.
Market observers note that data limits are more than technical details; they influence who can participate in securing the network. In a Bitcoin ecosystem where the number of full nodes acts as a gauge of decentralization, conservative limits can help keep the barrier to entry approachable for independent operators, hobbyists, and smaller operators alike.
Core v30 and the rise of Bitcoin Knots
The past year has seen a dramatic shift in how many participants run non‑core node software. In October 2025, Bitcoin Core version 30 rolled out with a controversial change: the OP_RETURN limit was removed from its 83-byte constraint, allowing much larger data payloads—up to 100,000 bytes. The move sparked a robust pushback from portions of the community, with the GitHub pull request for the change drawing roughly four times as many downvotes as upvotes, according to the PR page.
The outcome of Core 30’s rollout appears to have reshaped the node landscape. Bitcoin Knots—an alternative node implementation—surged in usage, with its share rising to multi-thousand nodes. Current figures show about 4,746 Knots nodes, accounting for roughly 21.7% of the Bitcoin network, while Bitcoin Core remains the dominant implementation at about 77.8% share. Coin Dance data firms the Knots share at around 21.7–21.8%, illustrating a material shift in the distribution of node software choices.
Prior to this shift, Knots represented a much smaller slice of the network—roughly 1% in 2024. The post‑Core 30 period has thus been pivotal in broadening the mix of node implementations, with implications for decentralization, governance, and resilience. These dynamics matter not just for operators choosing software, but for the broader community tracking how changes to consensus and validation are tested across diverse implementations.
As the ecosystem absorbs Core 30’s changes, observers are watching whether the increase in Knots adoption translates into deeper decentralization or if other forces—such as infrastructure costs, governance dynamics, or future protocol tweaks—reassert influence over which node implementations proliferate.
For readers and builders, the Bitcoin node conversation remains a practical reminder: the choice of node software affects who can participate in verification, what data can be stored on-chain, and how resilient the network remains against attempted centralization or manipulation. The balance between protocol evolution and accessible participation will likely determine the network’s long-term robustness.
Going forward, market watchers and network participants alike will want to monitor how proposals around OP_RETURN data handling evolve, how wallet and exchange operators respond to changes in node diversity, and whether any further steps are taken to harmonize performance, security, and cost across different node implementations.
What remains uncertain is how much of the ongoing decentralization push will hinge on formal governance signals from the broader Bitcoin community versus the practical realities of how many operators can realistically afford to run full nodes as data and bandwidth demands shift. In the near term, the trend toward greater node diversity appears to be accelerating, signaling a broader rebalancing of the network’s architecture as stakeholders weigh the trade-offs between scalability, data inclusivity, and fortifying the network’s distributed backbone.
The next phase will likely reveal whether more pragmatic limits, incremental improvements, or broader consensus on non-monetary data usage will prevail—an outcome that will shape who can verify transactions and how resilient the system remains to potential centralization pressures.

TLDR:
- MARA sold 15,133 BTC for $1.1B and used most funds to repurchase $1B in convertible debt.
- The company reduced total convertible debt by nearly 30%, lowering it from $3.3B to about $2.3B.
- Layoffs affecting 15% of staff come as MARA restructures operations across multiple departments.
- MARA is shifting focus toward AI and high-performance computing alongside its mining business.
MARA Holdings has begun workforce reductions shortly after executing a large Bitcoin sale and debt repurchase strategy.
The company sold over 15,000 BTC and used most proceeds to reduce outstanding convertible notes, while also adjusting operational priorities.
MARA Executes Bitcoin Sale and Workforce Reduction
A recent update on X shared by Bitcoin News confirmed that MARA Holdings sold 15,133 Bitcoin for about $1.1 billion.
The transaction came just days before the company initiated layoffs affecting roughly 15% of its workforce. The cuts span several departments, signaling a broad internal adjustment.
According to the same update, the company directed most of the sale proceeds toward repurchasing $1 billion in convertible senior notes.
This move aligns with efforts to reduce financial obligations and improve balance sheet strength. The timing of the layoffs alongside the financial restructuring has drawn attention across the crypto sector.
Data from NS3.AI indicates that the debt repurchase is expected to save approximately $88.1 million in cash. This reduction provides near-term relief in terms of interest and repayment pressure. At the same time, it lowers the company’s exposure to future conversion risks tied to those notes.
The company’s total convertible debt has decreased by nearly 30% following the transaction. It has moved from around $3.3 billion to approximately $2.3 billion. This marks a notable shift in MARA’s financial position within a short period.
The tweet referenced in the update outlines both the Bitcoin sale and the workforce reduction. It presents a clear sequence of actions, linking capital management decisions with operational changes. The information has circulated widely among market participants tracking mining firms.
Debt Reduction Strategy and Operational Shift
The decision to reduce debt appears closely tied to broader operational planning. By lowering its liabilities, MARA gains more flexibility in allocating capital toward future initiatives. This includes investments beyond its core Bitcoin mining business.
At the same time, the company is expanding into artificial intelligence and high-performance computing. These sectors require substantial infrastructure and energy resources, areas where mining firms already maintain expertise. The shift suggests a move to diversify revenue streams.
Workforce reductions may also reflect this transition. As the company reallocates resources, certain roles may become redundant while new technical demands emerge. This type of restructuring often accompanies strategic pivots in capital-intensive industries.
The use of Bitcoin reserves to manage debt highlights a practical treasury approach. Rather than holding assets passively, MARA converted part of its holdings into liquidity. This allowed the company to address financial obligations without relying on external financing.
Moreover, reducing convertible debt can help stabilize shareholder structure. Convertible notes often carry dilution risks if converted into equity. By repurchasing a portion of these instruments, MARA limits potential dilution over time.
The sequence of actions shows a coordinated financial and operational plan. The company adjusted its asset holdings, reduced liabilities, and streamlined its workforce within a short timeframe. Each step connects to a broader repositioning effort.
While the layoffs mark a challenging moment for employees, they form part of a larger restructuring process. The company appears focused on maintaining efficiency while preparing for expansion into adjacent sectors.
MARA’s recent moves reflect a shift in how mining firms manage capital during changing market conditions. The combination of asset sales, debt reduction, and operational adjustments points to an evolving business model within the industry.
TLDR:
- Solana Agent Skills allows developers to integrate AI tools with blockchain functions using a simple one-line installation.
- The toolkit provides prebuilt components, including security checks, error handling, and version compatibility tools.
- More than 60 community-built skills support areas such as DeFi services, payments, and blockchain infrastructure.
- Platforms like JupiterExchange, Raydium, Helius, dflow, and Metaplex contributed tools to the skills ecosystem.
The Solana Foundation has introduced Solana Agent Skills, a toolkit designed to help developers connect AI tools directly to the Solana ecosystem.
The initiative offers prebuilt components that simplify the creation of AI agents capable of performing on-chain actions.
Prebuilt Skills Aim to Simplify AI Integration With Solana
The Solana Foundation announced the launch of Solana Agent Skills through its official communication channels. The toolkit provides developers with ready-to-use components designed for AI applications interacting with the Solana network.
According to the announcement, developers can install these skills using a single line of code. This approach allows faster integration without complex development steps. As a result, builders can connect AI tools to blockchain functions more easily.
A post shared by the Solana Foundation on X described the purpose of the release. The update stated that developers can embed these skill components directly into AI tools. This setup enables AI agents to perform on-chain operations inside the Solana ecosystem.
The toolkit includes several official skills designed to support development and security practices. These features include common error handling tools and built-in security checklists. Developers can also access compatibility tools designed to maintain version stability during updates.
Another feature within the toolkit supports confidential transfers. This function allows developers to build AI agents that manage certain transactions while maintaining privacy parameters on the network.
Together, these components provide a standardized framework for building AI-powered tools on Solana. Developers can integrate the features quickly while maintaining consistent functionality across projects.
Community Skills Expand AI Capabilities Across the Solana Ecosystem
The Solana Agent Skills toolkit also includes contributions from the wider developer community. More than 60 additional skills are currently available through community development efforts.
These community-built tools extend the capabilities of AI agents interacting with the Solana blockchain. The skills cover several areas across the ecosystem, including decentralized finance services and payment integrations.
Developers can also access infrastructure-related tools designed to assist with blockchain data interactions. Other components focus on developer utilities that simplify AI-powered workflows inside blockchain applications.
Several ecosystem platforms contributed skills to the initiative. These include tools from JupiterExchange, Raydium, Helius, dflow, and Metaplex. Each platform provides specific functionality related to its service area.
Through these integrations, developers can combine AI systems with existing Solana-based platforms. The approach enables AI agents to access services such as trading tools, payment functions, and blockchain data infrastructure.
Foresight News also reported that the toolkit allows developers to build agents capable of interacting with Solana through simple installation steps. The report noted that these integrations require minimal setup compared with traditional blockchain development methods.
The release places AI integration within reach for a wider developer audience. As more contributors add skills to the library, the range of AI-enabled blockchain applications may continue to grow.
Solana Agent Skills therefore, provide a structured way for developers to build AI-powered tools that interact directly with the blockchain network. The framework combines official components with community-built extensions to support a broader range of use cases.
TLDR:
- Japan’s 10-year yield reached 2.393%, marking its highest level since 1999 amid shifting rate expectations
- Rising yields may unwind carry trades, reducing global liquidity that supported stocks and crypto markets
- The long-term chart shows a sharp reversal after years of near-zero rates under loose monetary policy
- Higher domestic yields could redirect capital flows back to Japan and influence global bond markets
Japan’s 10-year government bond yield has climbed to 2.393%, marking its highest level since 1999. The move signals a shift in Japan’s long-standing low-rate environment, drawing attention across global financial markets and raising concerns about tightening liquidity conditions.
Yield Surge Signals Shift in Monetary Conditions
A recent post by Wise Advice noted that Japan has broken a 25-year record as its 10-year yield moved above 2.39%. The update pointed to a changing rate environment that has remained subdued for decades.
The chart shows that yields stayed elevated in the late 1990s and early 2000s before entering a long decline. During that period, rates gradually moved toward near-zero levels. This trend aligned with weak growth and persistent deflationary pressures across Japan’s economy.
By 2016, yields had reached near-zero or negative levels. This phase followed aggressive monetary easing by the Bank of Japan. Yield Curve Control policies kept long-term rates tightly anchored for years.
However, the trend shifted after 2021. The chart shows a steady upward move that accelerated after 2023. The latest reading near 2.4% stands out compared to the flat conditions seen in prior years.
The sharp rise on the right side of the chart reflects a break from the earlier pattern. The move appears stronger than previous cycles, suggesting a change in direction for Japan’s rate structure.
Market participants are now watching for further adjustments in central bank policy. The rise in yields suggests that pricing is adjusting to a less accommodative stance.
Global Liquidity Concerns and Market Reactions
The same post explained that Japan has long served as a low-cost funding source for global markets. Low yields supported carry trades, where investors borrowed cheaply in yen to invest in higher-yield assets.
With yields rising, those trades may begin to unwind. As borrowing costs increase, the appeal of such strategies weakens. This shift can reduce liquidity flows that have supported global markets for years.
The post also noted that tighter liquidity conditions could affect risk assets. Stocks and cryptocurrencies may face periods of volatility as capital flows adjust.
At the same time, higher domestic yields may encourage Japanese investors to keep funds within local markets. This shift could reduce overseas investments, including positions in foreign bonds.
Currency movements are also part of the discussion. Rising yields tend to support the Japanese yen, which has remained weak for an extended period. A stronger currency could further influence global capital allocation trends.
The chart reflects a broader transition from prolonged low rates toward normalization. The pace of the recent increase suggests that markets are adjusting quickly to new expectations.
While the long-term direction remains uncertain, the current data shows a clear departure from past conditions. As a result, investors are closely monitoring policy signals and market responses in the coming months.
Crypto World
Coinbase CEO Brian Armstrong Calls for “Shenzhen-Style” Special Economic Zones in the US
TLDR:
- Brian Armstrong wants the US to create Shenzhen-style zones free from excessive regulatory barriers.
- Armstrong cited crypto, biotech, and drones as industries that would benefit most from these sandboxes.
- Coinbase’s “Next Bets” program lets employees pitch new ideas, keeping innovation active internally.
- Armstrong’s lawsuit against the SEC and apolitical stance ultimately strengthened Coinbase’s brand trust.
Special Economic Zones could be the next frontier for American innovation. Coinbase CEO Brian Armstrong made this case on the Relentless podcast. He urged the United States to create zones modeled after global innovation hubs.
These include Shenzhen, Hong Kong, Singapore, and Dubai. Armstrong described these areas as free from excessive regulatory barriers.
His proposal covers industries such as crypto, biotech, and drones. He also raised the idea of cyberpunk-style free cities in the long run.
Armstrong’s Push for Innovation Sandboxes
Armstrong argued that the United States needs dedicated spaces for new industries to grow. He believes excessive red tape slows down progress in fast-moving sectors.
According to Armstrong, removing regulatory friction could unlock economic potential at scale. These zones would act as controlled environments for testing emerging technologies freely.
Armstrong specifically cited Shenzhen as a model worth replicating in the US. That city grew rapidly under China’s special economic zone framework decades ago.
Similarly, Hong Kong, Singapore, and Dubai have attracted global talent through business-friendly policies. Armstrong sees a parallel opportunity for the US to remain competitive globally.
On the podcast, Brian_armstrong outlined how these sandboxes could benefit crypto development directly. He pointed to unnecessary compliance burdens that currently slow crypto adoption in America.
Reducing those barriers inside a designated zone could accelerate product development considerably. Moreover, biotech and drone industries could also benefit from such a framework.
Armstrong’s proposal aligns with a broader global trend of innovation-focused economic zones. Several countries have already seen strong results from adopting this model.
Looking further ahead, Armstrong envisions a future with cyberpunk-style free cities. These cities would operate with minimal government interference and maximum economic freedom.
Coinbase’s Mission and Leadership Approach
Armstrong built Coinbase around a central mission: increasing global economic freedom through crypto. He has consistently tied the company’s work to this broader purpose.
That narrative, he said, took time to craft and communicate effectively. But it has since become a guiding force behind the company’s decisions.
One example is Coinbase’s decision to remain apolitical in the workplace. That choice drew controversy at the time but later strengthened the brand.
Another was the lawsuit against the SEC, which also faced early criticism. Armstrong said both moves ultimately built greater trust with customers and the public.
To keep innovation alive internally, Armstrong introduced a program called “Next Bets.” This initiative lets employees pitch and pursue new business ideas within Coinbase.
It reflects his belief that large companies must still act like startups in key areas. Through this program, Coinbase has been able to explore new opportunities continuously.
Armstrong also spoke openly about the demands of leadership and managing burnout. He practices hiking and other wellness habits to maintain mental clarity.
He described a “wartime CEO” mindset as energizing rather than exhausting. For him, pushing forward through pressure is what drives meaningful progress.
Wall Street’s crypto footprint has never been larger. BlackRock alone reported nearly $150 billion in digital asset-linked AUM in its 2026 chairman’s letter. Public companies hold over 1.1 million BTC on their balance sheets. Institutions disclose more than 513,000 BTC through ETF wrappers.
Yet aggregate numbers obscure the question that matters most. Who actually holds what, through which infrastructure, and why?
This article maps Wall Street’s crypto ownership across five layers.
It starts with SEC 13F filings, moves through corporate balance sheets, follows the money into tokenized fund rails, traces the custodial chokepoints where keys concentrate, and ends where filings go dark, with on-chain OTC flows that reveal holders no quarterly report captures.
SEC 13F Filings Reveal Secrets About Wall Street Crypto ETF Holdings
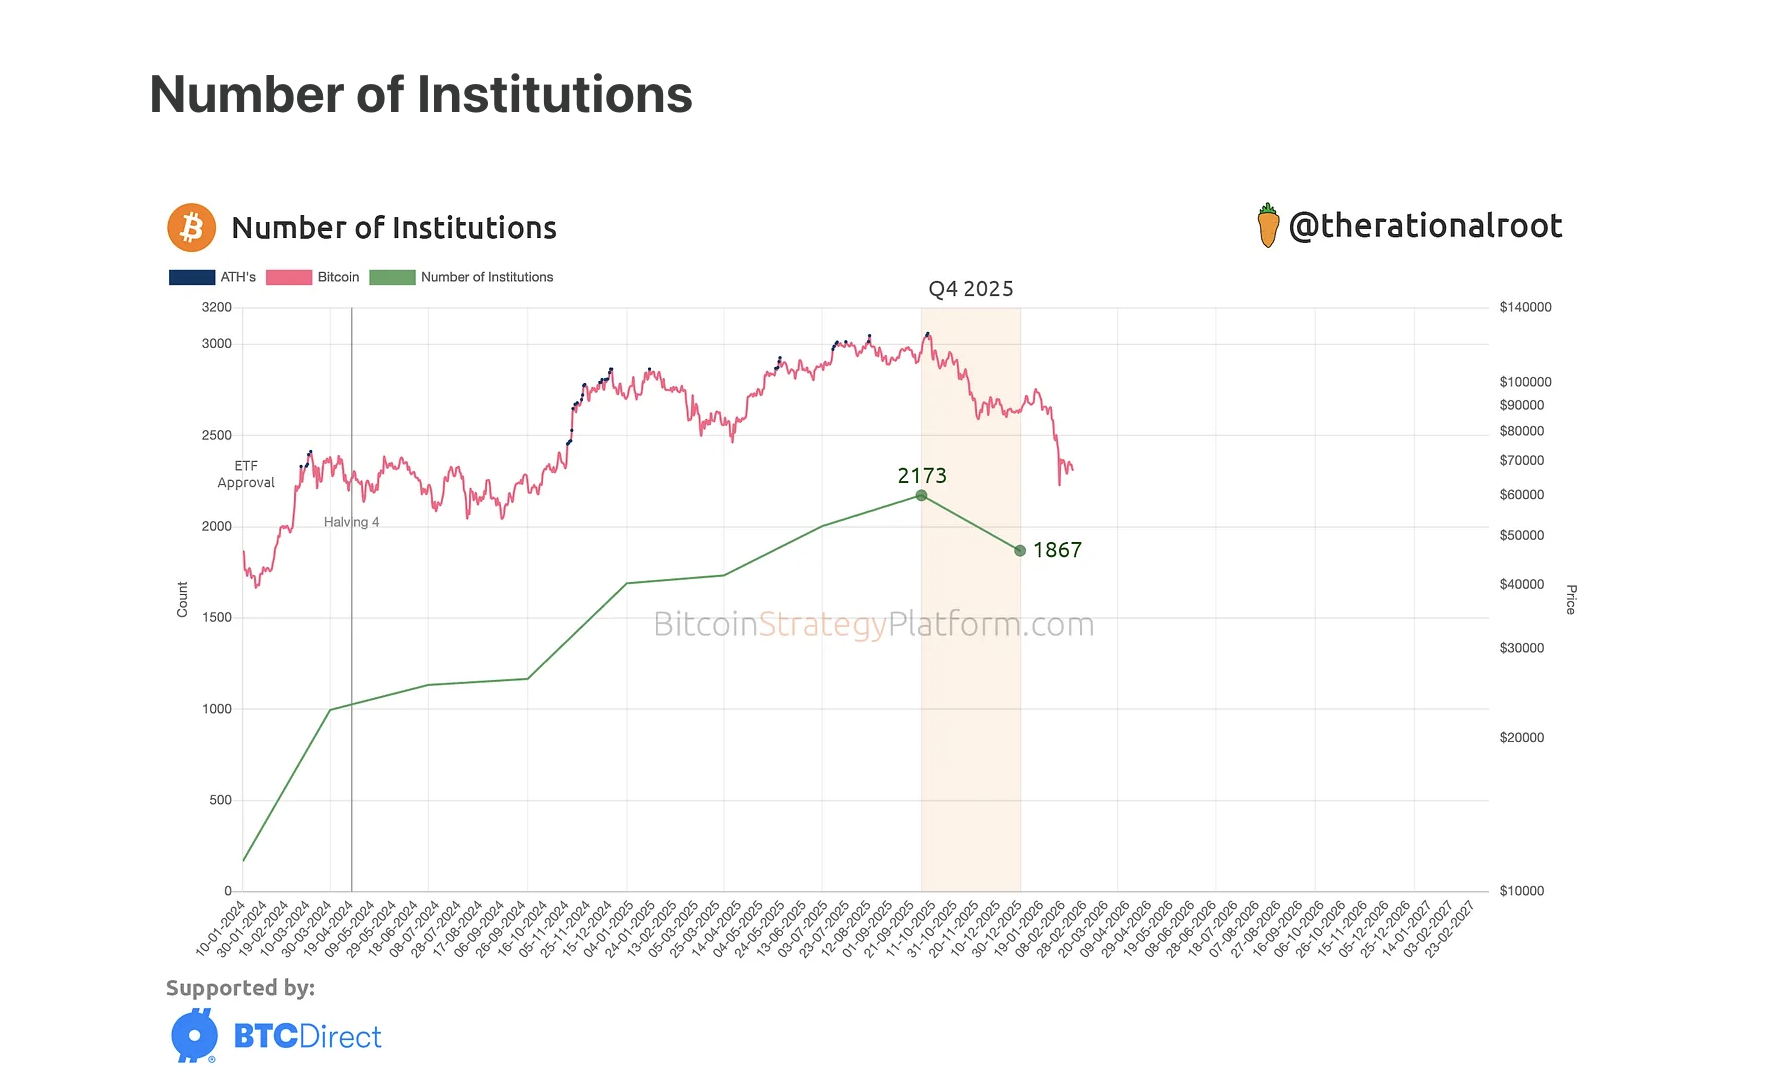
Despite a 23% price decline in Q4 2025, global Bitcoin ETF flows remained positive at $3.7 billion. Full-year professional ETF ownership grew 32% versus 18% for the broader ETF investor base.
Institutions still held over 513,000 BTC through ETFs, though filer count declined from 2,173 to 1,867.
Not all of this is conviction capital. The basis trade, a strategy involving a long spot ETF position paired with a short CME futures position, has been a primary institutional strategy since ETF approval.
Hedge fund exposure declined nearly 10% in Q4, as leverage unwound and the basis spread narrowed.
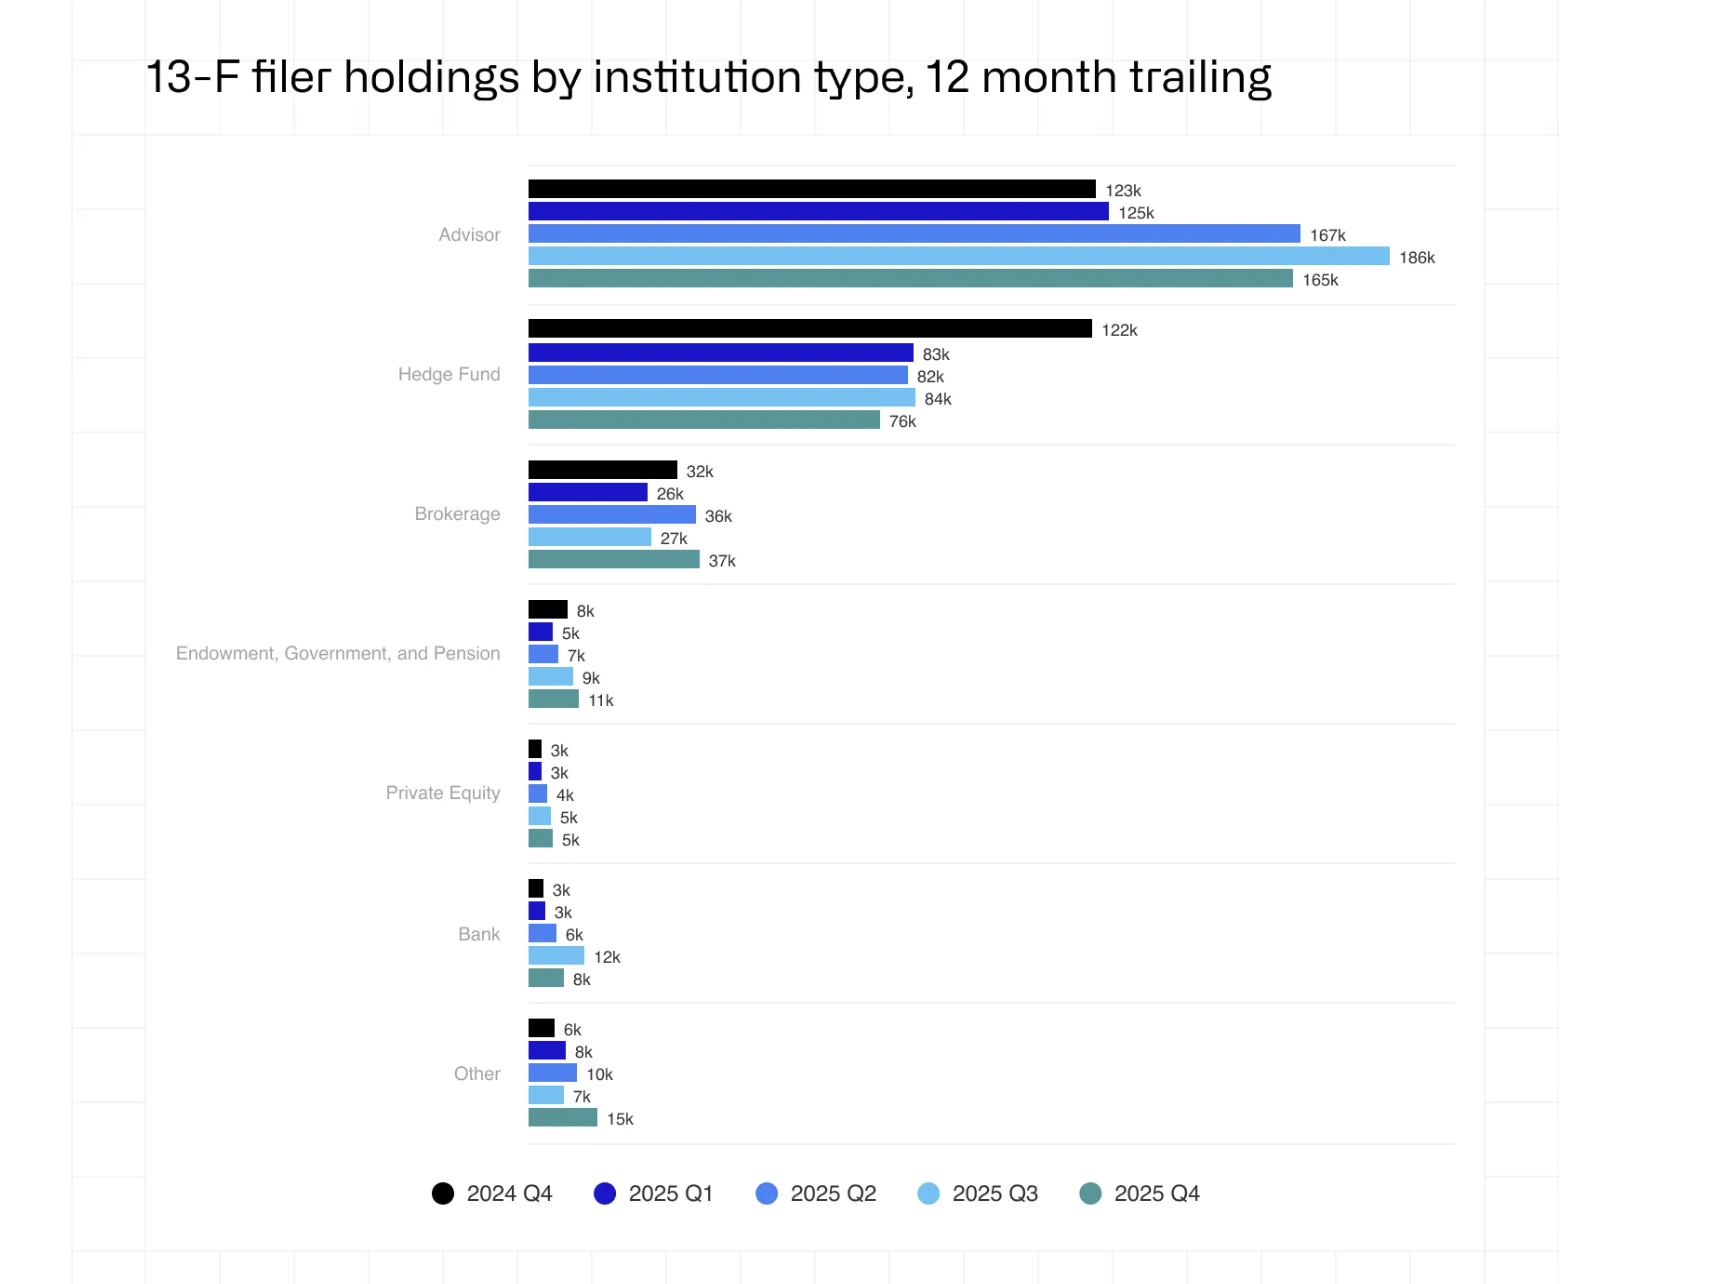
Cohort rotation, not capitulation, defined Q4. Millennium added 8,100 BTC. Abu Dhabi’s Mubadala added 2,300 BTC. Morgan Stanley added 1,900 BTC. Dartmouth became the fourth Ivy League endowment to enter.
On the other hand, Brevan Howard cut 17,700 BTC, Harvard trimmed roughly 20%, and Royal Bank of Canada fully exited, all of which are mentioned in the CoinShares Q4 2025 report.
Aggregate pension fund and endowment crypto holdings peaked at $1.48 billion in Q3 2025, then declined to $965 million in Q4.
However, ETFs only reveal who is buying the wrapper. For those who are holding the asset itself, the balance sheets tell a different story.
Corporate Treasuries Show Who Holds Bitcoin Directly on the Balance Sheet
Beyond ETFs, a growing number of public companies hold Bitcoin directly as a treasury reserve asset. As of March 31, 2026, publicly traded companies report a combined 1,134,324 BTC on their balance sheets.
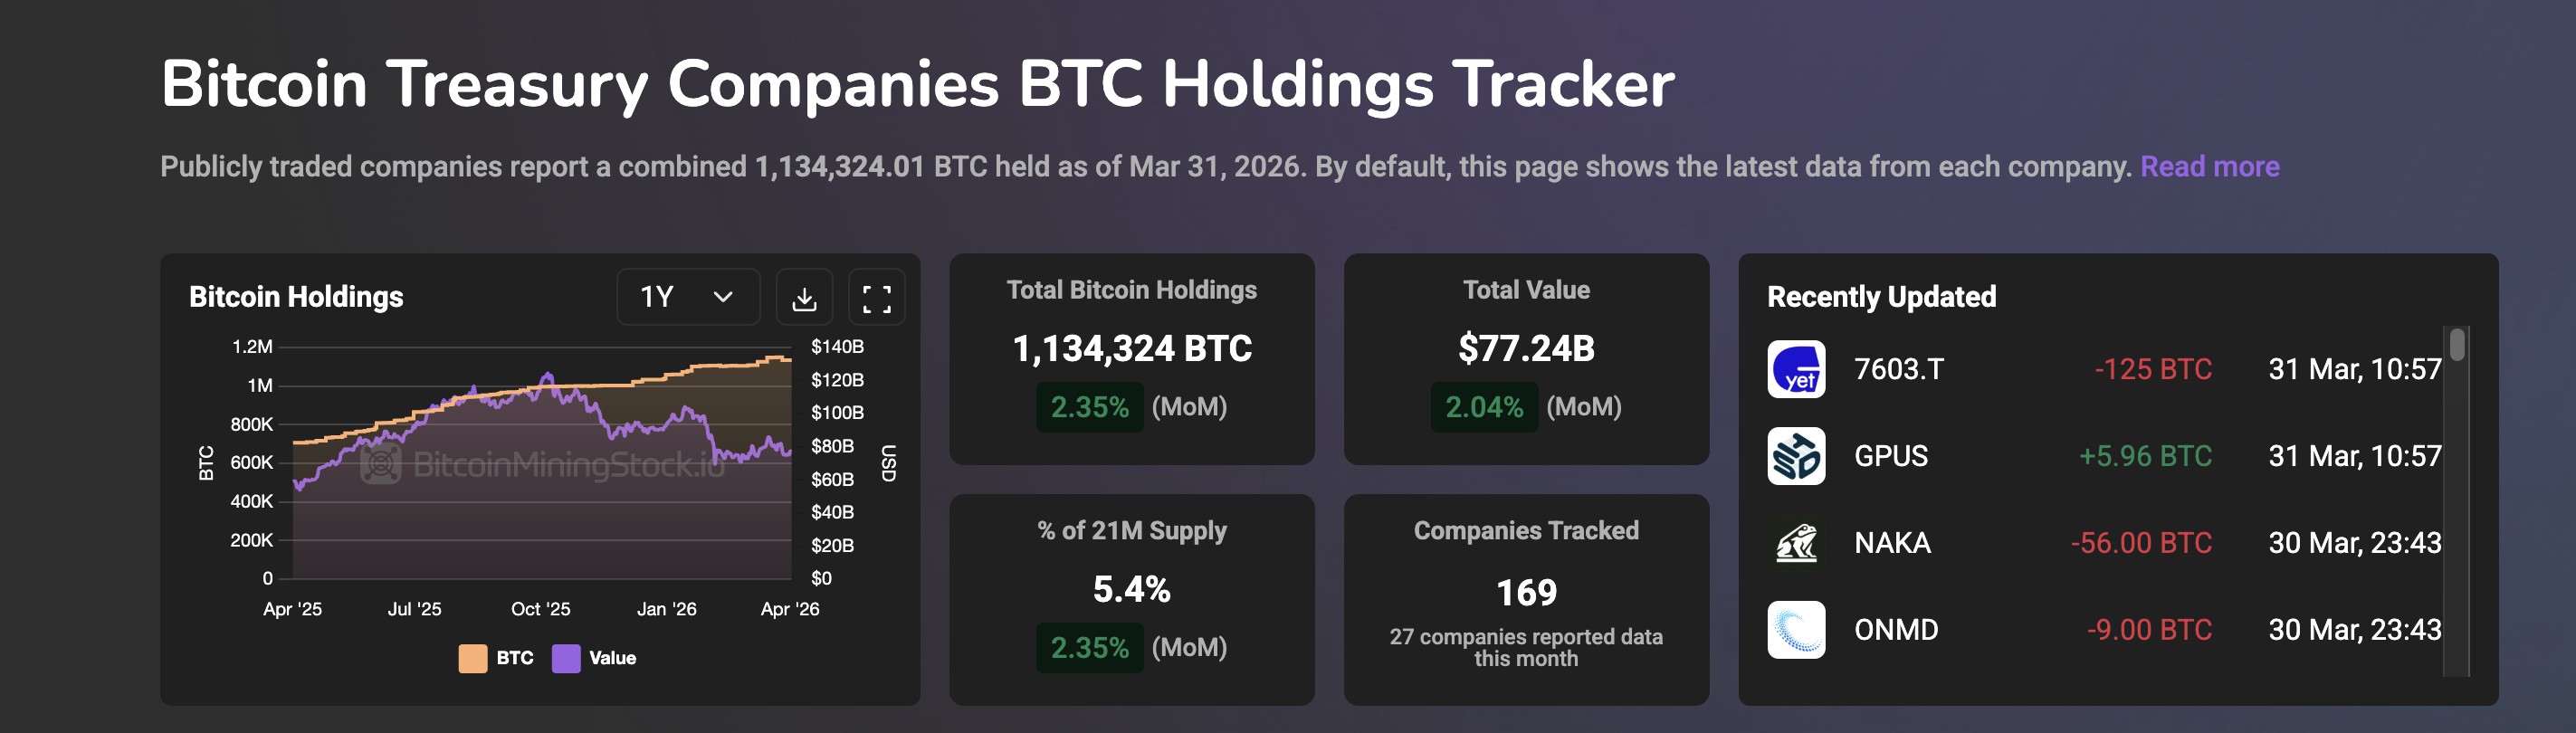
The concentration is extreme. Strategy Inc, formerly MicroStrategy, held 762,000 BTC as of April 2, 2026. Other big names in the space include Twenty One Capital, MARA Holdings, Japan’s Metaplanet, and more.
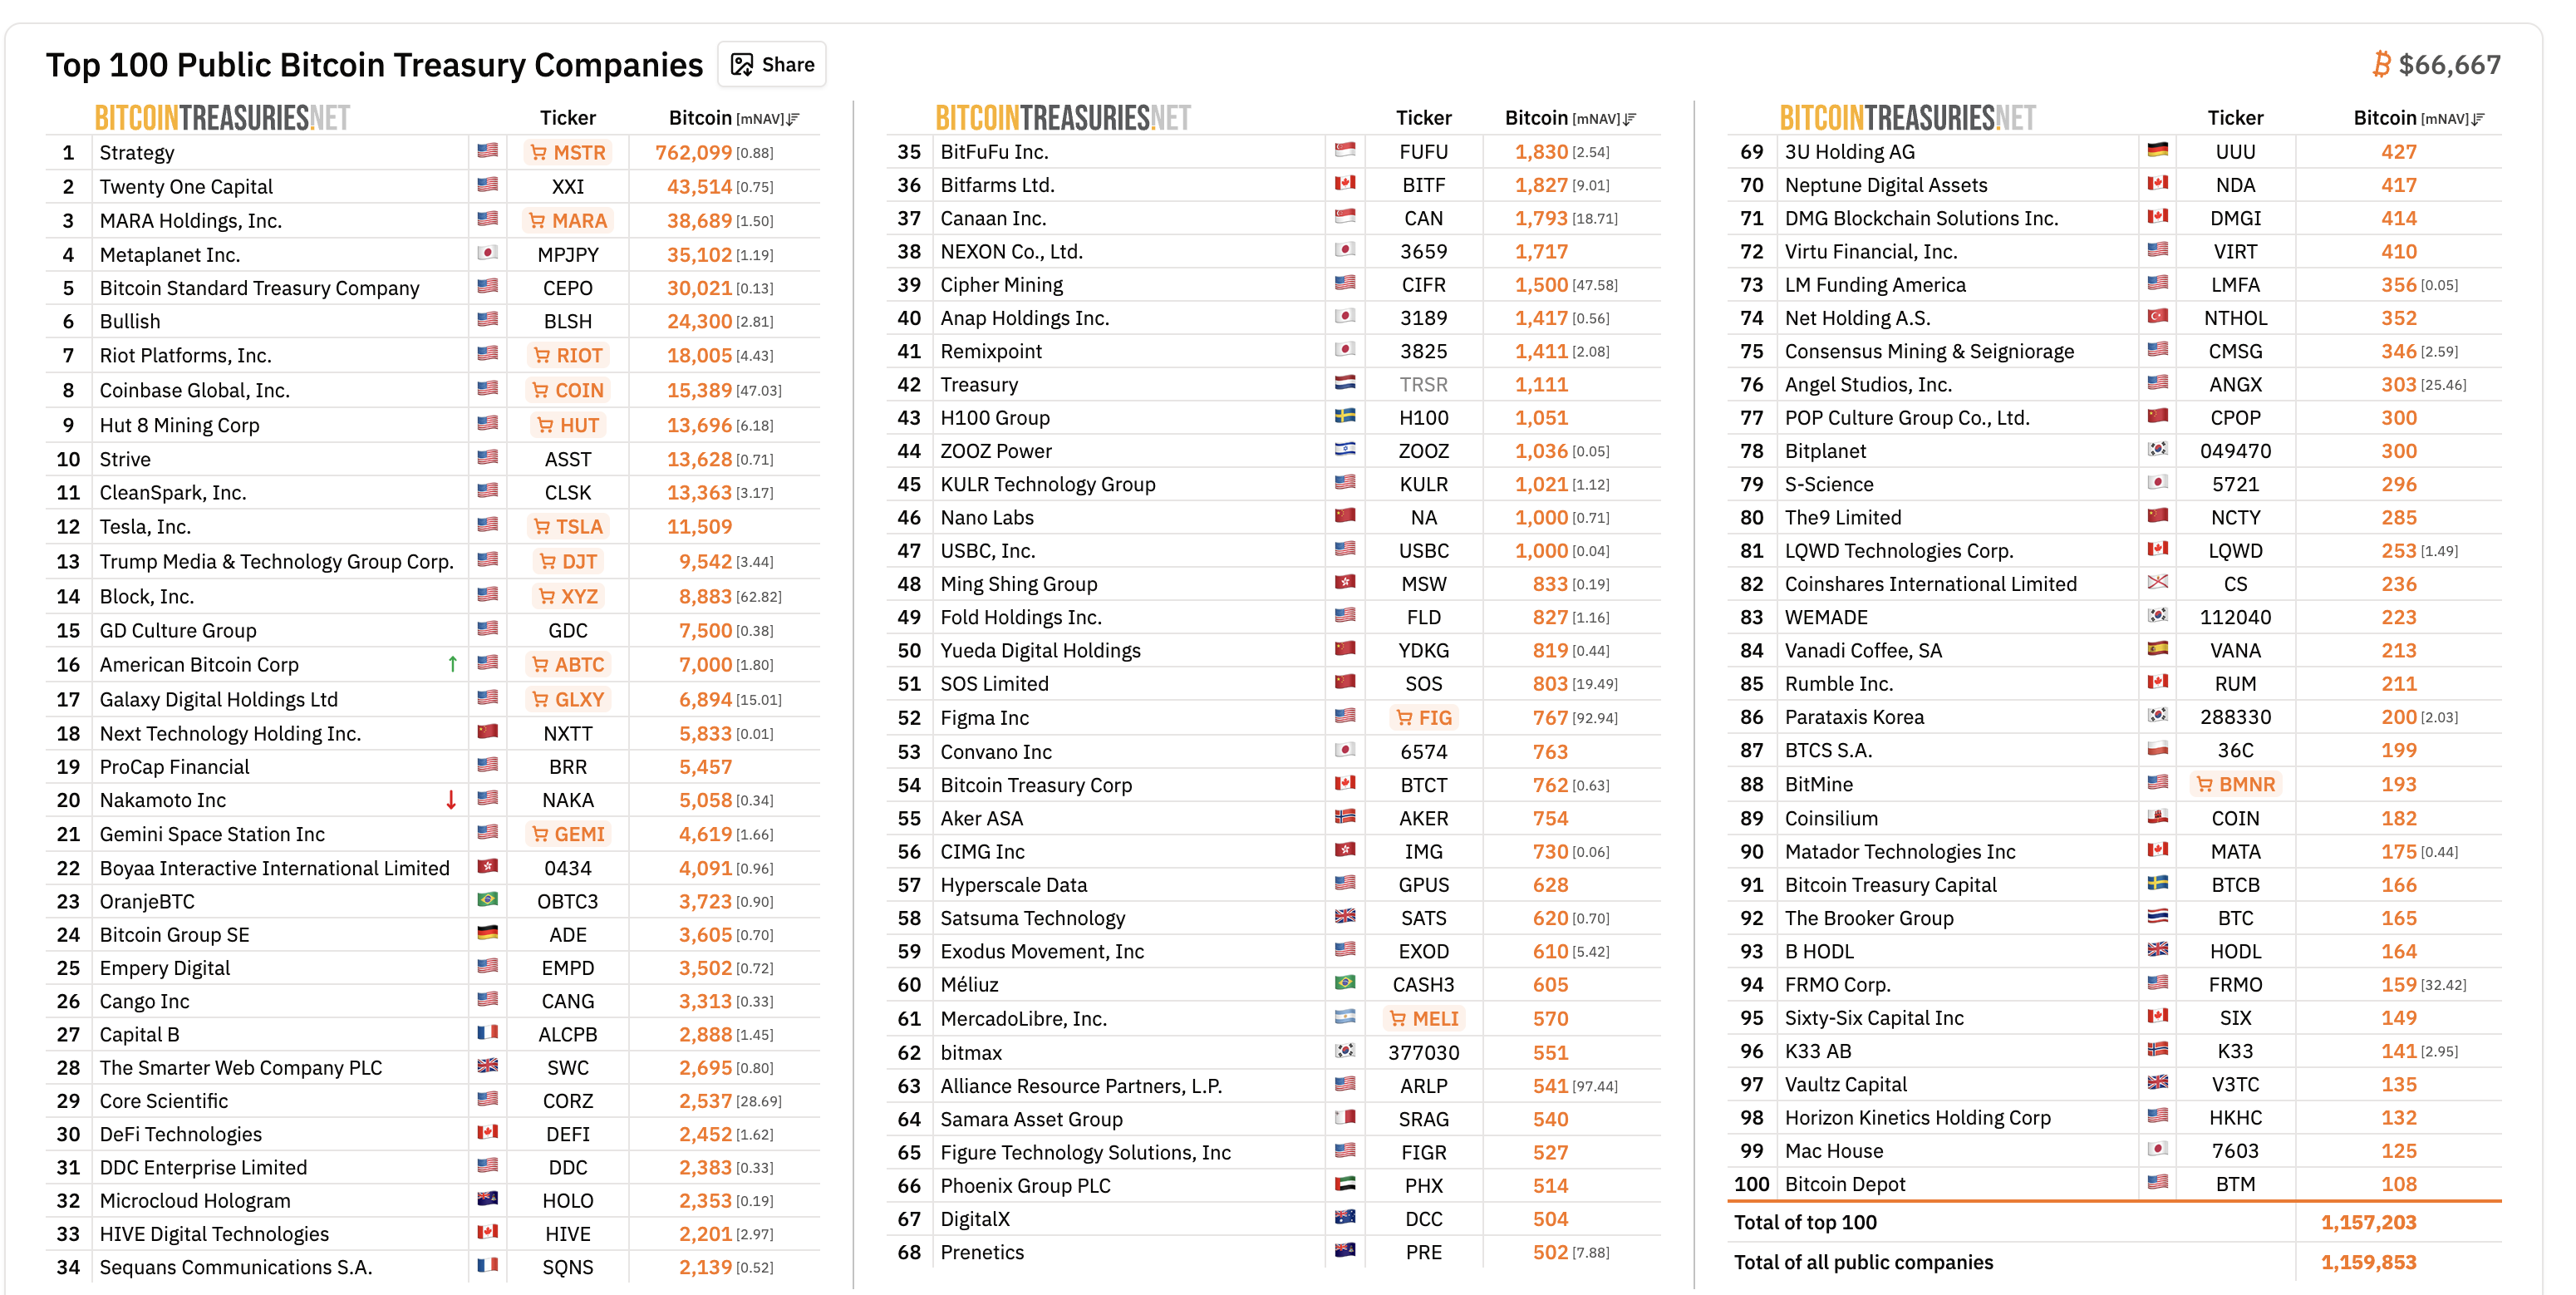
New entrants are reshaping the picture. Trump Media (DJT) held 11,542 BTC before pledging 2,000 BTC as collateral under a hedge arrangement with rehypothecation rights, reducing on-balance-sheet holdings to 9,542 BTC. MARA sold 15,133 BTC in March 2026 at a loss to service debt.
Yet corporate treasuries only account for direct spot ownership. Wall Street’s largest players are building crypto exposure through an entirely different mechanism, one that does not require holding a single Bitcoin.
Tokenized Funds and RWA Holdings Show Where On-Chain Meets TradFi
Some of Wall Street’s largest firms now build crypto exposure without holding a single token. Instead, they put traditional assets on-chain through tokenization.
BlackRock’s BUIDL fund, a tokenized US Treasury money market product, reached $2.85 billion in total assets ($2.17 billion at press time).
In February 2026, BlackRock began trading BUIDL on Uniswap’s decentralized exchange and purchased UNI governance tokens. That marked its first direct engagement with DeFi trading infrastructure.
The firm’s 2026 chairman’s letter reported $65 billion in stablecoin reserves, $80 billion in digital-asset ETPs, and nearly $150 billion in total digital asset-linked AUM.
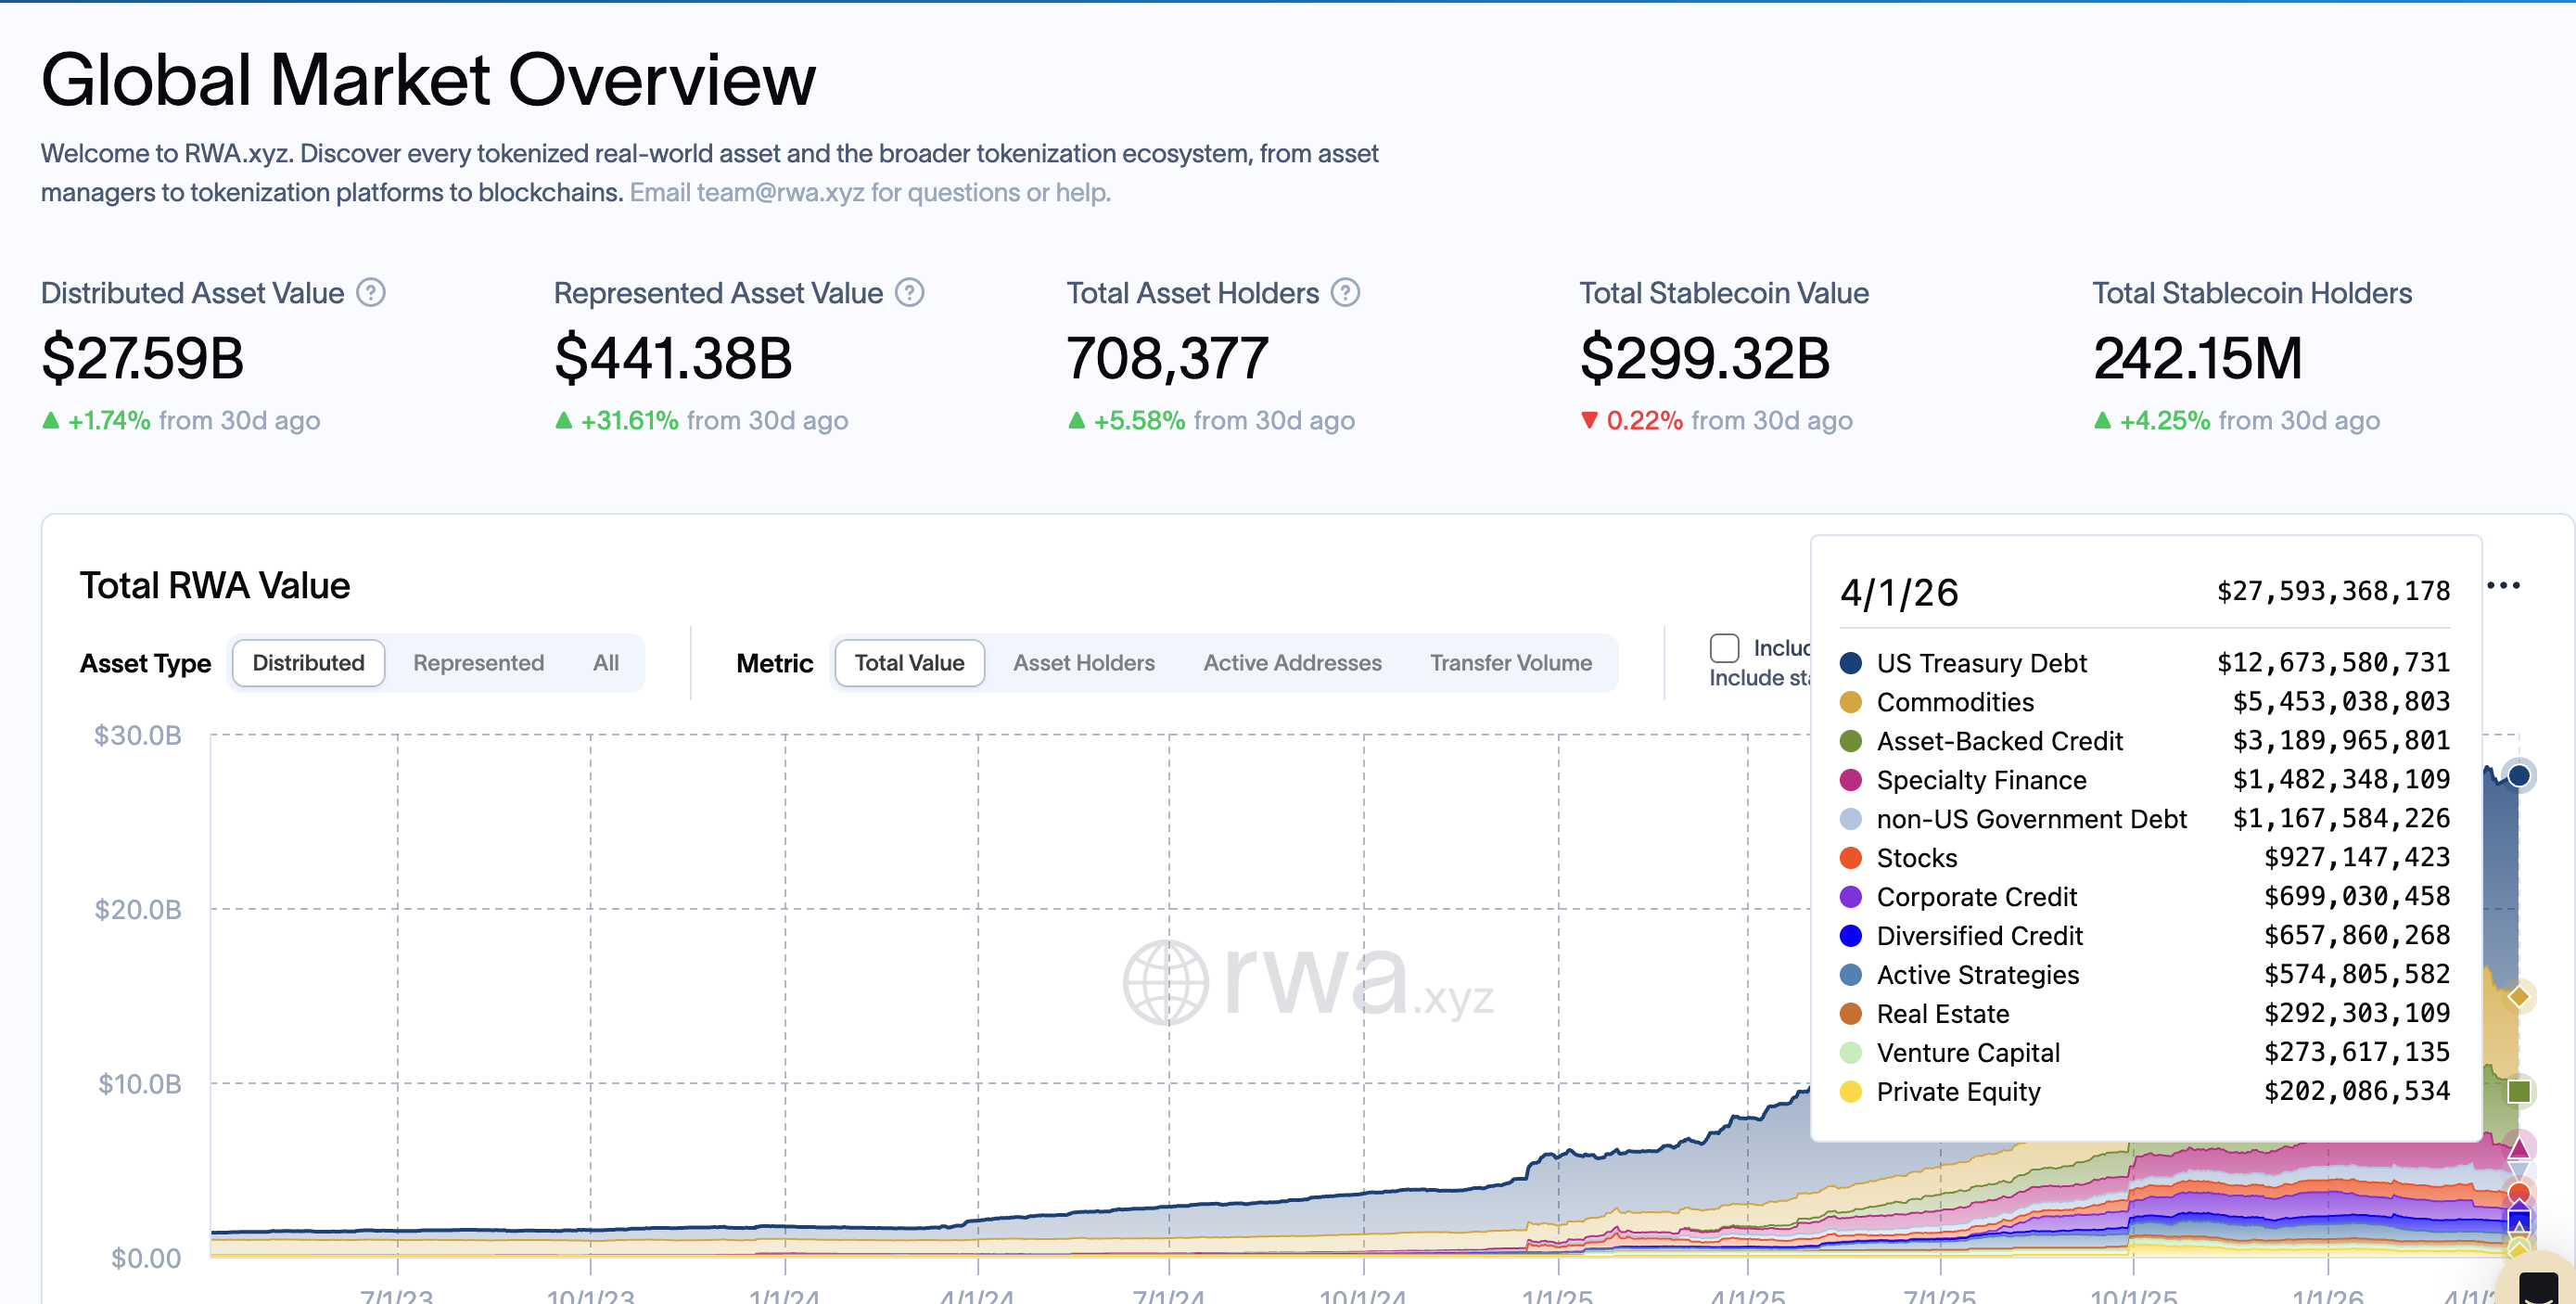
The broader market is scaling fast. RWA.xyz data as of April 2026 shows $12.67 billion in on-chain US Treasury debt, representing roughly 46% of the total $27.59 billion in tokenized real-world assets.
That total RWA figure grew 31.61% in just the last 30 days alone, with 708,377 asset holders across the ecosystem.
This is Wall Street holding crypto infrastructure, not crypto assets. However, all of it depends on one thing. Who has the keys.
The Custody Map Reveals a Single Point of Failure
Knowing who owns Wall Street’s crypto is only half the picture. The other half is who holds the keys.
Coinbase custodies over 80% of US Bitcoin and Ethereum ETF assets, a figure confirmed by CEO Brian Armstrong. Coinbase was the custodian for eight of the 11 spot Bitcoin ETF listings at launch. Only Fidelity self-custodies its own fund. VanEck selected Gemini.
This concentration creates a single-cluster dependency. A cyber incident, service disruption, or governance failure at one custodian could affect multiple funds simultaneously, with knock-on effects for creations, redemptions, and trading liquidity.
On the tokenized side, Bank of New York Mellon serves as BUIDL’s cash and securities custodian, while Anchorage Digital, BitGo, Copper, and Fireblocks support BUIDL subscribers.
As of March 2026, discussions are emerging around multi-party computation custody and multi-custodian mandates to spread risk. No structural changes have materialized yet.
The custody map reveals a paradox at the heart of Wall Street’s crypto exposure. A decentralized asset class funneled through increasingly centralized infrastructure. And that infrastructure still leaves major holders invisible, specifically those with no filing obligation at all.
The Shadow Holders and What No Filing Can Show
13F filings only apply to US institutional managers with over $100 million in qualifying assets. Family offices, offshore entities, and sovereign vehicles operating through intermediaries are not subject to disclosure obligations.
That creates a structural blind spot in Wall Street’s map of crypto ownership.
On-chain data reveals what filings cannot.
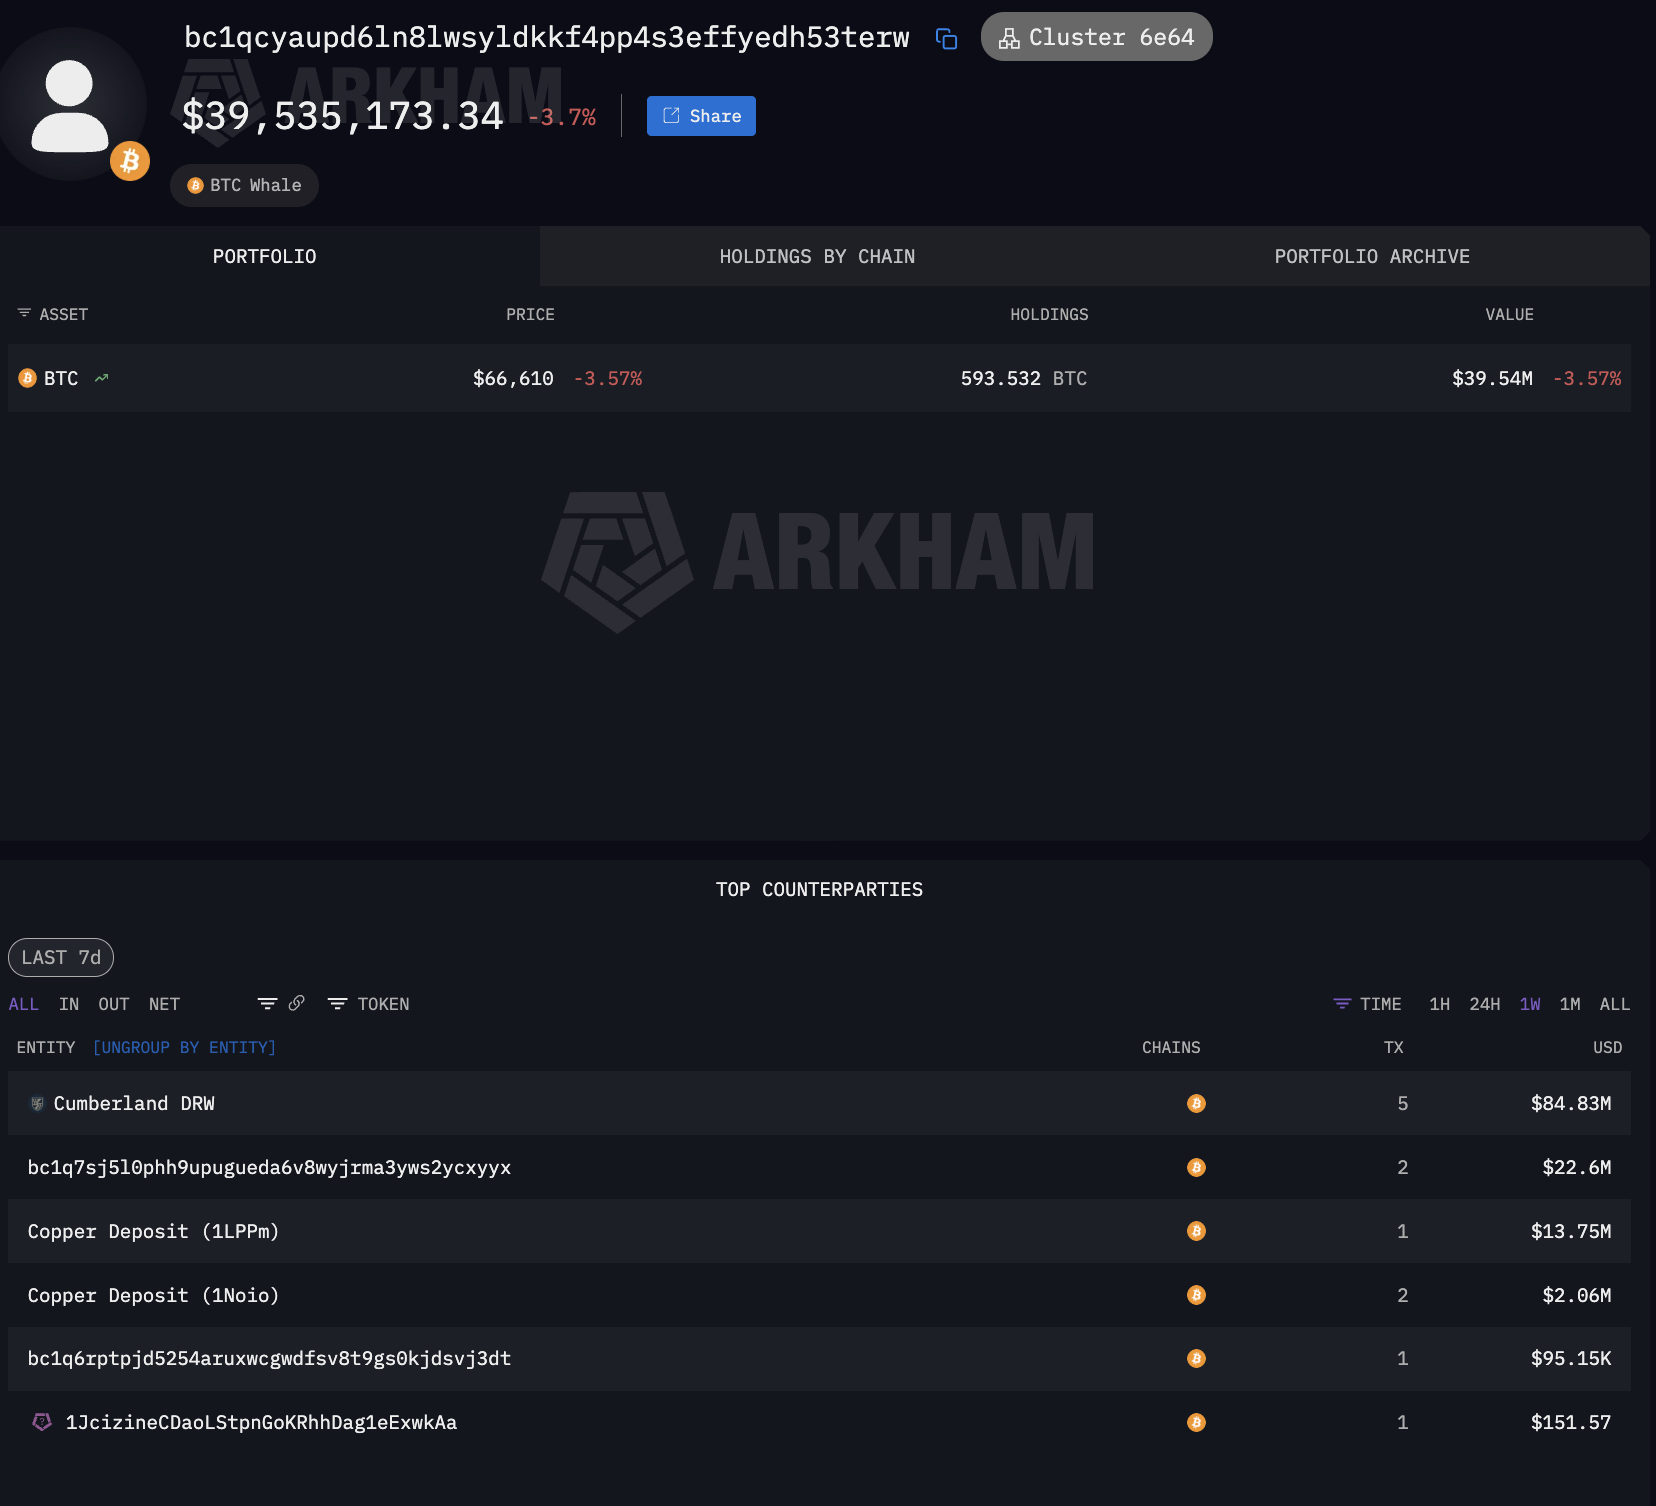
Cumberland DRW, one of Wall Street’s primary OTC desks, has processed a total of $123.58 billion in deposits and $97.71 billion in withdrawals across major exchanges since 2018.
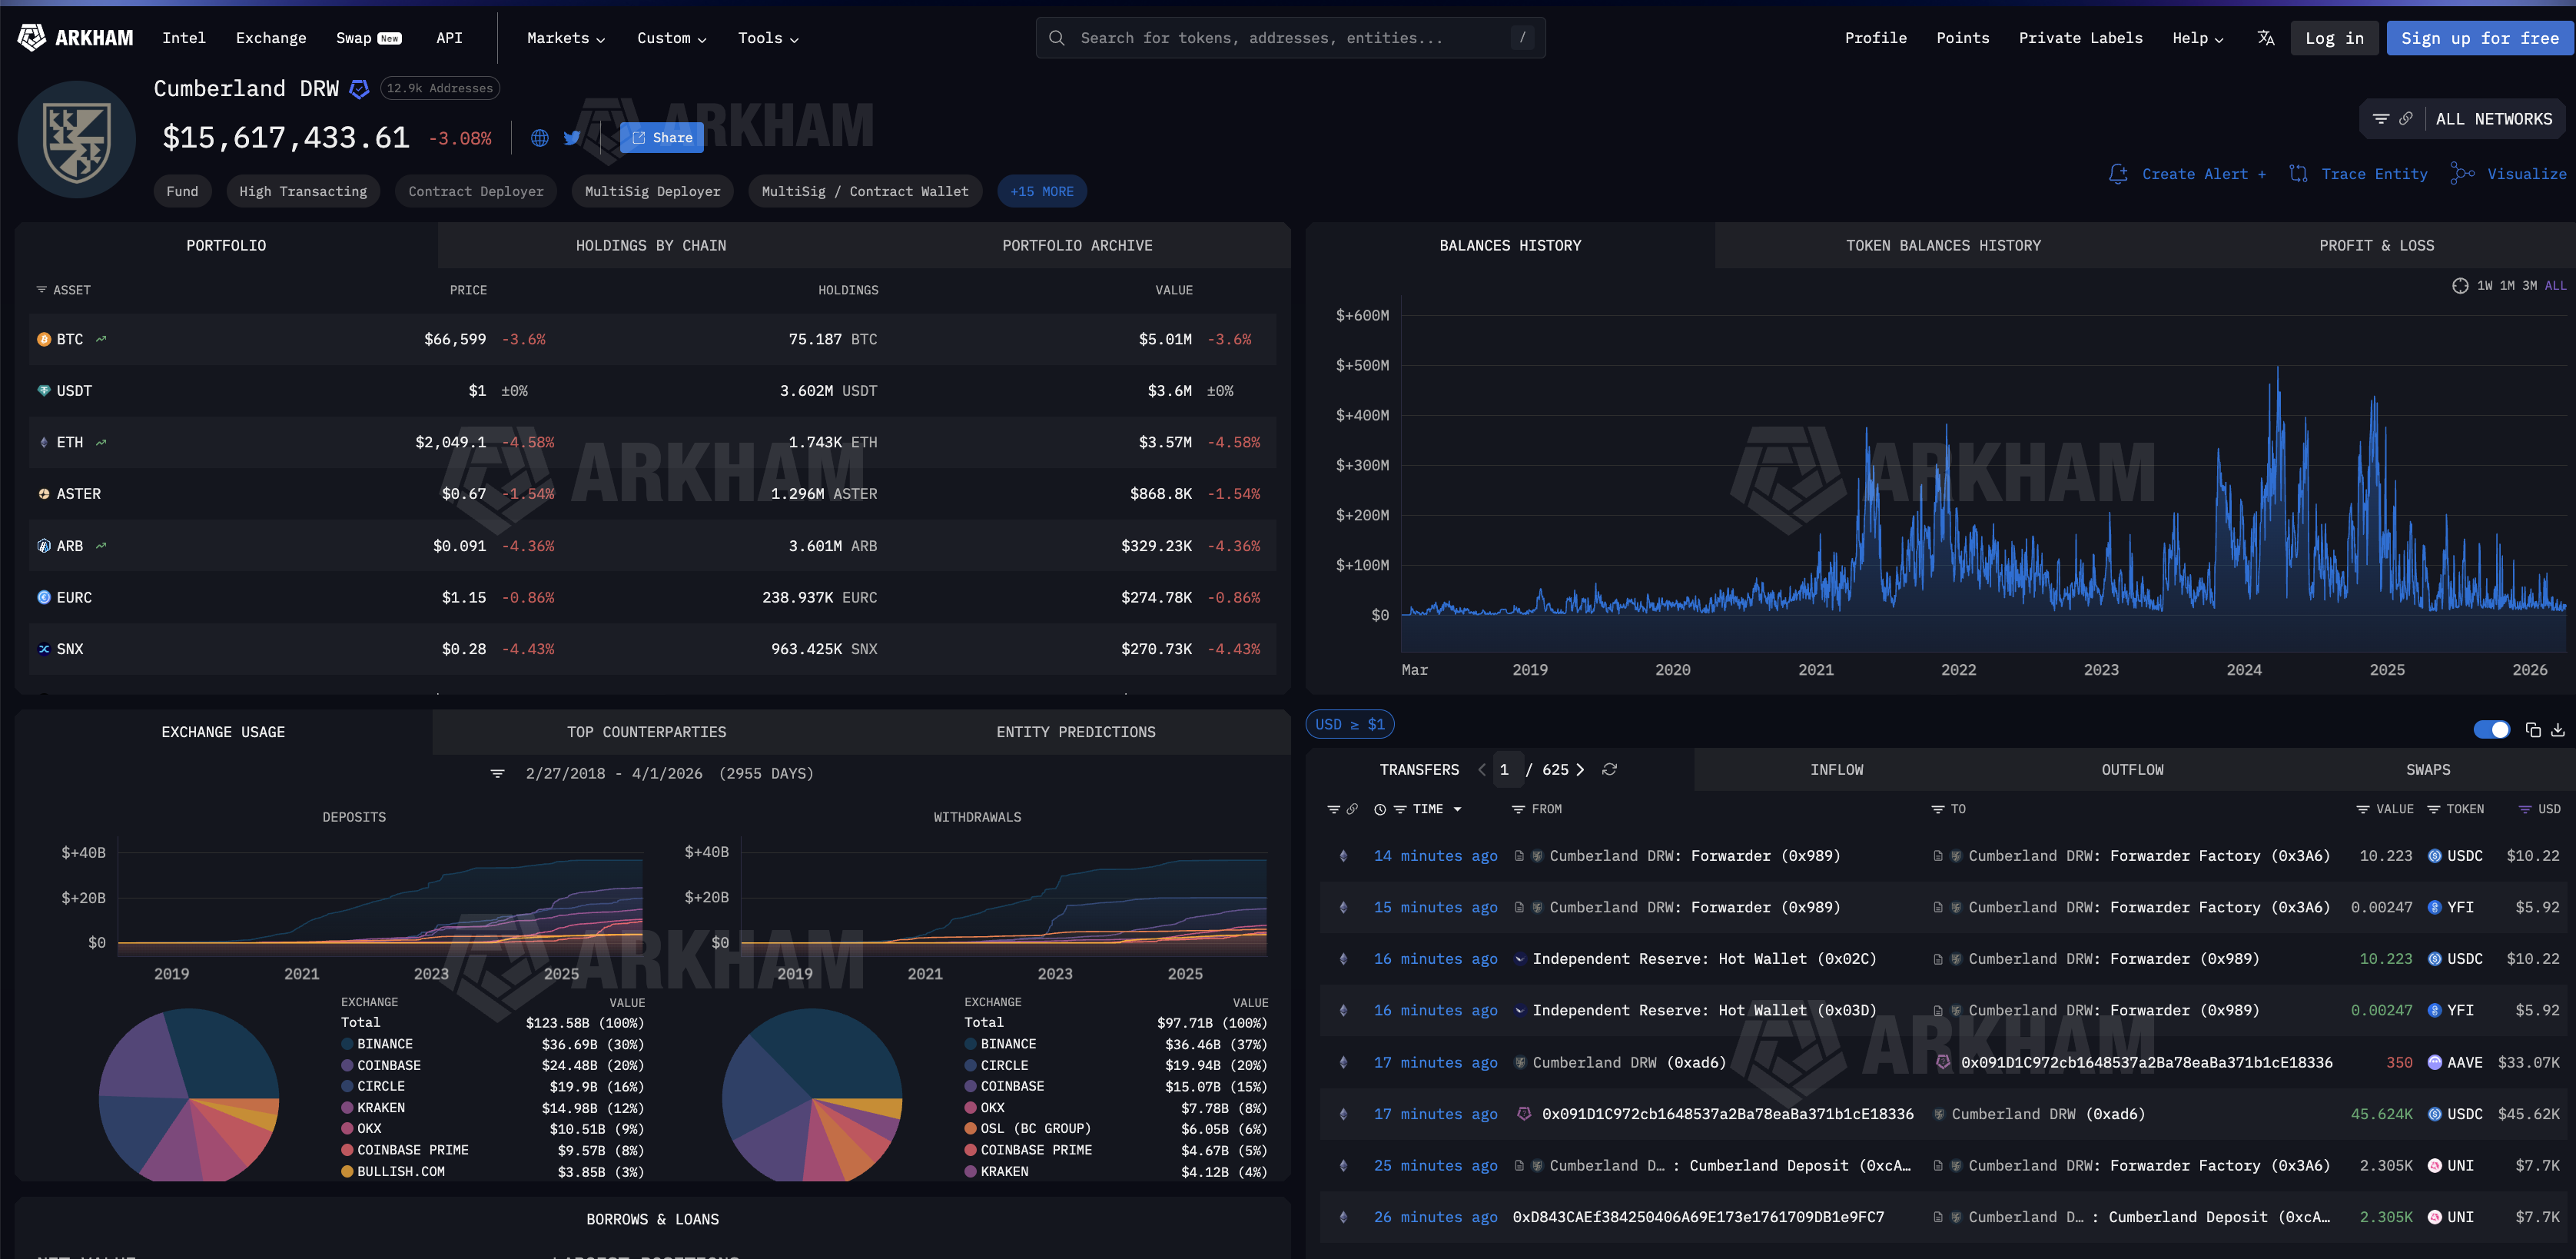
Filtering Cumberland’s outflows reveals where institutional capital actually goes. The top all-time outflow destinations include $17 billion to Binance, $14.53 billion to Coinbase Prime, likely for ETF creations, and $10.12 billion to Block Inc..
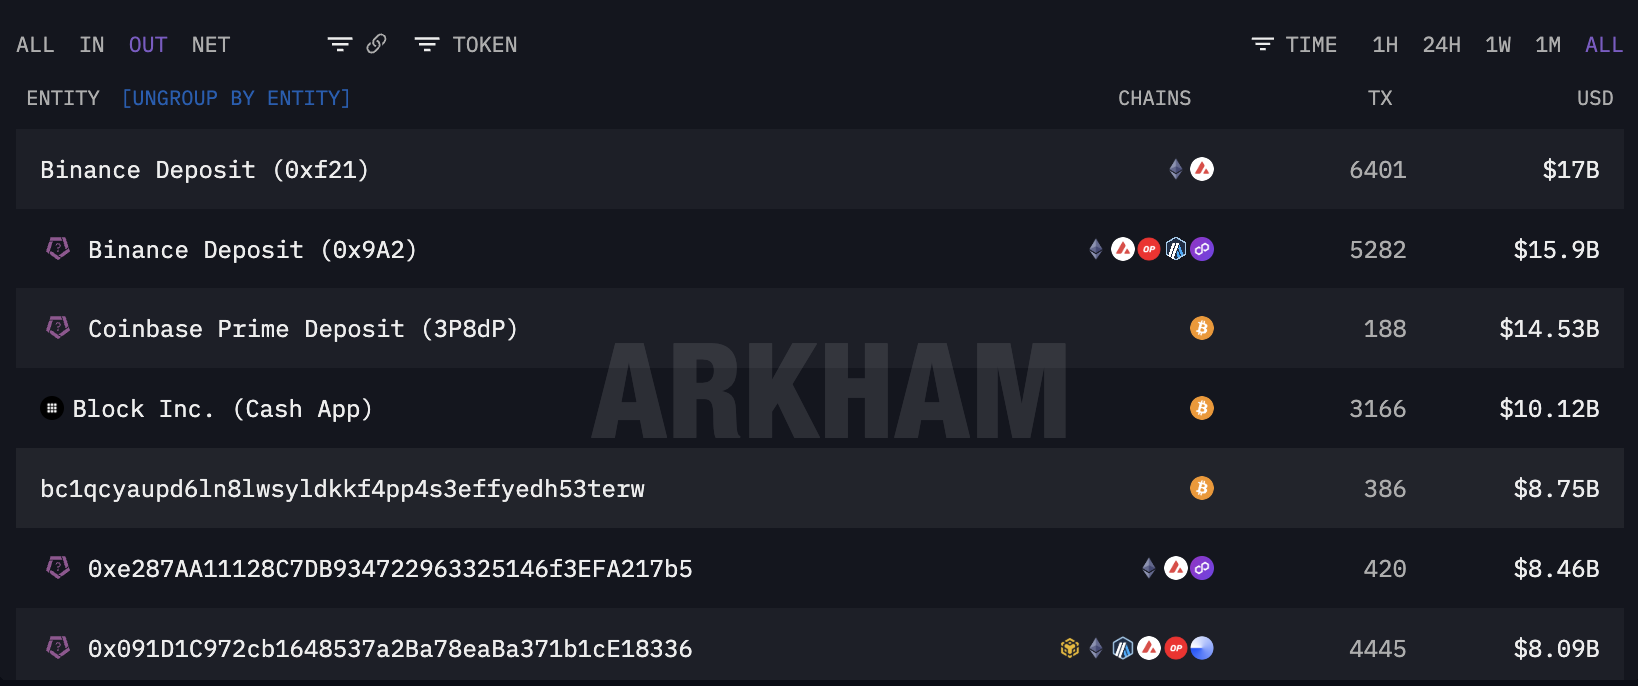
Scrolling further down the counterparty list confirms additional ETF and institutional plumbing. Fidelity’s FBTC ETF inflows appear at $7.28 billion across 171 transactions.
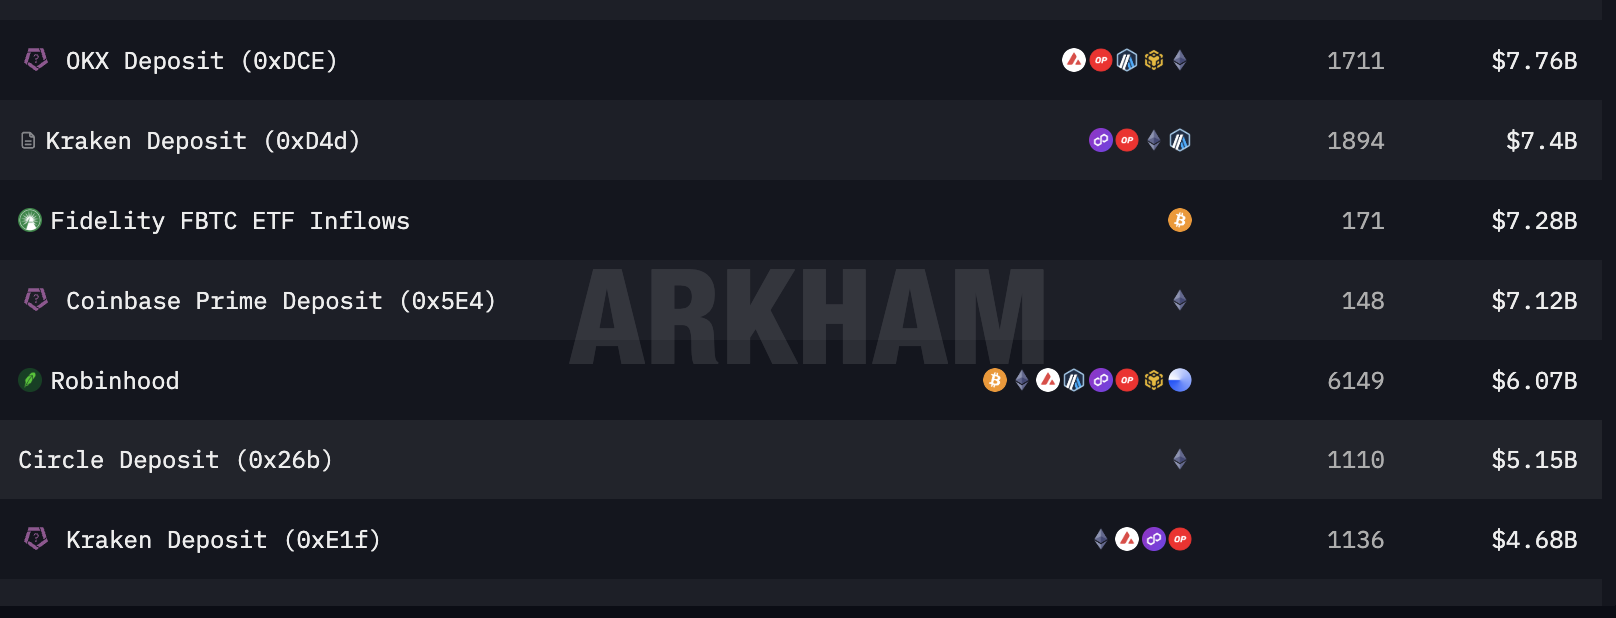
Alongside these labeled flows sit billions more directed to unlabeled wallets. The single largest unlabeled BTC recipient, wallet bc1qcyau..., received $8.75 billion across 386 transactions.
It currently holds 593 BTC and uses Copper’s institutional prime brokerage for custody.
That pattern, large OTC sourcing through a Wall Street trading firm paired with institutional-grade prime brokerage custody, is exactly the profile of a family office or sovereign vehicle operating through the same infrastructure as ETF issuers, just without the filing obligation.
The filings show part of the answer. The chain shows the rest.
The gap between the two hides durable demand from shadow holders who bought through a drawdown and still hold through institutional custody, suggesting deeper structural support than any ETF tracker captures.
That same gap also hides an untracked concentration that could crack it.
The post Who’s Really Holding Wall Street’s Crypto? appeared first on BeInCrypto.
TLDR:
- Bitcoin whales and sharks recorded over $30.9B in losses, averaging $337M daily in Q1 2026.
- Early February saw peak capitulation, with realized losses hitting $1.6B in a single day.
- Large holders led the sell-off, showing institutional-level distribution during market stress.
- Market stabilized post-February, with reduced losses and BTC trading within a tight range.
Bitcoin’s largest holders recorded steep realized losses during the first quarter of 2026, reflecting sustained selling pressure across major wallet groups. On-chain data shows whales and sharks collectively locked in over $30.9 billion in losses during the period.
Heavy Losses Driven by Early February Sell-Off
Glassnode data shared in a recent post on X by Coin Bureau pointed to an intense wave of selling in early February.
During this period, realized losses surged to nearly $1.6 billion in a single day. At the same time, Bitcoin’s price dropped sharply, signaling a coordinated market reaction.
Large holders played a central role in this movement. Wallets holding between 100 and 1,000 BTC recorded average daily losses of $188.5 million.
Meanwhile, wallets with 1,000 to 10,000 BTC posted daily losses of $147.5 million. Together, these groups accounted for a combined daily average of $337 million in realized losses.
This pattern suggests that selling activity was not limited to smaller participants. Instead, it involved entities often associated with institutional capital or long-term investors. The scale of these losses points to a broad liquidation phase rather than isolated exits.
At the same time, long-term holders continued to realize losses of nearly $200 million per day. This added further pressure to the market during the quarter. The combined effect marked the heaviest realized losses since the 2022 bear market.
Market Stabilizes as Selling Pressure Eases
Following the sharp downturn in early February, market conditions began to shift. Realized losses dropped into a lower range, typically between $200 million and $600 million per day. This change coincided with Bitcoin’s price stabilizing between $65,000 and $75,000.
As the weeks progressed, the market entered a consolidation phase. Price movements became more controlled, while large-scale panic selling appeared to subside. However, smaller spikes in realized losses continued to appear throughout March.
These repeated spikes reflected ongoing exits from weaker market participants. At the same time, price action remained choppy, with no clear directional trend. Both buyers and sellers appeared active, yet neither side gained sustained control.
By the end of March, realized losses had settled at moderate levels, ranging between $300 million and $500 million. This steady pattern suggested a more balanced environment compared to the earlier volatility.
The data shows that extreme selling conditions eased after the initial shock. Still, the presence of continued losses indicates that market confidence has not fully returned.
The absence of another major spike suggests a pause in aggressive selling rather than a complete shift in sentiment.
Overall, the first quarter of 2026 reflects a transition from heavy liquidation to a more stable but uncertain market phase.

Alice Evans Allegedly Had $100K While Asking Fans For Donations

Daughter’s touching tribute to Atherton dad with rare heart condition
Stephen A. Smith makes feelings known on Geno Auriemma apologizing to Dawn Staley over viral meltdown after UConn’s Final 4 loss vs. South Carolina


-

 NewsBeat2 days ago
Steven Gerrard disagrees with Gary Neville over ‘shock’ Chelsea and Arsenal claim | Football
-

 Business2 days ago
No Jackpot Winner and $194 Million Prize Rolls Over
-

 Fashion1 day ago
Weekend Open Thread: Spanx – Corporette.com
-
Entertainment5 days ago
Fans slam 'heartbreaking' Barbie Dream Fest convention debacle with 'cardboard cutout' experience
-

 Crypto World3 days ago
Gold Price Prediction: Worst Month in 17 Years fo Save Haven Rock
-

 Tech6 days ago
The Pixel 10a doesn’t have a camera bump, and it’s great
-
Crypto World5 days ago
Dems press CFTC, ethics board on prediction-market insider trades
-

 Tech6 days ago
Avatar Legends: The Fighting Game comes out in July and it looks pretty slick
-

 Business3 days ago
Login and Checkout Issues Spark Merchant Frustration
-

 Sports5 hours ago
India men’s 4x400m and mixed 4x100m relay teams register big progress | Other Sports News
-

 Tech5 days ago
Apple will hide your email address from apps and websites, but not cops
-

 Sports4 days ago
Tallest college basketball player ever, standing at 7-foot-9, entering transfer portal
-

 Tech5 days ago
EE TV is using AI to help you find something to watch
-

 Fashion7 days ago
Amazon Sundays: Soft Spring Layers
-

 Politics5 days ago
Should Trump Be Scared Strait?
-

 Tech7 days ago
Elon Musk’s last co-founder reportedly leaves xAI
-

 Tech5 days ago
Flipsnack and the shift toward motion-first business content with living visuals
-

 Fashion6 days ago
The Best Spring Trends of 2026
-

 Tech5 days ago
How to back up your iPhone & iPad to your Mac before something goes wrong
-
Crypto World6 days ago
Bitcoin’s Six-Month Losing Streak: What On-Chain Data Says About the Market’s Next Move
You must be logged in to post a comment Login