
Crypto World
Riot stock surges after securing 20-year Anthropic AI infrastructure agreement



Riot Platforms (RIOT) surged more than 20% before the start of U.S. equity trading on Tuesday after the bitcoin miner said it signed a $9.1 billion deal with “a leading frontier AI lab,” accelerating its transformation into a provider of infrastructure for the artificial intelligence industry.
The 20-agreement with the company, identified as Anthropic by Bloomberg, covers 191 megawatts of computing capacity at Riot’s Rockdale, Texas, campus.
Once focused almost entirely on bitcoin mining, Riot exemplifies an industry-wide pivot toward AI infrastructure, with long-term leases providing steadier revenue than the volatile flows from approving blocks on Bitcoin.
Miners control large sites with established grid connections, land and cooling systems, allowing them to serve power-hungry AI customers faster than developers starting from scratch. Anthropic recently signed a six-year, $10 billion contract with Volta Infra for computing capacity at a site in Norway operated by bitcoin miner Bitdeer.
Deployment at the Riot sites starts in December 2027, with the full buildout expected by June 2028. Two five-year extension options could increase total contract revenue to $16.1 billion. Riot projects the base term will generate between $7.3 billion and $8.2 billion in cumulative net operating income.

TRON (TRX) is winning as a stablecoin settlement rail even as its Decentralized Finance (DeFi) economy contracts, a divide that is quite evident through the second quarter of 2026.
Record payment flows keep moving across the network, yet that liquidity is largely skipping its trading and lending venues. The chain now prospers on one front while thinning on another.
TRON Stablecoin Volume Climbs as On-Chain DeFi Cools
Tether (USDT) supply on TRON reached $87.9 billion at quarter-end, surpassing Ethereum (ETH), according to a Messari report. The network processed $2.1 trillion in USDT transfers over the period.
TRON’s total stablecoin market cap grew 4.1% to a record $89.2 billion, with USDT holding a 98.5% share. Average daily transfer volume rose 4.3% to $22.8 billion.
The flows read as utility rather than speculation. Stablecoin velocity held at 0.26, meaning roughly a quarter of the supply changed hands each day, a level that has been steady for five straight quarters.
Network usage set records, too. TRON averaged 11.8 million daily transactions, up 8.7%, and 3.6 million daily active addresses, up 11.7%. It cleared a record 14.6 million transactions on June 15.
Follow us on X to get the latest news as it happens
DeFi and DEX Activity Move the Other Way
In contrast, the on-chain economy shrank. TRON’s DeFi total value locked (TVL) slipped 1.9% to $4.4 billion during the quarter. JustLend, the largest protocol, fell 10.5% to $2.9 billion, cutting its share of network TVL from 72.9% to 66.5%.

Average daily volume across TRON’s decentralized exchanges (DEXs) fell 21.7% to $49.3 million. It marked the fourth straight quarterly decline, even as the chain’s dominance in stablecoin payments expanded.
“The decline remains consistent with the broader cooldown in onchain spot trading rather than a TRON-specific structural trend,” the analysts said.
Network fees moved the opposite way, rising 15.9% to $699.4 million. That was the first quarterly increase since an August 2025 governance change cut the energy unit price.
TRX ended the quarter near $0.32, essentially flat after an 11.6% gain in Q1, and now trades around $0.33. The altcoin remains about 23% below its record high.

The split raises a question about what actually drives the token. Settlement demand keeps setting records while on-chain trading dries up.
The price outlook may hinge on whether payment dominance ever converts into value for the token itself.
Subscribe to our YouTube channel to watch leaders and journalists provide expert insights
The post TRON Moved $2.1 Trillion in USDT Last Quarter, Yet TRX Didn’t Budge appeared first on BeInCrypto.
Overnight, the RBA held its cash rate steady at 4.35%, as widely expected after June’s inflation data came in softer than forecast at 3.8% headline. Yet the accompanying statement struck a notably cautious tone, warning that trimmed mean inflation remains elevated and largely unchanged from the March quarter, with oil and related commodities still trading above pre-conflict levels due to the ongoing Middle East crisis. With 55% of economists still expecting at least one further hike in 2026, the door to additional tightening remains firmly open.
The euro, meanwhile, holds a cautiously bullish tone after climbing to a seven-week high near $1.155 against the dollar. Eurozone Q2 growth of 0.4% offered support, though weaker retail activity and mixed inflation signals keep the ECB’s own path uncertain, with policymakers maintaining a deliberately cautious stance ahead of their September 15-16 meeting and giving no firm commitment to further hikes.
The result: two central banks in genuine holding patterns, each leaving the door open to more tightening while waiting for clearer data to justify the next move.
Technical Analysis of EUR/AUD
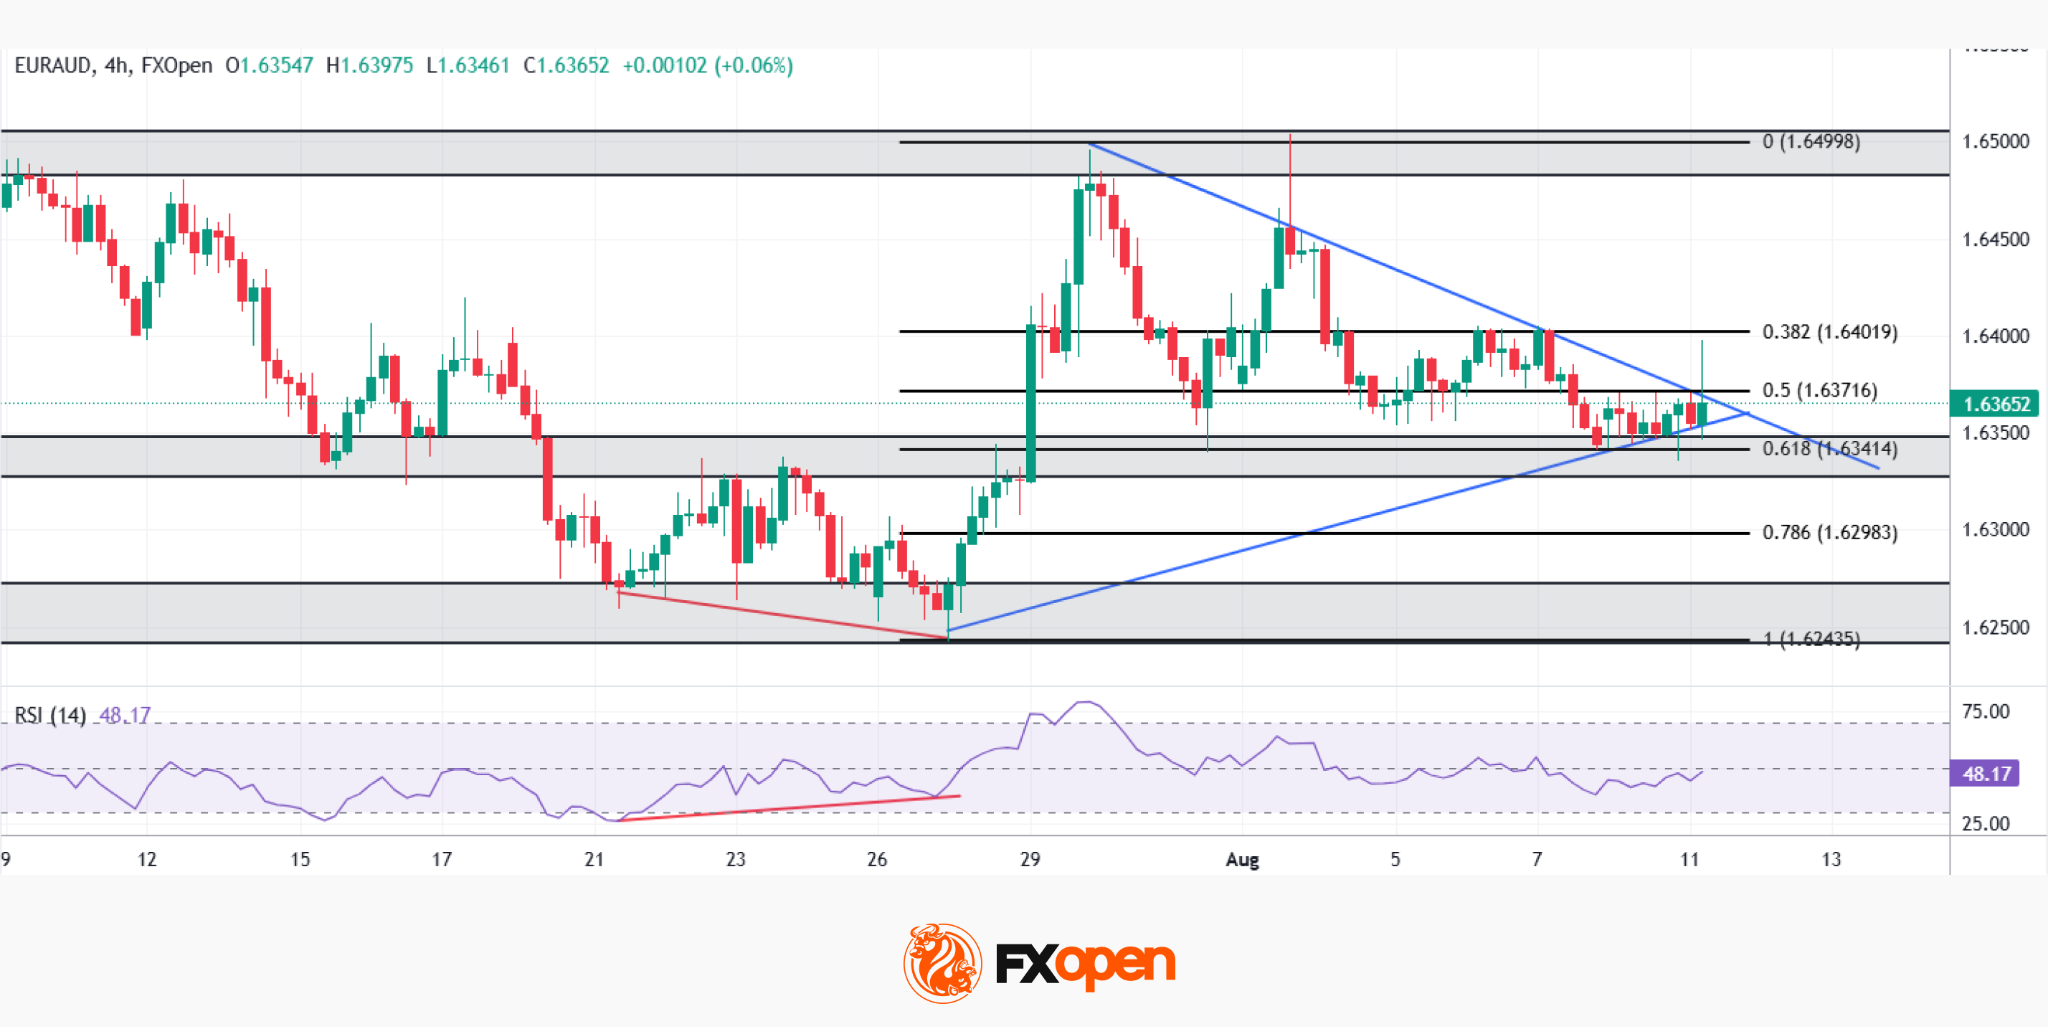
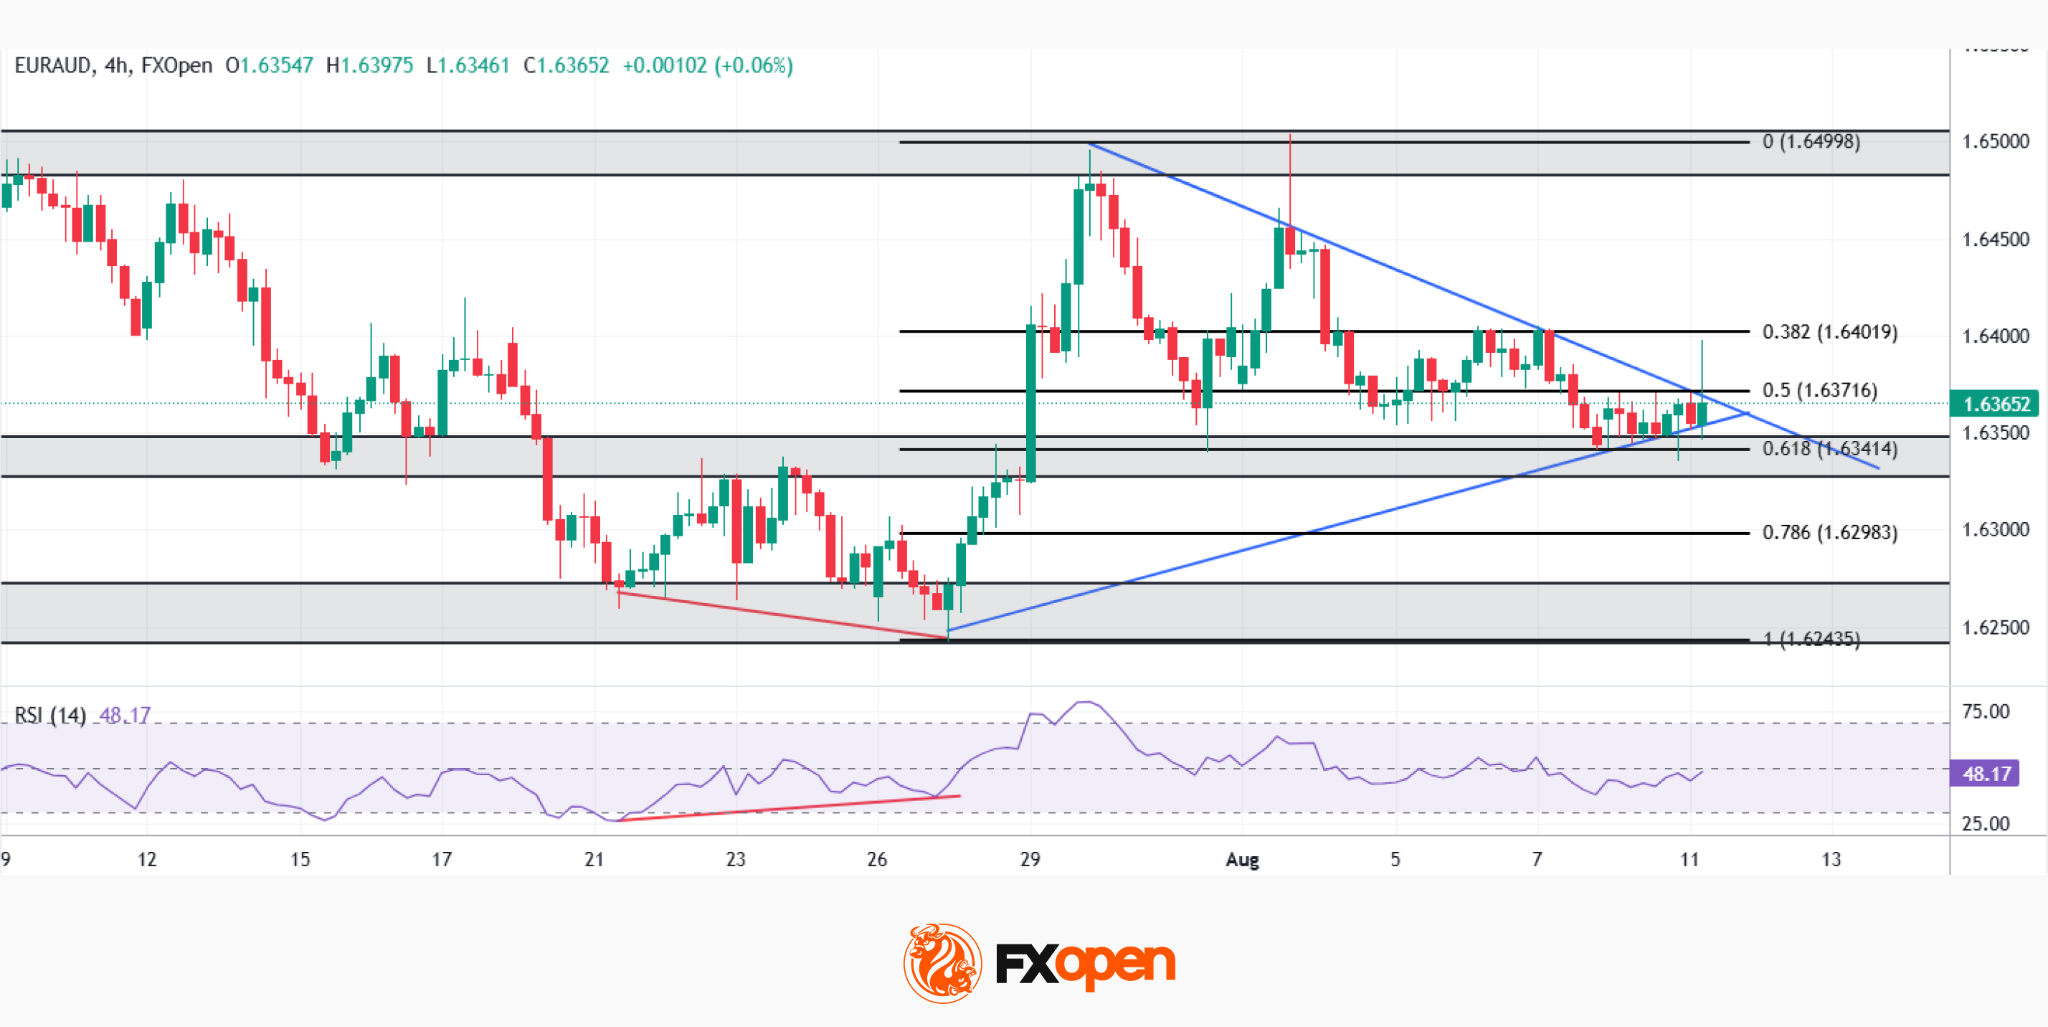
As EUR/AUD chart shows, the pair staged a strong rally from July’s lows near 1.6243, a move that followed a bullish RSI divergence, where price carved a lower low while the RSI printed a higher low. Since topping near 1.6500 in late July, price has been compressing into a symmetrical triangle, with a descending trendline and an ascending trendline converging right around the 0.5-0.618 Fibonacci zone near 1.6342-1.6372.
Bullish Scenario
Should buyers defend the ascending trendline and break above the descending one, the path would open toward the 0.382 retracement near 1.6402, with a stronger move potentially targeting a retest of the 1.6500 highs if momentum builds.
Bearish Scenario
Conversely, a break below the ascending trendline and the 0.618 retracement near 1.6341 would expose the 0.786 level near 1.6298, with a deeper slide risking a retest of the 1.6243 low that anchored the entire July rally.
With price coiled right at the apex of this triangle, and the RSI sitting in neutral territory after cooling from its earlier divergence, EUR/AUD looks poised for a decisive break—will the euro extend its late-July strength, or does the Aussie reclaim the upper hand?
Trade over 50 forex markets 24 hours a day with FXOpen. Take advantage of low commissions, deep liquidity, and spreads from 0.0 pips (additional fees may apply). Open your FXOpen account now or learn more about trading forex with FXOpen.
This article represents the opinion of the Companies operating under the FXOpen brand only. It is not to be construed as an offer, solicitation, or recommendation with respect to products and services provided by the Companies operating under the FXOpen brand, nor is it to be considered financial advice.
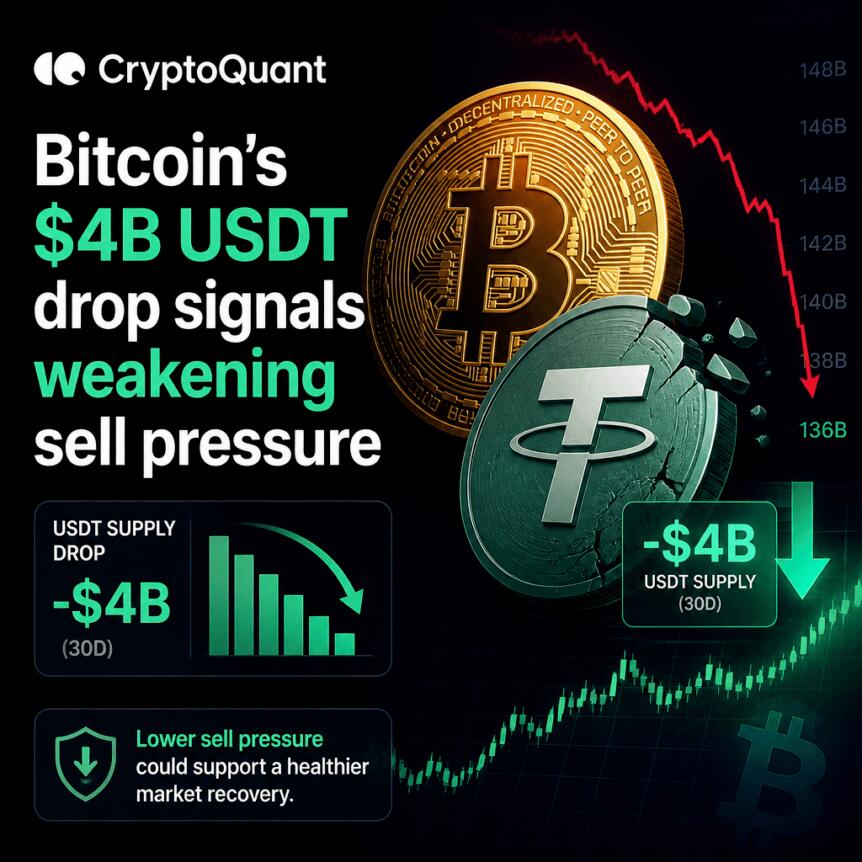
Bitcoin traders have increasingly looked to stablecoins for clues about where risk appetite is headed. A new data review from CryptoQuant highlights that Tether’s USDT has been shrinking in market value at an unusually fast pace—yet the same patterns in past bear markets suggest the selloff may be approaching its end.
According to CryptoQuant, USDT’s 60-day rolling market-cap change averaged about minus $4.88 billion as of Aug. 10, while the most recent 11-day window saw nearly $870 million of USDT supply disappear. The combination points to a liquidity retreat that typically pressures broader crypto performance, but it also aligns with the late-stage behavior of prior downturns.
Key takeaways
- CryptoQuant reports USDT’s 60-day market-cap contraction remains near $4 billion, one of its sharpest declines on record.
- Nearly $870 million of USDT supply vanished over the latest 11-day period, indicating the contraction is actively continuing.
- The steepest 60-day contraction phase previously peaked around July 13 at approximately minus $5.72 billion.
- CryptoQuant argues that the worst stablecoin drawdowns have historically occurred near exhaustion points rather than at the beginning of further acceleration.
- Weekly RSI divergence arguments from analysts like William Clemente echo a broader “late bear-market” narrative.
USDT contraction tightens crypto liquidity
In a CryptoQuant blog post published last week, the onchain analytics firm described USDT as undergoing “one of its sharpest contractions on record.” The emphasis is not just on the overall size of the decline, but on whether the process is still worsening.
CryptoQuant notes that the deterioration has accelerated “at the margin,” pointing to about $870 million in USDT disappearing over the latest 11-day period. It also frames the 60-day market-cap change metric as a way to gauge sustained redemption pressure rather than one-off redemptions.
From a market mechanics perspective, stablecoins often function as a bridge for capital across exchanges and trading pairs. When USDT supply contracts, liquidity can become less available, reducing the “dry powder” investors might use to buy dips—or to rotate into other risk assets.
CryptoQuant cautions, however, against assuming a clean cause-and-effect relationship between stablecoin flows and Bitcoin’s spot price. In its view, both can respond to the same broader risk-off conditions: redemptions may accelerate alongside spot selling, rather than predictively preceding it.
“The caution is that correlation between USDT flows and BTC price doesn’t settle causality,” CryptoQuant analysts said. They added that sustained USDT expansion has historically coincided with stronger Bitcoin price regimes, while prolonged contractions have aligned with weaker demand and deeper corrections.
Late-stage bear-market behavior, not necessarily a fresh leg down
The key analytical question for traders is whether the USDT drawdown is merely “history repeating” or whether it signals a new intensification of selling pressure. CryptoQuant’s answer leans toward the former.
Historically, the firm argues, the most pronounced phases of USDT contraction tend to occur toward the final chapters of macro downturns, when selling momentum begins to move closer to exhaustion than to further acceleration. In that framework, severe stablecoin redemptions become less a signal to short the next day and more an indicator that the market has already been tested heavily.
CryptoQuant also highlights a specific milestone in the recent contraction cycle: the steepest 60-day decline in USDT market cap completed on July 13, when it reached about minus $5.72 billion. That point matters because it offers a reference level for where “worst-case” pressure may have already been seen—meaning later readings could represent stabilization or easing rather than escalation.
Still, the data in the CryptoQuant update is not painting a picture of immediate normalization. The latest 60-day average remains close to the multi-billion-dollar contraction zone, suggesting liquidity conditions are tight even if selling intensity may be moderating at the margin.
RSI divergence arguments reinforce a “bottoming” thesis
While stablecoin contractions speak to liquidity and risk appetite, technical market indicators often shape how traders interpret timing. The CryptoQuant findings have added momentum to broader “late bear market” narratives, including comparative analysis that points to earlier cycle behavior.
Cointelegraph has reported that some market participants are increasingly aligning with the idea of a new Bitcoin macro bottom forming before the end of 2026, even if the near-term trend remains volatile. In the same broader discussion, independent analyst William Clemente has argued for a cautious “cheap but not done yet” view.
On Aug. 8, Clemente posted on X that he considers Bitcoin “cheap,” while allowing for the possibility of “a leg lower” at some point during the year. Two days later, he highlighted what he described as a bullish divergence between BTC/USD and the relative strength index (RSI) on weekly time frames.
That divergence is widely treated as a leading indicator in technical analysis—particularly because the strongest RSI divergence signals historically appeared during turning points, including at the end of the 2022 bear market. In Cointelegraph’s earlier coverage, RSI divergence was framed as a “classic” reversal signal that coincided with the conclusion of that drawdown cycle.
What to watch next: stablecoin flows and confirmation signals
If CryptoQuant’s interpretation is correct, the most concerning USDT drawdown phases may already have passed their peak, even if contraction continues in the background. For investors and traders, the practical question is whether the contraction rate keeps accelerating or whether it begins to flatten—especially relative to the steepest reading around July 13.
In the coming weeks, market watchers may want to track whether USDT’s 60-day market-cap change continues near minus $4 billion or starts moving toward less negative territory, as well as whether BTC’s technical picture—such as the weekly RSI divergence narrative—gets reinforced by actual trend stabilization rather than only indicator hints. The stablecoin/liquidity story may not be the sole driver of price, but it can shape how quickly the market regains the ability to absorb dips and rebuild demand.

Ambiq Micro (AMBQ) on Tuesday beat analyst estimates for the second quarter and with its guidance for the third quarter. Ambiq stock rose in early trading. The Austin, Texas-based chipmaker lost an adjusted 7 cents a share on sales of $33.9 million in the June quarter. Analysts polled by FactSet expected a loss of 26 cents a share on sales…
Copyright ©2026 Investor’s Business Daily, LLC. All rights reserved. 87990cbe856818d5eddac44c7b1cdeb8

Crypto investigators are grappling with one of the toughest loss-allocation problems in digital asset security: estimating theft from self-custody wallets, where there is no authoritative registry of affected users. The ongoing analysis of the Coldcard-related hack is now producing markedly different figures depending on how teams treat “confirmed” victim reports versus on-chain attributions.
Blockchain analytics platform CryptoQuant currently puts confirmed losses at 1,432 Bitcoin, while Galaxy Research and TRM Labs argue the broader toll is higher when tracing suggests additional victims across multiple waves. The discrepancy highlights why hardware-wallet exploits can be hard to quantify—and why investors and security watchers should treat any single number as provisional.
Key takeaways
- CryptoQuant reports 1,432 BTC as a confirmed floor, relying on victim-provided evidence before labeling funds stolen.
- Galaxy Research says it has high-confidence minimum losses of 1,730 BTC, using victim reports to validate wider attack patterns.
- TRM Labs estimates attackers drained roughly 1,816 BTC across 5,200+ addresses in four waves, with the figure expected to keep rising before stabilizing.
- All parties underscore that there is no complete list of affected self-custody accounts, so totals can only be inferred—not definitively counted.
Why Coldcard thefts are difficult to total
Self-custody incidents differ sharply from exchange hacks, where investigators can often begin with a centralized list of compromised accounts or balances. In the Coldcard case, analytics teams instead have to assemble estimates from scattered disclosures—wallet addresses and transaction identifiers shared by victims—then map those to on-chain behavior consistent with the attack.
That structure creates two competing measurement philosophies. One is conservative: count only losses that victims directly confirm, to avoid “false positives” from pattern matching. The other is investigative: use confirmed losses to identify additional wallet clusters and transactions that likely belong to other victims, even when those victims have not yet come forward publicly.
The result is a widening gap between “confirmed” and “attributed” totals—exactly the gap that matters for incident reporting, accountability, and the credibility of downstream security narratives.
Galaxy narrows a moving minimum—backed by victim corroboration
Galaxy’s approach, as explained to Cointelegraph by Alex Thorn, treats early totals as tentative until victim disclosures can corroborate suspected victims and linked on-chain activity. Thorn previously described Galaxy’s earlier estimate—up to 1,816 BTC—as a potential figure rather than a finalized tally.
By Tuesday, Galaxy reported a high-confidence minimum of 1,730 BTC. Thorn also indicated that the minimum could still increase as more victim reports align with the attack’s observed patterns.
In Thorn’s description, the key distinction is between (1) losses directly supported by victim-reported information and (2) additional losses identified through the broader pattern those reports help validate. Galaxy said it has directly confirmed 450+ BTC from victim reports, while those reports have helped uncover other victims in a wider set totaling more than 730 BTC. At the same time, Galaxy said it is still holding back BTC it suspects but cannot yet verify with sufficient corroboration.
For readers, this methodology matters because it suggests a “floor that can rise” dynamic: as the public dataset of victim evidence grows, the subset that analysts can confidently label as theft expands, improving the stability of the totals.
TRM Labs: broader tracing across multiple waves
TRM Labs told Cointelegraph that its independent tracing lands in the same general range as Galaxy. In its more detailed analysis, TRM said its work estimated that attackers drained about 1,816 BTC from more than 5,200 addresses across four waves.
TRM’s Ari Redbord, global head of policy, cautioned that investigators should expect estimates to keep moving upward before settling. That framing aligns with the reality that self-custody victims may take time to discover compromise, identify relevant addresses, and disclose the information needed for analysts to match on-chain traces.
TRM’s results also underline why the same incident can generate different “totals” depending on whether analysts use strict victim confirmations or extend attribution to clusters and transactions that look consistent with the exploit.
CryptoQuant uses victim evidence to avoid inflated claims
CryptoQuant takes a more restrictive stance. According to Cointelegraph, CryptoQuant’s Julio Moreno said the company begins with public reports from victims—including wallet addresses or transaction IDs—then checks those disclosures against known on-chain patterns associated with the Coldcard attack.
With that workflow, CryptoQuant’s current confirmed tally is 1,432 BTC, which Moreno described as a floor that may increase if additional victims publicly reveal the hacked addresses.
Moreno emphasized that CryptoQuant avoids treating on-chain pattern matching alone as a basis for identifying victims, because doing so could produce false positives and inflate the estimate. In his explanation, the fundamental issue is that the stolen Bitcoin belongs to individuals rather than a single centralized entity (like an exchange) that can provide consolidated incident data. As a result, analysts can only confirm what victims disclose.
“Knowing the total BTC stolen is difficult, and it will always be an estimation.”
CryptoQuant’s stance is a reminder that, in self-custody incidents, analytical precision is constrained by data availability. The most cautious number may not reflect the full damage—but it can be the most defensible as “confirmed” while the case is still unfolding.
What others are (and aren’t) tallying
Cointelegraph also reported that Chainalysis has not conducted an independent loss tally. Separately, blockchain investigator ZachXBT publicly stated he has no plans to monitor or trace the incident.
While the absence of a consensus total could frustrate observers seeking a single figure, it also signals that the ecosystem is converging on a shared understanding: without complete victim registries, analysts must balance completeness against verification.
For now, the main thing to watch is whether the announced figures stabilize as more victims submit corroborating wallet data. If disclosures accelerate, the “confirmed” floor should rise and estimates may converge—otherwise the spread between conservative and attributed totals may remain a persistent feature of how self-custody hacks are measured.


MoneyGram, which serves roughly 60 million active customers, views blockchain rails as a way to make cross-border transfers faster, cheaper and easier to track, without requiring customers to think about the technology powering them. Ramps fits into the vision as it connects digital assets into MoneyGram’s extensive brick-and-mortar network to help everyday customers turn tokens into local cash.
“The future of payments is built on access,” MoneyGram CEO Anthony Soohoo said in a statement. “Bringing MoneyGram Ramps to Solana is another step toward building a truly open, global payments network.”
MoneyGram has spent several years building connections between its traditional payments network and crypto. In 2022, it rolled out a service with the Stellar Development Foundation that allowed users to move between cash and Circle’s USDC stablecoin through its retail network, giving crypto wallets a physical entry and exit point for digital dollars.
The firm took that strategy further in June, announcing MGUSD, its own dollar-backed stablecoin issued by Bridge, the stablecoin infrastructure company owned by Stripe, on the Stellar network.
The company has also been deepening its ties with Solana, becoming a validator in June, helping process and secure transactions on the network.
MoneyGram was also listed as a one of the partners in Open USD, the Stripe-led stablecoin initiative that aims to share revenue with a consortium of backers.


BTC USD sits at $64,000, down -1.5% on the day, still pinned under the ceiling that’s frustrated bulls for weeks. The bigger story: a labor market miss that should have triggered a relief rally instead got shrugged off entirely. That disconnect matters more than the headline number for this week’s Bitcoin price prediction.
Employers cut 23,000 jobs in July, the first net loss since the pandemic-era recovery, badly missing the 95,000 gain economists penciled in. Markets read the miss as rate-cut fuel and Treasury yields dropped.
Risk assets were supposed to catch a bid. Bitcoin tapped its 50-day average and rolled straight back over, rejecting the level cleanly on the daily candle.
The rejection fits a pattern that’s held since the May peak near $80,000: lower highs, lower lows, a death cross that macro tailwinds can’t seem to dislodge. That’s the technical backdrop worth understanding before deciding what comes next.
Bitcoin Price Prediction: Can BTC USD Hit $65,000 This Week?
BTC is trading in a tight band, with CoinLore showing support at $63,766 and resistance at $65,000. A break above that ceiling opens room toward $67,081, and eventually $78,085, according to CoinLore’s model. The 7-day forecast lands at $63,935, essentially flat, which tells its own story.
The RSI reads 50, dead neutral. Neither camp has conviction right now. The 50-day EMA still trades below the 200-day, and bulls needed a daily close above that shorter average to even start flipping the read, they didn’t get it.
Bull case: a clean reclaim of $65,000 opens a path toward $67,000-plus.
Base case: continued consolidation between $63,766 and $65,016, chopping traders on both sides.
Bear case: a break below $62,216 (the prior swing low) confirms the downtrend has legs. For deeper technical context, this breakout analysis and this CPI-driven forecast are worth a read before positioning either direction.
LiquidChain Targets Early Mover Upside as Bitcoin Tests Key Levels
A death cross that shrugs off a jobs miss isn’t a market begging to be bought at these levels. Bitcoin at a $1.3 trillion market cap doesn’t offer the kind of asymmetric upside early-stage capital tends to chase; the coin’s most explosive growth phases are, arguably, behind it. That’s pushing more traders toward presale-stage infrastructure plays where the ceiling hasn’t been priced in yet.
LiquidChain ($LIQUID) is building a Layer 3 execution environment that fuses Bitcoin, Ethereum, and Solana liquidity into one unified layer; developers deploy once and access all three ecosystems rather than fragmenting liquidity across chains.
The presale has raised $936,891.74 at a current token price of $0.01489. Core features include Single-Step Execution and Verifiable Settlement, both aimed at solving the liquidity fragmentation problem that’s plagued cross-chain DeFi since its inception.
Visit the LiquidChain Presale Website Here.
This is not financial advice. Crypto markets are highly volatile and presale tokens carry elevated risk. Always conduct independent research before investing.
The post Bitcoin Price Prediction: Will $64K Hold Ahead of Tomorrow’s CPI Data? appeared first on Cryptonews.


The first bad block appeared at height 4,487,776 at 15:44 UTC on Aug. 7. Once the weakness had been demonstrated on the live network, others appeared to copy it and produce invalid blocks of their own. Ravencoin has since released a fix, but patching the software does not undo what is already written.
The two pools, 2Miners and RavenMiner, are building their version from block 4,487,775, the last one before the exploit. The project said it asked them to restart from a more recent point, which would put less history at risk, but they declined.
Some transactions caught in the gap may be picked up again and recorded on the replacement chain. Ravencoin further warned exchanges and other services not to assume that deposits or withdrawals wiped out this way will return on their own, and advised them to suspend both until the network settles on a single version.
Exchanges have started responding. Bitvavo suspended RVN deposits and withdrawals as a precaution, citing the exploited vulnerability. South Korea’s Upbit placed an investment warning on RVN across its won, bitcoin and tether markets and also stopped deposits.
The project stopped short of endorsing the pools’ plan, saying the details were being shared for transparency rather than as support for any particular version of the chain.


Australia’s financial crime watchdog suspended crypto ATM operator Cryptolink Pty Ltd for three months, forcing the firm to shut down 96 machines across the country.
The Australian Transaction Reports and Analysis Centre, known as AUSTRAC, said the suspension took effect Aug. 9. Cryptolink cannot provide virtual asset services while the order remains in place.
Crypto ATMs allow customers to use cash to buy cryptocurrency, serving as a bridge between fiat currency and crypto. AUSTRAC said it remains concerned about Cryptolink’s ability to manage transactions that carry a higher risk of money laundering or terrorism financing.
The regulator said Cryptolink initially met the terms of an enforceable undertaking imposed in October 2025. The company later failed to submit required threshold transaction reports and did not respond to an AUSTRAC information request.
AUSTRAC CEO Brendan Thomas said those failures made the business “too high risk to continue operating at present.”
The earlier undertaking followed an investigation by AUSTRAC’s Cryptocurrency Taskforce into alleged breaches of anti-money laundering and counter-terrorism financing rules. The regulator cited late transaction reports and weaknesses in Cryptolink’s risk assessments.
AUSTRAC also issued Cryptolink a fine of 56,340 Australian dollars ($36,600), which the company paid.
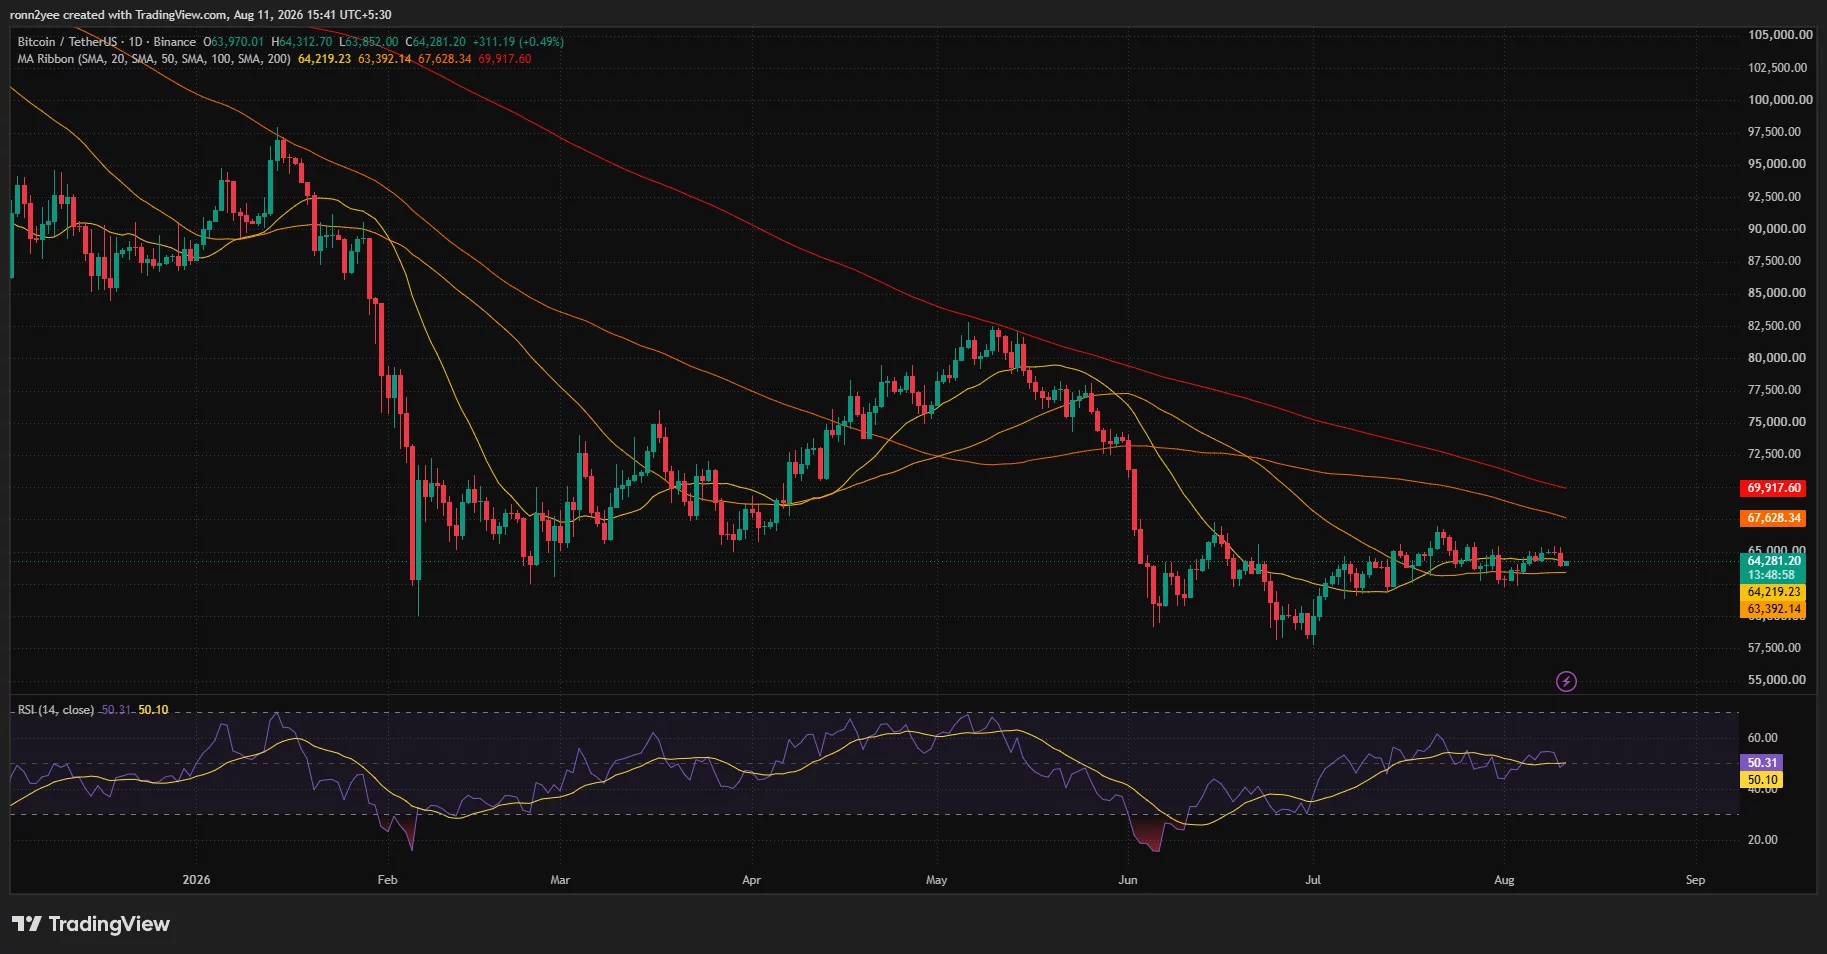
Bitcoin price fell below $64,000 on Aug. 11 as rising oil prices and uncertainty before the U.S. inflation report weakened risk appetite, leaving traders focused on whether the $63,900 support level can prevent a deeper correction.
Summary
- Bitcoin price fell about 2% to $63,780 before recovering above $64,000 during the session.
- The $63,900–$64,000 region is the main short-term pivot ahead of the July CPI report.
- Daily RSI remains neutral at 50.31, while BTC trades below its 100-day and 200-day moving averages.
- Liquidation clusters near $63,700 and $65,600 could attract price during the next volatility spike.
Bitcoin price drops below $64,000
According to data from crypto.news, Bitcoin (BTC) price traded as low as $63,852 on Binance before recovering to approximately $64,281 at the time the daily chart was captured. The intraday rebound reduced the loss, but BTC remained below the $65,000 level that buyers had attempted to establish as support over the previous four days.
The decline followed another deterioration in U.S.-Iran negotiations over reopening the Strait of Hormuz. Brent crude rose above $89 a barrel as reduced hopes for an agreement renewed concerns about energy supplies and inflation.
Higher oil prices can complicate the Federal Reserve’s inflation outlook by raising transportation and production costs. That pressure reduced demand for risk assets as U.S. traders prepared for the July Consumer Price Index report.
Broader crypto markets also weakened during the move. Ether and XRP fell more than 2%, while Bitcoin lost the $64,000 level after failing to hold above $65,000.
SoSoValue data shows that institutional demand offered limited support. U.S. spot Bitcoin exchange-traded funds recorded $144.6 million in net outflows on Aug. 10, ending five consecutive sessions of positive flows. The reversal reduced one source of spot demand as macroeconomic uncertainty increased.
Daily chart shows Bitcoin trapped in consolidation
The daily chart shows that Bitcoin’s price remains locked inside the broad range formed after the June decline. BTC has repeatedly found buyers near $60,000–$63,000, but attempts to establish a sustained recovery above $65,000 have failed.
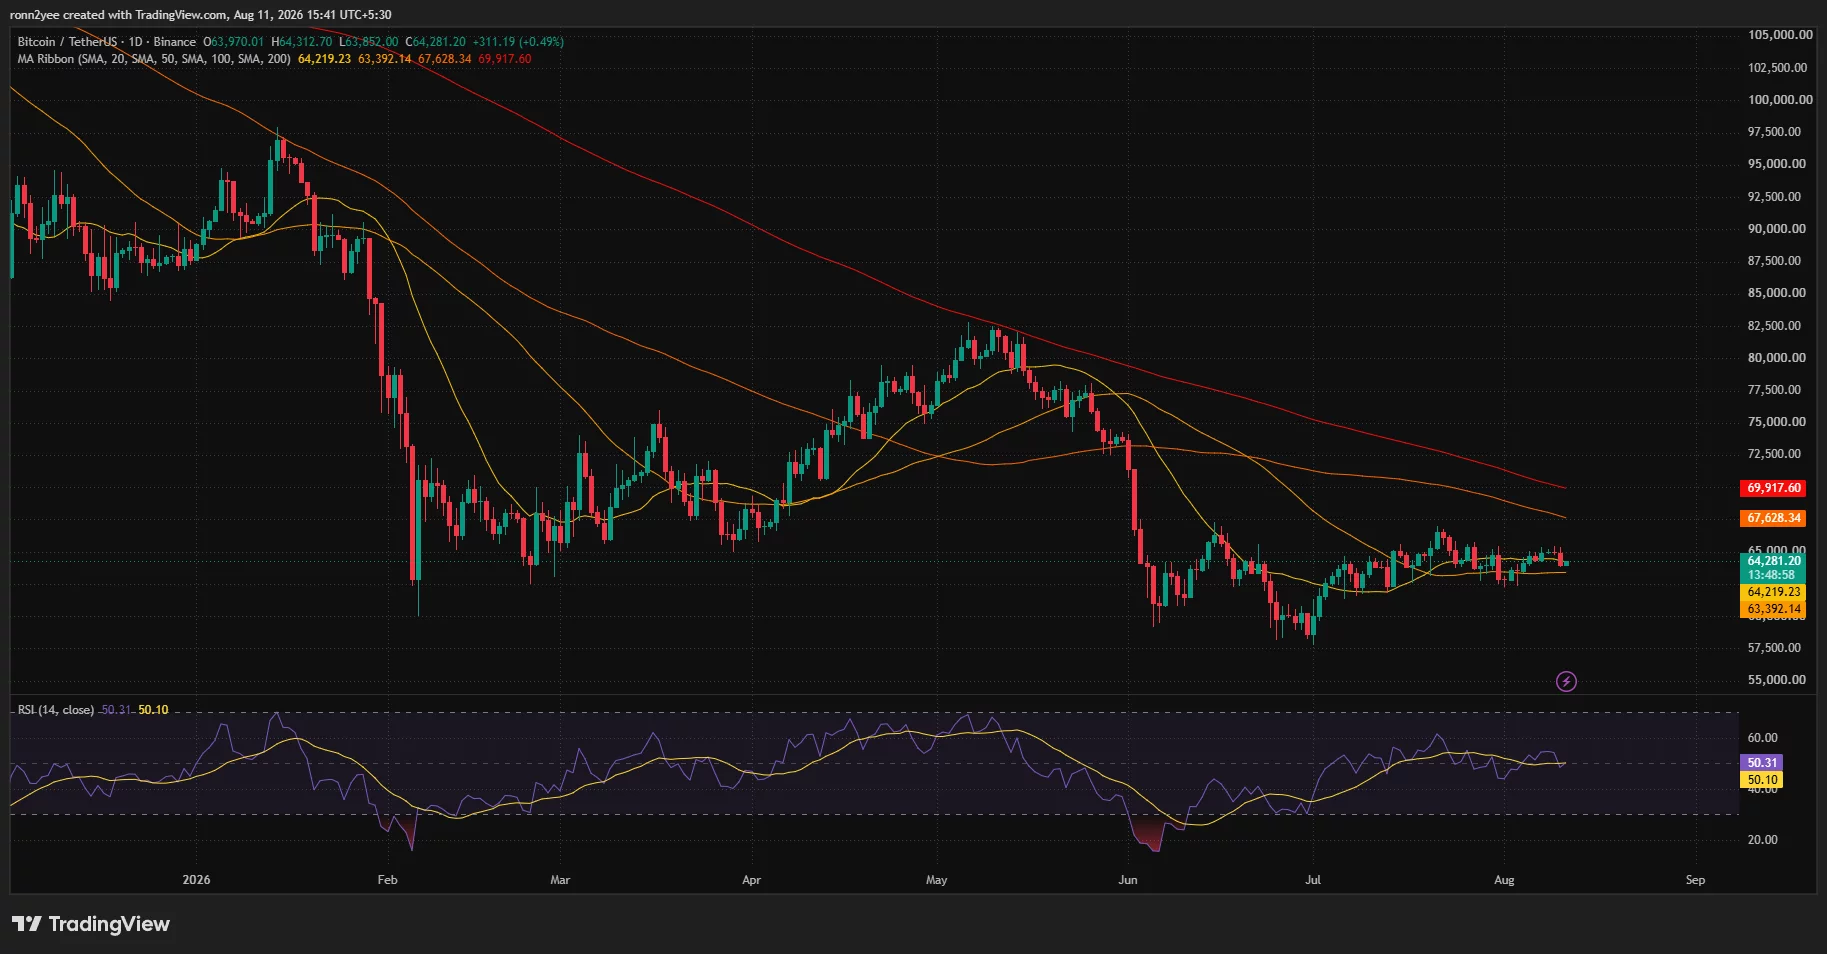
The asset was trading slightly above its 20-day simple moving average at $64,219 and its 50-day SMA at $63,392. Holding both averages would keep the short-term recovery structure intact despite the latest sell-off.
However, the wider trend remains under pressure. Bitcoin continues to trade below the 100-day SMA at $67,628 and the 200-day SMA at $69,918. Those averages are also sloping downward, creating a large resistance area between approximately $67,600 and $70,000.
The daily relative strength index stood at 50.31, almost level with its signal line at 50.10. The reading shows that neither buyers nor sellers have decisive momentum. It also supports the view that Bitcoin remains in consolidation instead of entering a confirmed directional trend.
A daily close below the 50-day SMA at $63,392 would weaken the recovery and expose $62,000, followed by the June-July demand zone between $57,500 and $60,000. Conversely, a close above $65,500 would give buyers another opportunity to challenge the 100-day SMA.
$63,900 is the key Bitcoin support
The 4-hour chart places immediate support between $63,900 and $64,000. Bitcoin briefly moved that region below during the sell-off before recovering, indicating that buyers were still active around the weekly midpoint.
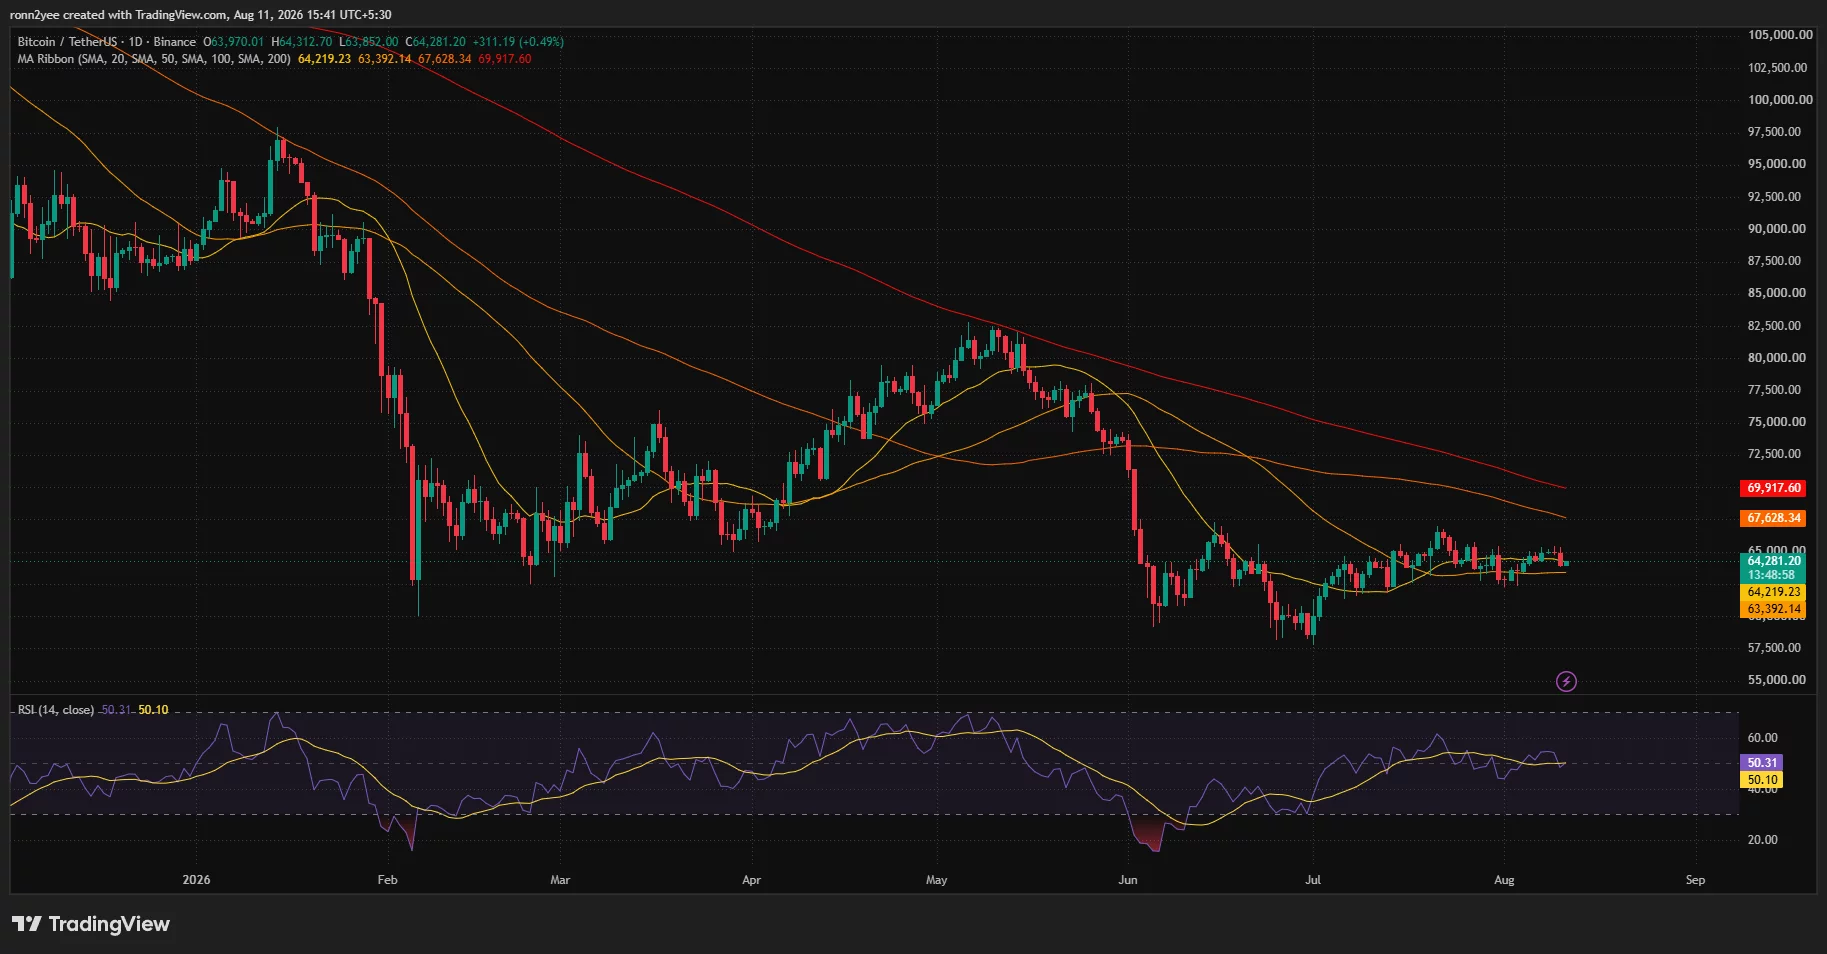
Trader Lennaert Snyder described $63,900 as an important level because it represents the 50% mark of the previous weekly candle. He said holding or losing that price could determine momentum for the remainder of the week.
Under the bullish scenario, continued support near $63,900 could produce another move toward the previous weekly high around $65,500. That level rejected Bitcoin during its latest advance and remains the first major barrier above the current range.
A bearish break would become more convincing if BTC loses $63,900 and falls below the recent $63,200 low. Such a move could send BTC price toward $62,000 and allow sellers to target the lower part of the wider consolidation range.
The 4-hour Supertrend has turned bearish, placing resistance at $65,210. Bitcoin also slipped below the indicator’s former support near $64,344 during the decline. Bulls must reclaim both levels before the short-term trend can return to a stronger position.
Bull-bear power stood at negative 612, confirming that sellers had regained short-term control. However, the negative reading was smaller than the extreme levels recorded during earlier June sell-offs, suggesting that bearish momentum had not yet reached capitulation conditions.
Trader Daan Crypto Trades similarly identified $64,000 as the main pivot. He noted that BTC had closed slightly below the 4-hour 200-period moving averages but had started to stabilize, with several large-cap altcoins still showing relative strength.
Liquidation heatmap points to $63,700 and $65,600
The one-week CoinGlass liquidation heatmap shows large concentrations of leveraged positions on both sides of Bitcoin’s current price.
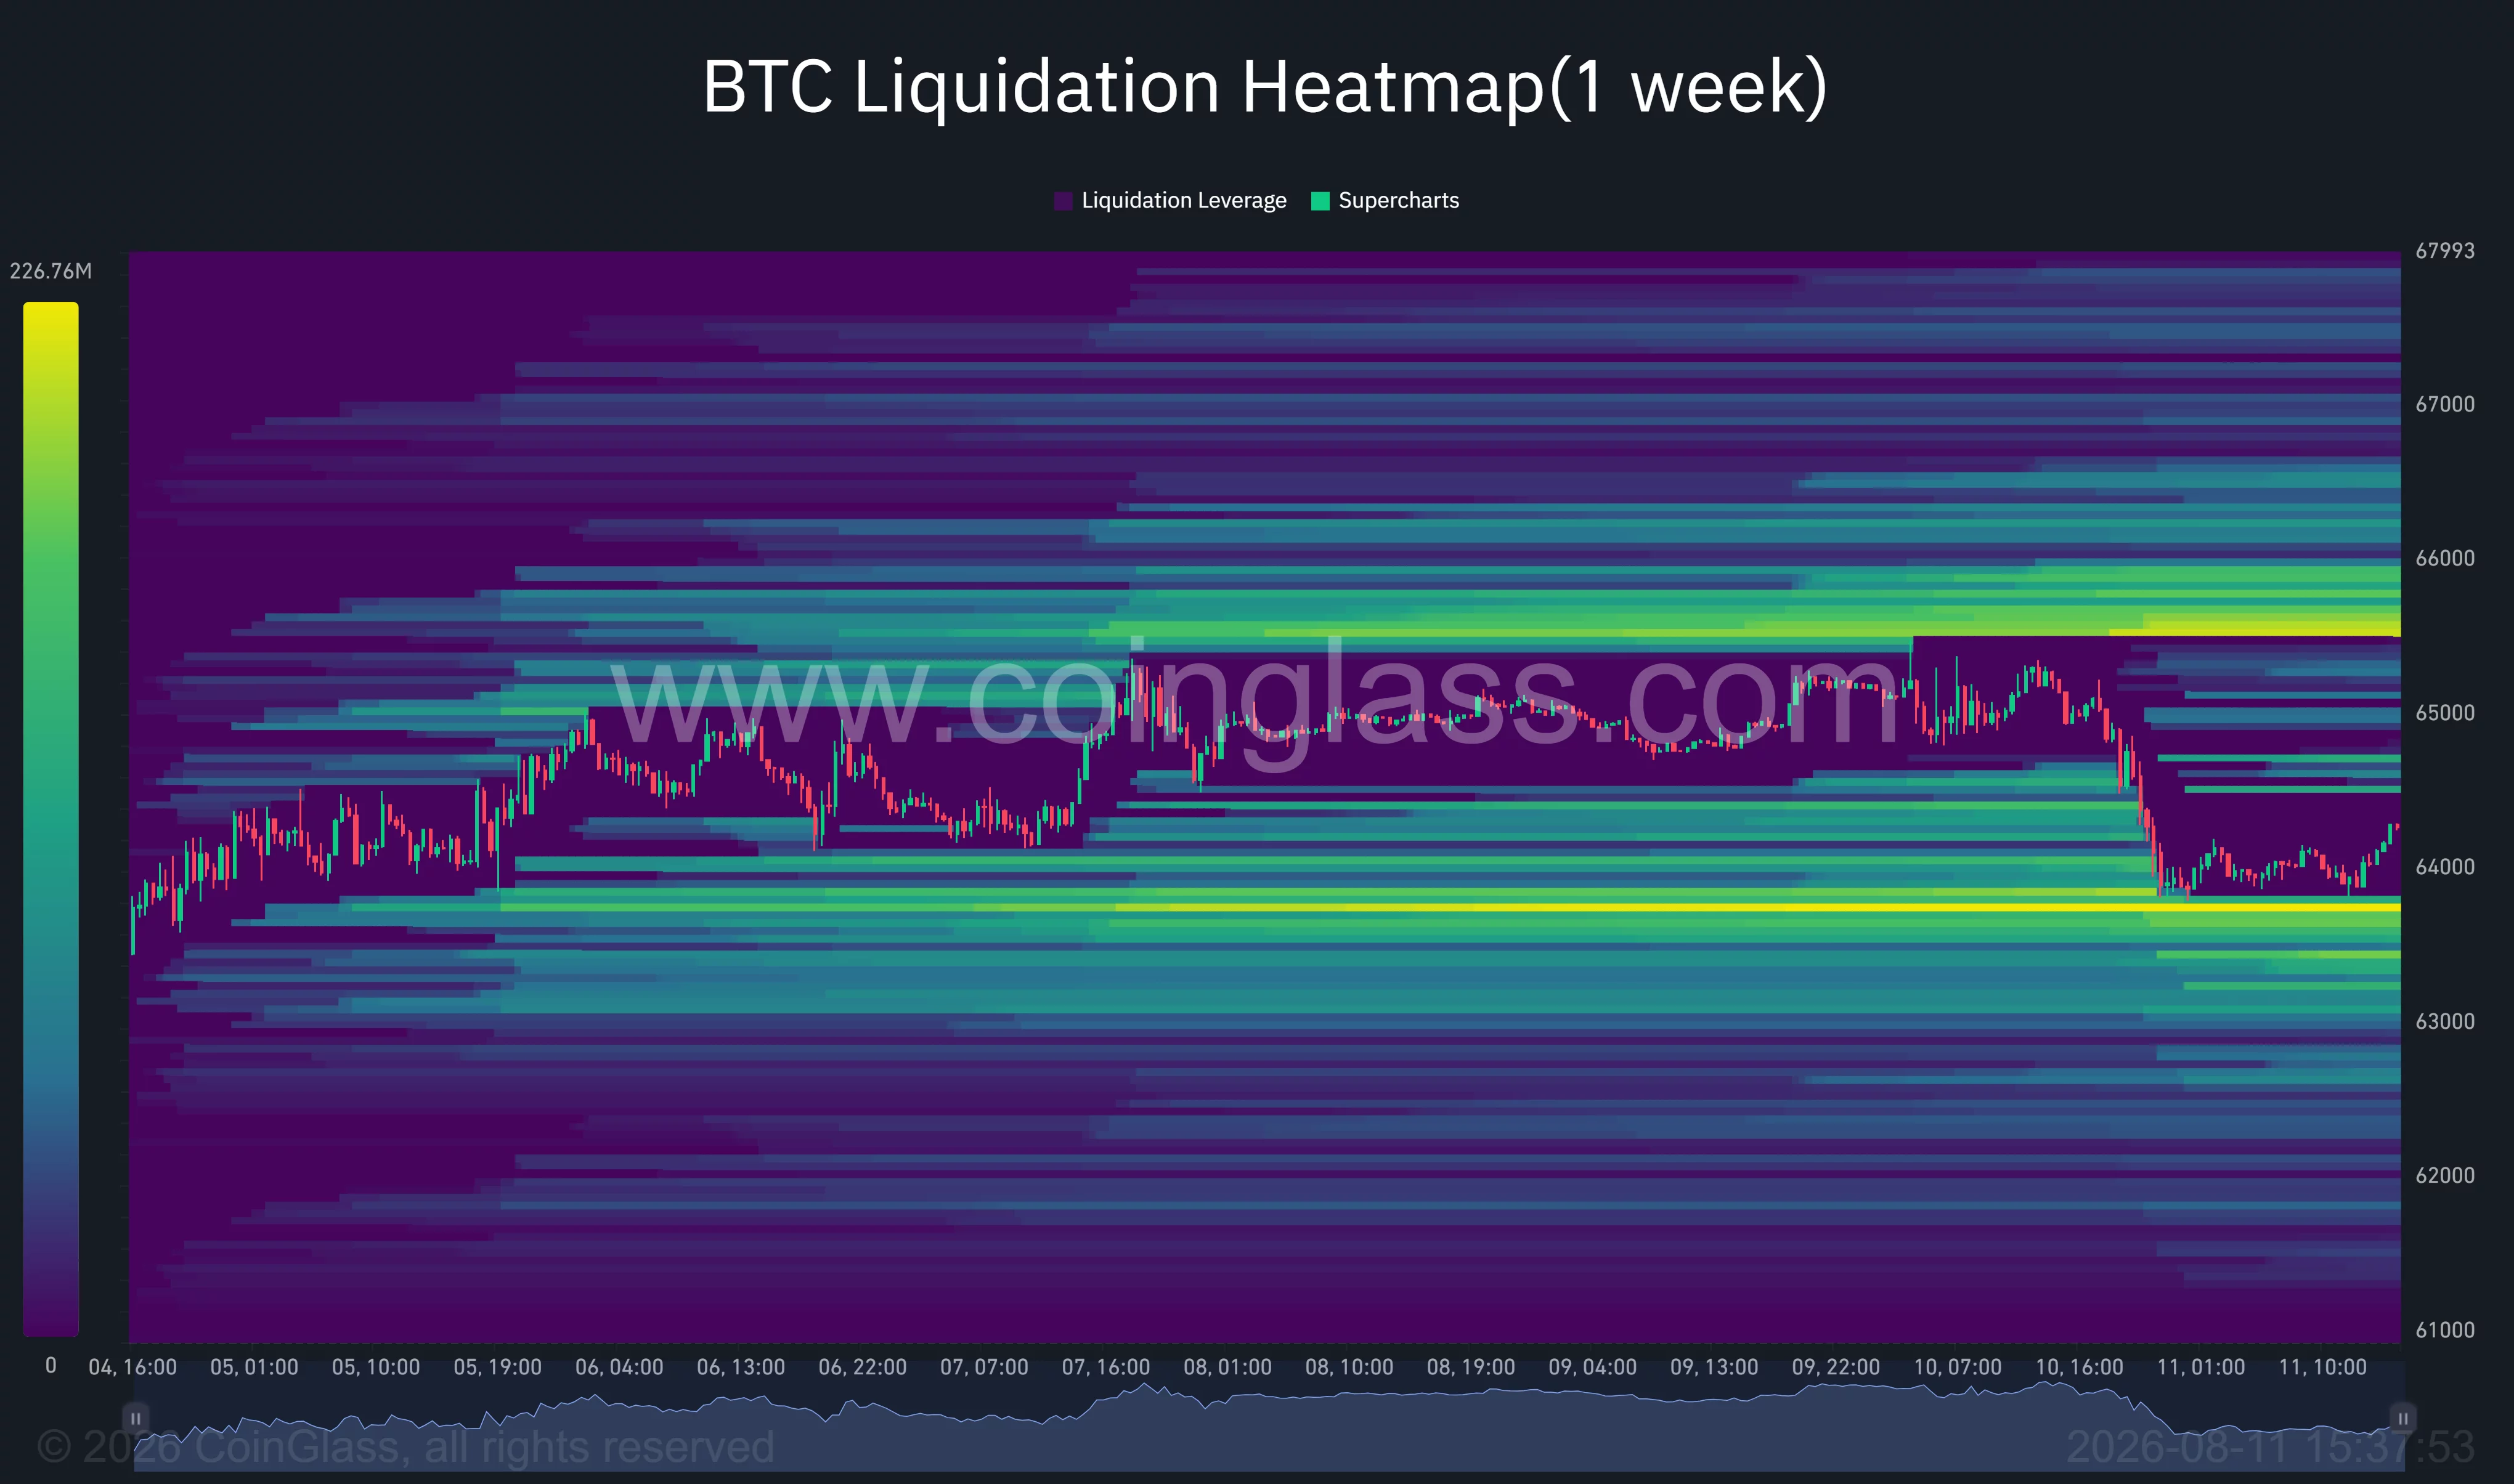
The closest downside liquidity cluster sits around $63,600–$63,800. Bitcoin tested this region during the latest decline but did not produce a sustained breakdown. A second pocket is visible between $63,200 and $63,400.
If $63,700 fails, forced selling could accelerate the move toward the lower cluster. However, the concentration of liquidity can also attract buyers looking to enter after leveraged long positions have been cleared.
The largest nearby upside band sits around $65,500–$65,700. A rebound through $65,000 could therefore trigger short liquidations and help BTC revisit the weekly high. Additional liquidity appears near $66,200 and $67,000, but those levels would require a confirmed breakout from the current range.
This positioning leaves Bitcoin vulnerable to a sharp move in either direction. Price is trading between the closest major liquidation pools, while the upcoming inflation release provides a clear catalyst for volatility.
U.S. CPI could decide Bitcoin’s next move
The U.S. Bureau of Labor Statistics will publish July CPI data on Aug. 12 at 8:30 a.m. Eastern Time. The report could influence expectations for the Federal Reserve’s September policy decision, particularly after rising oil prices renewed inflation concerns.
A cooler reading could ease pressure on Treasury yields and help Bitcoin recover $65,000. Breaking $65,500 would expose the $65,600 liquidation cluster, followed by the 100-day SMA near $67,628.
A hotter reading would strengthen the case for restrictive monetary policy and could pressure speculative assets. Under that outcome, a confirmed loss of $63,900 would shift attention toward $63,200, $62,000, and eventually the $60,000 psychological support.
Regulatory uncertainty also remains in the background. The CLARITY Act’s procedural vote was delayed until Sept. 15, removing a near-term policy catalyst that some U.S. investors had expected before the Senate recess.
For now, Bitcoin remains range-bound rather than decisively bearish. The $63,900–$64,000 zone separates a possible recovery toward $65,500 from a deeper move toward $62,000. The CPI release will likely determine which liquidity pool the market tests first.
Disclosure: This article does not represent investment advice. The content and materials featured on this page are for educational purposes only.

New workshop and storage building approved in Hindley Green

Beach Energy Shares Rise As Oil Prices Surge Amid Ongoing Strait Of Hormuz Supply Fears
TRON Moved $2.1 Trillion in USDT Last Quarter, Yet TRX Didn’t Budge

Renter of Home in Anne Heche Crash Denies Settlement With Son

No Jackpot Winner as $257 Million Prize Rolls Over to $269 Million Monday Draw

Weekend Open Thread: Staud – Corporette.com

Banking Financial Awareness Terms 2026 | Important Banking Terms for IBPS PO, SBI PO & Clerk

Whether you’re completely new to crypto, Subscribe and let’s make crypto simple.

6 Habits That Can Attract Wealth and Financial Success #youtubeshorts #trending #facts
-

 Fashion4 days ago
Weekend Open Thread: Mattifying Sunscreen
-

 Fashion4 days ago
Frugal Friday’s Workwear Report: Cap-Sleeve Pointelle Crewneck Sweater
-

 Sports5 days ago
Jordan Coyle & Cordiamo take Laya Arena Stakes at RDS
-

 News Videos3 days ago
Can Astrology Help Find Gold and Silver Trends? A Financial Astrology Guide
-
 Business6 days ago
US stocks: Dow closes at record on Mideast optimism; SpaceX, AMD drag Nasdaq
-

 Politics5 days ago
Reform UK And Greens Sink To Lowest Favourability Ratings To Date
-

 Business7 days ago
Nvidia Stock Climbs 2.5% as Chip Sector Rally Builds Ahead of AMD Earnings, Nvidia’s Own Report Looms
-

 Tech6 days ago
OpenAI, Anthropic AI agents targeted real people and systems in cyber tests
-

 Crypto World7 days ago
Polymarket targets $20 billion valuation as competition heats up in prediction market sector
-

 Business6 days ago
Supply chain issues impact Ingredion
-

 Tech4 days ago
Rinn Pharma & Biopharma to join NordicPharmaTrain network
-

 Business2 days ago
How to Start a Cleaning Business: A Step-by-Step Guide
-
 Crypto World6 days ago
Dow and S&P 500 Hit Records on AI Earnings: When Will the Bubble Burst?
-

 Business2 days ago
Datadog: Best Of Breed For Multiple Reasons
-

 Business2 days ago
BDC Weekly Review: Private BDC Q2 Numbers Are Strong
-
 Crypto World7 days ago
Dollar Index Trapped at 100 as Hawkish Fed Meets Official Selling
-

 Business6 days ago
McDonald’s (MCD) Q2 2026 earnings
-

 Fashion6 days ago
The Bright Side of Black and White
-

 Fashion6 days ago
Suit of the Week: Me + Em
-

 Business7 days ago
Apple UK encryption challenge filed against Home Office
You must be logged in to post a comment Login