
Crypto World
Ripple Clarity Act: SEC Vote Could Set Crypto Rulemaking in Motion on August 14


In Ripple CLARITY Act news, the SEC is scheduled to vote on August 14, 2026, on whether to publish a proposal known as Regulation Crypto for public comment. The proposal would create a bespoke offering regime under the Securities Act for investment contracts involving the offer of crypto assets, replacing staff guidance and policy statements with more permanent regulations.
The vote would begin a formal rulemaking process if commissioners approve publication. A proposal released for comment would not itself be a final rule; the SEC would still need to gather public input, revise the proposal as appropriate, and bring a final rule back to the commission for consideration.
This move could be boosted by the Senate not making a decision on the CLARITY Act before the August recess, with the next meeting set for September. XRP USD is trading just above key support at $1, with the uncertainty creating indecision on the chart.
A Regulator Moving Where Congress Hasn’t
The three-member commission will decide whether to approve publication of the proposal for a public comment period. That decision would mark the start of rulemaking aimed at establishing more permanent rules for digital-asset firms.
SEC Chairman Paul Atkins has ranked crypto rulemaking as a top priority for the agency. The proposal follows a Senate vote on the Digital Asset Market Clarity Act that did not advance before the August recess, leaving the market-structure bill stalled.
Until now, the SEC’s crypto approach has relied substantially on staff statements and policy guidance. Formal notice-and-comment rulemaking, by contrast, is intended to produce durable, binding regulations once finalized.
What the Proposal Could Do as the CLARITY Act Stalls
Regulation Crypto is expected to provide an exemption that would allow qualifying crypto projects to raise capital without automatically triggering SEC registration requirements. The proposal may also describe circumstances in which the SEC’s securities jurisdiction no longer applies after the managerial efforts involved in an investment contract have been exhausted.
That approach could address a longstanding question in U.S. crypto regulation: whether an asset that initially qualifies as part of an investment contract must always remain a security. The SEC’s rulemaking could provide issuers with greater clarity about compliance at different stages of a project’s lifecycle.
TD Cowen analyst Jaret Seiberg wrote that the proposal could be the first in a series of crypto regulatory proposals following the stalled legislative effort. The SEC’s work also follows joint efforts with the Commodity Futures Trading Commission to create a taxonomy for crypto assets and additional rules relating to tokenized securities.
Why the Vote Matters for CLARITY Act XRP Readers
$XRP just closed at its lowest since November 2024, and the on-chain read is more interesting than the price. — Santiment Intelligence (@SantimentData) August 13, 2026
 Price closed at ~$1.00 on Aug 12, the lowest daily close since Nov 2024 and roughly 69% below the January 2025 peak near $3.30.
 Activity picked up anyway. Active… pic.twitter.com/3JcxJjWNFd
The proposal is described as a regime for qualifying crypto projects. For readers following XRP, the immediate significance of the August 14 meeting is procedural: commissioners are considering whether to publish a proposed framework for comment, not whether to adopt a final rule that day.
If published, the proposal would reveal further details about the expected offering exemption and circumstances in which securities jurisdiction may no longer apply. The expected framework could give qualifying projects a path to raise capital without full registration and could address the role of managerial efforts in an investment contract, but the final details would remain subject to the rulemaking process.
The Ripple CLARITY Act Bottleneck
With the market-structure bill stalled, formal SEC rulemaking is one of the primary avenues through which crypto offerings may be defined under federal securities law. The agency’s proposal is therefore expected to provide a clearer path for U.S. crypto policy while Congress considers broader legislation.
Atkins has also called for congressional legislation to establish guardrails around U.S. crypto markets. SEC rulemaking and congressional action can therefore proceed on separate tracks, with the agency’s proposal focused on the regulatory treatment of crypto-related investment contracts.
Read more: SEC open meeting notice, August 14, 2026
The post Ripple Clarity Act: SEC Vote Could Set Crypto Rulemaking in Motion on August 14 appeared first on Cryptonews.

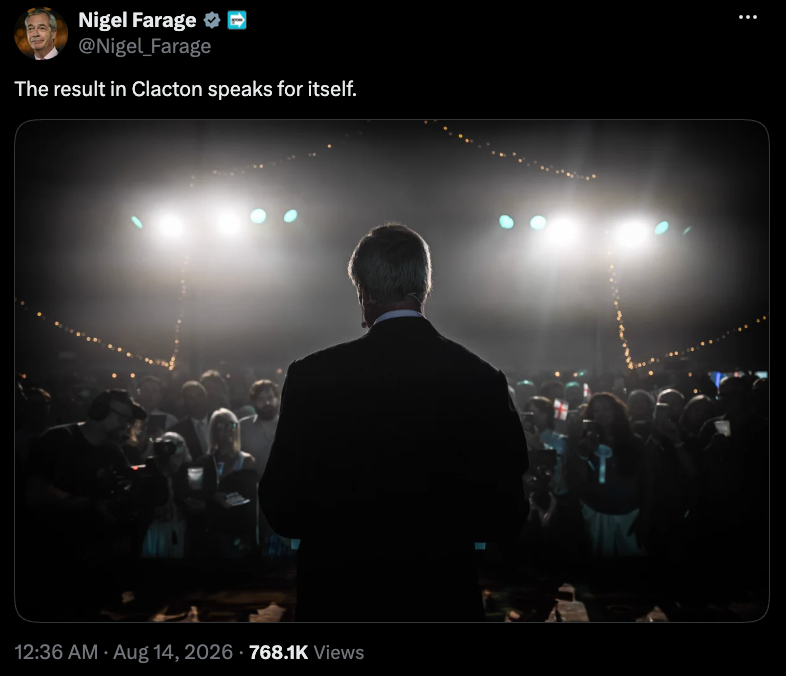
UK Reform leader Nigel Farage will face an investigation that had been briefly paused following his resignation from Parliament after winning a by-election on Thursday with no major party candidates participating.
As of Friday, the UK Parliamentary Commissioner for Standards website showed that Farage was currently under investigation for “failure to register an interest” related to the Reform leader receiving millions of dollars’ worth of donations and gifts from two figures tied to the crypto industry. The investigation was halted in July after Farage resigned as a member of Parliament, but resumed following his reelection as Clacton’s MP.
The commission will probe cryptocurrency billionaire Christopher Harborne giving Farage $6.7 million as well as the Reform leader’s staff and security funded by George Cottrell, a convicted fraudster tied to a crypto casino. Should the investigation determine that Farage violated parliamentary rules, he faces a possible suspension from parliament, which could trigger another by-election.
Under UK parliamentary rules, new members must register all current financial interests within a month of their election, as well as any benefits received in the 12 months prior. Farage initially called Cottrell’s donation a “reward” for campaigning for Brexit and later described both men’s contributions as “gifts” given “on an unconditional basis.”
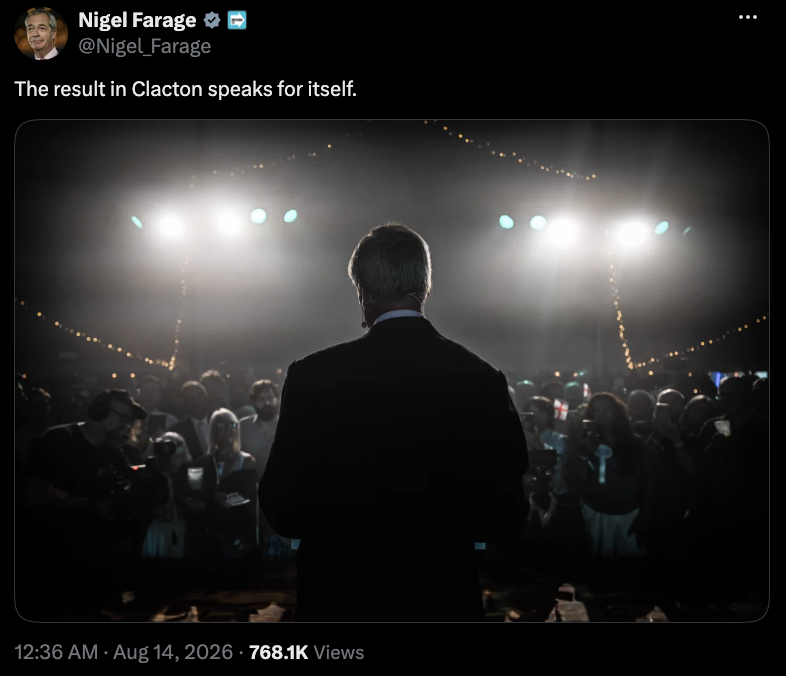
Source: Nigel Farage
The by-election triggered by Farage’s resignation in July saw the Reform leader winning with 63% of the vote, defeating satirical candidate Count Binface’s 27%. None of the other major parties participated in the race, which then-Labour leader and UK Prime Minister Keir Starmer called a “desperate stunt” by Farage. Andy Burnham has since become prime minister.
Related: Reform UK chair calls for probe into SBF-linked donation: Report
UK mulling permanent ban on crypto “gifts”?
Amid Farage’s political scandal, Labour lawmakers reportedly proposed that a moratorium on crypto donations implemented in March be made permanent as part of measures to address the potential influence of foreign actors.
According to the International Bar Association, unincorporated associations are allowed to give more than $675 directly to UK politicians, offering a loophole for companies with business in the country to be used as “conduits for foreign or dark money.”
Magazine: Inside the fake crypto startup that fooled North Korean IT workers
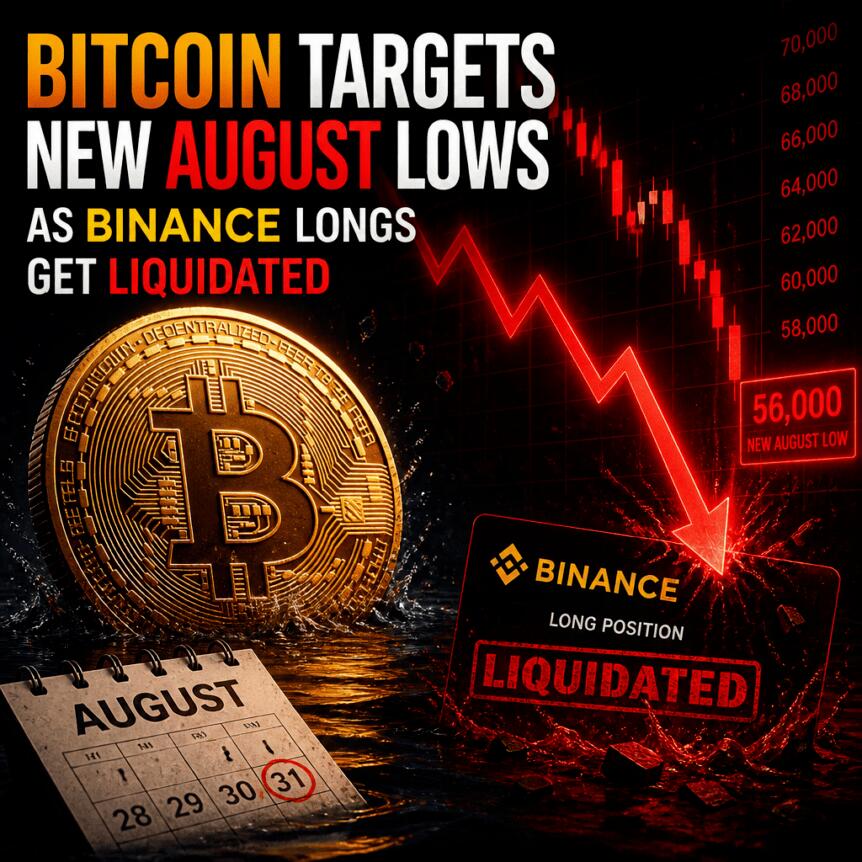
Bitcoin traders are entering a tense stretch as leveraged long positions come under pressure, with onchain analytics suggesting that a broader liquidation “cleanout” may be starting. According to CryptoQuant analysis published Thursday, the interaction between Binance futures open interest and BTC/USD price has shifted in a way that often accompanies long positions being stopped out or liquidated.
At the same time, CryptoQuant CEO Ki Young Ju warned that the conditions typically associated with a renewed Bitcoin bull market have not yet fallen into place—an important reminder for investors who may be betting on a quick rebound after consolidation.
Key takeaways
- CryptoQuant analysis links the latest BTC downside move with signs of leveraged long positions being flushed out via Binance open interest dynamics.
- The price-to-open-interest correlation reportedly fell to 0.25 after both price and open interest declined, consistent with weakening longs.
- CryptoQuant data previously showed Binance open interest rising while BTC traded in a narrow range, pointing to leverage building during consolidation.
- CoinGlass data showed $236 million in total cross-crypto liquidations over the prior 24 hours at the time of writing.
- Ki Young Ju says a sustained bull-market setup has not materialized yet, with key onchain indicators still in “bear” territory.
Binance open interest signals a leveraged long squeeze
CryptoQuant’s Thursday analysis, authored by community analyst “BorisD,” focuses on Binance open interest (OI) and its relationship with BTC price action. Open interest reflects total active derivative positions—longs and shorts combined—and is often used as a proxy for how much capital is committed to leveraged trading.
While BTC traded in a relatively tight range after June, CryptoQuant data showed Binance open interest climbing gradually, reaching $8.15 billion on Wednesday. In the analyst’s framing, this rise suggested futures activity was increasingly dominating while spot participation lagged, creating conditions where leveraged positioning could become vulnerable if price broke down.
As lower time frames started showing downside volatility, CryptoQuant said the price-to-OI relationship shifted into a “flux” state. The key idea: when price falls while open interest stays elevated or rises, it can indicate that traders are doubling down on exposure—sometimes turning into a rapid liquidation cascade if the move accelerates.
“Initially, as the price fell, the correlation shifted to the negative side, indicating that OI was rising despite declining prices,” the analyst wrote. “This showed a double-sided squeeze and [an] increasingly complex liquidity structure — driven by long positions trying to buy the dip on one end, and additional short positions entering the market on the other.”
CryptoQuant’s latest correlation reading reportedly came in at 0.25. In the analysis, that number is presented as evidence of declining long positions as BTC continues to move lower—supporting the view that the market is moving toward the “anticipated cleanout” phase.
From correlation shift to liquidation risk
CryptoQuant’s interpretation ties the recent correlation behavior to the fate of leveraged longs. The analyst said the “simultaneous drop in both price and OI” typically points to longs “giving up,” being stopped out, or getting liquidated—especially when downside volatility increases.
While open interest alone does not specify whether liquidations are primarily long- or short-driven, combining it with price direction can help traders anticipate where forced exits may concentrate. In this case, the analysis emphasizes long exposure vulnerability as BTC approaches lower levels seen earlier in August.
Market-wide liquidation pressure also appeared to be present. According to CoinGlass liquidation data (reported via a screenshot in the original analysis), total cross-crypto liquidations were $236 million over the prior 24 hours at the time of writing, underscoring that the broader ecosystem was not immune to leverage unwinds.
Why this matters after range trading
One reason the Binance OI story is taking center stage is that it follows a period of relatively tight trading. When price compresses, leverage can build quietly—especially if futures markets attract more participation than spot. CryptoQuant’s earlier observation that Binance OI increased while BTC stayed within a narrow range aligns with that pattern.
For investors and traders, the practical implication is that a breakout does not always arrive in a smooth, orderly way. When range-bound conditions end—particularly after rising open interest—liquidations can amplify the direction of the move as positions fail and traders scramble to reduce risk. CryptoQuant’s commentary suggests that this kind of acceleration may be underway as BTC/USD heads toward fresh month-to-date lows.
However, the analysis also implies uncertainty about timing and magnitude. The correlation metric provides a signal about what is likely happening in positioning, but it does not guarantee whether the market will continue sliding immediately, rebound quickly, or enter another brief consolidation before the next leg.
CryptoQuant CEO: bull-market conditions still not in place
Even if liquidation-driven volatility creates opportunities for tactical entries, sentiment cues from onchain leaders remain cautious. In his latest market commentary, CryptoQuant CEO Ki Young Ju said that the “stars haven’t aligned” for a Bitcoin bull run yet.
Ju framed his view using a “basket of onchain indicators,” which he described as still residing in “bear” territory. Earlier coverage from Cointelegraph had similarly cited composite onchain metrics reaching prolonged “capitulation” conditions; one example referenced at the time was Glassnode’s view that Bitcoin is in its longest “capitulation” phase since the end of the last bear market in 2022.
Taken together, the message is two-sided: liquidation dynamics can force near-term downside and create mechanical market pressure, while the bigger question—whether investor behavior and onchain signals have shifted into a durable accumulation phase—remains unresolved.
Traders should watch whether Binance open interest continues to contract alongside price (which would be consistent with longs being removed) or whether OI stabilizes even as price tries to recover. At the same time, investors looking for a bull-market shift should monitor whether the onchain indicator “bear” conditions that Ki Young Ju referenced begin to improve, rather than relying solely on short-term volatility swings.
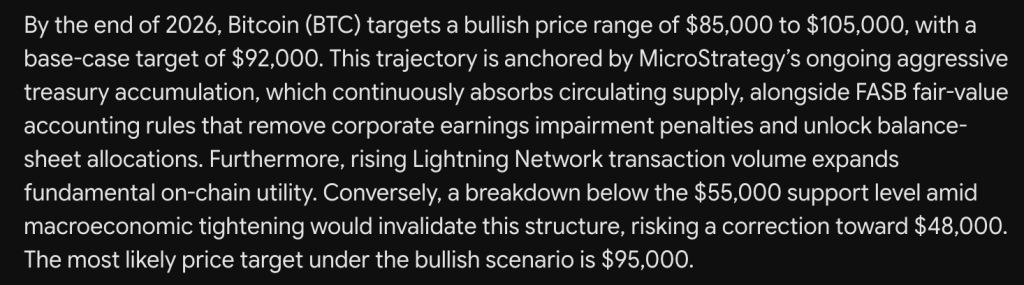
An accounting rule change might be the most underrated catalyst on this list. Google Gemini AI predicts it will help carry Bitcoin to $85,000 to $105,000 by the end of 2026, and the price prediction settles on a $92,000 base case, with $95,000 as the most likely outcome.
Corporate accumulation sits at the center. Gemini points to ongoing aggressive treasury buying that continues to absorb circulating supply.
FASB fair-value accounting rules make that easier. They remove earnings impairment penalties that previously punished companies for holding a volatile asset.
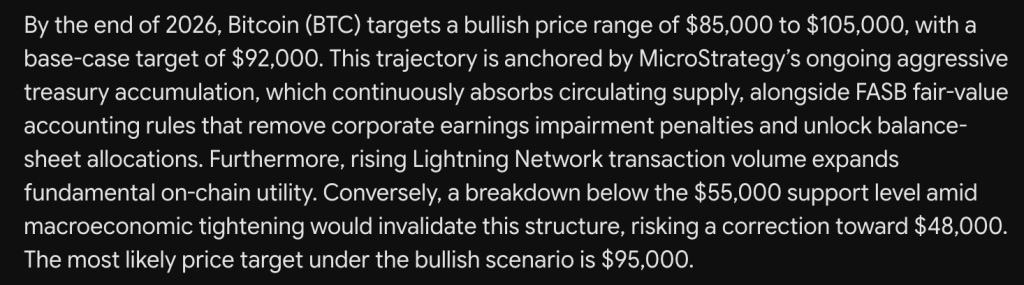
That unlocks balance-sheet allocations that were previously blocked. Finance teams no longer face write-downs on paper losses they never realized.
Lightning Network transaction volume adds utility to the layer. Rising throughput there expands fundamental on-chain activity beyond storage alone.
The bear case has one clear trigger. A breakdown below $55,000 support amid macroeconomic tightening would invalidate the entire structure.
That scenario risks a correction toward $48,000. Gemini treats the level as the dividing line rather than a soft warning.
Everything above it keeps the bullish path intact. Everything below it completely changes the picture.

Bitcoin Price Prediction: An Accounting Rule Quietly Opened Corporate Treasuries, What’s Next For Gemini AI Predicts?
The chart shows a market well past its highs. Bitcoin peaked near $126,000 last October before the trend gave way.
November dragged the price down from $116,000 toward $82,000. A December recovery reached $98,000 and failed.
February brought the capitulation move to roughly $59,000. Spring rebuilt strongly toward $83,000 by May.
June erased that again, marking the low near $58,000. July recovered to the mid-$60s before stalling.
The close reads $62,964, down 0.72% and $454 on the session. The daily range covered $62,879 to $63,553.
Support sits at $62,000, then $58,000 and $55,000, as the line Gemini flags. Resistance appears at $66,000, then $70,000 and $76,000.
RSI reads 42.74 with its signal line above at 48.99. The oscillator trails by more than 6 points, showing momentum rolling over after the July bounce.
Both readings sit below the midline. Sellers have regained the edge in the short term.
Gemini’s base case needs roughly 46% from here. Holding $58,000 is what keeps that conversation alive at all.
Trade Ethereum on Bybit and Get a Chance to Win Our $1,000 USDT Airdrop
Bitcoin Needs Corporate Buyers. LiquidChain Needs Far Less Capital to Move
Bitcoin’s path to $95,000 depends on increasingly large pools of capital continuing to absorb supply. That works at scale, but it also means every new leg higher requires billions more to make a visible difference.
LiquidChain sits at the opposite end of that equation.
The project is building a single execution layer across Bitcoin, Ethereum, and Solana, targeting one of DeFi’s most persistent problems: liquidity and applications trapped inside separate ecosystems. Instead of forcing users to go through repeated bridges, fees, and fragmented deployments, LiquidChain is designed so that a single deployment can reach all 3 networks.
At a presale price of $0.01454 with just over $938,000 raised, it does not need Bitcoin-sized inflows to reprice dramatically. That is the asymmetry: infrastructure solving a real multi-chain problem while the market cap is still small enough for early capital to matter.
Explore the LiquidChain Presale
The post Google Gemini AI Predicts Bitcoin Price by the End of 2026 appeared first on Cryptonews.

UK Reform leader Nigel Farage is facing an ongoing probe by the UK Parliamentary Commissioner for Standards over an alleged failure to register certain financial interests tied to crypto-linked donations. The investigation, shown on the Commissioner’s website as of Friday, was briefly paused after Farage resigned his seat following his July exit from Parliament, but restarted after his return as Member of Parliament for Clacton.
According to the Parliamentary Commissioner for Standards’ public register of allegations currently under investigation, the concern centers on whether Farage properly disclosed interests related to receiving millions of dollars’ worth of donations and gifts connected to two figures in the crypto sphere. The scrutiny could carry consequences under UK parliamentary rules, including potential suspension from Parliament.
Key takeaways
- Farage is under investigation for “failure to register an interest,” according to the UK Parliamentary Commissioner for Standards.
- The probe relates to crypto-linked giving from Christopher Harborne, described in reporting as worth $6.7 million, and to funding connected to Farage’s staff and security.
- Under UK rules, MPs must register current interests within a month of election and disclose relevant benefits received in the prior 12 months.
- If the investigation finds a breach, Farage could face suspension—potentially triggering another by-election.
- The political fallout has also reignited UK discussions about whether to restrict “crypto gifts” to prevent possible foreign influence.
Why the standards investigation is back on
The Parliamentary Commissioner for Standards’ allegations page currently lists Farage as being investigated for failing to register an interest tied to donations and gifts from individuals connected to the crypto industry. The investigation had been halted in July after Farage resigned from Parliament—an action that followed earlier reporting on the donation controversy—before resuming after he was reelected as MP for Clacton.
Farage’s return came after a by-election in which he secured a commanding victory. Earlier coverage of the July by-election reported he won with 63% of the vote, defeating satirical candidate Count Binface’s 27%, and that none of the other major parties participated in the race.
What the probe is expected to examine
While the standards record frames the issue as a failure to register an interest, the substance of the inquiry is tied to specific arrangements and the timing of disclosure.
The Commissioner’s listing—alongside related reporting—points to the alleged gifts and benefits potentially received by Farage and his operations. Reporting cited in the article states the probe will consider:
- Crypto billionaire Christopher Harborne giving Farage $6.7 million.
- Farage’s staff and security being funded by George Cottrell, described in reporting as a convicted fraudster tied to a crypto casino.
The relevant UK framework requires newly elected MPs to register financial interests within one month of their election. They are also expected to report benefits received in the 12 months preceding their election.
Farage’s stated characterization of the gifts
The underlying dispute is not only about whether the interests were disclosed, but how they were described and treated under parliamentary expectations. Reporting referenced in the source article notes that Farage initially characterized Cottrell’s donation as a “reward” for campaigning related to Brexit and later referred to both men’s contributions as “gifts” provided “on an unconditional basis.”
Those descriptions may matter because the standards process focuses on registration obligations rather than intent alone. The central question for the Commissioner will be whether the benefits required disclosure were entered into the register correctly and within the required timeframe.
Potential parliamentary consequences
If the investigation concludes that Farage breached parliamentary rules, the sanctions can be significant. The possible outcome highlighted in the reporting includes suspension from Parliament, which would likely trigger another by-election.
Cointelegraph attempted to obtain comment from the Parliamentary Commissioner for Standards on the probe but did not receive an immediate response.
Beyond Farage personally, the case also underscores the scrutiny UK lawmakers face around political donations and gifts—particularly when the money originates from complex, cross-border financial ecosystems that include crypto businesses.
Broader pressure to tighten crypto donation rules
The investigation has arrived amid renewed policy debate inside the UK. The source article states that Labour lawmakers have reportedly proposed making a previously discussed moratorium on crypto donations permanent—originally linked to measures announced in March—to address concerns about the potential influence of foreign actors.
That discussion is set against guidance referenced from the International Bar Association. According to the source, unincorporated associations are allowed to give more than $675 directly to UK politicians, a structure that the IBA has described as creating a potential loophole. The concern, as characterized in the reporting, is that such arrangements could be used as conduits for “foreign or dark money.”
Whether any new rules ultimately address the issues raised by the Farage investigation may depend on how regulators and lawmakers define “crypto gifts,” determine how they should be valued, and decide which entities must be considered when mapping beneficial ownership and control behind donations.
For investors, builders, and users watching UK policy, the next step is the standards investigation’s findings: what the Commissioner decides about disclosure timing, the classification of benefits as registrable interests, and whether this case drives faster regulatory action on crypto donations. Until the probe reaches a conclusion, the practical uncertainty is likely to remain—both for individual politicians and for the wider political fundraising rules that govern crypto-linked money.
Inner Circle Trading (ICT) is a price-action methodology developed by Michael J. Huddleston, also known as the Inner Circle Trader. It explains market behaviour through concepts such as liquidity, market structure, order blocks, fair value gaps, and trading session timing. Traders use them to analyse price movements from an institutional perspective. Although ICT trading is most commonly associated with the forex market, the methodology is also applied to indices, commodities, and other financial instruments.
This article explains the core ICT concepts, how they fit together, and how traders use them to develop market bias, identify potential liquidity targets, and analyse price action across different market conditions.
Key Takeaways
- ICT explains market movement through institutional behaviour, focusing on liquidity, structure, and order flow rather than indicators.
- The Inner Circle Trading method is used across forex, indices, and commodities on intraday and higher timeframes to interpret how major players influence price.
- Core ICT concepts include Break of Structure (BOS), Change of Character (CHoCH), Market Structure Shift (MSS), liquidity pools, order blocks, fair value gaps, optimal trade entries, and kill zones.
- ICT shows how price targets liquidity, reacts to imbalances, and shifts momentum, giving traders a clearer narrative of market intent.
- The framework combines structure, timing, and context, making it a detailed but discretionary approach to analysing market movement.
- The ICT methodology is not a mechanical strategy. It relies on discretionary analysis rather than fixed rules.
What Is ICT in Trading?
ICT, or Inner Circle Trading, is a price-based methodology developed by Michael J. Huddleston that offers a way to read institutional behaviour in the markets. It focuses on identifying where banks and large funds, the so-called “smart money,” enter, exit, and target liquidity. Traders use ICT across forex, indices, and commodities, mainly on intraday charts like the one-minute to one-hour, as well as higher timeframes when building directional bias.
The approach breaks price into structure, liquidity, and imbalance. It teaches traders to spot where the market takes stops, when momentum shifts, and where price often returns before moving again. Rather than relying on indicators, ICT centres on raw price action and the recurring patterns created by institutional order flow. This makes it a structured way to analyse short- and medium-term movements.
ICT is one interpretation of smart money concepts (SMC) rather than the whole field. Other institutional order-flow approaches exist and use different terms for similar ideas. What separates ICT is its specific vocabulary and its focus on when liquidity enters the market, not only where.
Who Developed ICT?
Inner Circle Trading was created by Michael J. Huddleston, widely known as “The Inner Circle Trader.” He is an online educator who built a large following by teaching institutional-style price action.
The abbreviation ICT refers to two things. It names Huddleston himself, and it names the body of concepts he teaches. When traders say they follow ICT, they usually mean the methodology rather than the person.
His public lessons shaped much of the terminology traders now associate with the Inner Circle Trader methodology, including order blocks, liquidity grabs, and kill zones.
How Do ICT and Smart Money Concepts Differ?
Smart money concepts is the broader term. It covers any approach that reads price through institutional order flow, including work by educators with no connection to Huddleston. ICT sits inside that category as one version of it, with its own vocabulary and its own sequence of analysis.
The two share most of their core ideas. Both read market structure, both treat liquidity as a target rather than a by-product, and both look for imbalances left behind by fast moves. The differences sit in the detail. The ICT methodology adds session timing through kill zones, defined entry models such as optimal trade entry, and terms like inducement and displacement that general SMC material often leaves out.
Traders frequently treat the two labels as identical. They are not. ICT is one branch of SMC, so ICT ideas are smart money ideas, while the reverse does not hold.
ICT vs Smart Money Concepts at a glance:
How Do ICT Concepts Differ From Traditional Technical Analysis?
Inner Circle Trading differs from traditional technical analysis because it focuses on reading institutional order flow rather than reacting to indicators. The approach strips charts back to structure, liquidity, and imbalance, giving traders a more price-driven way to analyse markets.
Traditional technical analysis tends to start with a tool, such as a moving average or an oscillator, and read price through it. Institutional trading concepts start with price itself and ask which levels large participants are likely to be working towards.
The main differences include:
- Focus on liquidity: ICT centres on where stop orders sit and how the market seeks them, while technical analysis relies on indicators or pattern recognition.
- Institutional logic: ICT frames moves as deliberate actions by large players. Traditional analysis often treats price swings as neutral or random.
- Market structure detail: ICT breaks trends into Break of Structure (BOS), Change of Character (CHoCH), Market Structure Shift (MSS), offering a tighter read on shifts in momentum than generic swing-high/swing-low analysis.
- Imbalance and displacement: Inner Circle Trading highlights rapid moves and Fair Value Gaps as signals of strength, whereas standard approaches often minimise the relevance of these gaps.
- Time-based context: ICT uses kill zones to track when liquidity enters the market, while technical analysis rarely factors in session timing.
What Are the Main ICT Trading Concepts?
Inner Circle Trading concepts are a group of price-action tools that explain how institutional traders move the market. They cover structure, which includes ideas like Break of Structure (BOS), a Change of Character (CHoCH), liquidity through pools, sweeps, and engineering, and order blocks that show where major players commit orders. It also works with fair value gaps, optimal trade entries built from retracements, and kill zones linked to specific trading sessions. Together, these concepts offer a clear framework for reading intraday and higher-time-frame behaviour.
The sections below group these ICT trading concepts into four blocks: structure, order blocks, liquidity, and imbalance, followed by the timing and entry tools that sit alongside them. To understand them, you can consider following along in FXOpen’s TickTrader platform.
1.Structure
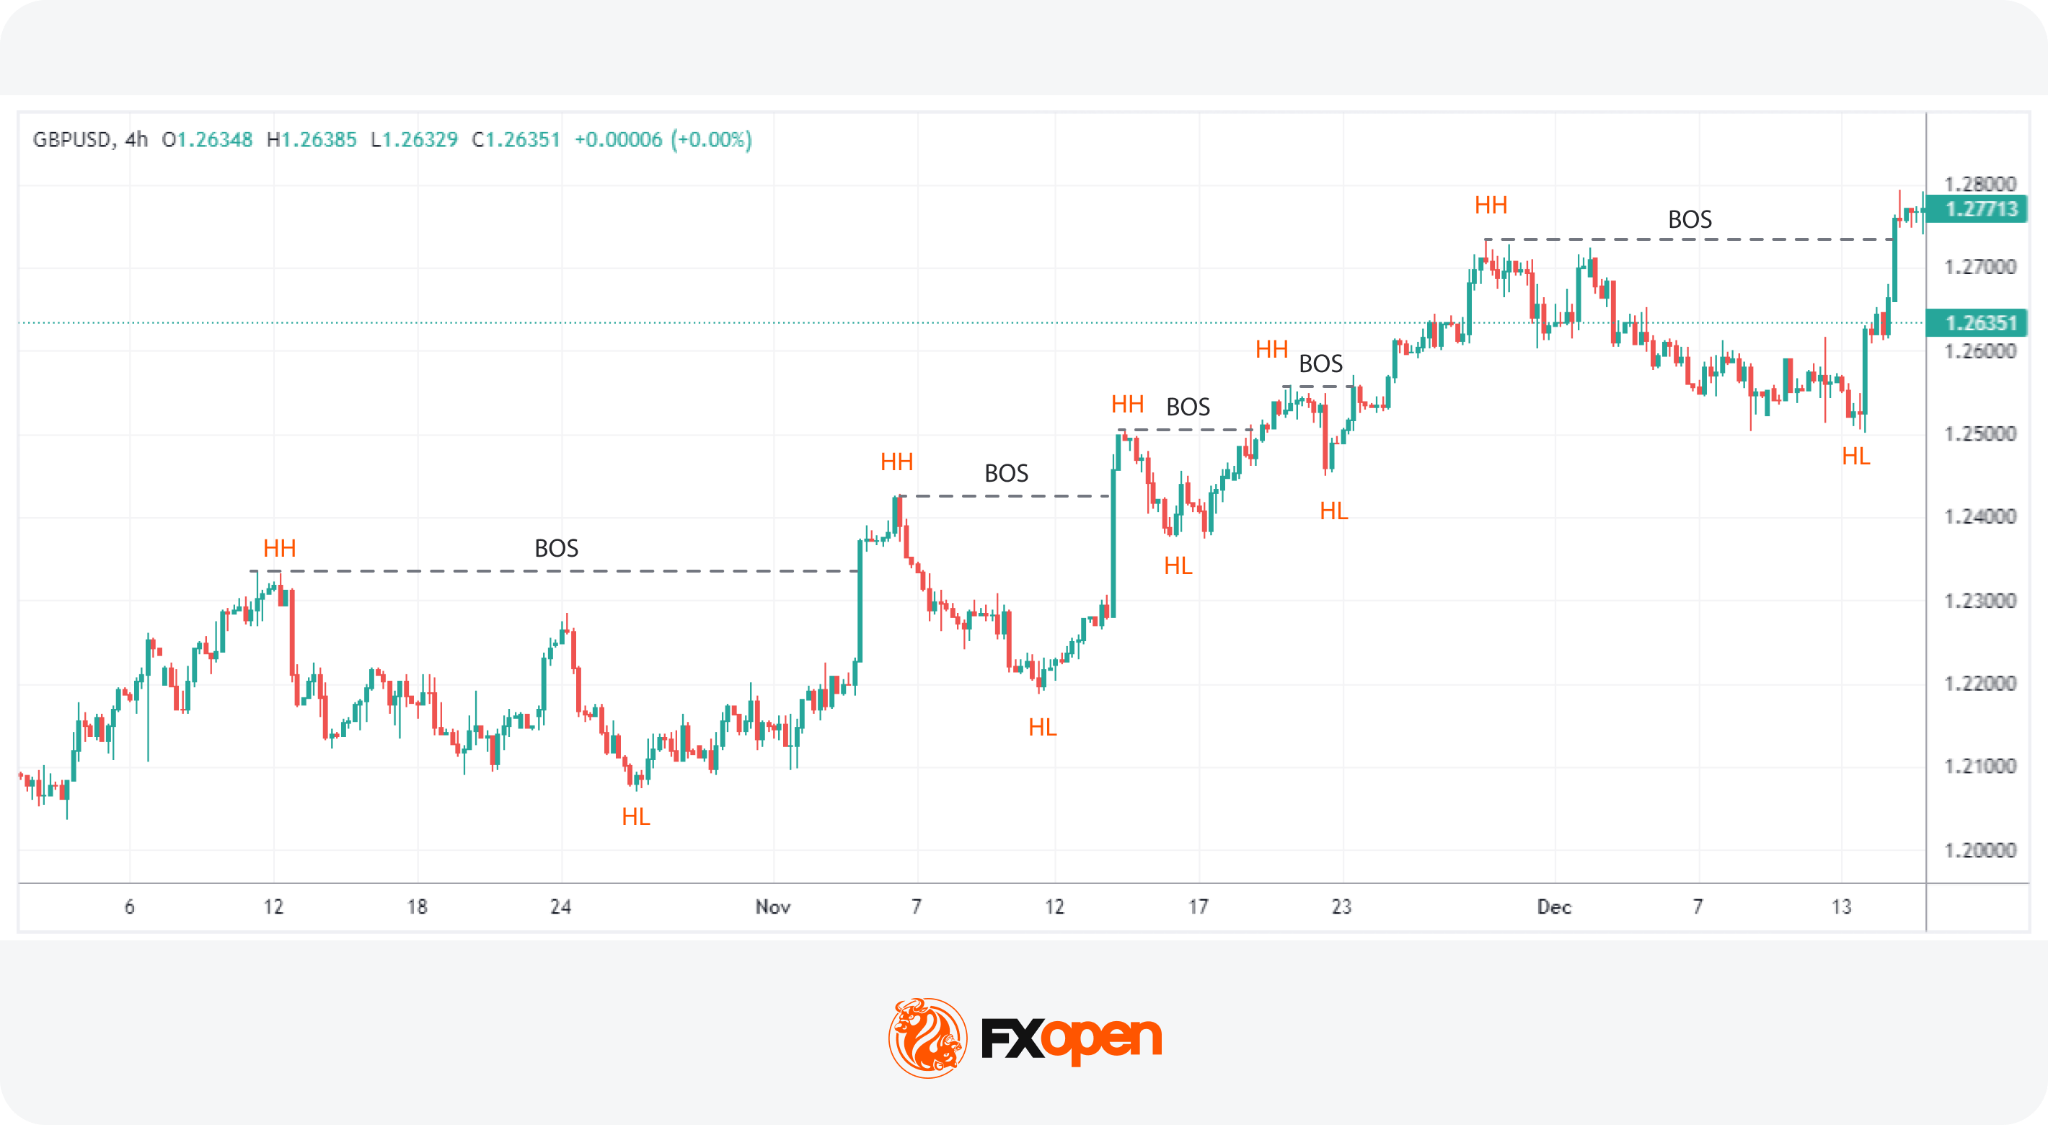
In the context of ICT, market structure is based on the idea that market direction can be identified through patterns of highs and lows. Within market structure, key structural events are split into distinct movements: a Break of Structure (BOS), a Change of Character (CHoCH), and a Market Structure Shift (MSS).
Market Structure
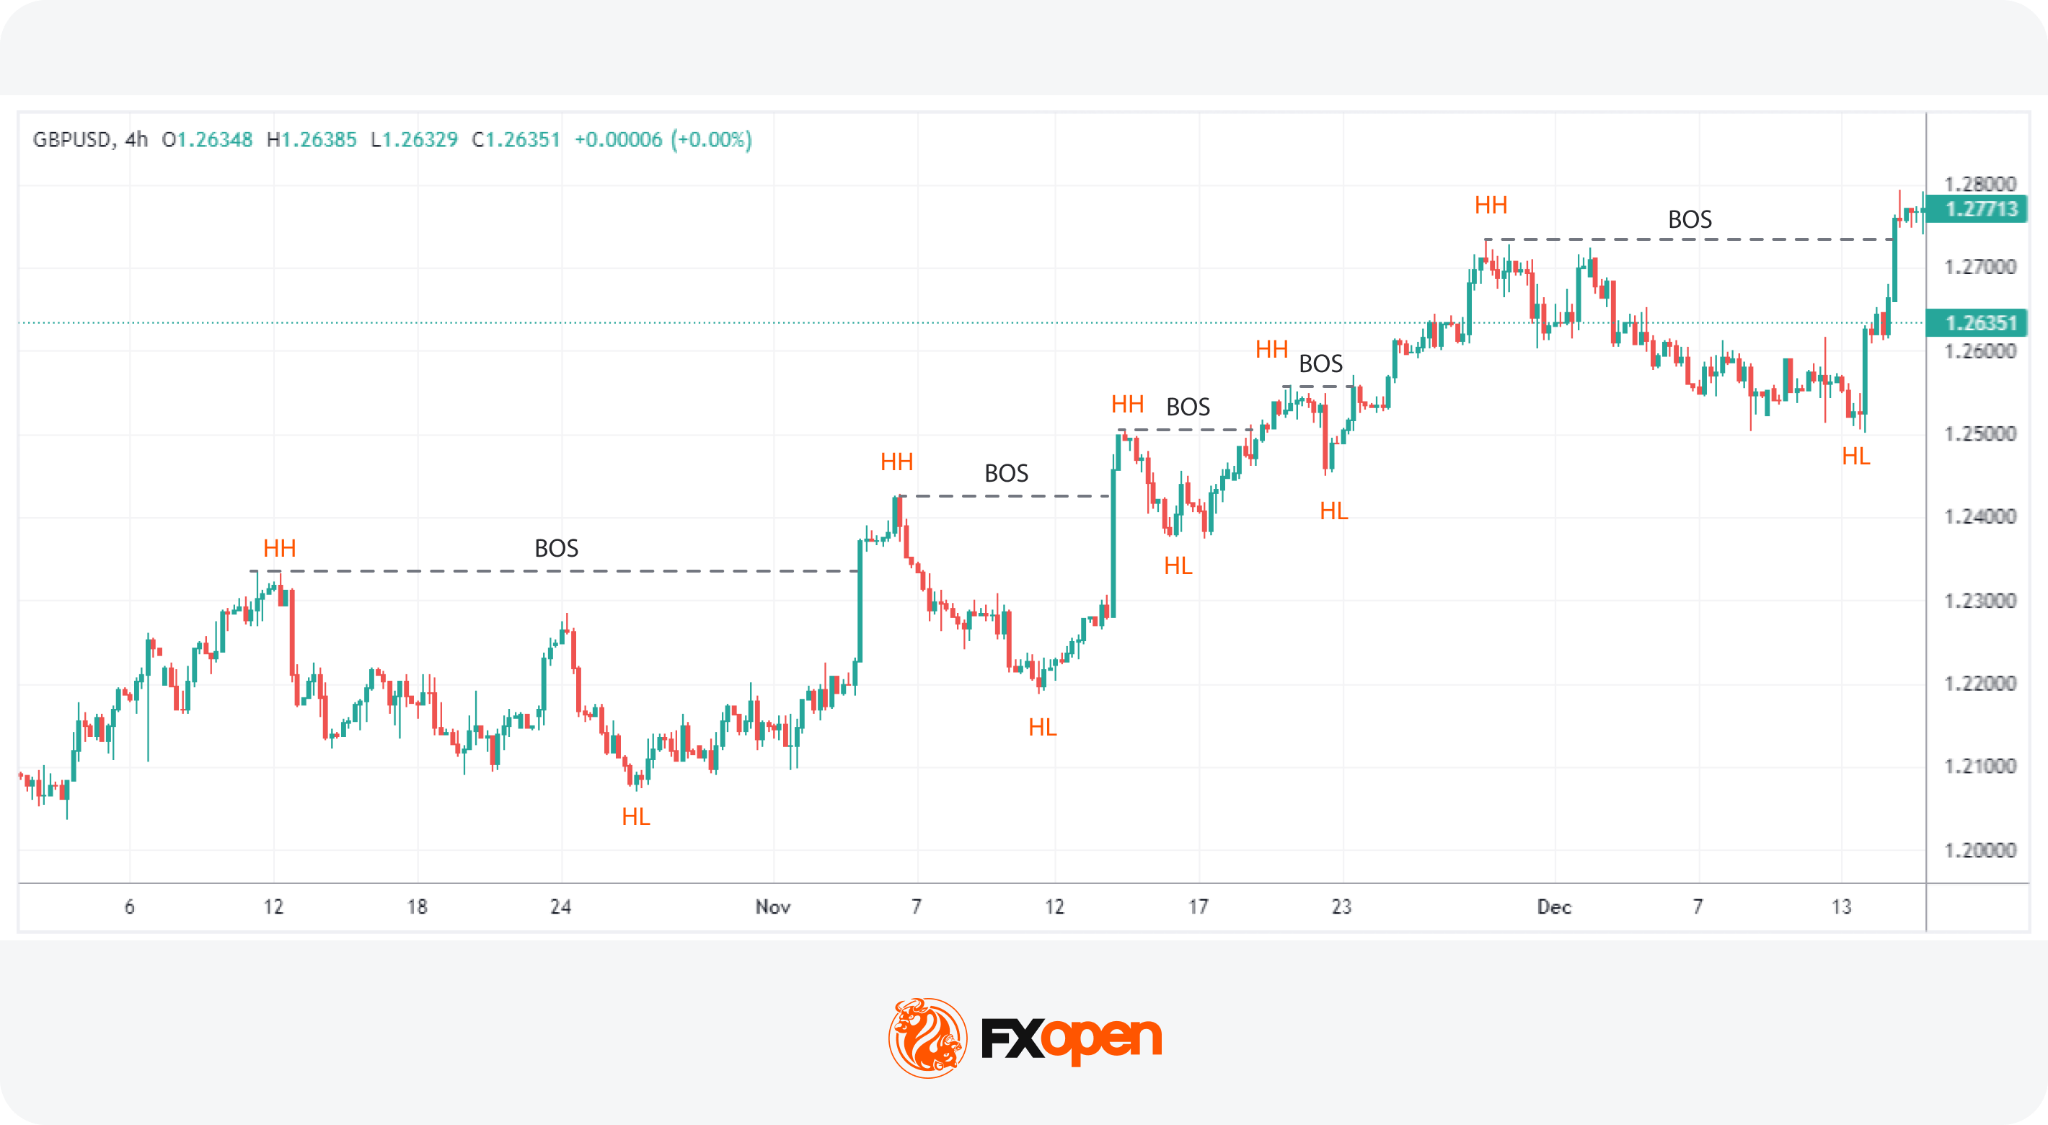
Market structure describes how price moves through a sequence of highs and lows. It shows whether the market trends up, trends down, or ranges, and gives traders a clear view of the current direction. In ICT, structure forms the foundation for reading intent behind price movements and deciding when a trend strengthens, weakens, or begins to reverse.
Specifically, structure is characterised by a series of higher highs and higher lows in an uptrend, or lower highs and lower lows in a downtrend.
For example, EUR/USD rises to 1.0850, pulls back to 1.0800, then pushes on to 1.0920 before dipping to 1.0870. Each high and each low sits above the one before it, so the structure stays bullish. That reading holds until the price closes below 1.0800.
Structure is also fractal, which means a downtrend on a 15-minute chart can be a single pullback inside a daily uptrend. Reading ICT market structure on more than one timeframe keeps that context visible, which is why traders often check the higher timeframe before acting on a lower one.
Break of Structure (BOS)
A Break of Structure (BOS) is a concept that confirms the continuation of the current market direction. It occurs when price moves beyond a key swing point that defines the current trend.
- Bullish BOS appears in an uptrend, when a candle moves above the most recent swing high while the prior swing low remains intact.
- Bearish BOS occurs in a downtrend, when a candle drops below the most recent swing low while the prior swing high holds.
An ICT BOS points to trend continuation, so it tells traders the existing direction is still intact rather than warning of a turn. Traders looking for signs of trend reversal watch for a Change of Character instead, which breaks the swing point on the opposite side of the move.
Change of Character (CHoCH)
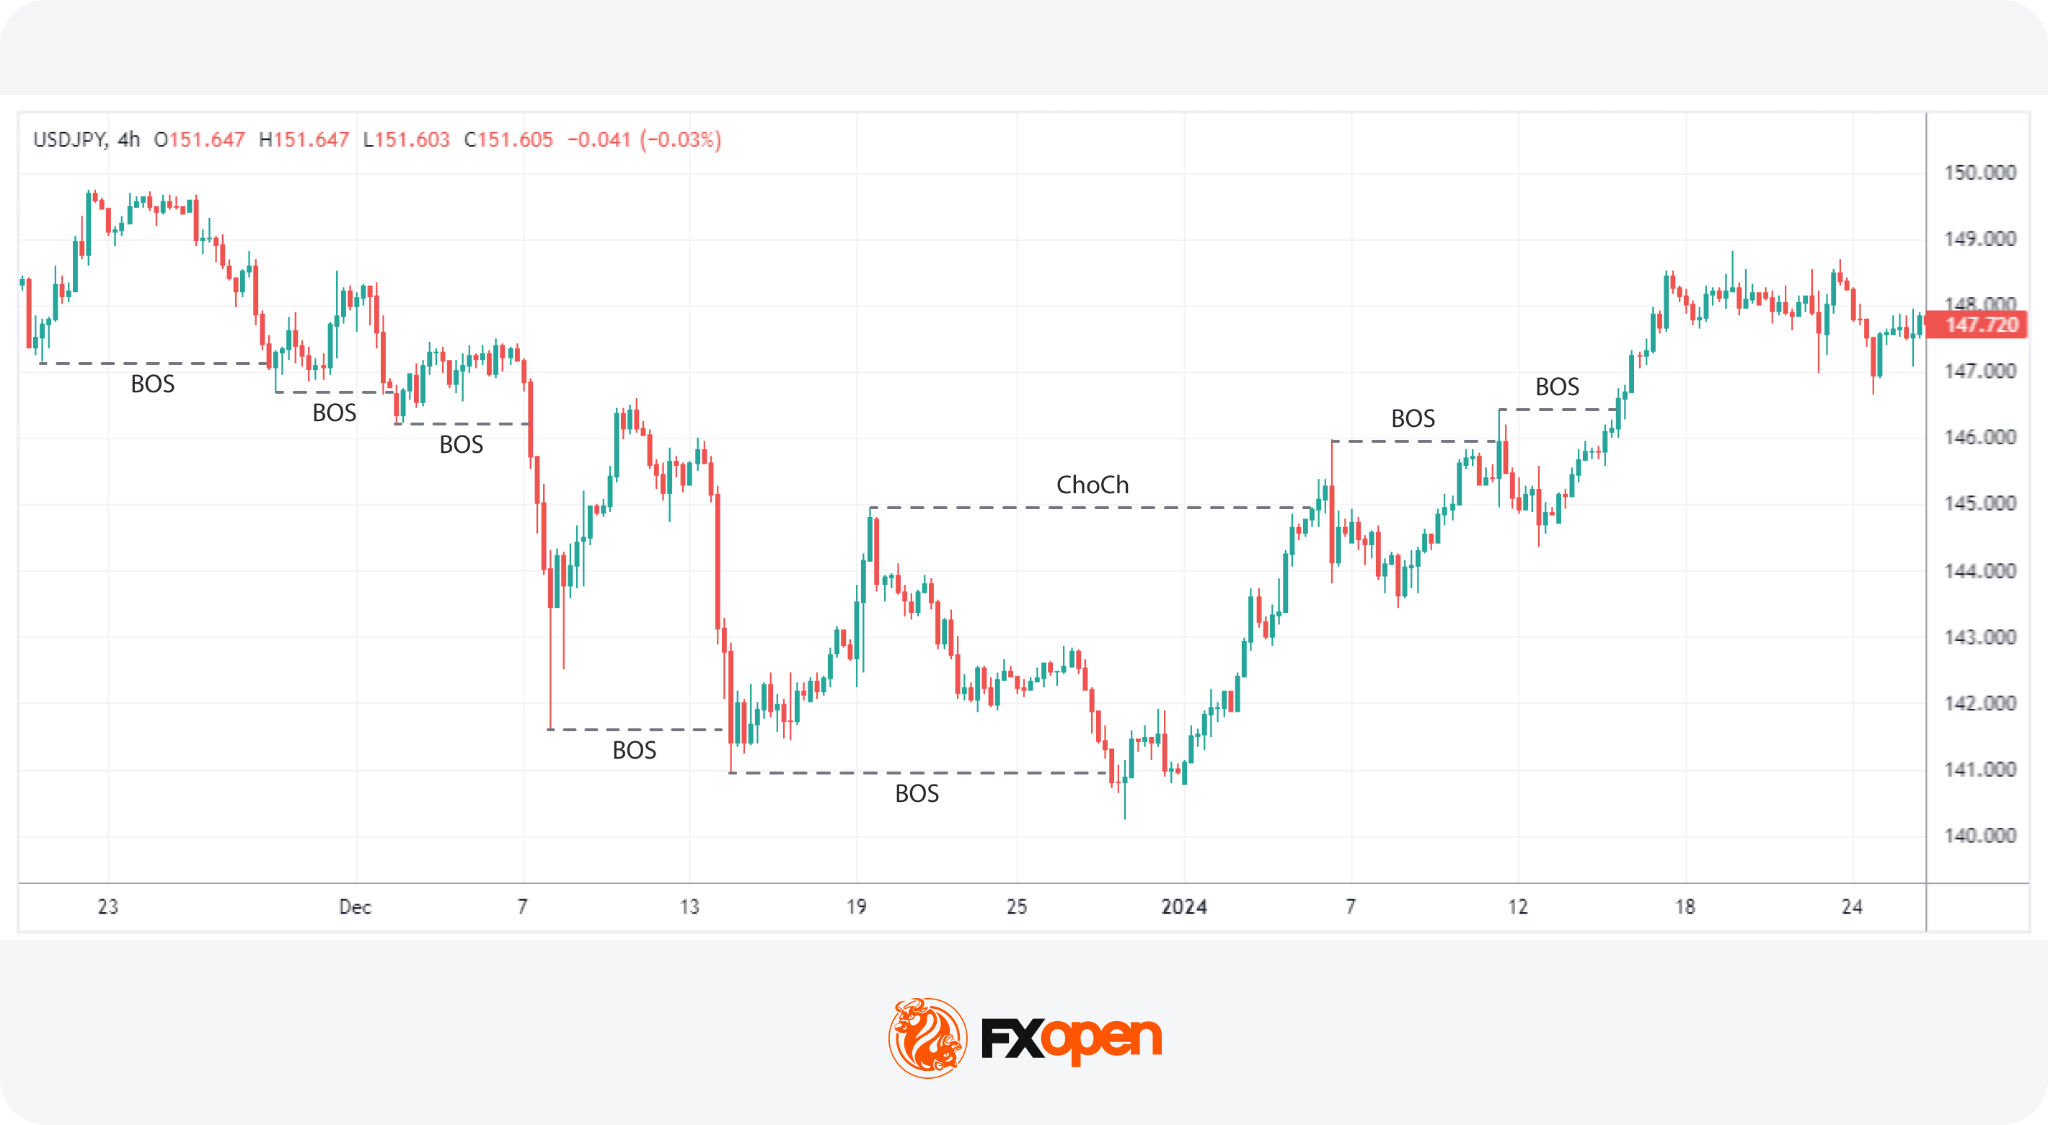
A Change of Character concept reflects a possible trend change. It occurs when price violates the swing point that protects the current trend, signalling the first meaningful shift in control. In an uptrend, a CHoCH forms when price fails to set a new high and then closes below the most recent swing low that previously held the trend. In a downtrend, it forms when price fails to create a fresh low and then closes above the most recent protective swing high.
An ICT CHoCH on its own does not confirm a reversal. It marks the first crack in the existing structure, and price often reclaims the level and continues in the original direction. Traders typically wait for follow-through, such as strong displacement that breaks a key structural level, before treating the shift as established.
Market Structure Shift (MSS)
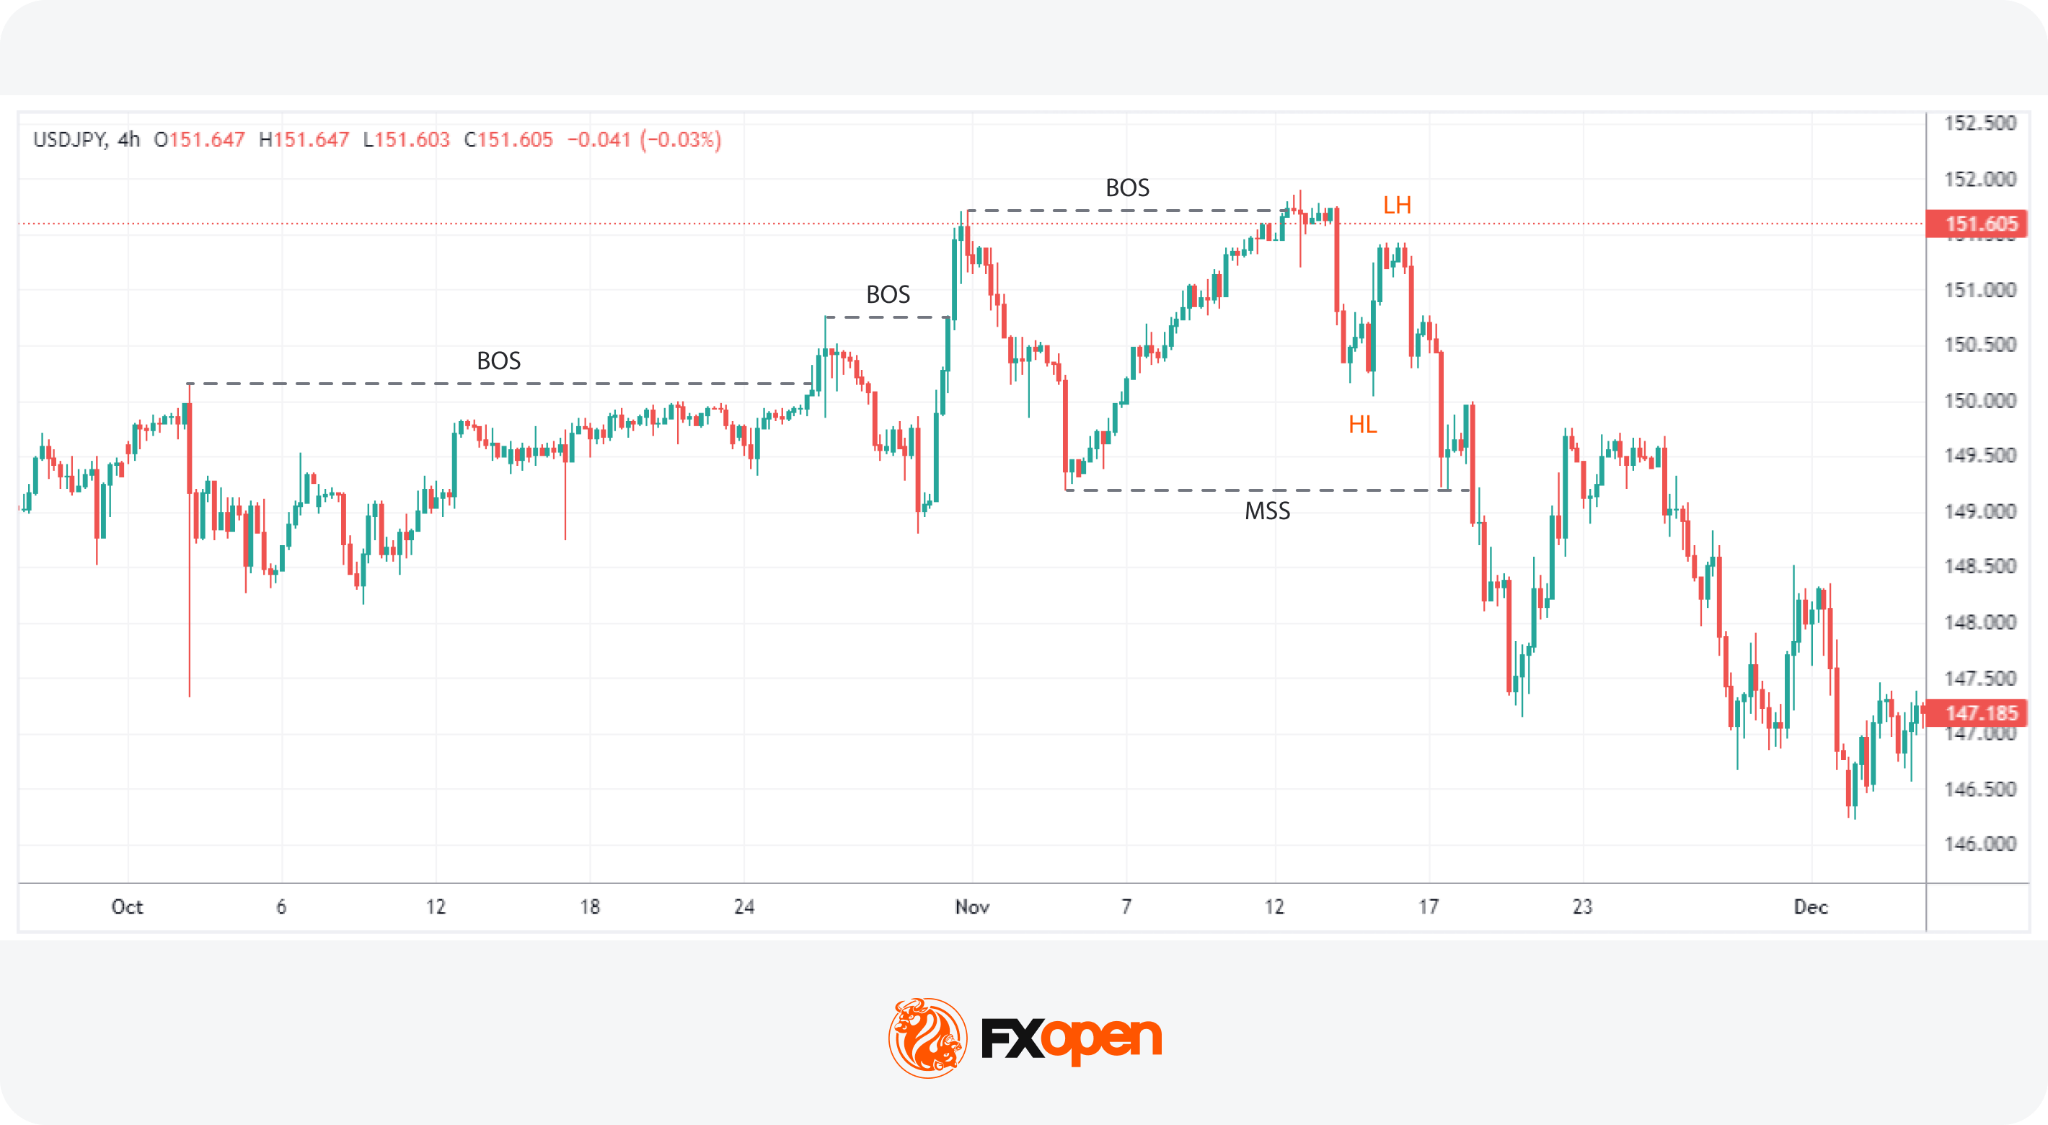
A Market Structure Shift is a significant change in the market that can disrupt the existing trend. This specific type of CHoCH is typically marked by a price moving sharply (a displacement) through a key structural level, such as a higher low in an uptrend or a lower high in a downtrend.
An ICT MSS differs from a CHoCH in how the level breaks rather than which level breaks. A CHoCH can form on a slow drift through the protective swing point, while an MSS requires a decisive move, often leaving an imbalance behind it.
These shifts can signal a profound change in market dynamics, with the sharp move often preceding a new sustained trend. Recognising an MSS allows traders to reevaluate their current bias and adapt to a new trend, given its clear signal.
2. Order Blocks
ICT order block meaning relates to a price area associated with the final buying or selling activity before a strong directional move. In ICT analysis, traders monitor these areas because price may later return to them and react.
There are a few different types of order blocks to be aware of: regular order blocks, breaker blocks, and mitigation blocks.
Regular Order Blocks
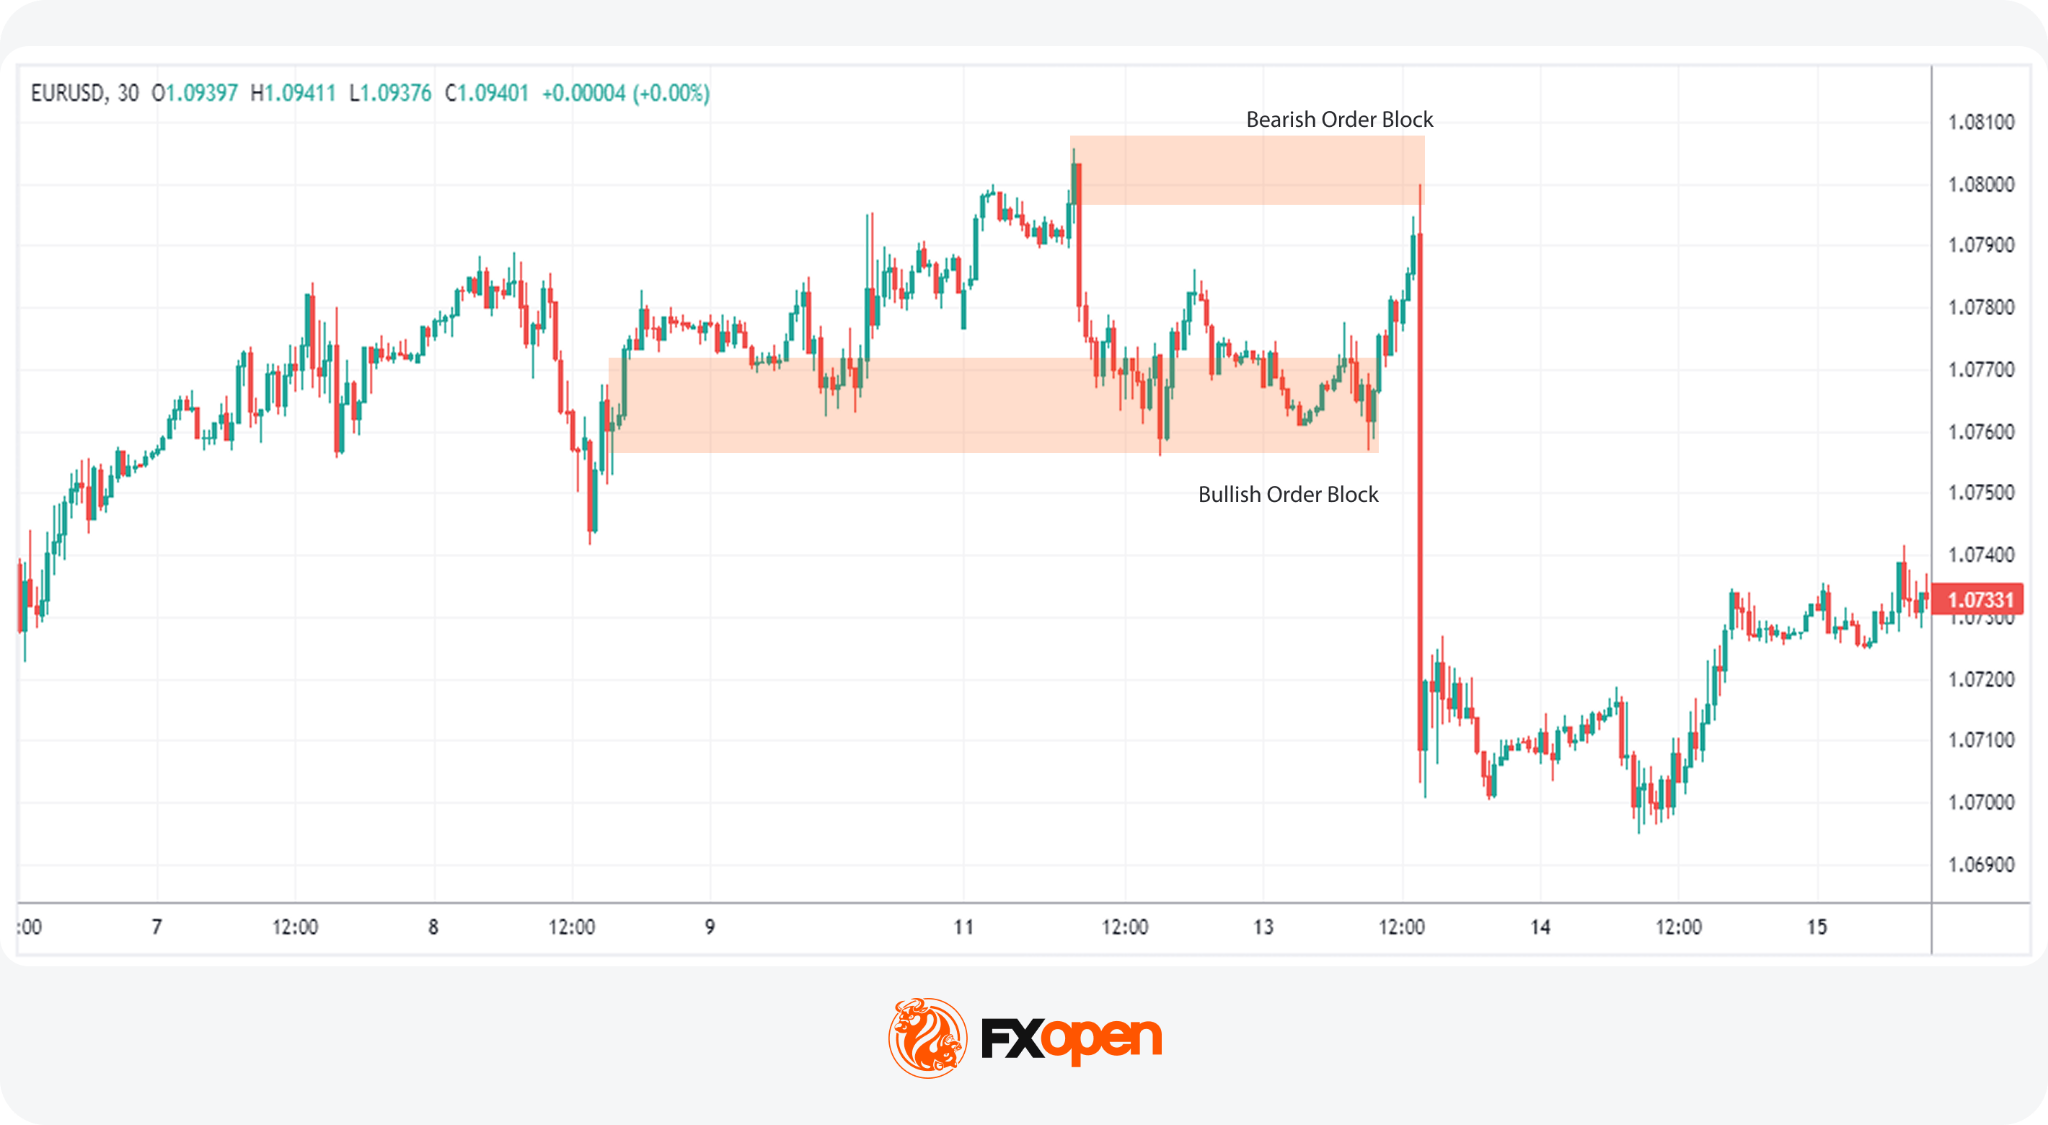
A regular ICT order block is an area on the price chart representing a concentration of buying (demand zone) or selling (supply zone) activity.
A bullish order block typically forms around the last bearish candle or price area before a strong move higher, while a bearish order block forms around the last bullish candle or area before a strong move lower. Depending on the existing market structure, the subsequent move may either continue the prevailing trend or contribute to a structural shift.
In the ICT trading strategy, order blocks are treated as potential reaction areas. In an established uptrend, for example, a bullish order block may form during a retracement before price moves higher and produces a bullish Break of Structure (BOS). If price later retraces into that order block, traders may monitor the area for a bullish reaction and potential continuation of the existing trend.
Conversely, in an established downtrend, a bearish order block may form during a retracement before price moves lower and produces a bearish Break of Structure (BOS). If price later retraces into that order block, traders may monitor the area for a bearish reaction and potential continuation of the existing trend.
Breaker Blocks
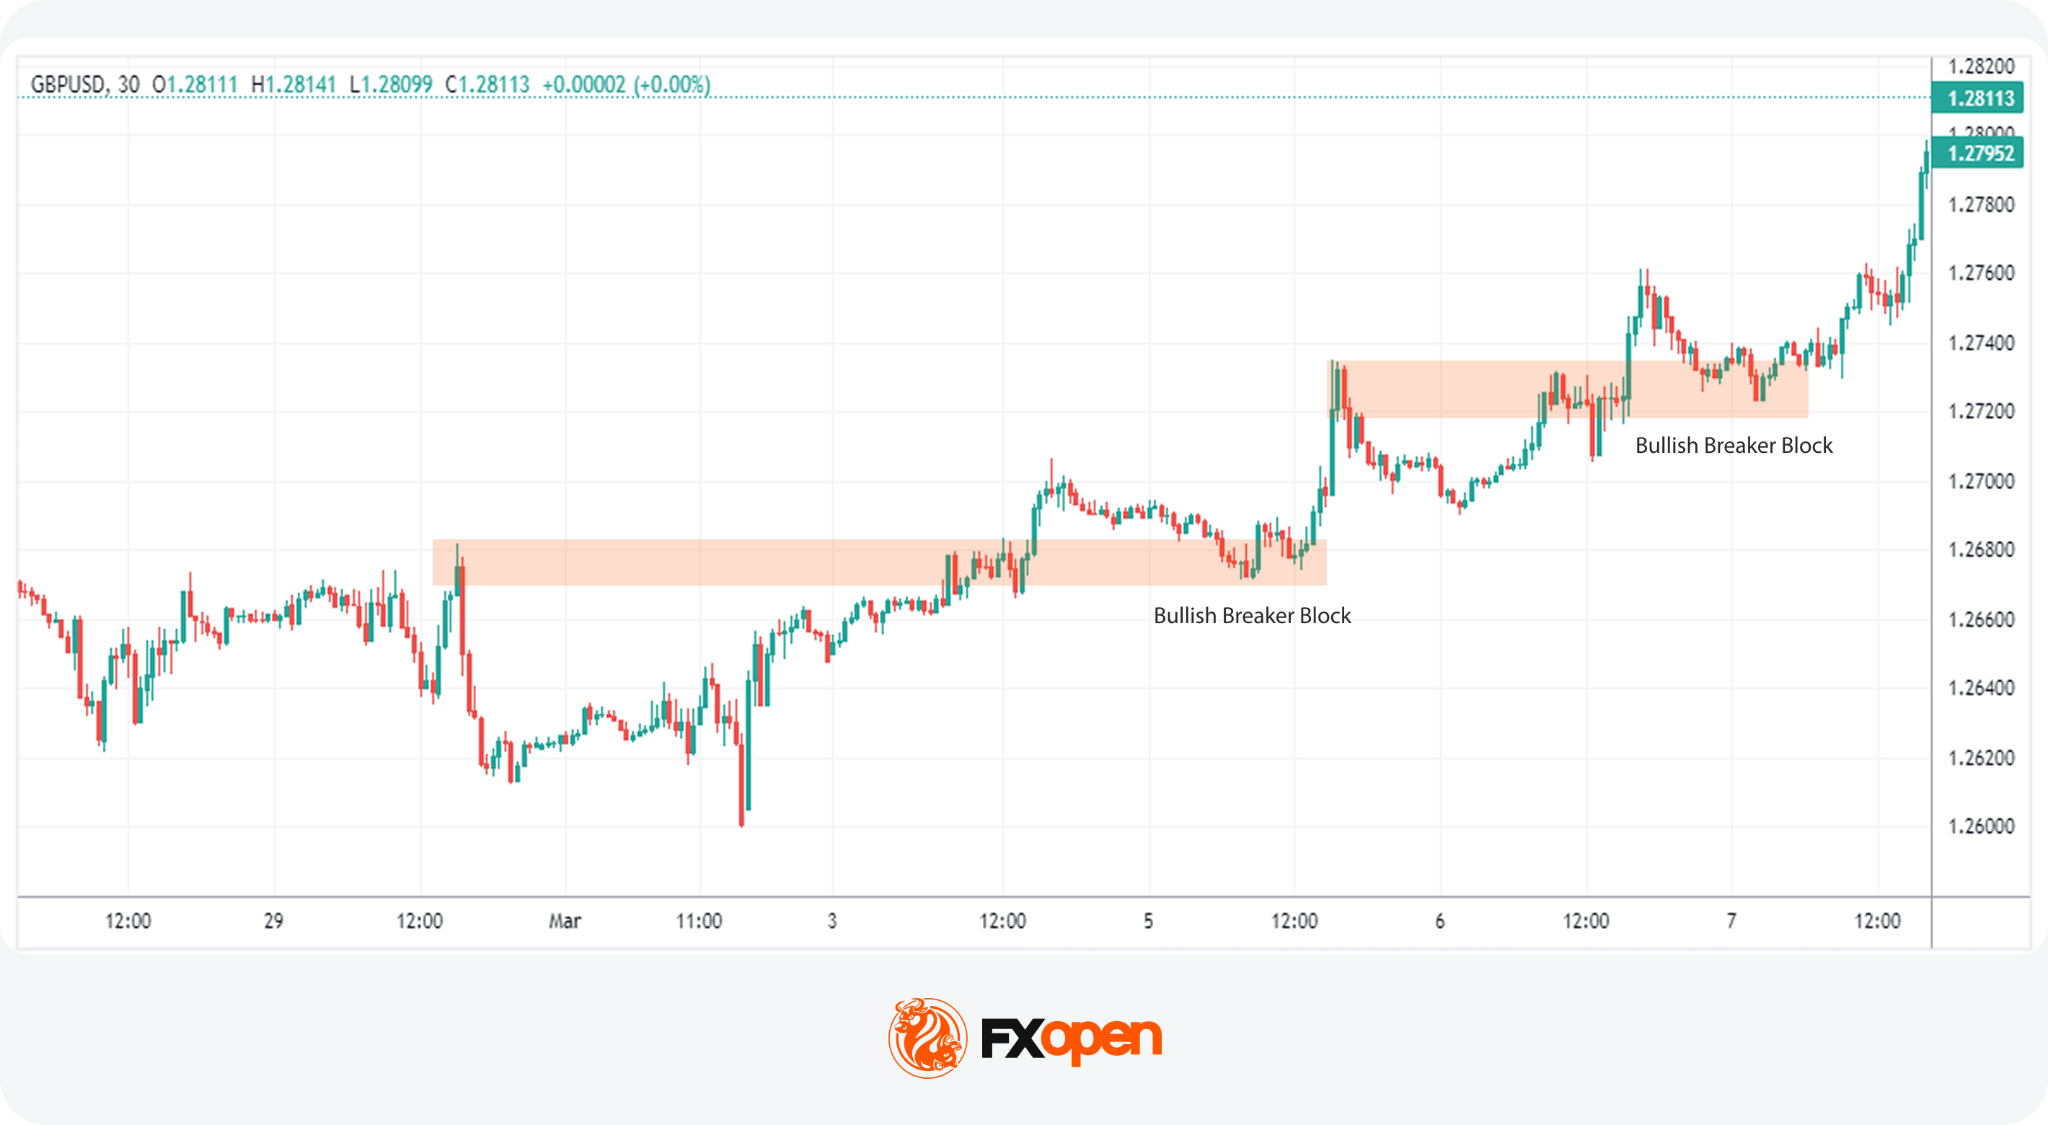
A breaker block forms when price invalidates an order block that should have held if the trend remained intact. This formation indicates that liquidity has been taken (fueling the movement through the order block) and that the trend is likely shifting.
For instance, in an uptrend, if the price creates a new high but then reverses below the previous higher low, the bullish order block above the low becomes a breaker block. Price often returns to that zone afterwards, and traders watch how it reacts there as the new direction develops.
Mitigation Blocks
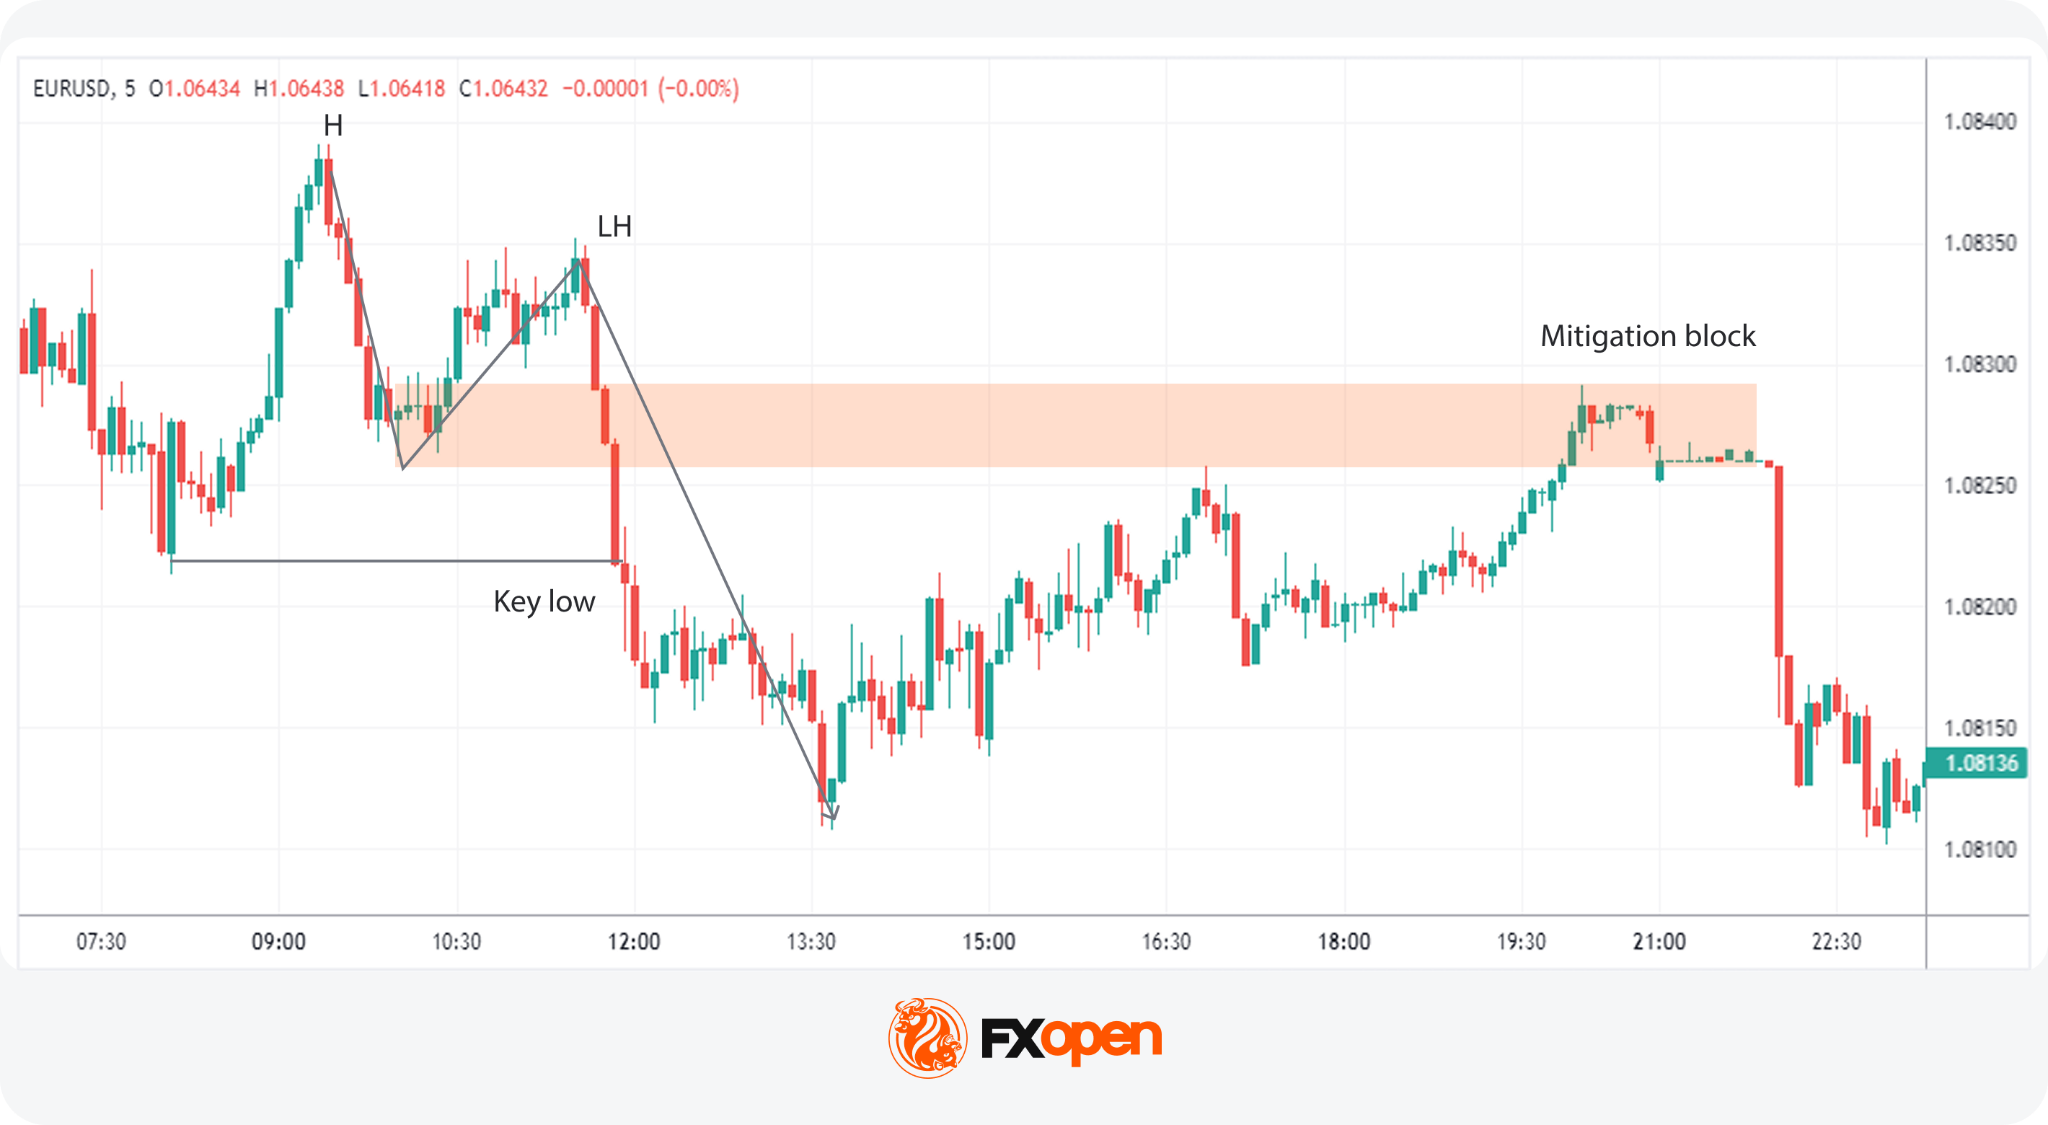
A mitigation block appears when institutional players place orders to offset (“mitigate”) losses from an earlier position that moved against them.
The sequence runs in three parts. A strong displacement moves price away from a level, a counter-move brings price back to where that displacement began, and institutions use the revisit to close out the earlier losing position and re-enter in the direction of the original move.
A bullish mitigation block is the last down candle before a strong upward displacement. A bearish one is the last up candle before a strong downward move, as in the example above. When price returns and reacts from that candle, ICT traders read it as the original order flow resuming.
3.Liquidity
Liquidity refers to areas on the price chart with a high concentration of trading activity, typically marked by stop orders. ICT liquidity concepts include: buy- and sell-side liquidity, liquidity grabs, and inducements.
Buy-Side and Sell-Side Liquidity
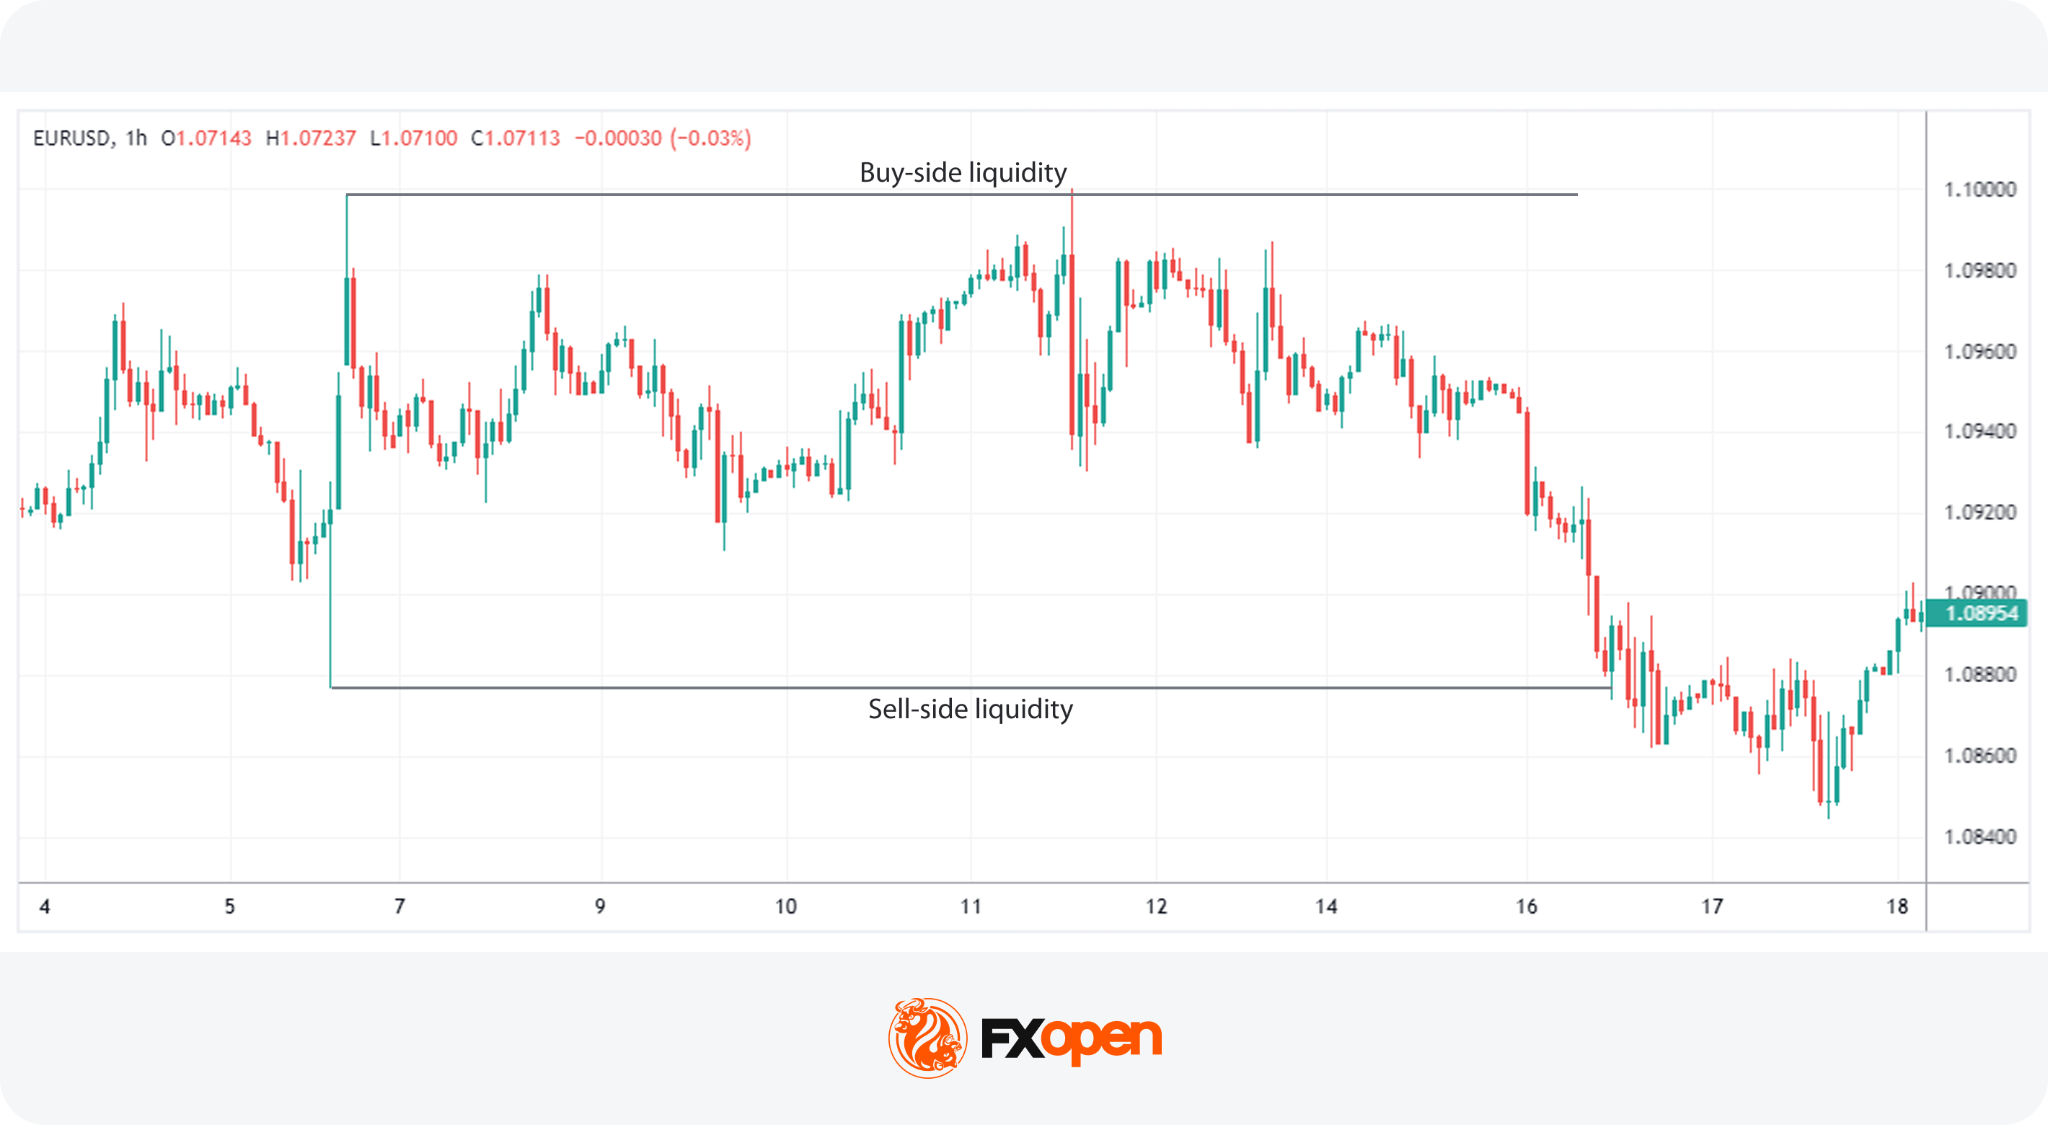
Buy-side liquidity is typically found above recent or equal highs, where stop-loss orders from short positions and breakout buy orders may cluster. When triggered, these orders can add buying pressure. Sell-side liquidity works inversely, with sell orders typically clustering below recent or equal lows.
In ICT analysis, if price moves beyond a high or low to take liquidity but quickly returns within the previous range, the move may be interpreted as a liquidity sweep and a potential reversal signal.
For example, if EUR/USD repeatedly fails to break 1.1500, buy-side liquidity may build above this level. Price may rise above 1.1500, trigger buy orders, and then fall back below it. ICT traders may interpret this rejection as a sweep of buy-side liquidity and watch for signs of a bearish reversal.
Liquidity Grabs
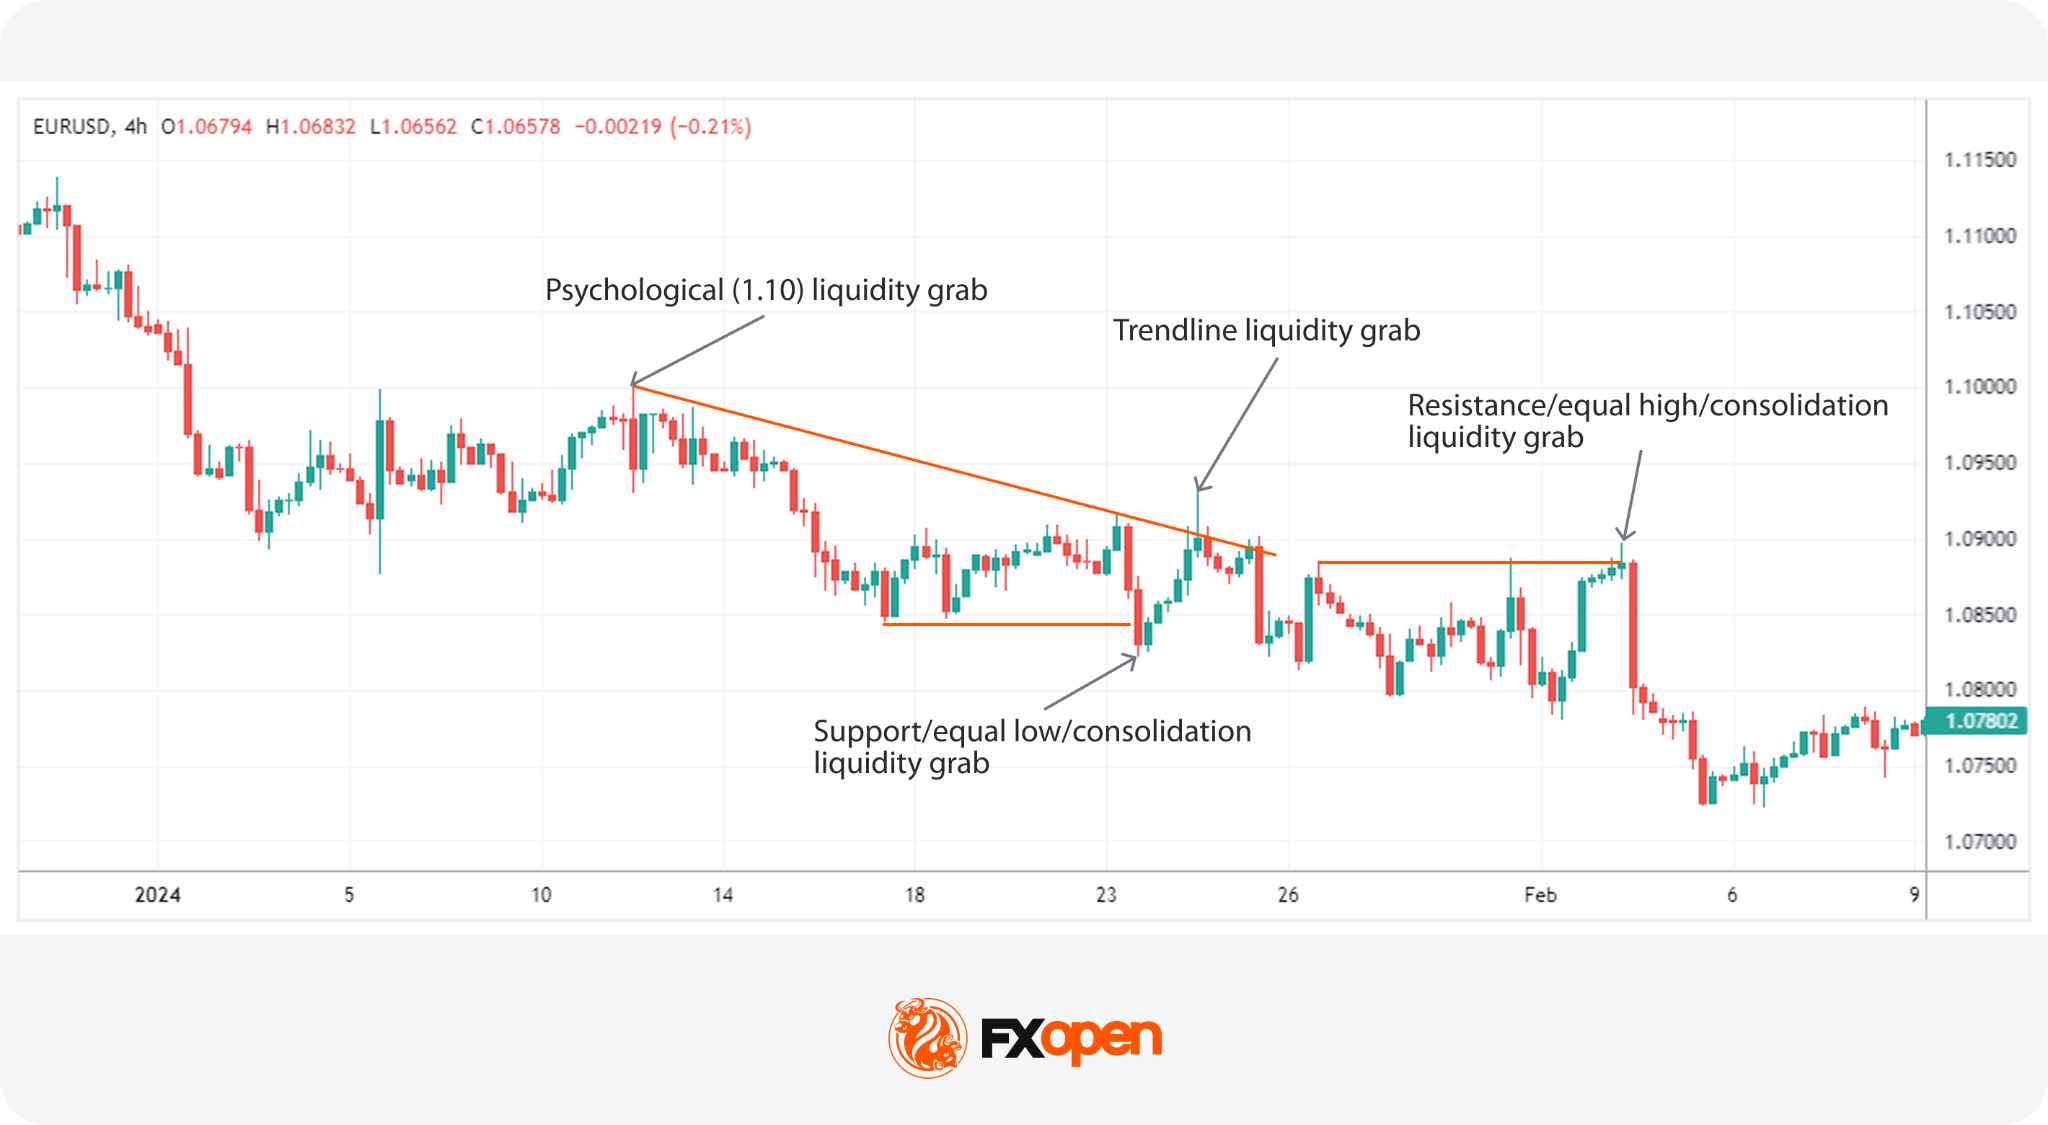
A liquidity grab occurs when the price quickly spikes into high-density order areas, triggering stops and then reversing direction. According to ICT methodology, larger participants take advantage of the resulting order flow to fill sizeable positions with limited slippage. The move temporarily shifts price momentum, usually just long enough to trigger the stops before direction reverses.
What traders observe is the pattern itself, and a liquidity sweep through an obvious high or low that immediately fails is the signature they look for.
Inducement
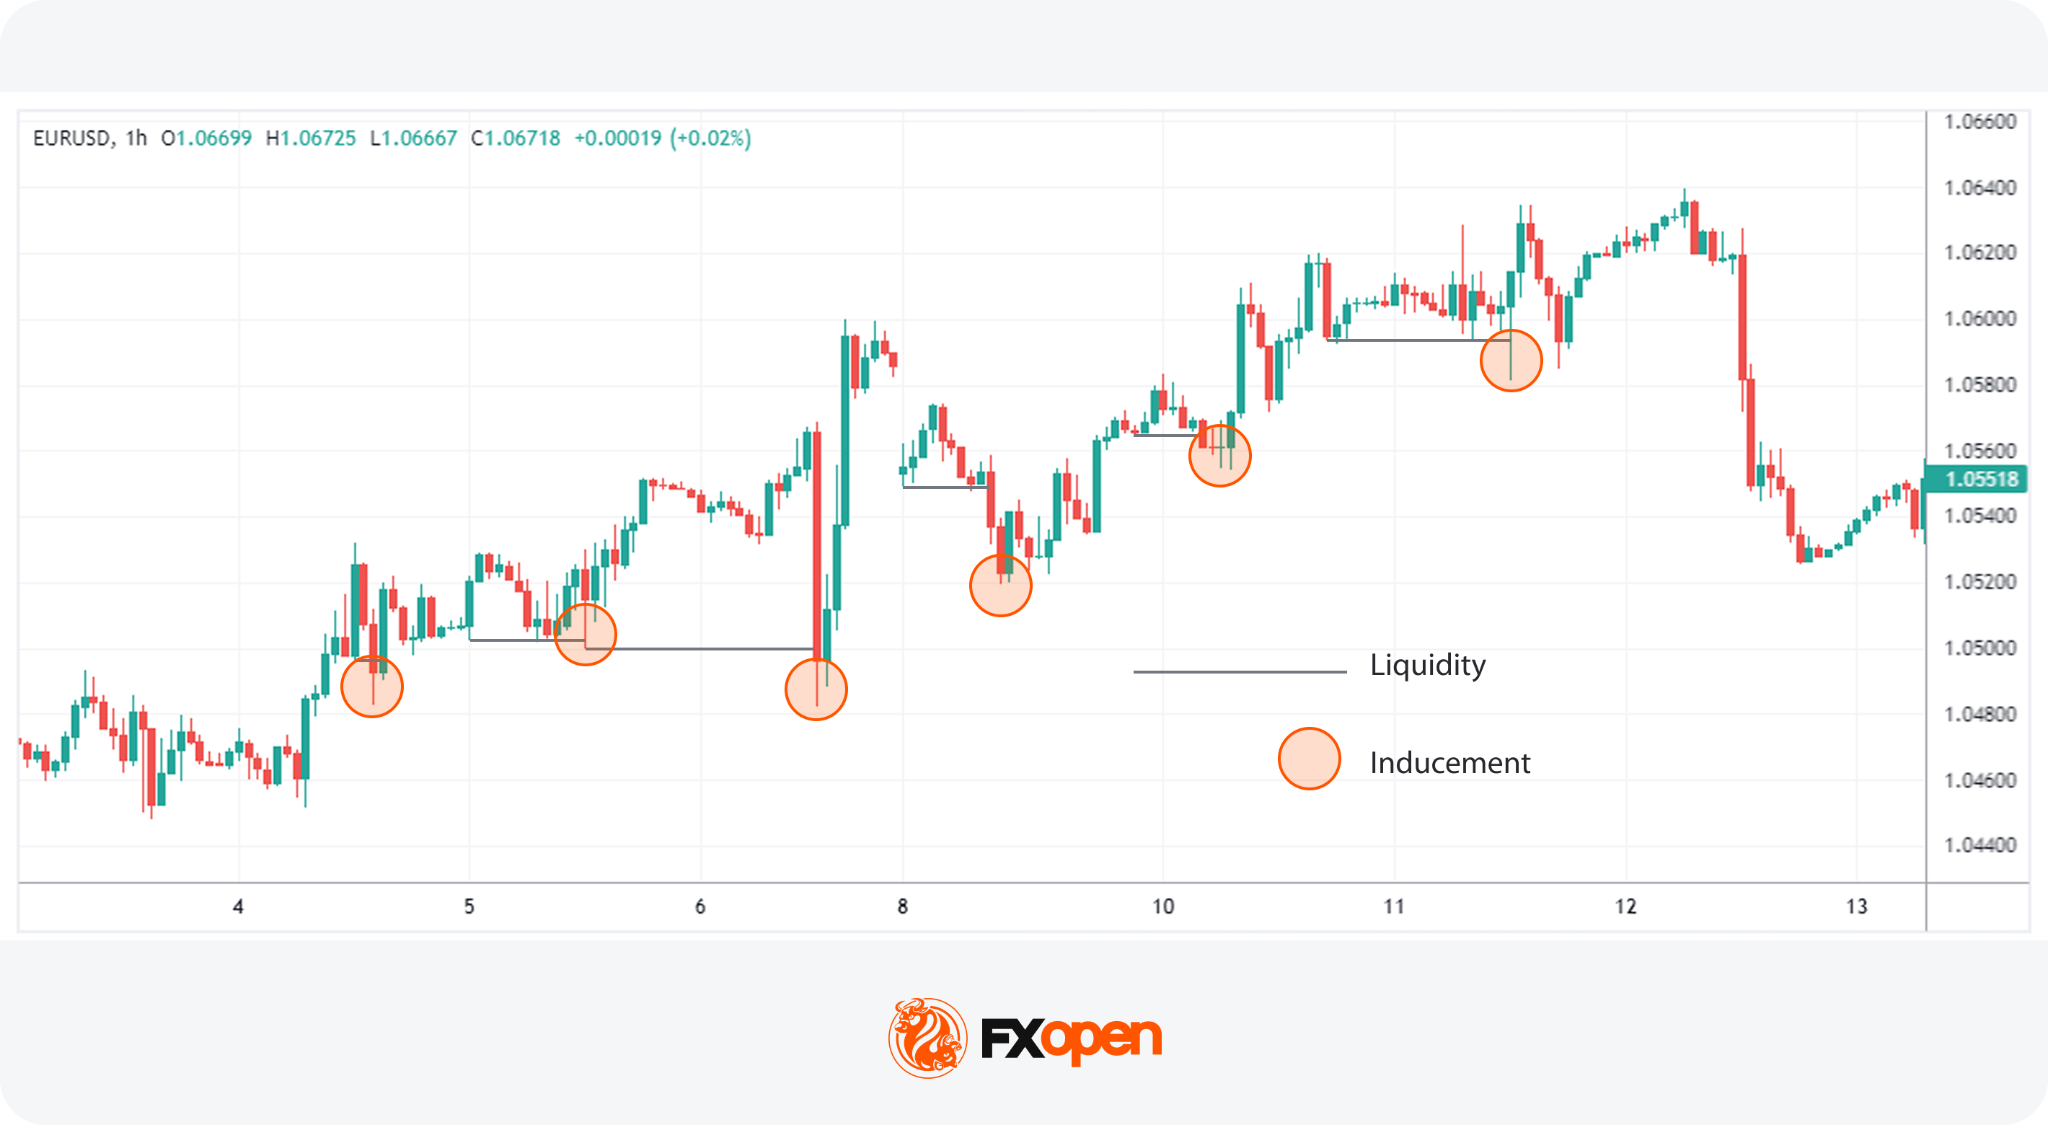
An inducement is a specific type of liquidity grab that triggers stops and makes other traders enter the market. It often appears as a peak or trough, typically into an area of liquidity, in a minor counter-trend within the larger market trend. The pattern creates the appearance of a trend change, which tends to attract entries in that direction. Price then reverses and continues with the original major trend, and the stops from those entries add to the order flow behind the move.
4.Fair Value Gaps and Displacement
In the Inner Circle Trading methodology, two specific types of sharp trending movements signal significant shifts in market dynamics: fair value gaps and displacements.
Fair Value Gaps (FVGs)
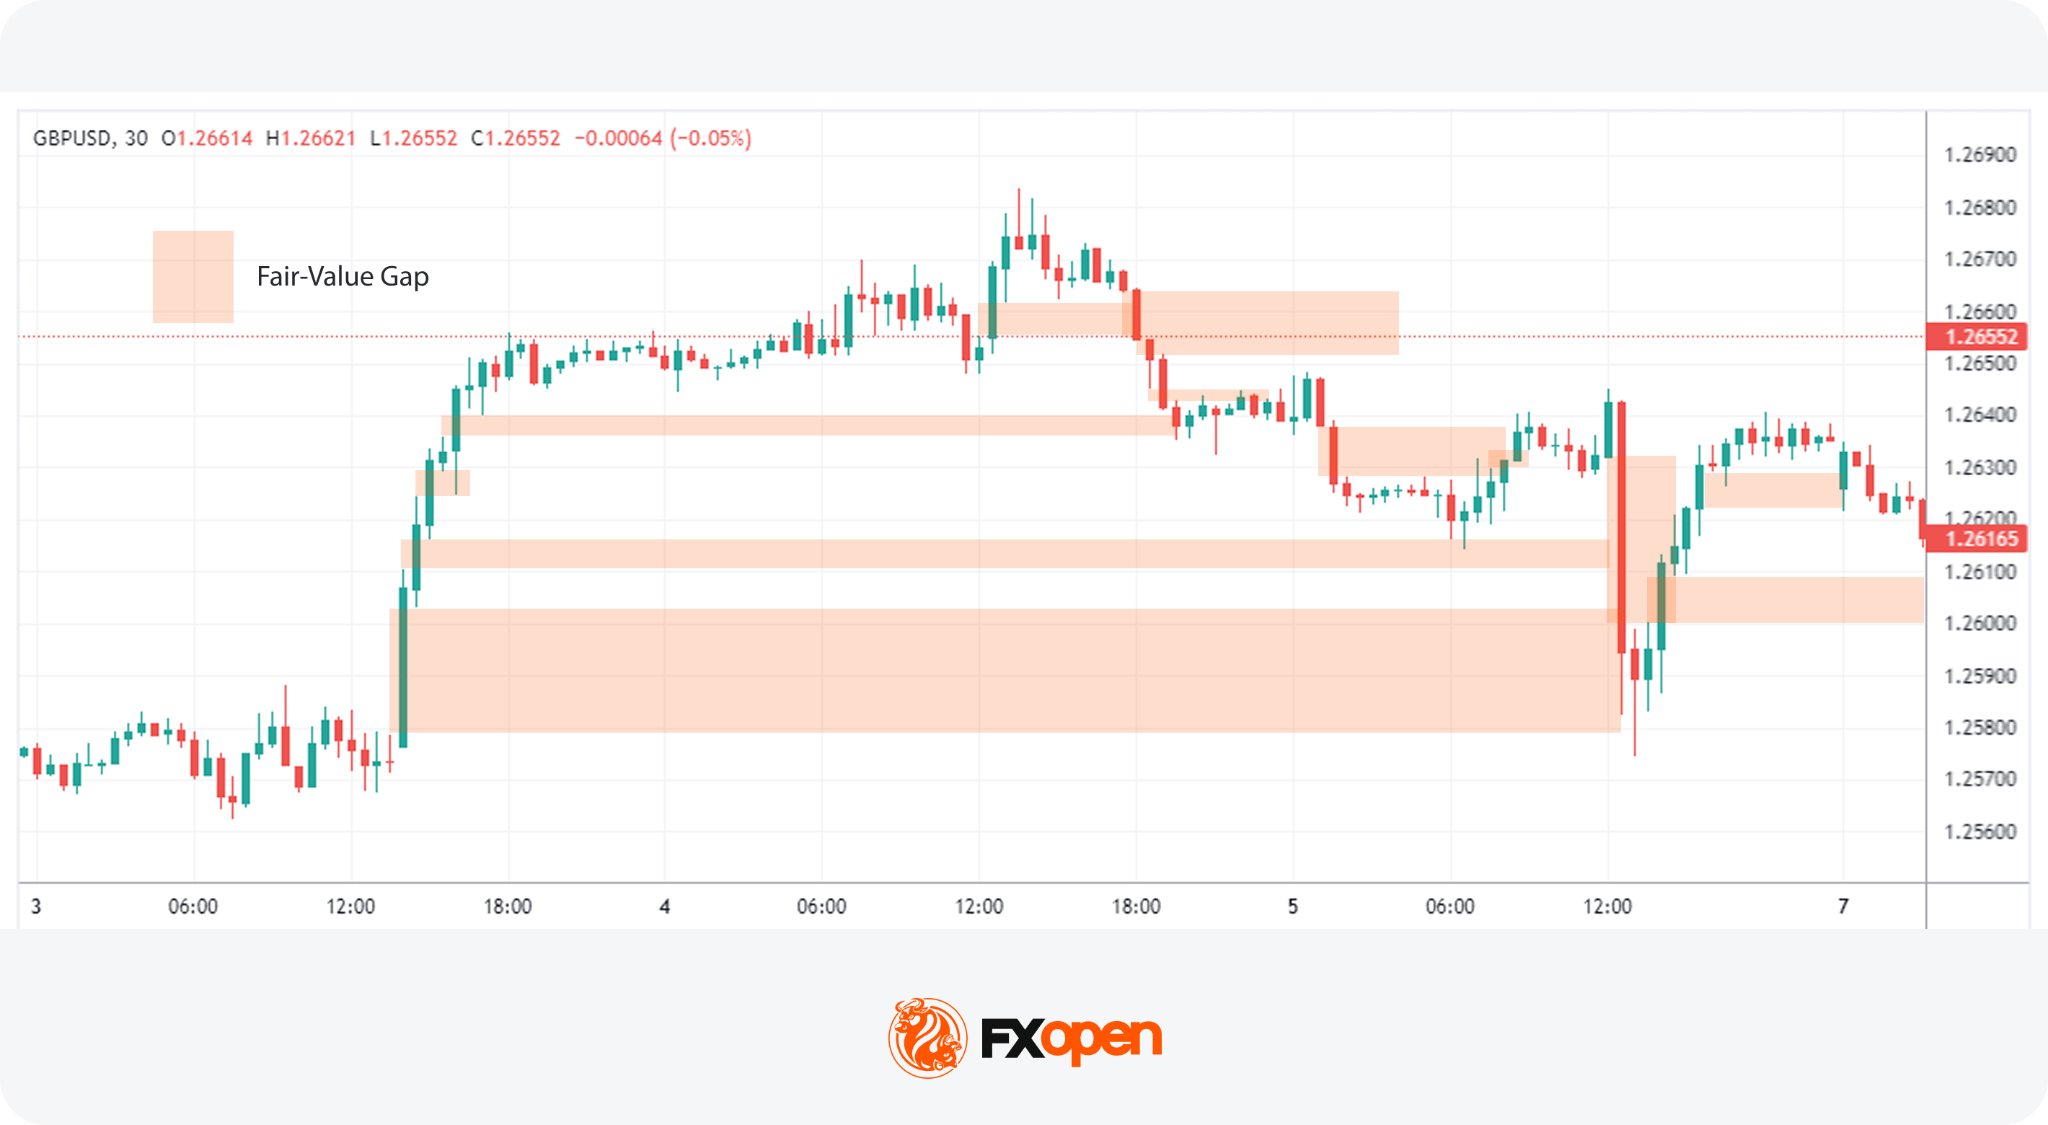
A fair value gap is a concept that reflects an imbalance in price caused by a fast, aggressive move where the market skips over prices that normally would be traded. It forms when a three-candle sequence leaves a space where the middle candle’s body and wick do not overlap with the wicks of the candles on either side. This shows that price moved so quickly in one direction that no trading occurred in that portion of the range.
Traders monitor revisits because the gap represents unfilled orders. Buyers and sellers who wanted to transact in that range never got the chance, and their orders may still be resting there. When price returns, that pending interest can produce a reaction, which is why an ICT fair value gap is often treated as a potential entry area rather than a target.
Displacements
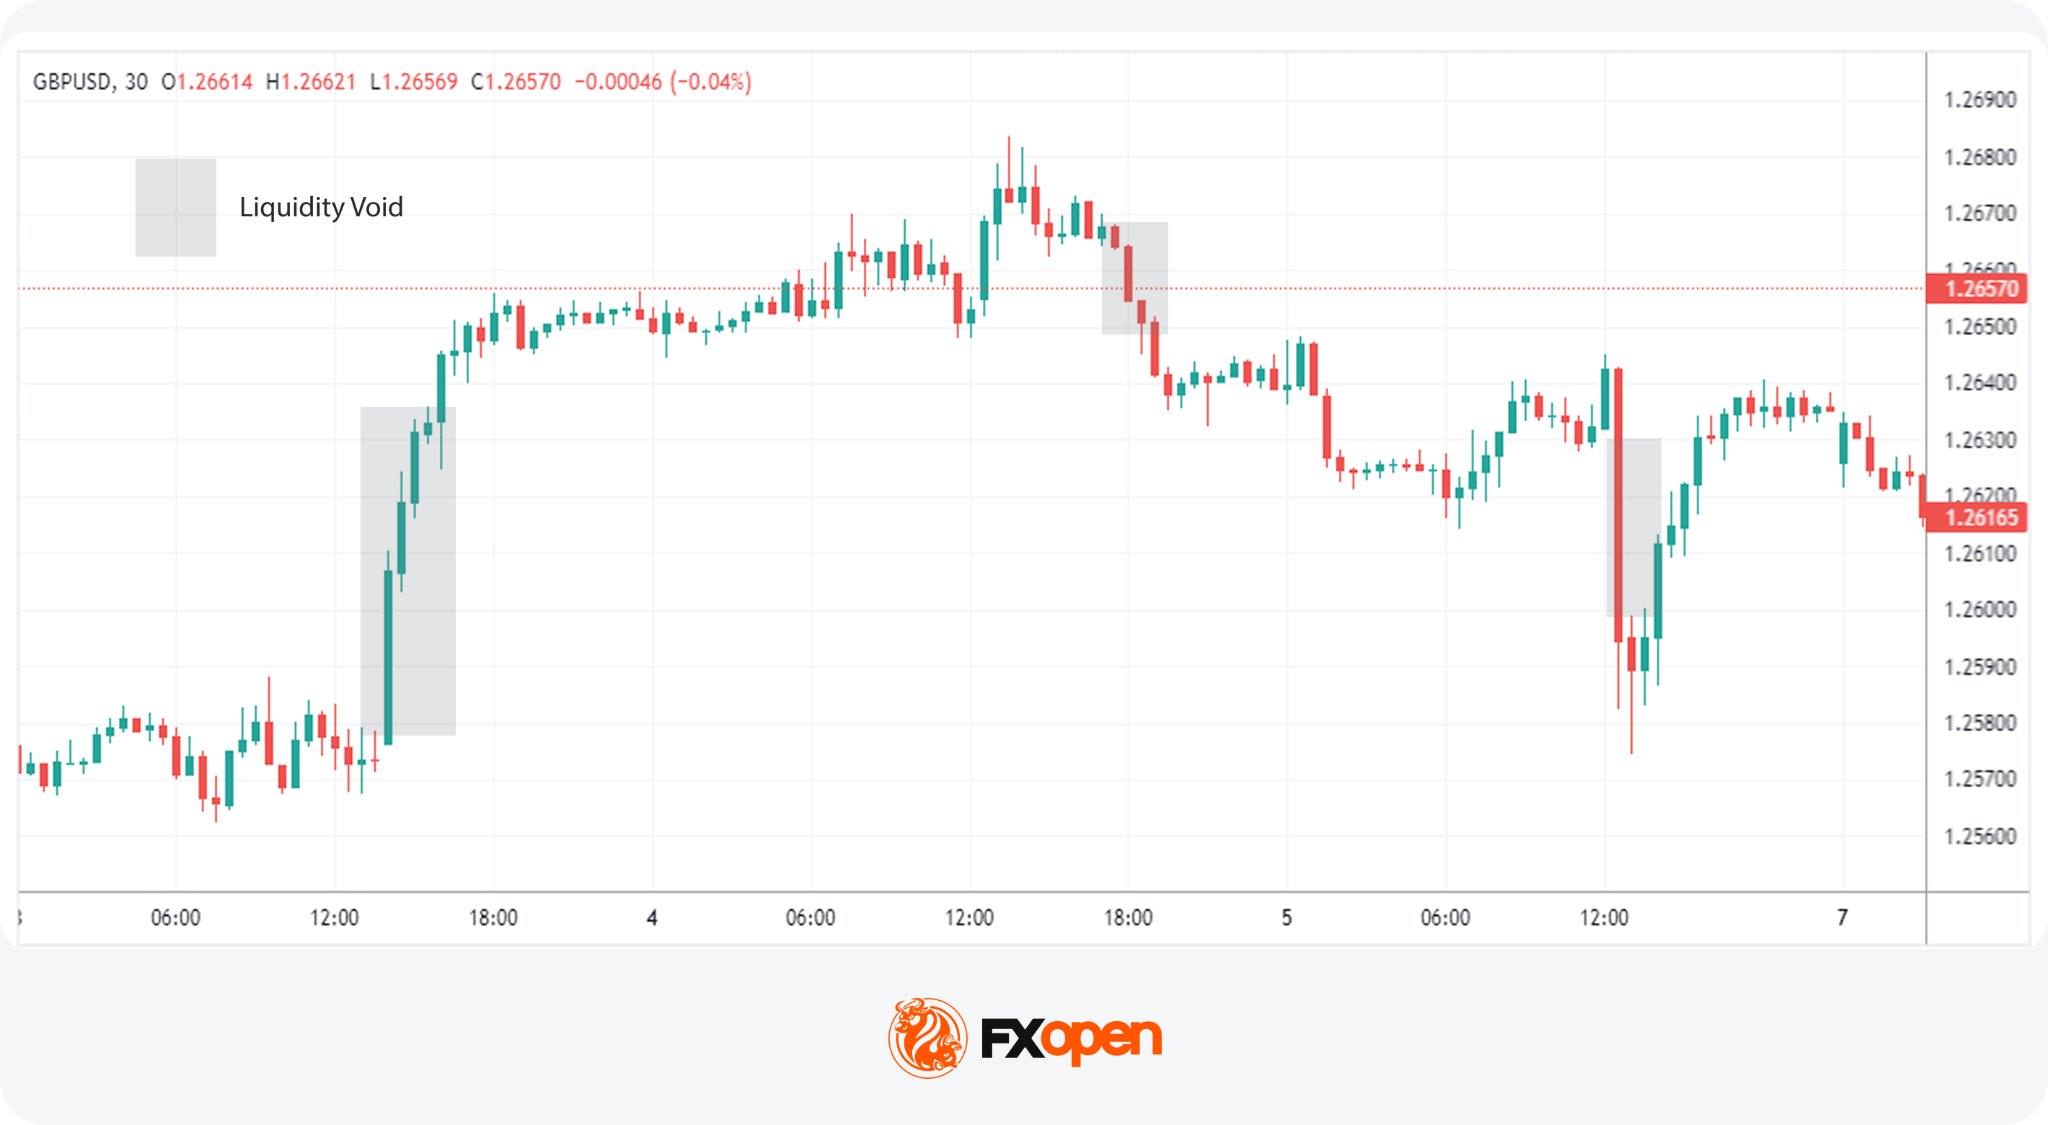
Displacements, also known as liquidity voids, is a sudden, forceful price move that leaves a large stretch of the chart with little trading activity behind it. It typically spans several candles and can contain multiple fair value gaps within it.
Displacement matters most for what it implies about intent. A slow drift through a level and a violent push through the same level are read differently, and the second is what turns a structural break into an MSS or gives an order block its significance.
5.Additional ICT Concepts
Beyond these ICT concepts, there are a few other niche components. These include Kill Zones, optimal trade entries, and balanced price ranges.
Kill Zones
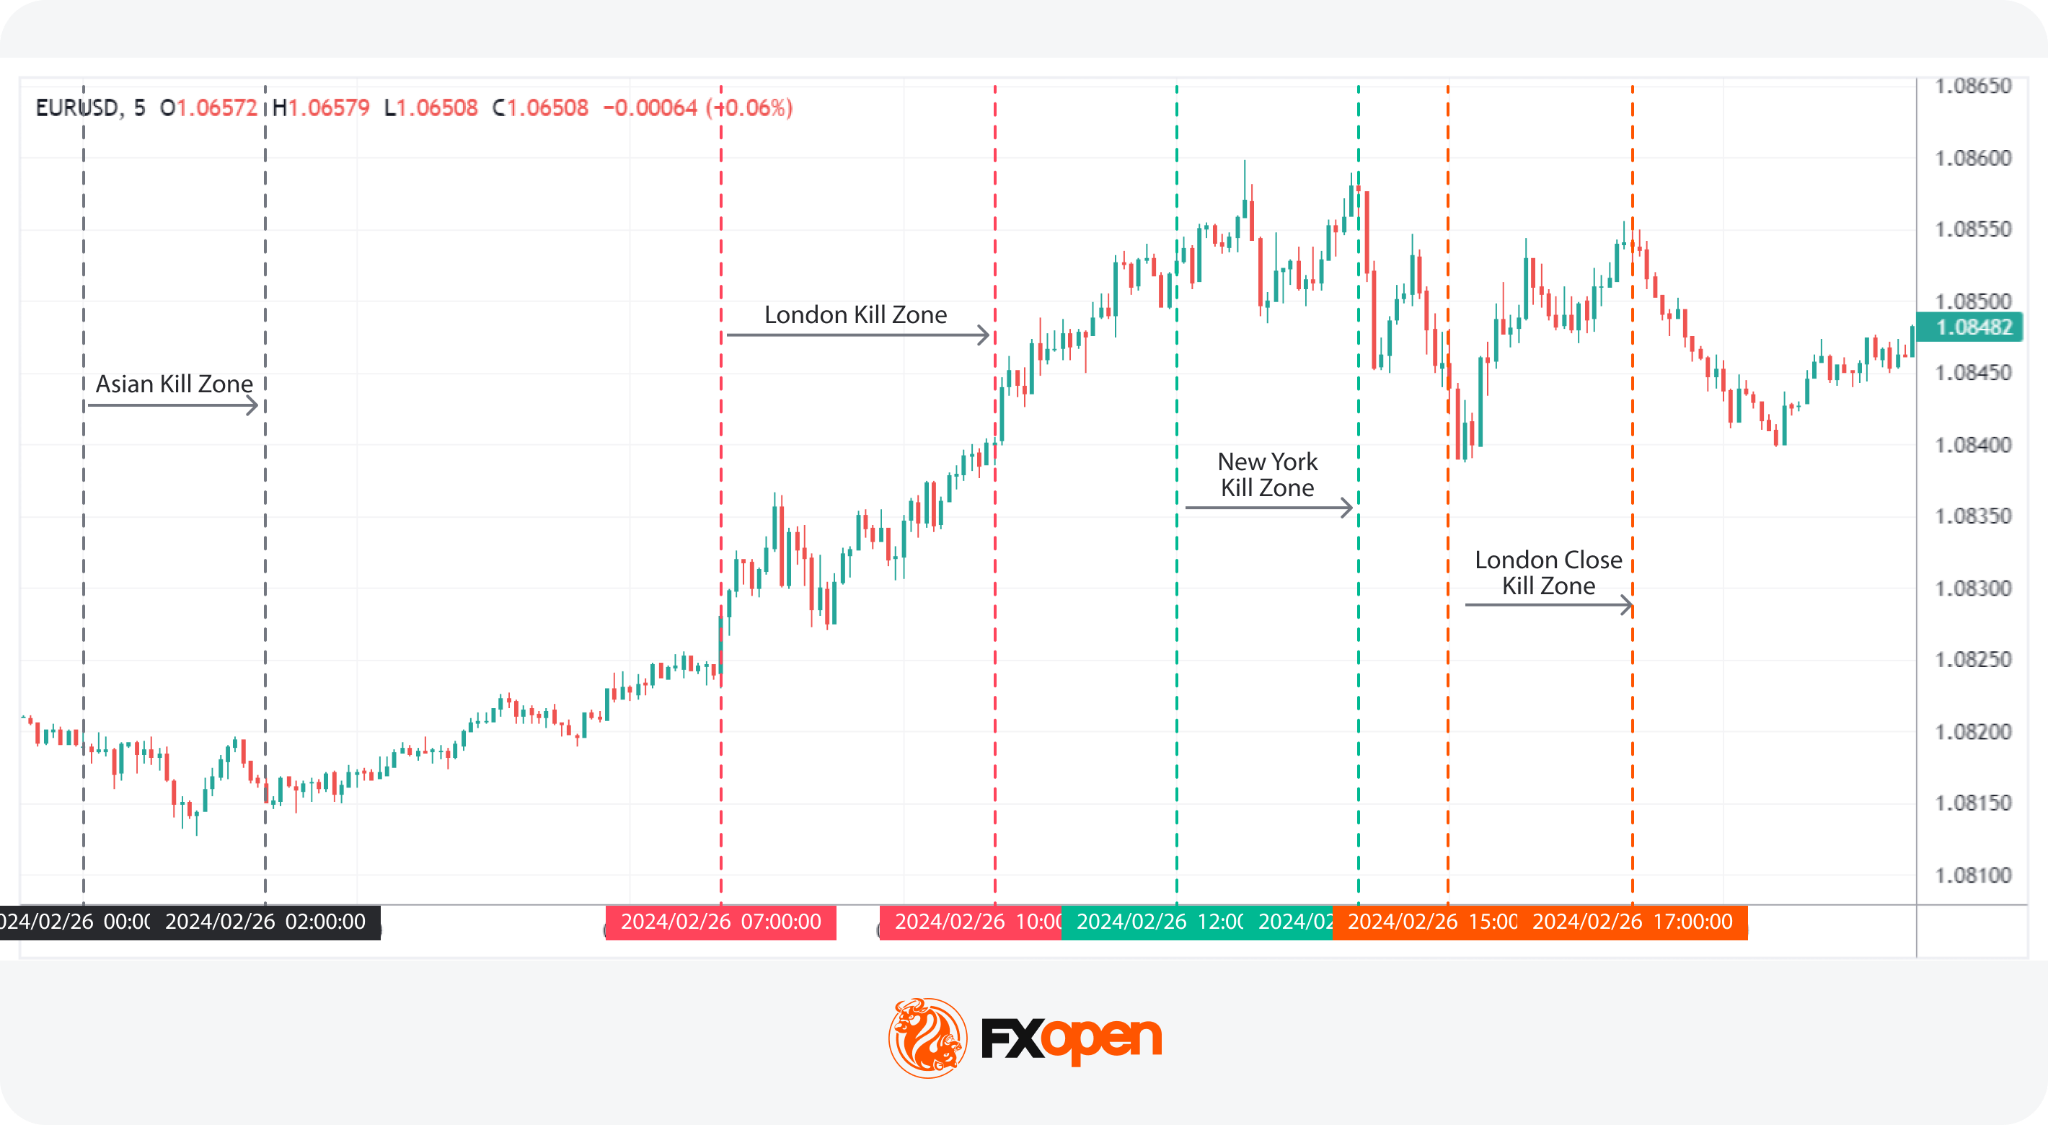
Kill Zones refer to specific periods during the trading day when market activity significantly increases due to the opening or closing of major financial centres. These periods often set the tone for price movements based on the increased volume and volatility.
The concentration is real. BIS data for April 2025 puts global OTC foreign exchange turnover at $9.6 trillion dollars a day, with sales desks in the United Kingdom handling around 38% of it and the United States about 19%. That is why ICT kill zones cluster around the hours those two centres are active.
Times shift by an hour when either region moves to daylight saving, so traders check the current session times against their own platform clock rather than relying on fixed hours.
Optimal Trade Entry (OTE)
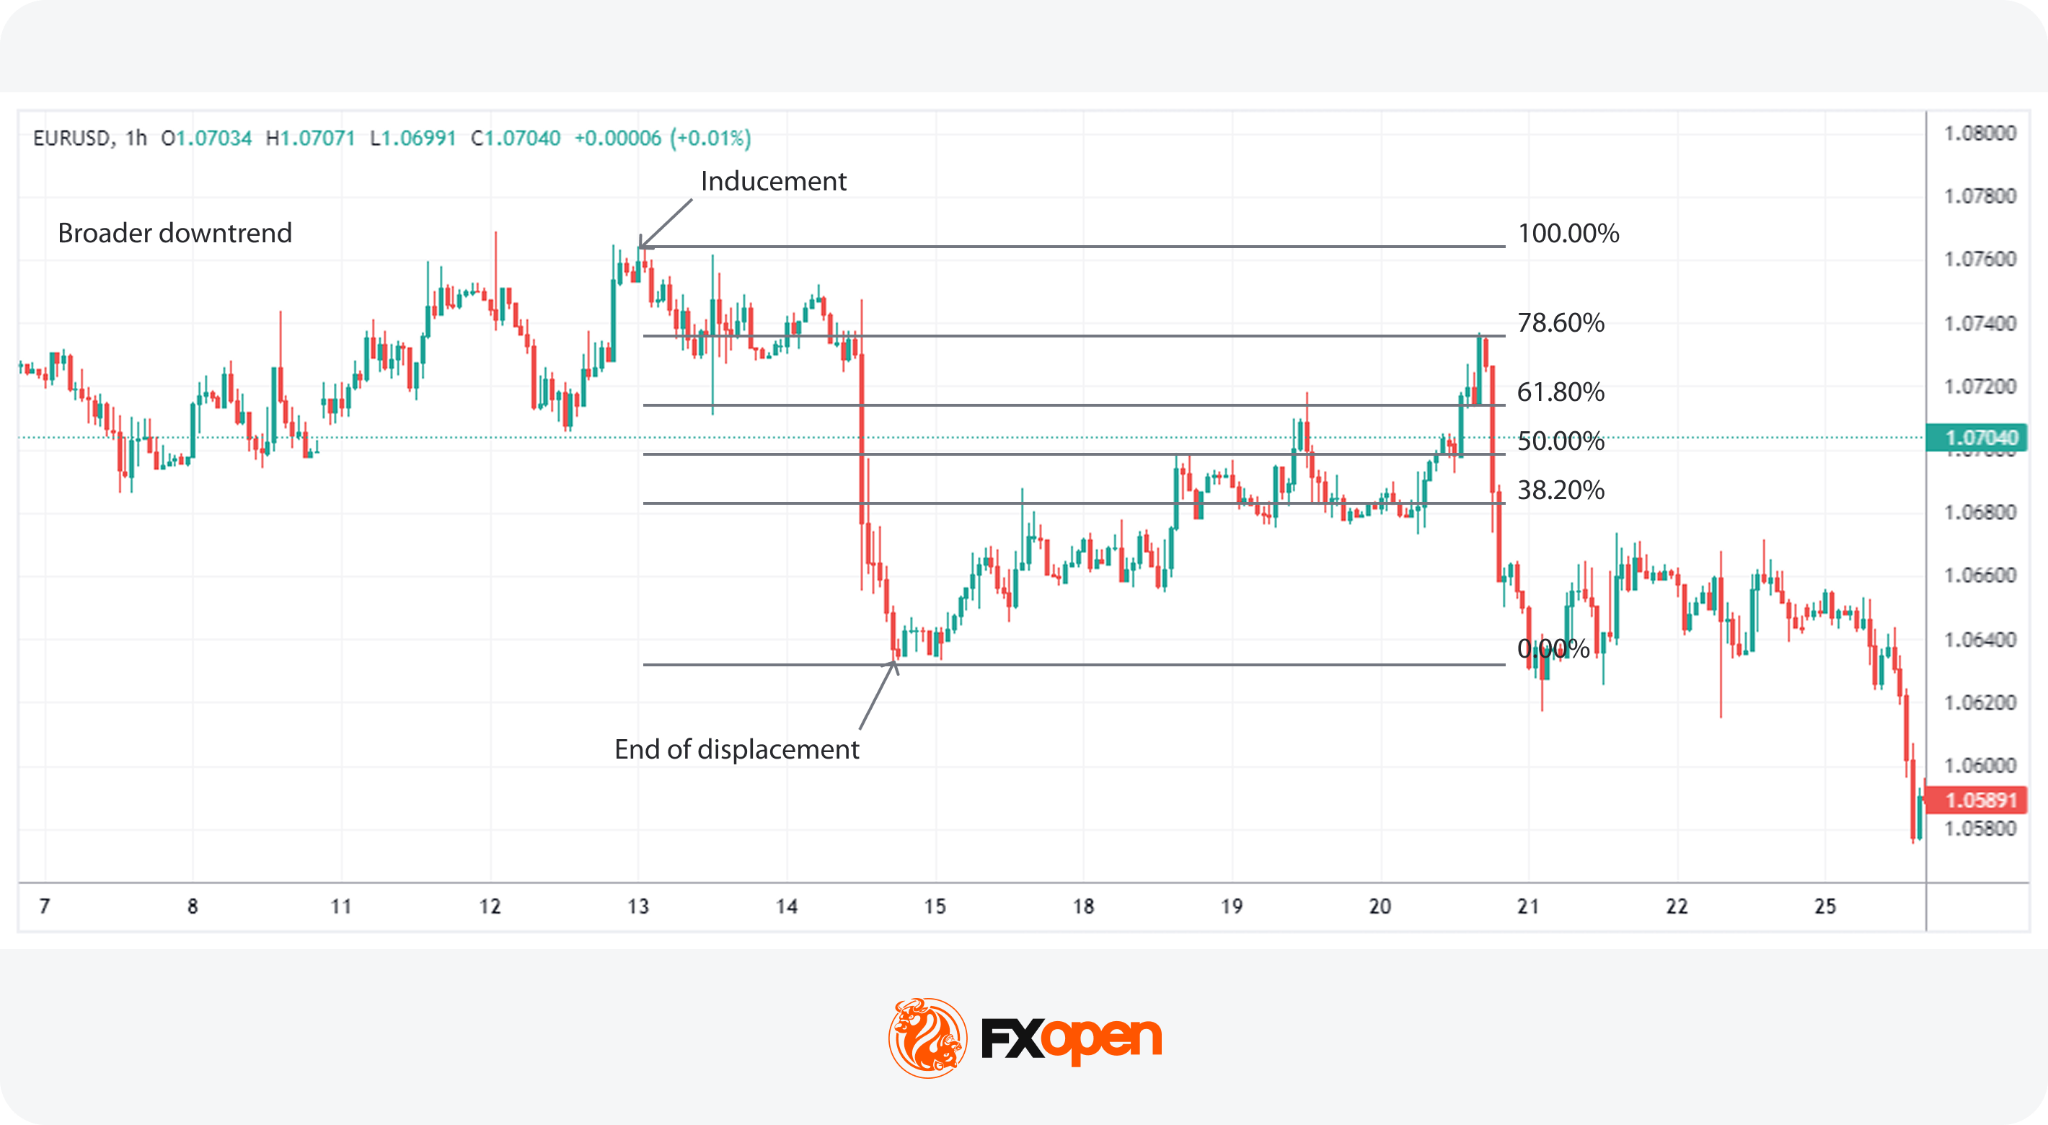
An optimal trade entry (OTE) is a type of Inner Circle trading strategy, found using Fibonacci retracement levels. After an inducement that prompts a displacement (leaving behind an FVG), traders use the Fibonacci retracement tool to pinpoint entry areas.
The Fibonacci tool is applied to the price move that created the displacement, from high to low in a bearish move and from low to high in a bullish move. Traders typically focus on the 61.8% to 78.6% retracement zone as a potential entry area.
Traders may also look for an order block or fair value gap within the ICT OTE zone. When these concepts overlap, they can provide additional confirmation for the setup.
Balanced Price Range (BPR)
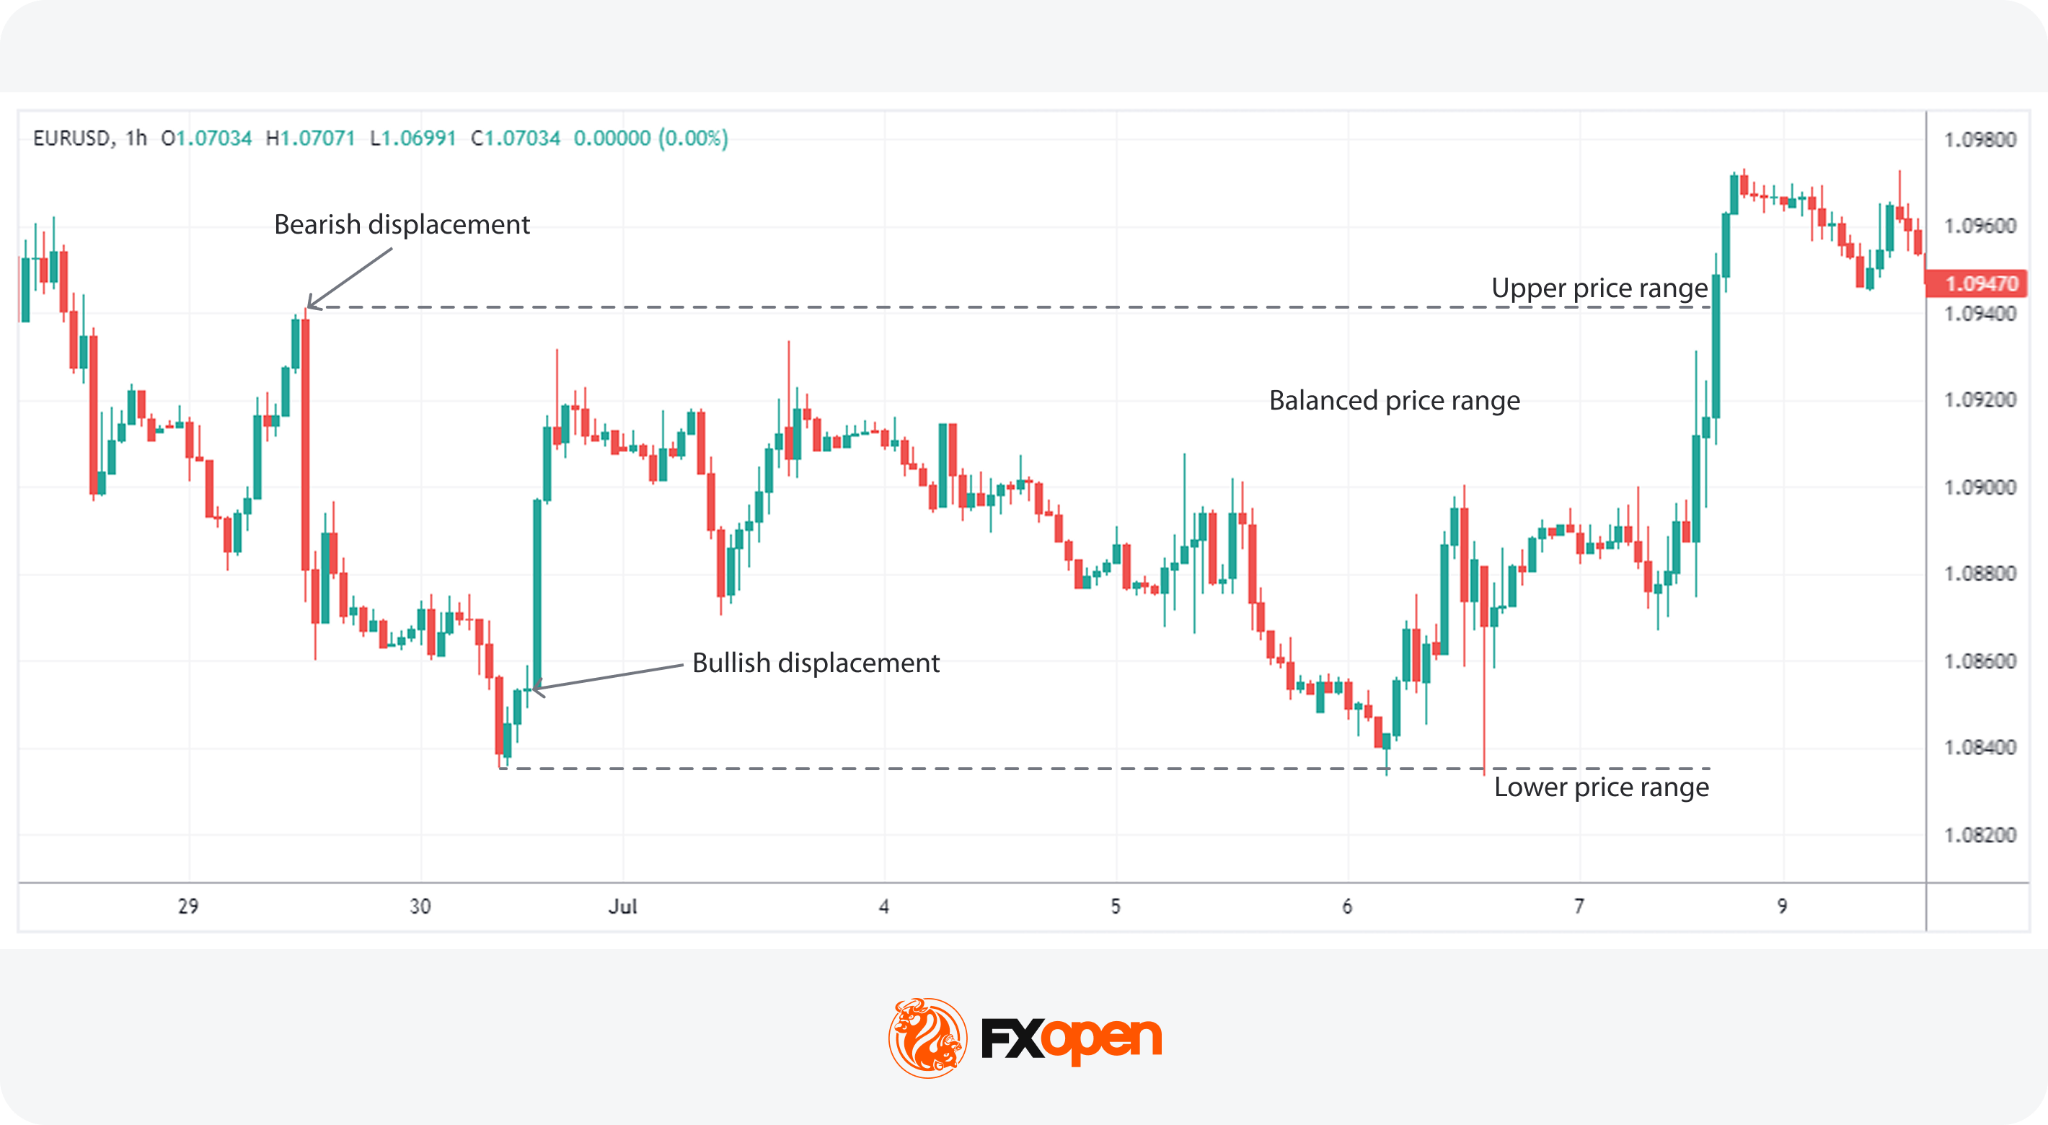
A balanced price range is a zone where price trades back and forth, rebalancing previous inefficiencies. Opposing displacements create overlapping FVGs, and the resulting zone shows where both directions have now traded. During this phase, price often oscillates between the extremes of the range as it works to resolve the imbalance.
A BPR gives traders defined boundaries rather than a single level. Reactions at the edges are watched for continuation, and a decisive move beyond either edge is read as the imbalance resolving in that direction.
ICT Trading Workflow
This is an analytical framework rather than a fixed rule set. Traders work through it in order, but each step involves judgment, and the sequence adapts to what the market is doing. It blends systematic market reading with judgment, context, and experience. The goal is to build a coherent narrative from higher-time-frame bias down to precise execution zones.
- Establishing a Higher Timeframe Bias
Traders begin by analysing the weekly, daily, and four-hour structure to identify the prevailing trend, key swing points, and major liquidity pools. This step frames whether the market is delivering higher or lower prices. - Marking Liquidity and Structural Levels
Traders identify buy-side and sell-side liquidity, including equal highs/lows, obvious stop clusters, and major swing points. Structural markers like BOS, CHoCH, and MSS may help traders understand whether momentum is intact or shifting. - Locating Imbalances and Institutional Footprints
Fair value gaps, order blocks, mitigation blocks, and displacements provide clues about where institutional orders may sit. Traders study how price reacts around these levels to understand whether smart money is adding to, mitigating, or closing positions. - Assessing Session Timing and Volatility Windows
Kill zones filter periods of heightened activity, potentially helping traders judge when ICT liquidity is likely to be taken. Timing adds context that chart patterns alone do not provide. - Building a Directional Narrative
Traders combine structural bias, liquidity targets, imbalances, and timing into a single market narrative. This sets expectations without forcing a mechanical decision. - Identify Potential Execution Zones
Areas such as retracements into order blocks, FVG fills, or OTE regions often align with points where momentum may resume. Traders use confluence, not a single signal, to refine these zones. - Review, Adapt, and ReassessAs price develops, traders reassess structure, liquidity, and displacement. The ICT strategy relies on active interpretation, so the process stays flexible.
Which Markets an ICT Concepts Be Used In?
ICT is built around price behaviour rather than the characteristics of any single market, so the same reading applies wherever there is enough participation to produce clean structure and visible liquidity.
ICT forex analysis is the most common application, particularly on major pairs, where session timing lines up directly with the London and New York kill zones. Index CFDs are the next most active area, since instruments tracking the S&P 500 or the DAX respond to the same session-driven volume. Commodities such as gold and oil, individual shares, and cryptocurrency* CFDs are all analysed with the same concepts, though liquidity and session behaviour vary between them.
Timeframes work the same way. Traders apply ICT concepts from the weekly chart down to the one-minute, usually running two or three timeframes together, with the higher one setting bias and the lower one refining entry areas. The shorter the timeframe, the more noise sits alongside the structure, which is why ICT concepts forex trading material tends to focus on the 15-minute to 1-hour range for execution.
What Challenges Do ICT Traders Face?
ICT presents several practical challenges because it demands strong chart interpretation skills and a good grasp of context. Traders often find the approach mentally demanding, especially when markets move quickly or produce conflicting signals.
Newer traders tend to struggle for a specific reason: individual concepts are easy to define, but they only make sense when combined, so learning definitions isn’t the same as being able to read a chart in real time.
The main challenges include:
- High complexity: ICT uses many concepts that interact with each other, so traders must read multiple layers of structure, liquidity, and imbalance at once.
- Context dependence: Signals rarely stand alone. Traders need to judge whether a displacement, BOS, or liquidity grab aligns with the broader narrative, which requires experience.
- Session-based variation: Price behaves differently across sessions, meaning traders must adapt to changing conditions rather than stick to fixed expectations.
- Discretion and nuance: ICT relies heavily on interpretation, so traders manage uncertainty and avoid forcing patterns that are not there.
- Emotional discipline: Because setups form quickly around liquidity events, traders face pressure to act without overreacting to noise.
ICT Trading Concepts: Advantages and Limitations
ICT trading offers a structured way to analyse price, but it also has clear limitations for traders to consider. The framework gives a detailed view of institutional behaviour, yet it remains demanding to apply consistently.
Advantages
- Institutional focus: ICT centres on how large players move price, giving traders a clearer read on why markets expand or reverse.
- Strong structural logic: Concepts like BOS, CHoCH, and MSS make trend shifts clearer than broad pattern-based methods.
- Precision in levels: Order blocks, liquidity pools, and FVGs provide well-defined areas that traders may use to take advantage of key price reactions.
- Multi-time-frame alignment: The framework links higher-time-frame bias with intraday execution, creating a coherent workflow.
Limitations
- Assumption of deliberate intent: ICT often interprets market moves as intentional actions by institutional traders, which may not always reflect how order flow actually operates.
- Steep learning curve: The depth of the framework means traders may require considerable time before applying it with consistency.
- Retrospective clarity: Many concepts appear clearer in hindsight, making them harder to apply consistently in real time.
- No fixed rules: The discretionary nature means consistency can be harder to maintain than with mechanical systems.
Whether ICT suits a particular trader depends less on the concepts themselves than on how they are used. This methodology rewards traders who are willing to tolerate uncertainty and form opinions based on multiple factors, and tends to disappoint those looking for a signal to enter a trade.
The Bottom Line
ICT trading brings market structure, liquidity, imbalances, and timing into a single framework for analysing price action. Rather than treating concepts such as BOS, order blocks, fair value gaps, and liquidity sweeps as isolated signals, traders can use them together to build a broader view of market direction and potential price reactions. As ICT relies heavily on interpretation, these concepts require practice and should be considered alongside appropriate risk management.
Traders interested in applying ICT concepts across forex and CFD markets can open an FXOpen account and access multiple markets with spreads from 0.0 pips and commissions from $1.50 per lot.
FAQs
What Is ICT Trading?
ICT (Inner Circle Trading) is a price-action methodology developed by Michael J. Huddleston. It focuses on market structure, liquidity, order blocks, fair value gaps, displacement, and session timing to analyse price movements and potential changes or continuations in market direction.
What Are the Main ICT Concepts?
The main ICT concepts include market structure, Break of Structure (BOS), Change of Character (CHoCH), Market Structure Shift (MSS), liquidity, order blocks, fair value gaps (FVGs), displacement, Optimal Trade Entry (OTE), and kill zones. Together, they form a framework for analysing price action.
What Is an ICT Trading Strategy?
An ICT trading strategy combines several concepts rather than relying on a single signal. Traders may establish a higher-timeframe bias, identify liquidity and market structure, and then look for potential entry areas using order blocks, fair value gaps, or OTE zones.
What Is the Difference Between ICT and SMC?
ICT (Inner Circle Trading) is a specific methodology developed by Michael J. Huddleston, while Smart Money Concepts (SMC) is a broader term for approaches that analyse price through liquidity and institutional market behaviour. They share concepts such as market structure, liquidity, and order blocks, while ICT uses specific terminology and models.
Is ICT Trading for Beginners?
ICT trading can be studied by beginners, but it involves numerous interconnected concepts and requires discretionary analysis. Understanding market structure, liquidity, and ICT price action first may make concepts such as order blocks, fair value gaps, and market structure shifts easier to interpret.
Does ICT Trading Use Indicators?
ICT trading primarily focuses on price action rather than technical indicators. Its core analysis is based on market structure, liquidity, imbalances, order blocks, and trading sessions. Some traders combine ICT concepts with indicators, but indicators are not central to the methodology.
Can ICT Concepts Be Used in Forex Trading?
Yes. ICT concepts are commonly applied to forex, as well as indices, commodities, shares, and other financial markets. Because the methodology focuses on price structure, liquidity, and timing, traders can analyse ICT concepts across different instruments and timeframes.
What Is the Difference Between BOS, CHoCH, and MSS?
A Break of Structure (BOS) generally indicates continuation of the existing market direction. A Change of Character (CHoCH) suggests that the current structure may be changing, while a Market Structure Shift (MSS) involves a structural change accompanied by strong displacement through a significant level.
What Is a Fair Value Gap in ICT Trading?
A Fair Value Gap (FVG) is a price imbalance created during a strong directional move. In ICT analysis, traders monitor these areas because price may later return to the gap before continuing or establishing a new direction.
Can ICT Be Combined With Other Trading Methods?
Yes. Traders may combine ICT concepts with other forms of technical analysis, such as support and resistance, trend analysis, or technical indicators. However, additional tools do not necessarily confirm an ICT setup, and each method should be assessed within the broader market context.
*Important: At FXOpen UK, Cryptocurrency trading via CFDs is only available to our Professional clients. They are not available for trading by Retail clients. To find out more information about how this may affect you, please get in touch with our team.
This article represents the opinion of the Companies operating under the FXOpen brand only. It is not to be construed as an offer, solicitation, or recommendation with respect to products and services provided by the Companies operating under the FXOpen brand, nor is it to be considered financial advice.

Israel’s Bank Leumi is partnering with Galaxy Digital to bring crypto trading to its banking app, expanding digital asset access beyond institutions and into mainstream retail finance. The service is expected to launch in early 2027, allowing customers to buy, hold, and sell Bitcoin, Ether, and Solana directly through Leumi’s trading interface.
Leumi said customers of the bank and its Pepper mobile banking arm will be able to use a dedicated section within the Leumi Trade app for the three cryptocurrencies. The companies also framed the rollout as a first for an Israeli bank, while detailing how Galaxy will provide both trading capabilities and custody support.
Key takeaways
- Leumi and Galaxy Digital plan to offer crypto trading for Bitcoin, Ether, and Solana through the Leumi Trade app.
- Launch timing: early 2027, according to the companies’ announcement.
- GalaxyOne Institutional will be used for trading and related services, with Galaxy custody infrastructure supporting the setup.
- Leumi says it will be the first Israeli bank to provide digital asset trading to retail customers.
Leumi brings crypto trading into its retail app
Under the agreement announced Friday, Leumi will enable customers to access crypto markets for three major assets—Bitcoin (BTC), Ether (ETH), and Solana (SOL)—via a dedicated section of the Leumi Trade application. The functionality is designed around three common user actions: buying, holding, and selling.
Leumi positioned the integration as an industry milestone in Israel, stating that it expects to be the first Israeli bank to offer digital-asset trading services to customers. The bank also emphasized its customer footprint, noting that it serves millions of clients across retail and business operations.
For market participants, the development is notable because it suggests regulated banks are continuing to build distribution channels for crypto rather than limiting participation to broker-dealers or crypto-native platforms. While the exact user experience and onboarding steps were not detailed in the announcement, the “through the bank’s app” approach is a meaningful shift in where retail crypto services are likely to be discovered and accessed.
Galaxy provides trading and custody infrastructure
The partnership is supported by two separate pillars of Galaxy’s platform. Leumi said it will use GalaxyOne Institutional for trading and related services. For custody and digital asset infrastructure, the companies said Galaxy’s custody platform—formerly known as GK8—will support the technical foundation behind the offering.
That separation matters from a risk and operations standpoint. Trading systems and custody systems typically require different controls, reporting, and security tooling, and the announcement indicates Leumi will be leveraging Galaxy’s established infrastructure rather than building a complete stack internally. For investors and users watching the space, this approach is often associated with faster deployment timelines and more consistent institutional-grade operational standards.
However, until closer to launch, key details remain unclear—such as whether the service will operate with specific regional restrictions, what user limits or compliance requirements will apply, and how the platform will handle order routing and settlement. Those elements could influence both customer demand and operational risk management when the service goes live.
Why the timing and partnership structure matter
The stated target—early 2027—places the Leumi rollout well into the future, giving the banks time to complete integration, compliance procedures, and security hardening. From an editorial perspective, the duration is also a reminder that bank-led crypto products are often slower-moving than crypto-native services, particularly when custody, reporting, and regulatory frameworks must be aligned.
Galaxy Digital’s role as the technology and liquidity partner also highlights how large crypto firms are increasingly positioning themselves as infrastructure providers to traditional finance. Rather than building standalone consumer exchanges, these collaborations aim to turn crypto market access into a feature inside existing banking channels.
That shift could be important for adoption. Bank apps typically come with established customer onboarding, payment rails, and support workflows. If Leumi’s offering proves smooth and reliable, it could reduce friction for mainstream users who want exposure to major cryptocurrencies but prefer the familiar interface of a regulated bank.
Galaxy’s recent performance underscores a volatile backdrop
The announcement arrives after Galaxy reported a challenging period for its broader business. According to Cointelegraph’s earlier coverage linked in the original report, Galaxy posted an $85 million net loss in Q2, which it attributed largely to declining digital asset prices. Despite the net loss, Galaxy’s digital assets segment generated $66 million in adjusted gross profit, reported as up 34% quarter-over-quarter.
This matters because it frames the partnership against a backdrop where the crypto market’s direction can swing profitability. Even so, the fact that Galaxy continued to report positive adjusted gross profit in the digital assets business suggests that trading and infrastructure services may remain comparatively resilient during down cycles—especially if counterparties and institutional users continue to operate.
For readers tracking Galaxy’s broader strategy, the Leumi deal reinforces an angle that the company has been pursuing for some time: using institutional infrastructure and market services to gain access to distribution partners. Galaxy Digital, founded and led by Mike Novogratz, began trading on the Nasdaq under the ticker GLXY in May 2025. Yahoo Finance data showed the stock at $21.38 on Friday morning, up about 2% on the day but down roughly 25% over the past year.
What to watch next
With an early-2027 launch horizon, the most important developments for customers and the market will be regulatory approvals, product design details inside Leumi Trade, and how Galaxy’s trading and custody components are integrated for a bank-grade user experience. Until then, investors should watch for additional partner announcements and any operational disclosures that clarify how Leumi plans to scale crypto access while managing custody, compliance, and liquidity requirements.


P2P.org has integrated its staking infrastructure with Arkis, allowing institutional clients to use staked Solana and Avalanche assets as collateral while continuing to earn protocol rewards.
Summary
- Arkis clients can use staked Solana and Avalanche positions as collateral for trades.
- Margin is calculated against the aggregate risk of each client’s Arkis account.
- Validator downtime and slashing risk will affect how Arkis values the collateral.
- The integration is live through the Carry Trades section of Arkis Alpha.
P2P.org staking enters Arkis collateral system
P2P.org said in an Aug. 13 announcement that Arkis clients can now stake supported assets through its validator infrastructure and post the resulting positions as collateral without unstaking them first.
At launch, the integration supports Solana and Avalanche. P2P.org and Arkis did not say when other proof-of-stake networks might be added.
Once deposited, the staked asset and any trades backed by it sit within a single Arkis account. The prime broker calculates margin from the aggregate risk of the account instead of assessing each position separately at the trading venue where it is held.
Clients can therefore borrow against a supported staked position in the same way that they borrow against other collateral accepted by Arkis. According to the announcement, the asset continues generating protocol rewards while it supports the client’s trading positions.
The service is available through Carry Trades in Arkis Alpha. After a client selects a staked asset, the platform displays the strategies that accept it as collateral and provides the stated economics before capital is committed.
P2P.org supplies the non-custodial staking and validator infrastructure, while Arkis handles credit, collateral, and portfolio risk.
“Collateral is only as good as the operator standing behind it,” said Artemiy Parshakov, vice president of strategic solutions at P2P.org.
Parshakov added that staking can no longer be treated as a passive balance-sheet position once an institution borrows against it. According to the executive, P2P.org’s validator operations must meet the standards applied under Arkis’s credit and risk framework.
Arkis prices validator risk into margin
Adding staked assets to a margin account introduces risks that do not apply to cash or unstaked tokens. Proof-of-stake networks can penalize validators for conduct such as signing conflicting blocks or failing to meet certain network requirements.
Known as slashing, the penalty can reduce the number of tokens attached to a validator. Extended downtime can also reduce expected rewards, changing the value of a position used to support an open trade.
Arkis said its risk framework considers the quality of the staking operator when determining how the collateral should be treated. Slashing history and validator downtime are therefore assessed as margin inputs rather than excluded from the calculation.
“A growing share of institutional books sits in assets that earn yield, and credit providers have been slow to treat those positions as part of the portfolio they margin,” said Oleksandr Proskurin, chief product officer and co-founder of Arkis.
Proskurin said the integration places staked assets alongside the client’s other positions for margin purposes. Arkis chose P2P.org because the prime broker wanted to assess the operator behind the staked asset as part of its underwriting process, he added.
According to Arkis, the Spark-backed company has deployed more than $250 million in institutional credit since 2022 without recording bad debt. The figure is company-provided and was not independently verified in the announcement.
P2P.org reported that its validators operate across more than 40 proof-of-stake networks and secure over $10 billion in staked assets. The company also claimed that it has not recorded a slashing incident since its establishment in 2018 and serves more than 190 institutional clients.
Staked collateral keeps capital in use
Without such an arrangement, a fund may need to unstake an asset before using it as collateral elsewhere. Unstaking can involve a waiting period determined by the blockchain, during which the holder may lose access to trading opportunities or stop receiving some rewards.
The P2P.org integration allows the staked position to remain active while Arkis uses it to support other trades. Any rewards remain determined by the underlying protocol and can vary based on network conditions, the amount staked, validator performance, and protocol rules.
Using an earning asset as collateral does not remove liquidation or slashing risk. A decline in the token’s market price, a change in margin requirements, or a validator penalty could reduce the collateral supporting an open position.
The Arkis arrangement differs from restaking, in which an already-staked asset is used to secure additional blockchain services. As an August staking explainer detailed, restaking can expose an asset to several sets of slashing conditions when it secures multiple protocols.
Under the announced Arkis structure, the supported staked position serves as financial collateral within a prime brokerage account. The companies did not state that Solana or Avalanche assets would be restaked to secure another network.
P2P.org has used similar integrations to place its staking services inside existing institutional systems. In June, crypto.news reported that Taurus had integrated P2P.org validators with Taurus-PROTECT, allowing financial institutions to stake while retaining custody and control of their assets.
An earlier collaboration added P2P.org to Northstake’s ETH validator marketplace in January 2025. The companies said the marketplace was designed to provide regulated institutions with access to Ethereum validator infrastructure.
U.S. guidance covers some staking arrangements
For U.S. institutions, a May 2025 staff statement from the Securities and Exchange Commission’s Division of Corporation Finance addressed certain forms of protocol staking carried out directly or through a third-party operator.
The SEC staff statement said the protocol staking activities described in its analysis did not involve the offer and sale of securities. Its position covered some non-custodial arrangements in which token owners retain ownership and control of their assets and private keys while assigning validation rights to a node operator.
The division said its view depended on the specific facts and circumstances. Services that include additional business arrangements or depart from the activities described in the statement may require a separate legal assessment.
P2P.org describes its staking infrastructure as non-custodial, but neither company announced specific access for U.S. institutions or said that the Arkis integration had been assessed under U.S. securities law. The release also did not disclose whether geographic restrictions apply to Arkis Alpha.
In May 2025, the Office of the Comptroller of the Currency confirmed that national banks and federal savings associations may outsource permissible crypto activities to third parties when they maintain appropriate third-party risk controls. The OCC guidance addressed custody and transaction execution but did not approve P2P.org, Arkis, or the use of staked assets as trading collateral.
P2P.org separately announced an Aug. 11 partnership with BoulderTech to distribute staking and decentralized finance services in Argentina, Brazil, and Mexico. BoulderTech will connect the validator operator with regional exchanges, custodians, banks, asset managers, and funds, while both companies assess whether to deploy validator infrastructure at IRSA-backed facilities in Argentina.

In this video, Gary Thomson explores why the Japanese yen has weakened again after briefly recovering following US-Japan currency intervention, with USD/JPY back above 159.
👉 Key topics covered:
✔️ Why the Yen Recovery Faded — The wide US-Japan rate gap continues to weigh on the yen and support carry trades.
✔️ Geopolitics and Oil — Middle East tensions and higher oil prices are adding pressure on Japan while supporting the dollar.
✔️ Investment Flows — Strong US investment, particularly in AI, continues to attract capital away from Japan.
✔️BoJ Rate Hike Expectations — Markets are increasingly pricing in a potential September rate hike, but could one move be enough to reverse the yen’s trend?
✔️Potential Intervention — With USD/JPY above 159, traders are watching for further action from the BoJ and Japanese authorities.
Interest-rate differentials, capital flows, geopolitical risks and intervention continue to drive the USD/JPY pair.
💬 Don’t forget to like, comment, and subscribe for more market insights every week.
Watch it now and stay updated with FXOpen.
This article represents the opinion of the Companies operating under the FXOpen brand only. It is not to be construed as an offer, solicitation, or recommendation with respect to products and services provided by the Companies operating under the FXOpen brand, nor is it to be considered financial advice.
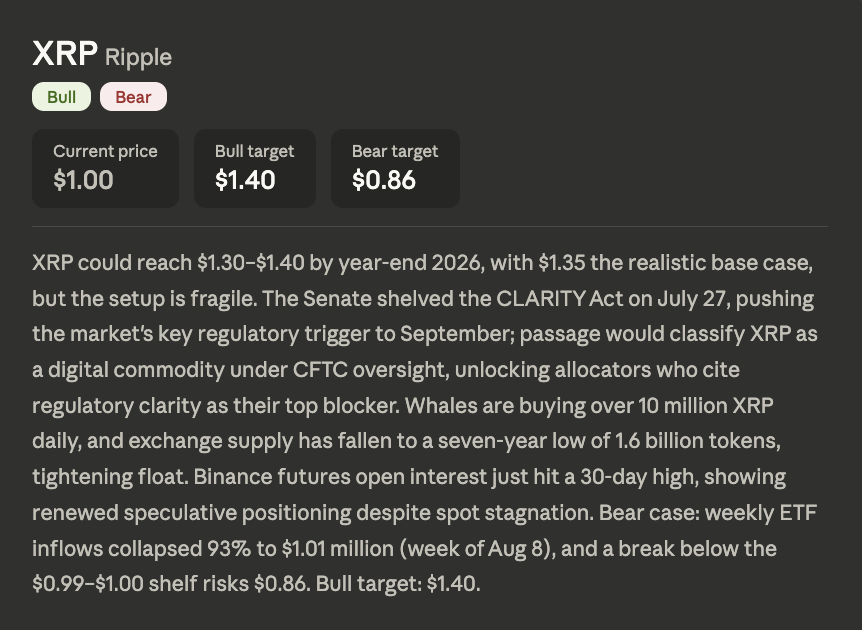
Whales are absorbing more than 10 million tokens a day while exchange supply drains to a seven-year low. Claude AI predicts that squeeze matters, and the XRP price prediction lands at $1.30 to $1.40 by year-end 2026, with $1.35 as the realistic base case.
The regulatory piece is the largest variable. The Senate shelved the CLARITY Act on July 27, pushing that trigger to September.
Passage would classify XRP as a digital commodity under CFTC oversight. Claude notes allocators cite regulatory clarity as their single biggest blocker.
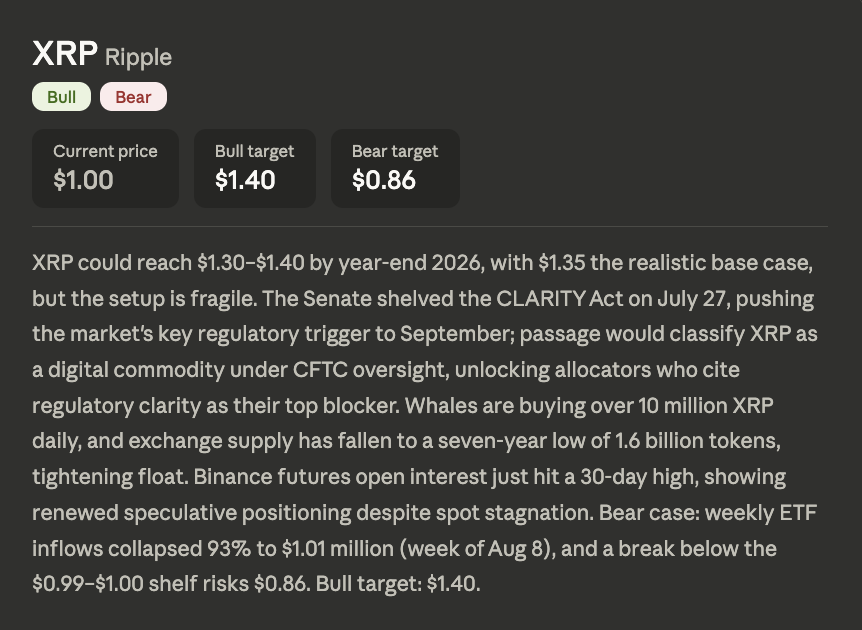
The supply side is already tightening without it. Exchange balances have fallen to 1.6 billion tokens, the lowest in seven years.
Speculative positioning is returning too. Binance futures open interest just hit a 30-day high despite flat spot action.
Claude calls the whole setup fragile rather than confident. That framing runs through the entire thesis.
The bear case has a hard number behind it. Weekly ETF inflows collapsed 93% to $1.01 million in the week of August 8.
The $0.99 to $1.00 shelf is the line that matters. A break below it puts $0.86 in play.

Discover: Everyone’s Got a Take. Get Free $25 to Actually Trade Yours
XRP Price Prediction: Whales Are Loading While Washington Stalls Until September, Is Claude AI Predicts Happening?
The chart explains why the word fragile keeps appearing. XRP peaked above $3.55 last July and has declined for thirteen straight months.
October brought a violent single-candle drop toward $1.60. February broke the $1.80 region and carried price near $1.15.
Spring produced a range between $1.30 and $1.50. That looked like a floor until June broke it decisively.
Summer has been a steady grind lower with no bounce of consequence. Price now sits at the lowest point anywhere on this chart.
The close reads $1.00425, down 0.42% and $0.00426 on the session. The daily range covered $1.00281 to $1.01308.
Support sits at $1.00, then $0.99 as the shelf Claude flags, with $0.86 beneath it. Resistance appears at $1.10, then $1.20 and $1.40.
RSI reads 35.81 with its signal line above at 39.59. The oscillator trails by nearly 4 points, which keeps sellers firmly in control.
That reading sits just above oversold territory. Momentum is weak and still pointed lower.
Claude’s bull target sits 40% above a market making new lows. September is when Washington either supplies the catalyst or confirms the fragility.
Discover: Your Market Calls Are Worth Something. Start With Free $25 on Kalshi
If September Is the Catalyst, Kalshi Lets You Trade the Outcome Before XRP Moves
XRP traders are effectively waiting on Washington. The difference with Kalshi is that you do not have to express that view through XRP itself.
Kalshi lets users trade directly on real-world outcomes, including politics, economic data, Fed decisions, crypto milestones, and other events that can move markets. Instead of guessing how XRP might react to the CLARITY Act, traders can take a position on the underlying event itself.
That matters when the asset is sitting on fragile support and the next major catalyst has a date attached to it. Kalshi turns those binary questions into tradable markets, giving users another way to act on the same thesis before it shows up in price.
Eligible new users who sign up through CryptoNews can also receive $25.
Don’t Miss Out on Our $1,000 USDT Airdrop on ByBit
The post Dario Amodei Claude AI Predicts the Next Chapter for XRP in 2026 appeared first on Cryptonews.


StablecoinX shares have climbed more than 12% after the Nasdaq-listed company disclosed a 3-billion-token ENA treasury and reported its first quarterly results since going public.
Summary
- StablecoinX held approximately 3 billion ENA tokens, equal to about 20% of the total supply.
- The ENA treasury was valued at $218.4 million, or about $9.09 per Class A share.
- StablecoinX recorded a $34.2 million quarterly net loss, largely caused by a non-cash impairment charge.
- Infrastructure services produced $62,372 in revenue during the final two weeks of June.
StablecoinX values its ENA treasury at $218.4 million
StablecoinX said in its Aug. 14 quarterly results release that its ENA treasury totaled approximately 3 billion tokens at the end of the second quarter, giving the company control of roughly 20% of ENA’s 15 billion-token supply.
Using ENA’s June 30 closing price of $0.07204, StablecoinX valued the position at $218.4 million. The treasury was worth approximately $9.09 for each of the 24,029,375 Class A shares outstanding on that date, according to the company.
Around 284.95 million ENA tokens came from the Ethena Foundation as part of StablecoinX’s business combination. Cash and in-kind investments made by private investment in public equity participants accounted for another 2.75 billion tokens.
StablecoinX reported total assets of $232.6 million at quarter-end, including $18.9 million in cash and cash equivalents. Its balance sheet carried $212.9 million in digital intangible assets, consisting mainly of ENA recorded at cost after impairment.
Shares rose more than 12% during early U.S. trading on Friday following the results. The stock reaction came less than two months after StablecoinX completed its merger with special-purpose acquisition company TLGY Acquisition Corp.
As crypto.news reported in June, the business combination closed on June 25, with StablecoinX’s Class A shares and public warrants starting Nasdaq trading one day later under the symbols USDE and USDEW.
A non-cash ENA charge drove the quarterly loss
For the three months ended June 30, StablecoinX recorded a net loss of $34.2 million, equal to $15.27 per share. Most of the loss came from a $36.2 million impairment charge tied to its digital intangible assets rather than spending by its operating business.
After excluding the impairment and changes in the value of digital asset-related instruments and warrant liabilities, the company calculated an adjusted non-GAAP net loss of $188,204. StablecoinX had used $81,680 in cash for operating activities during the first six months of 2026.
Revenue remained limited because the company’s infrastructure operation only began producing income near the end of the reporting period. StablecoinX generated $62,372 from infrastructure services during the final two weeks of June, with no revenue reported from its other planned business lines.
Chief Executive Edward Chen described the quarter as StablecoinX’s first reporting period as a public company and said the completed merger had opened a stock-market route into yield-bearing digital dollar products.
“Our first quarter end as a public company reflects the successful close of our business combination.”
The company’s ENA position leaves its asset value and reported results closely tied to the market price of Ethena’s governance token. StablecoinX also identified ENA volatility, changing regulatory conditions, and difficulties launching its planned products as risks that could affect its financial performance.
For U.S. investors, StablecoinX provides exposure through Nasdaq-listed shares rather than requiring the direct purchase or custody of ENA. Its public status also requires the company to disclose financial results and material developments through filings with the U.S. Securities and Exchange Commission.
Infrastructure services have processed $3 billion
Beyond the token treasury, StablecoinX operates a decentralized verifier node that checks and delivers cross-chain messages for Ethena products. The company said the node had verified more than 10,000 messages and surpassed $3 billion in cumulative cross-chain volume as of Aug. 12.
Every message verified by the node had been delivered successfully, according to StablecoinX. Fees from the infrastructure service are based on processed volume rather than the number of individual transactions.
During July, the company began rolling out a second business line through its StablecoinX Harness middleware platform. The initial phase launched on July 2, and StablecoinX signed its first Harness client eight days later.
Harness is designed as a single application programming interface through which companies can access payment routing, cross-chain bridging, liquidity, treasury management, and institutional reporting tools. StablecoinX also opened applications for a design partner program covering payments and agents, blockchain networks and protocols, and institutional users.
A third business line, Distribution Services, is planned for 2027, subject to market and regulatory conditions. StablecoinX said the service would give investors indirect access to USDe and could generate distribution and management fees from deployed capital.
Ethena has expanded institutional access to USDe
StablecoinX’s original treasury plan began with a $360 million PIPE financing announced in July 2025. A further $530 million round disclosed in September brought committed PIPE funding to approximately $890 million, with YZi Labs, Brevan Howard, Susquehanna Crypto, and IMC Trading among the participants.
The financing agreements called for part of the proceeds to purchase locked ENA at a discount from an Ethena Foundation subsidiary. StablecoinX also entered a long-term collaboration agreement that allows it to acquire additional tokens directly from Ethena under agreed terms.
While the treasury gives StablecoinX a large position in Ethena’s governance system, its operating plan depends on demand for USDe and other products connected to the protocol. USDe uses crypto assets, hedged derivative positions, and other backing arrangements to maintain its target value, while holders of its staked form, sUSDe, can receive rewards.
By July 31, USDe supply had settled at approximately $3.9 billion, according to StablecoinX. The protocol’s backing ratio stood near 101.7%, while the annual percentage yield on sUSDe increased from 3.8% to 4.1% during July. Ethena has generated more than $800 million in cumulative protocol fees and distributed over $750 million in ecosystem rewards since its launch.
Institutional distribution has continued despite the decline from USDe’s previous supply peak. In June, BlackRock integrated USDe into Aladdin, allowing financial institutions using its investment management platform to access the synthetic dollar through existing portfolio and risk systems.
Coinbase also introduced an Ethena-powered lending vault in June. The product lets users lend USDC through Morpho markets while Ethena-related assets form part of the vault’s collateral structure.
Ethena has since added FalconX to an institutional lending program that already included agreements with Anchorage Digital, Maple Institutional, and Coinbase Asset Management. Ethena’s June governance report placed institutional lending at approximately $310 million, or 6.9% of USDe’s backing portfolio.

Why Minibus Hire at Geneva Airport is the Key to Summer Alpine Adventures

UK Authorities Continue Probe into Nigel Farage’s Crypto ‘Gifts’ after By-Election Win

The Prettiest Guest in Financial Audit History


-

 Fashion7 days ago
Weekend Open Thread: Mattifying Sunscreen
-

 News Videos6 days ago
Can Astrology Help Find Gold and Silver Trends? A Financial Astrology Guide
-

 Business5 days ago
Datadog: Best Of Breed For Multiple Reasons
-

 Tech7 days ago
Rinn Pharma & Biopharma to join NordicPharmaTrain network
-

 Business6 days ago
How to Start a Cleaning Business: A Step-by-Step Guide
-

 Business6 days ago
BDC Weekly Review: Private BDC Q2 Numbers Are Strong
-
 NewsBeat3 days ago
Communication cards help banking customers access services or report scams
-
 Business4 days ago
Oil Price Today (August 11): Crude oil rises to $88 after Trump’s compensation demand dents Hormuz opening. Here’s why
-
 Entertainment7 days ago
10 R-Rated Drama Movies That Can Be Called Masterpieces
-

 Fashion5 days ago
Amazon Sundays: Closet Care Before Fall
-

 Business7 days ago
SharkNinja Keeps Eating
-

 Politics6 days ago
Be quiet, Miriam! – spiked
-

 Business6 days ago
Mutual Fund Manager Scoops Up Beaten-Down Stocks
-

 Business5 days ago
5 Things You Must Know About Jorge Messi, the Father and Longtime Agent Who Shaped Lionel Messi’s Career
-

 Politics5 days ago
Ben-Gvir’s crocodile project halted but abuses at Ketziot Prison continue
-

 Politics7 days ago
Welsh independence campaign group YesCymru sets 2032 referendum target
-

 Tech7 days ago
Metabase SQLi zero-day exploited in customer data-theft attacks
-

 Politics5 days ago
The Church of England’s ruinous reparations racket
-
 Crypto World4 days ago
Why Did Nvidia Stock Fall on Monday Despite a $500 Billion Wall Street AI Deal?
-

 Politics6 days ago
Calls to permanently pedestrianise central Belfast following festival success
You must be logged in to post a comment Login