
Crypto World
UK Authorities Continue Probe into Nigel Farage’s Crypto ‘Gifts’ after By-Election Win

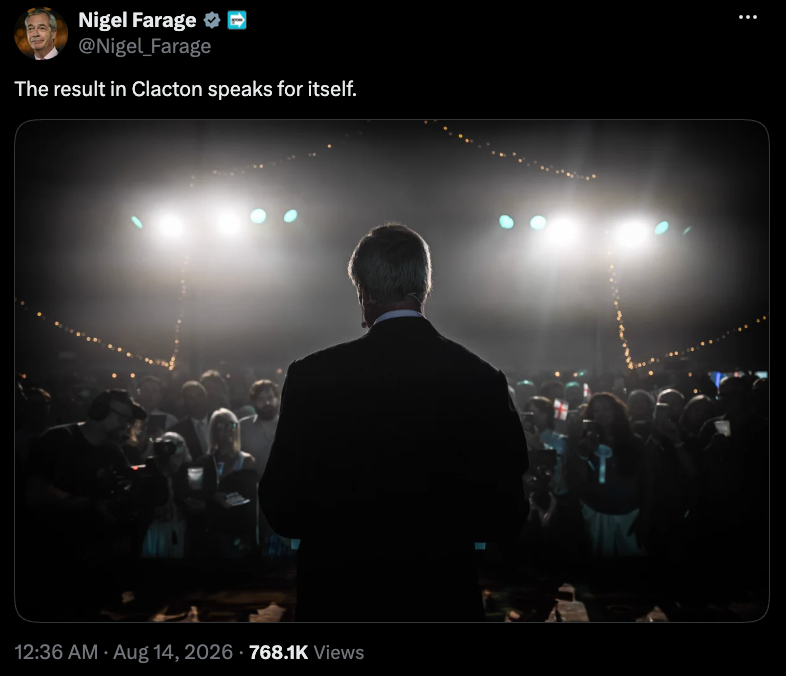
UK Reform leader Nigel Farage will face an investigation that had been briefly paused following his resignation from Parliament after winning a by-election on Thursday with no major party candidates participating.
As of Friday, the UK Parliamentary Commissioner for Standards website showed that Farage was currently under investigation for “failure to register an interest” related to the Reform leader receiving millions of dollars’ worth of donations and gifts from two figures tied to the crypto industry. The investigation was halted in July after Farage resigned as a member of Parliament, but resumed following his reelection as Clacton’s MP.
The commission will probe cryptocurrency billionaire Christopher Harborne giving Farage $6.7 million as well as the Reform leader’s staff and security funded by George Cottrell, a convicted fraudster tied to a crypto casino. Should the investigation determine that Farage violated parliamentary rules, he faces a possible suspension from parliament, which could trigger another by-election.
Under UK parliamentary rules, new members must register all current financial interests within a month of their election, as well as any benefits received in the 12 months prior. Farage initially called Cottrell’s donation a “reward” for campaigning for Brexit and later described both men’s contributions as “gifts” given “on an unconditional basis.”
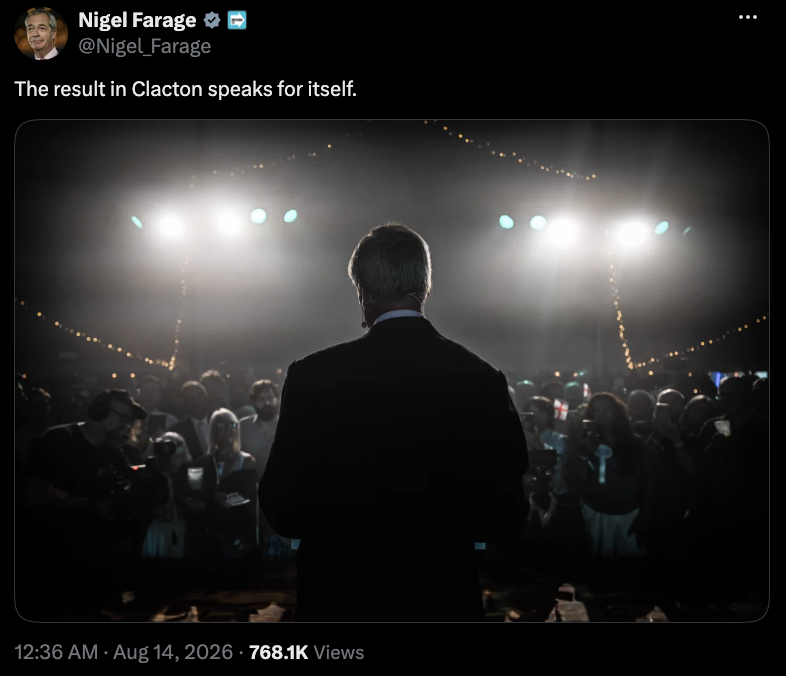
Source: Nigel Farage
The by-election triggered by Farage’s resignation in July saw the Reform leader winning with 63% of the vote, defeating satirical candidate Count Binface’s 27%. None of the other major parties participated in the race, which then-Labour leader and UK Prime Minister Keir Starmer called a “desperate stunt” by Farage. Andy Burnham has since become prime minister.
Related: Reform UK chair calls for probe into SBF-linked donation: Report
UK mulling permanent ban on crypto “gifts”?
Amid Farage’s political scandal, Labour lawmakers reportedly proposed that a moratorium on crypto donations implemented in March be made permanent as part of measures to address the potential influence of foreign actors.
According to the International Bar Association, unincorporated associations are allowed to give more than $675 directly to UK politicians, offering a loophole for companies with business in the country to be used as “conduits for foreign or dark money.”
Magazine: Inside the fake crypto startup that fooled North Korean IT workers


He said he had 3-D printed a gun and attached a silencer.
Mangione did not face murder charges in federal court. The federal judge on Friday set a hearing date of Dec. 18 for Mangione’s sentencing.
The guilty plea marks a remarkable shift in Mangione’s defense, as he had previously pleaded not guilty to all the federal and state charges he was facing.
Thompson’s family said in a statement shared with news outlets after the hearing on Friday that Mangione’s guilty plea “marks an important step toward justice for Brian and for our family.”
“While nothing will ease the pain of losing him, we are grateful that the federal justice system has held the person responsible for this heinous act accountable,” the family said. “Now we look to the court to ensure the sentencing reflects the severity of this crime.”
UnitedHealth Group, the parent company of United Healthcare, also shared a statement after Friday’s hearing, saying: “Brian Thompson’s life was cut short by an act of violence that devastated everyone who knew and loved him. We are grateful to law enforcement for bringing Brian’s murderer to justice, and our thoughts remain with Brian’s family and loved ones during this difficult time.”
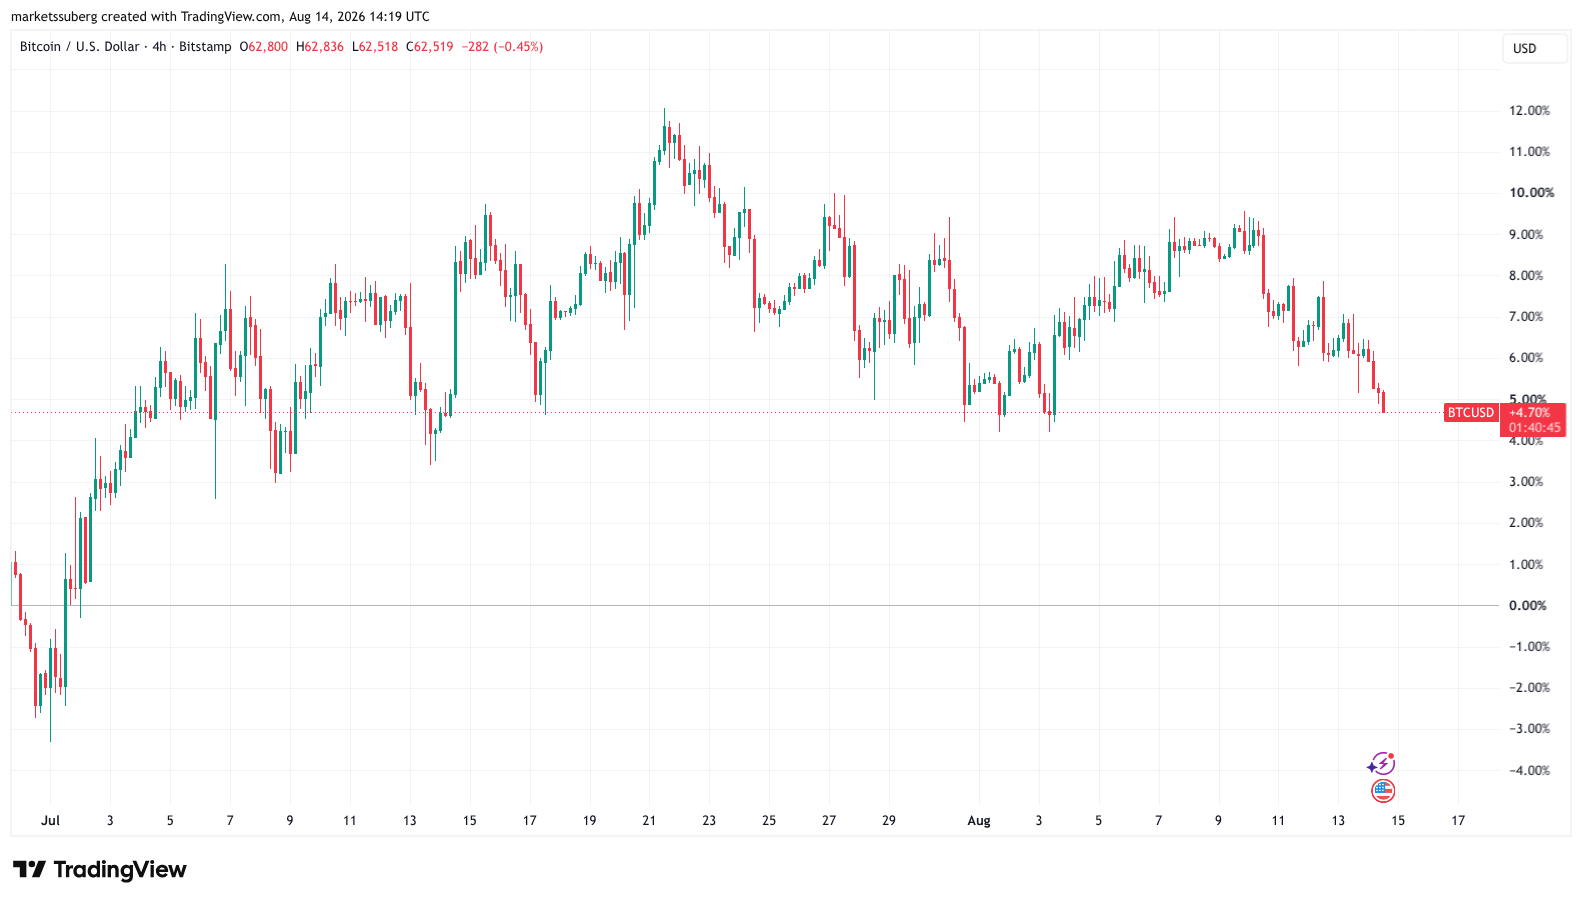
Bitcoin (BTC) declined into Friday’s Wall Street open as traders increasingly saw a BTC price breakdown next.
Key points:
- Bitcoin stays below $63,000, heading steadily closer to new August lows while US stocks build on record highs.
- Analysis says that $63,220 must be reclaimed by the weekly close to avoid a deeper rout.
- Markets look to PCE inflation data as the next key test for risk assets.
Bitcoin price sags with stocks at all-time highs
Data from TradingView showed BTC/USD down 1.3% on the day at $62,570, near its lowest levels month-to-date.
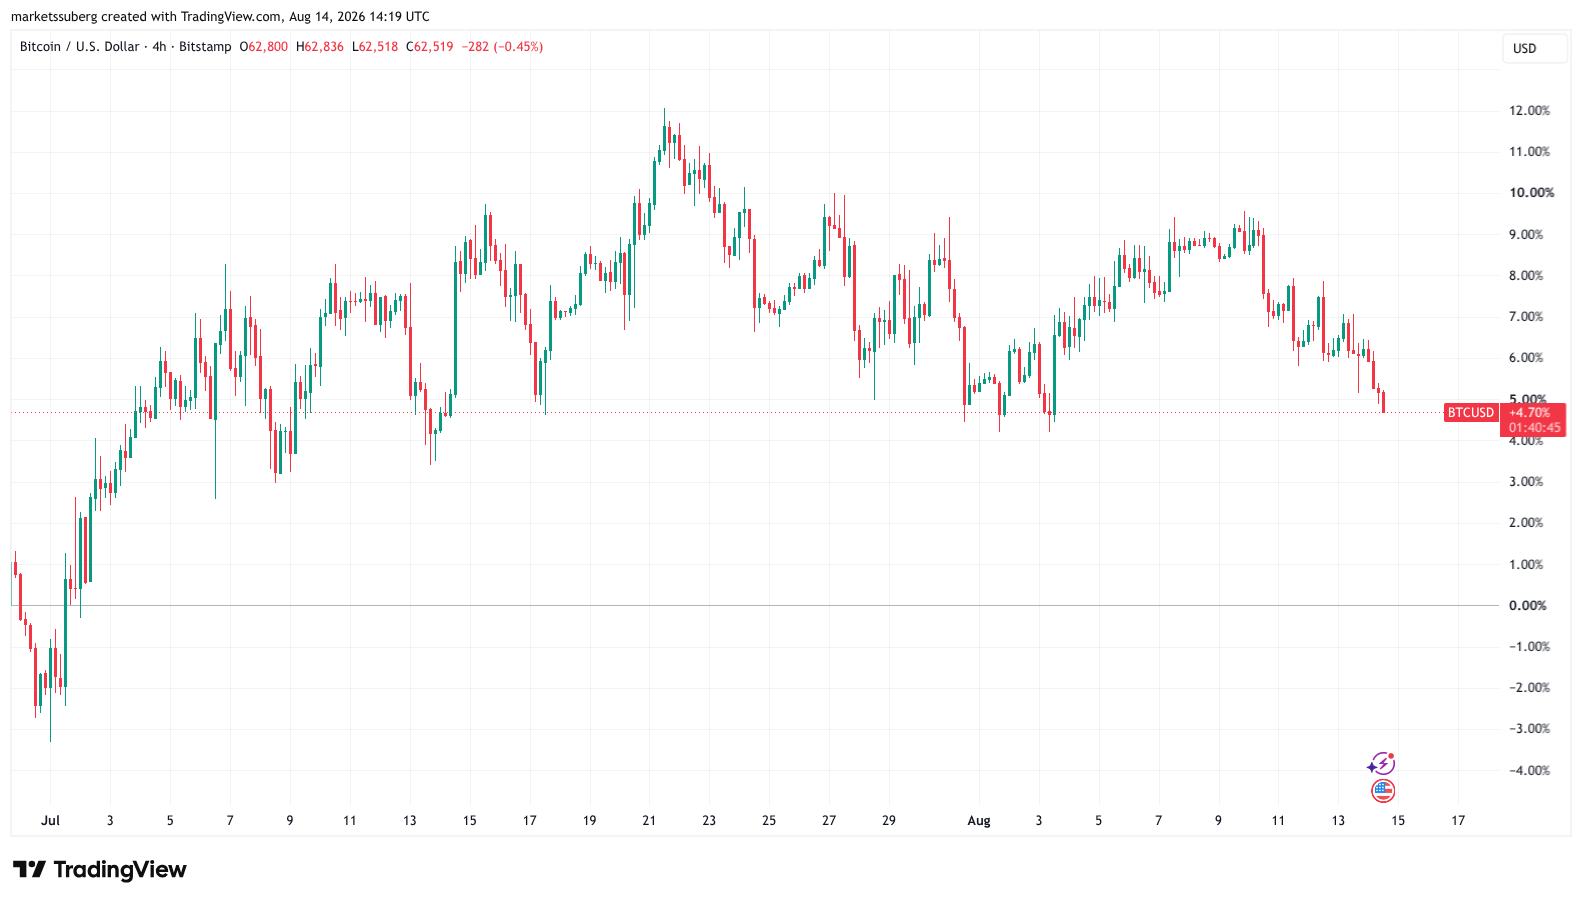
BTC/USD four-hour chart. Source: Cointelegraph/TradingView
Despite encouraging US inflation data lifting risk assets and reducing the odds of interest-rate hikes, Bitcoin failed to follow US equities, which closed Thursday’s session at all-time highs. The S&P 500 and tech-heavy Nasdaq Composite Index were both green at the time of writing, up 0.11% and 0.14%, respectively.
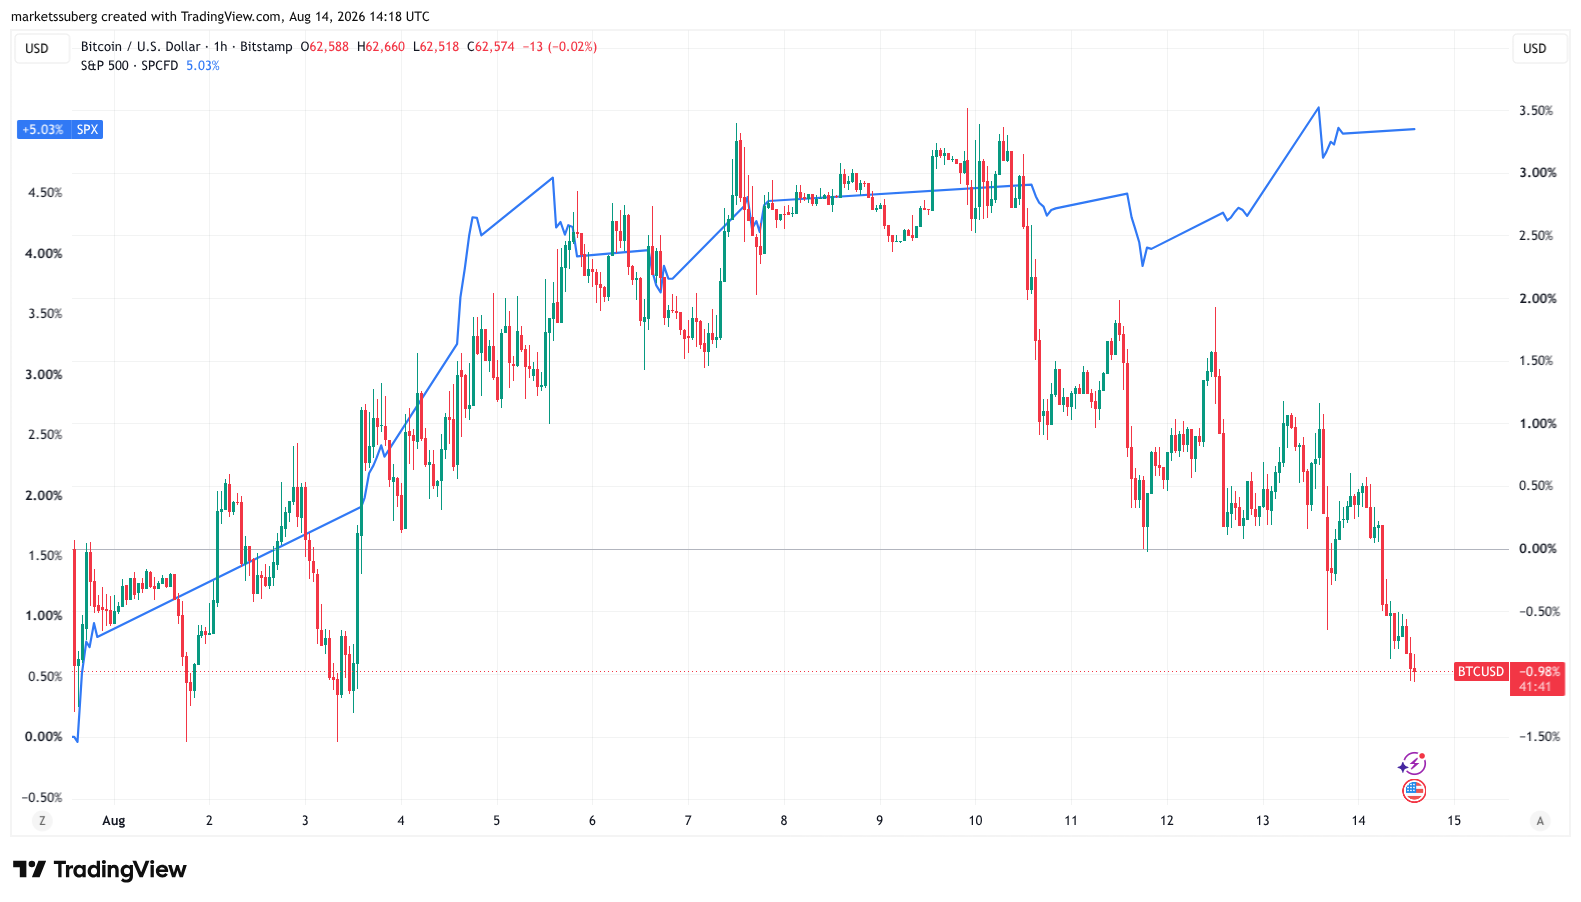
BTC/USD vs. S&P 500 one-hour chart. Source: Cointelegraph/TradingView
Commenting on Bitcoin price performance, trader and analyst Rekt Capital warned that Sunday’s weekly close needed to be above $63,220.
“A Weekly Close below the orange level would probably set price up for a breakdown,” he wrote in a post on X.
The analyst noted that $63,000 was now failing as support after weakening throughout August, having previously noted that the 50-month exponential moving average (EMA) at $65,827 was back as resistance, copying the 2022 bear market.
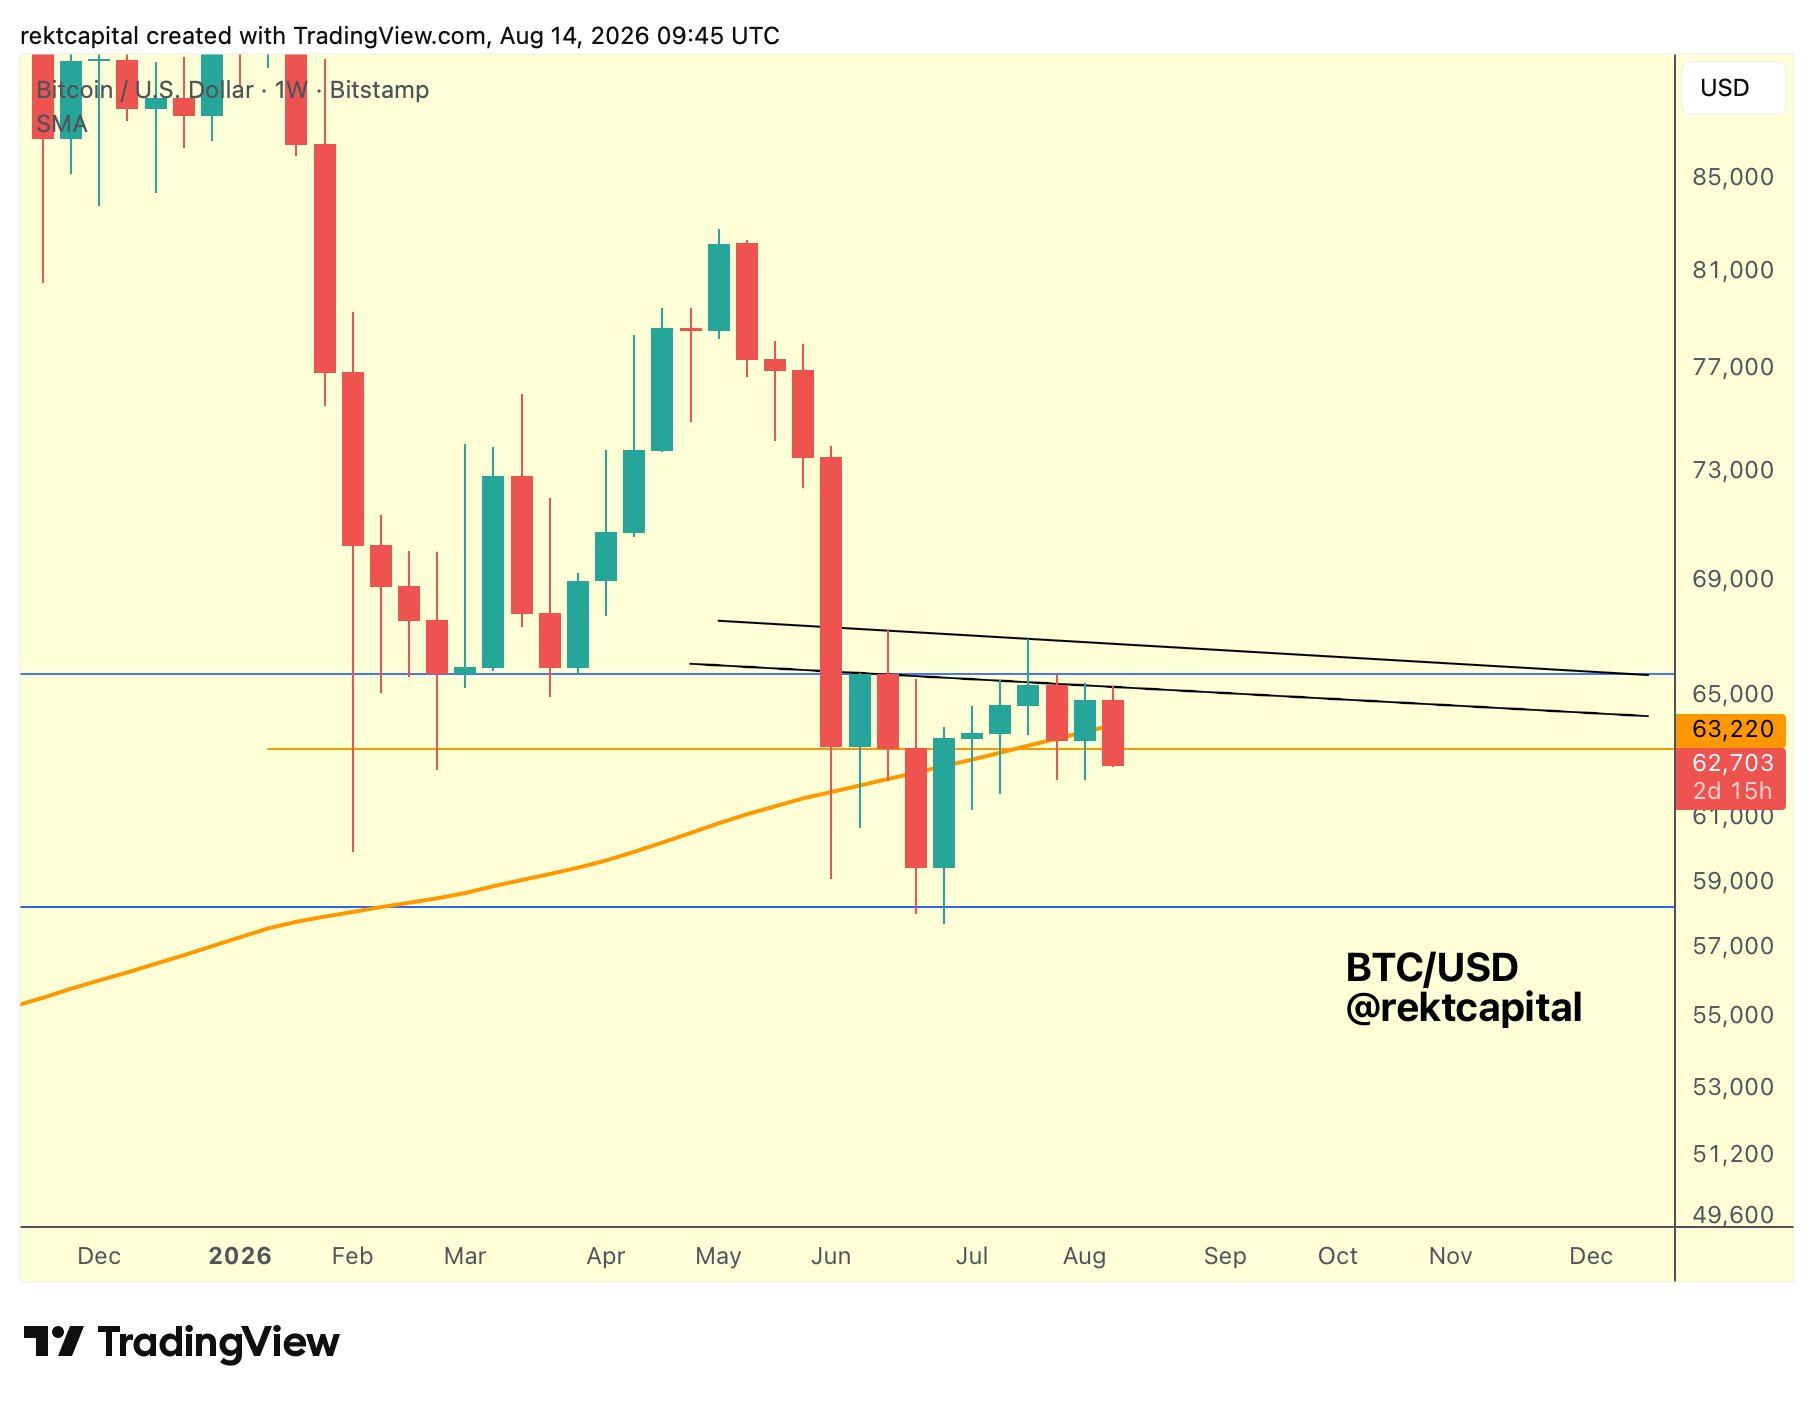
BTC/USD one-week chart. Source: Rekt Capital on X.com
Cointelegraph previously reported on increasing chances of a long liquidation event for Bitcoin as it approaches an area of liquidity around $61,000 amid growing open interest (OI) in derivatives markets.
“Traders have added substantial risk, most of it long, into a market that shows no matching demand,” onchain analytics platform Glassnode summarized in the latest edition of its regular newsletter, The Week Onchain.
PCE in focus after Bitcoin ignores inflation relief
In its latest analysis, trading and investment company QCP Capital drew attention to crypto markets’ refusal to rally on improving US inflation conditions — a phenomenon it described as “increasingly important.”
Related: Bitcoin speculators keep BTC price ‘pinned’ below $68.7K: Glassnode
“Last week, BTC demonstrated resilience in absorbing several negative headlines without a sustained breakdown,” it wrote, adding:
“This week has reinforced the distinction between resilience and momentum: the range remains intact, but softer inflation data have so far generated only a muted response from crypto.”
QCP added that macro traders are now focused on the Aug. 26 Personal Consumption Expenditures (PCE) index release, known as the Federal Reserve’s preferred inflation gauge. The index’s last print in July marked its first monthly decline since 2020, per data from the Bureau of Economic Analysis.
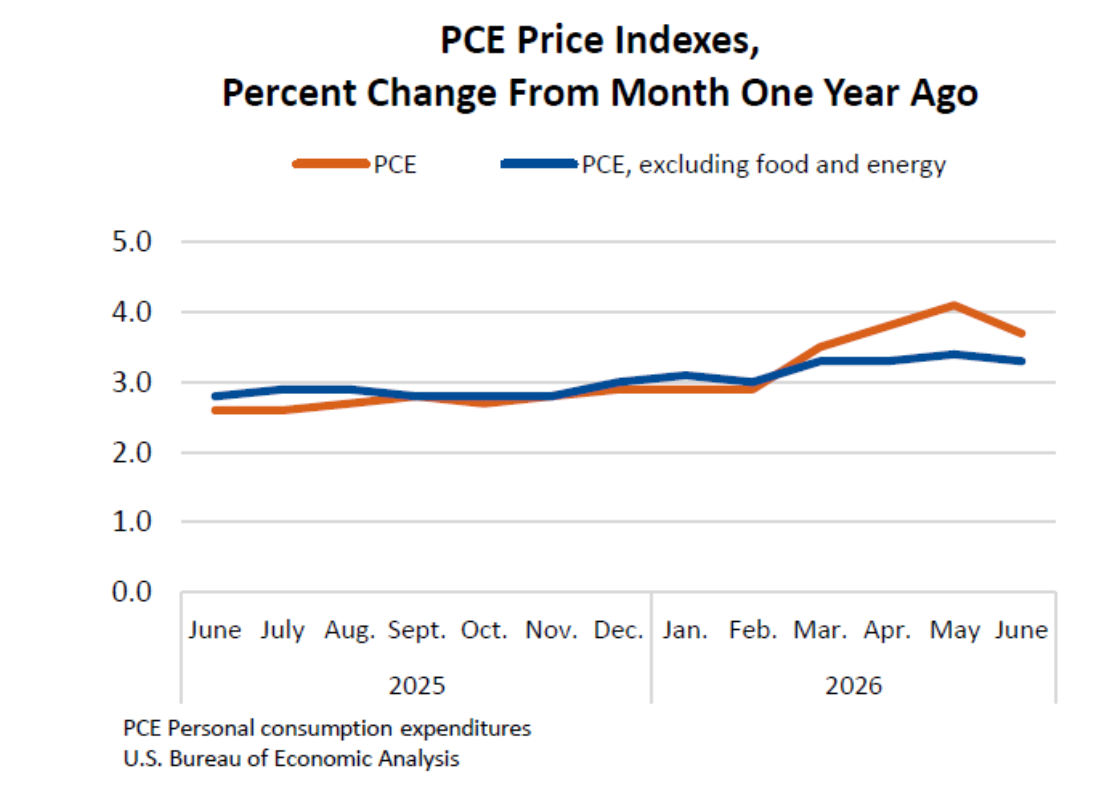
US PCE data percentage change (screenshot). Source: BEA
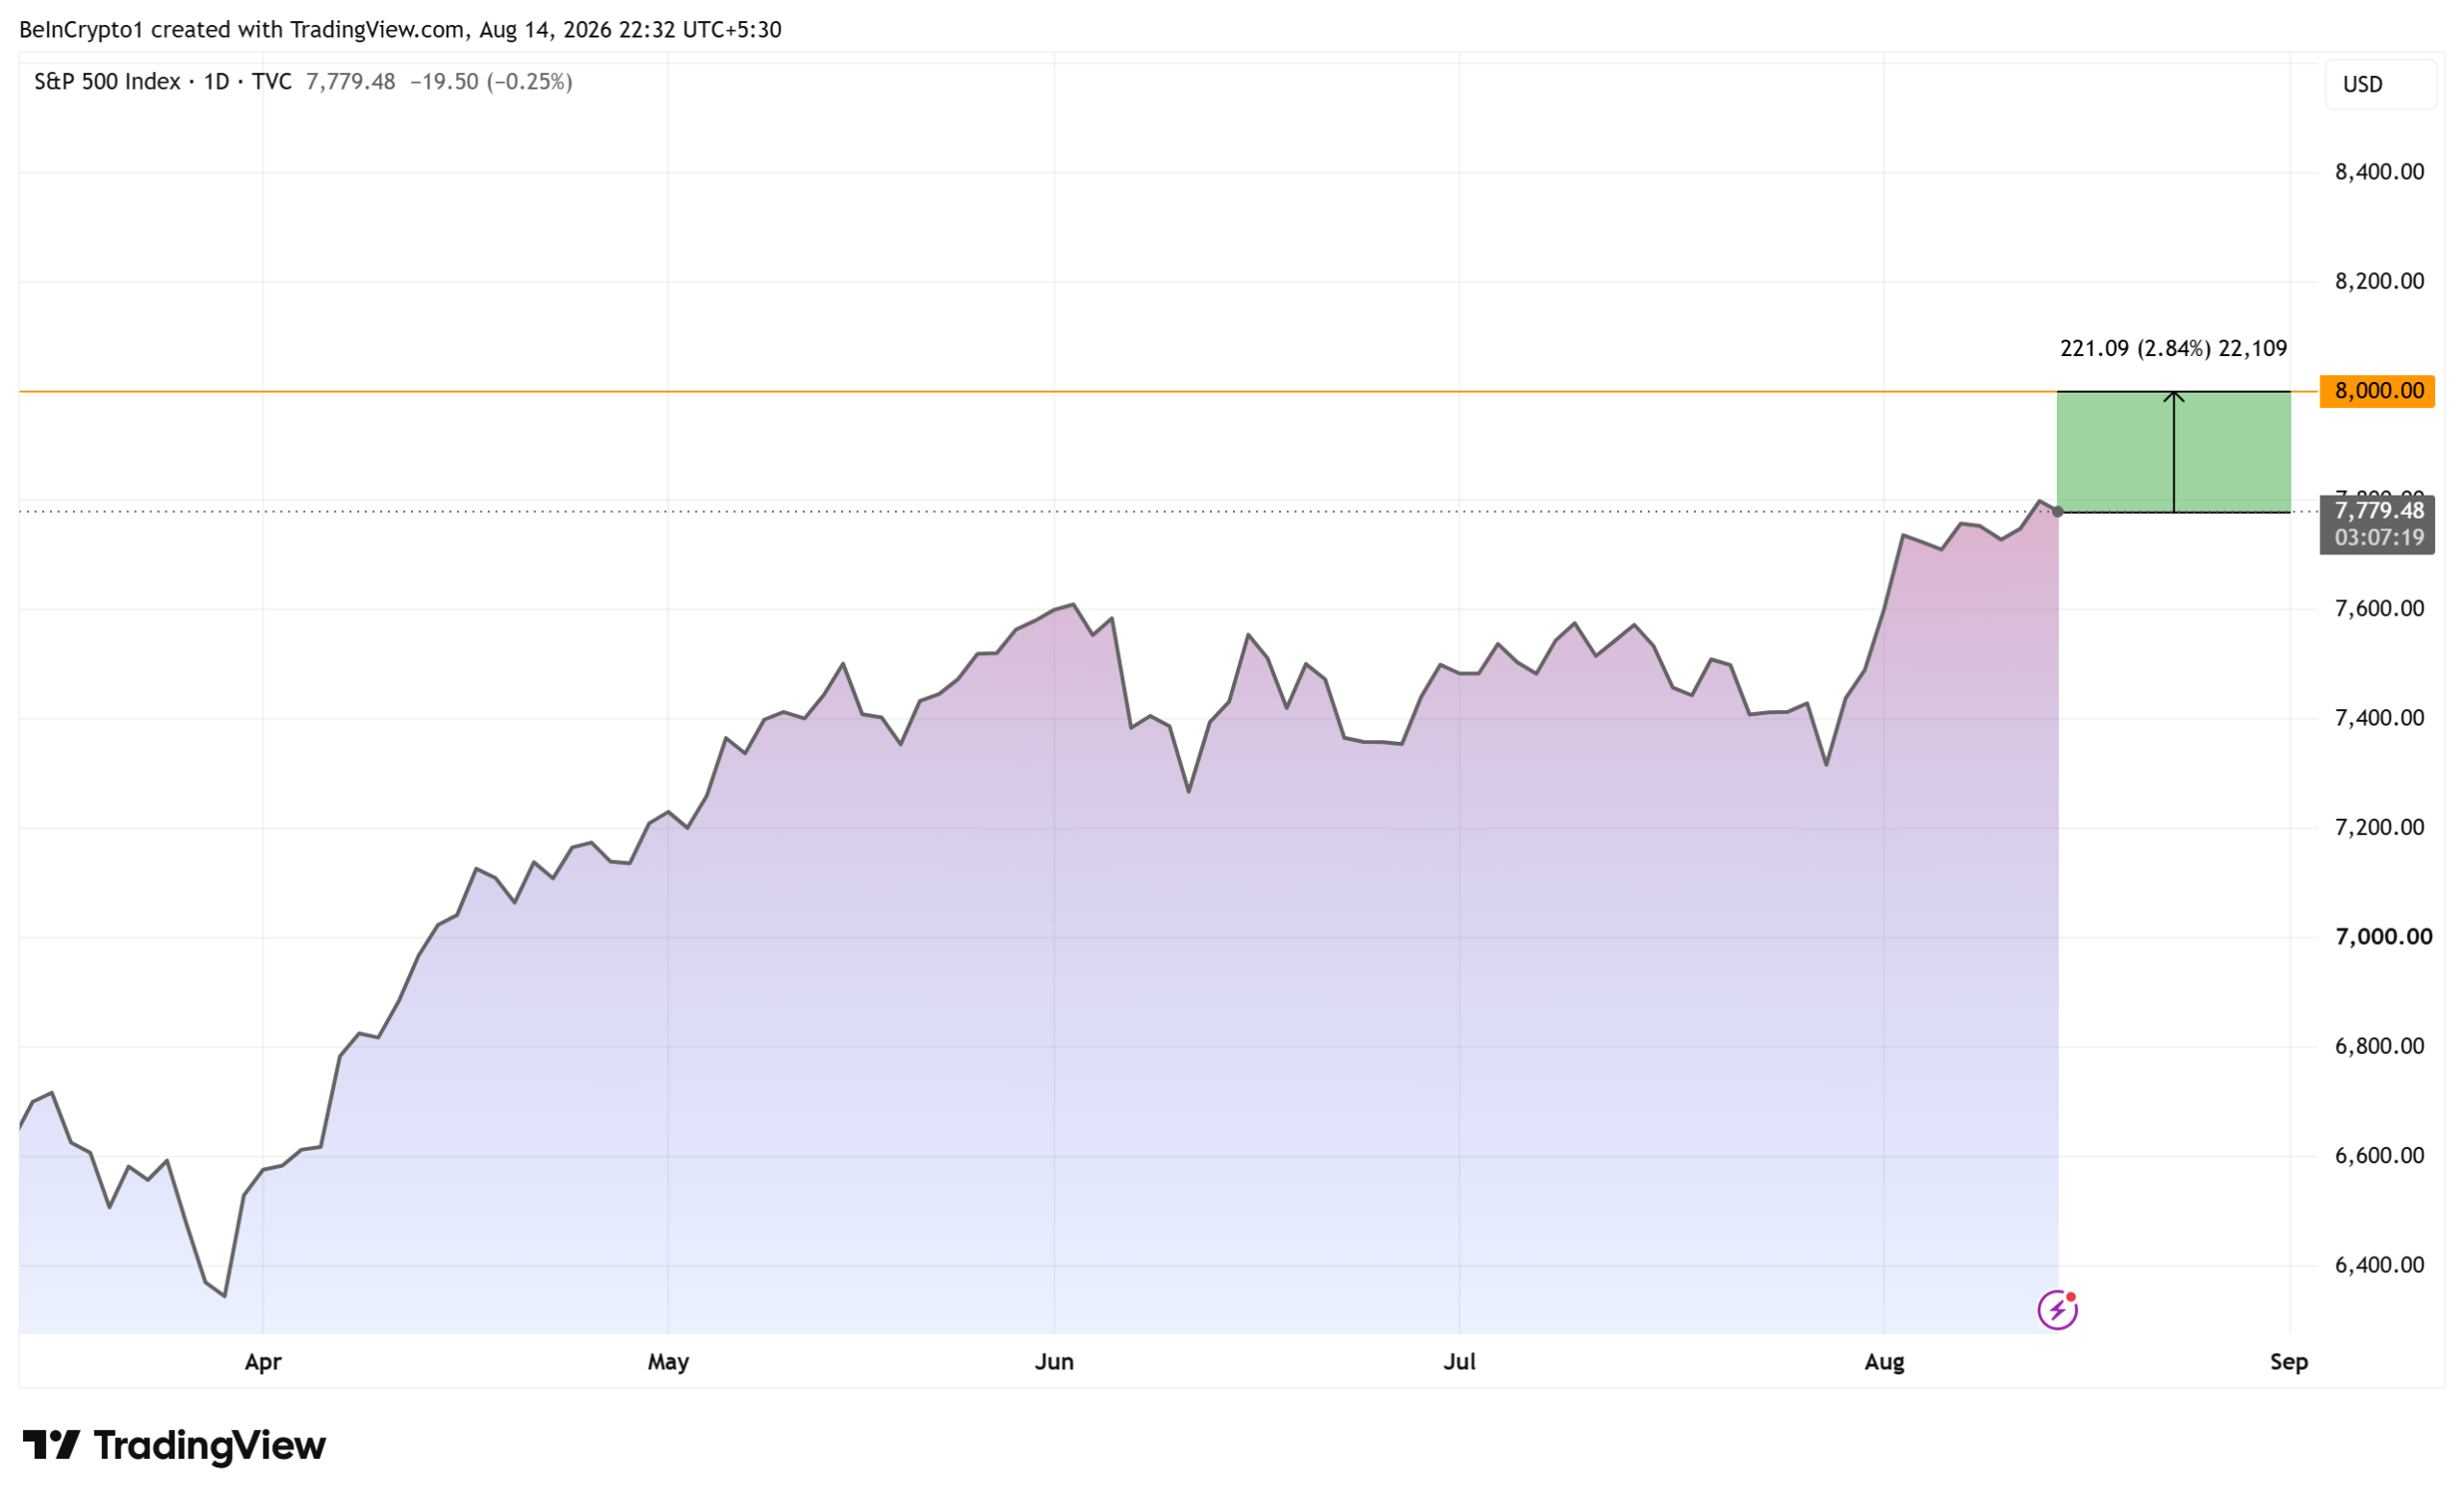
Fundstrat’s Tom Lee expects the S&P 500 to reach 8,000 by the end of August. He also expects a 10% correction, and he argues the market would be better off getting one.
Lee made the case on CNBC after a mild July inflation print lifted stocks to fresh records. Crypto investors watching from a $63,000 Bitcoin may find the argument uncomfortably familiar.
Why Tom Lee Wants a Correction Before Stocks Reach 8,000
Conditions look close to ideal for equity bulls. July consumer prices rose 0.1% on the month and 3.4% on the year, matching forecasts. Core inflation landed at 2.5% annually.
That print followed a weak July jobs report. Together they cut the odds of a September Federal Reserve rate hike to roughly 40%. The S&P 500 closed at a record on August 12, but Lee has not softened his target.
“I think the rally is quite healthy and it’s tracking to our view that we could get to 7,900, 8,000 by the end of the month,” Tom Lee, head of research at Fundstrat Global Advisors, speaking on CNBC.
The math behind that runs through earnings. Lee said 2027 estimates have climbed from about $395 at the start of reporting season to roughly $410 now. A 20 times multiple on $425 would point near 9,000.
The strength is exactly what bothers him. His client note laid out four named pullback risks. He expects the top of his own target range to mark the turn.

“The end of August getting to 8,000 is going to set us up for a period where stocks could disappoint even though underlying fundamentals are good.”
Follow us on X to get the latest news as it happens
Margin Debt Sits at the Top of His Warning List
Borrowed money is his first concern. Financial Industry Regulatory Authority (FINRA) data put margin debt at a record $1.53 trillion in June. That marked a 7.9% jump in one month and a 51.5% rise on the year.
The bond market is his second. Kevin Warsh became Fed chair this year and brought a new inflation framework with him. Investors have not settled on how to price it.
“Part of it is the margin debt’s gotten so big. Part of it is we still haven’t resolved how the market views Kevin Warsh and his new framework, whether the bond market’s going to have a tantrum.”
November midterm elections form the third risk. The fourth is SpaceX, where a staggered lockup expiry keeps releasing insider and employee shares. Lee has flagged that unlock schedule since early July. He grouped the four together as traps rather than reasons to sell.

Not everyone on the panel shared the caution. Courtney Garcia of Payne Capital argued earnings justify current prices. Healthcare, financials, and industrials have all outrun the index over three months, she said. In her view, AI capital spending concerns have faded as results came in.
Stephanie Guild of Robinhood landed closer to Lee. Easy credit rebuilds during rallies, she said, which sets up the next sharp drawdown even while fundamentals hold.
Subscribe to our YouTube channel to watch leaders and journalists provide expert insights
Bitcoin Already Took the Hit Lee Is Warning About
This is where the equity story turns awkward for crypto. Bitcoin (BTC) trades near $63,062, down 0.5% over 24 hours, with a market value of about $1.27 trillion. It remains the largest digital asset.

Stocks keep printing records while Bitcoin’s current price level sits far below its own peak. The leverage flush Lee wants for equities has already run through crypto, and it did not spare holders.
Lee made that point months ago. He argued crypto had already passed through a hidden crypto bear phase that few investors ever named. Short positioning at the time sat near levels typical of a bottom.
He also has capital behind the view. Lee chairs BitMine Immersion Technologies, a company that holds ether as its main treasury asset. He ranks Ethereum among rally leaders for the next leg higher.
His broader thesis rests on doubt rather than confidence. Many institutional clients still believe the AI trade is stretched or that earnings have peaked, Lee said. Trillions in cash also sit unspent on the sidelines. He treats that hesitation as fuel.
“So, I think that there’s people who are sort of keeping an eye on the end of the bull market, and I think that’s what’s keeping it healthy.”
The next two weeks test the first half of the call. If the S&P 500 tags 8,000 and then breaks, one question follows for crypto. Does an asset already down heavily fall further, or does it finally decouple?
The post Tom Lee Wants a 10% Crash Before S&P 500 Hits 8,000, Bitcoin Already Had One appeared first on BeInCrypto.

In the study, the researchers assembled a group of more than 9,300 people—some doctors, some other medical caregivers, some from the general population—and ran 14 different experiments on them. In one, 400 people were presented with two scenarios in which a friend visited a doctor complaining of menopause symptoms, including extreme fatigue, weight gain, and joint and muscle pain. In one of the scenarios, the doctor simply recommended medication to treat the symptoms. In the other, the doctor added, “I know this feels overwhelming, but I want to reassure you that these symptoms are normal…You could take daily prescription medication…or you can deal with these symptoms.”
A $116 million hardware wallet exploit has reopened one of Bitcoin’s oldest debates: Is holding your own keys worth the risk? Days later, US spot Bitcoin ETFs recorded their strongest inflows since April, prompting Bloomberg analyst Eric Balchunas to wonder whether security scares could eventually push more investors away from self-custody and toward ETFs.
Elsewhere, Strategy is preparing to resume Bitcoin purchases after a rare bout of selling, Riot Platforms is reportedly turning its mining infrastructure into a $9 billion AI deal, and Trump Media is rethinking its crypto treasury strategy after a $238 million quarterly loss.
Strategy CEO says company will resume Bitcoin accumulation this year
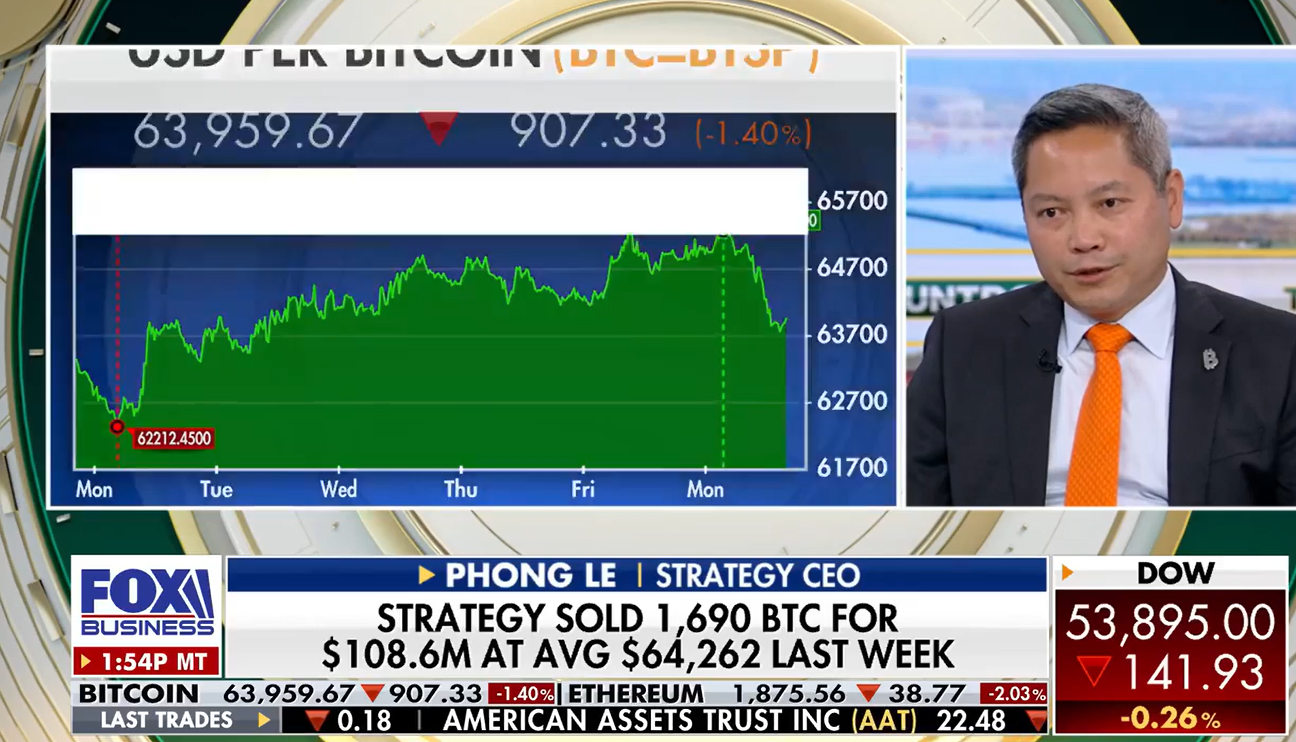
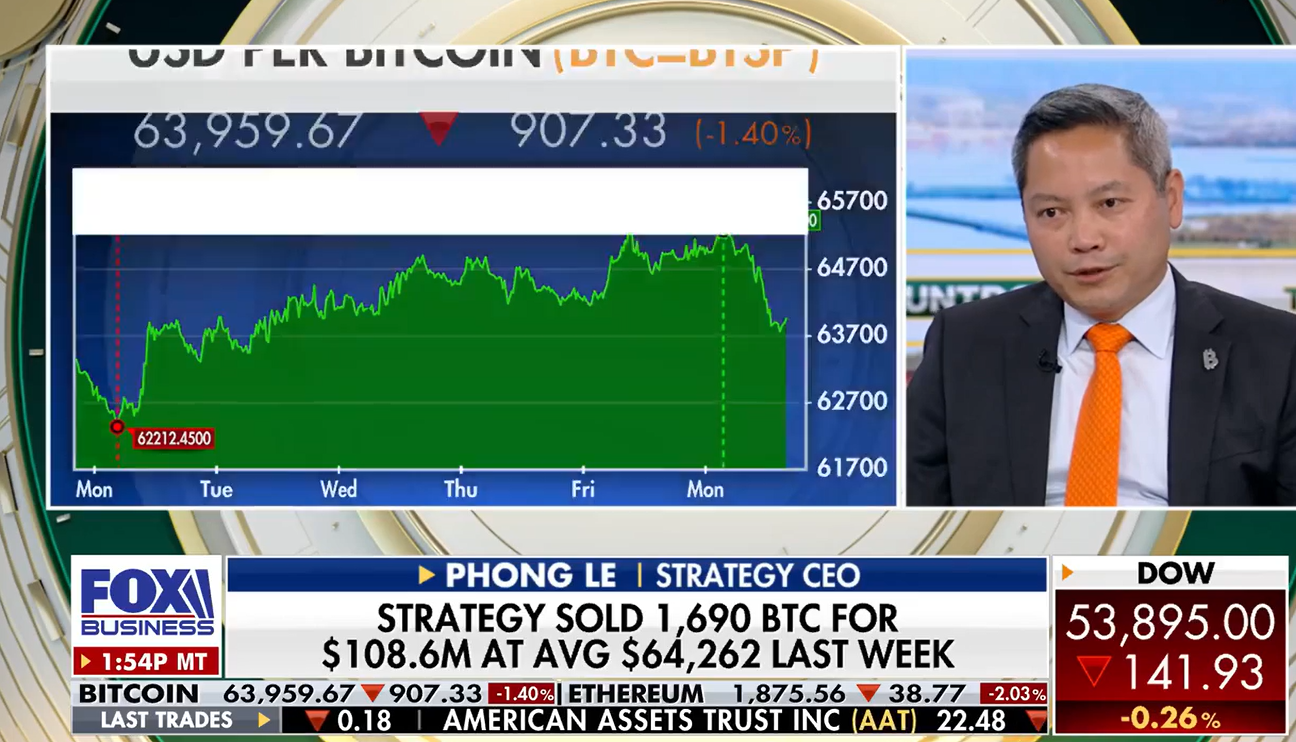
Strategy CEO Phong Le said the company plans to resume Bitcoin accumulation later this year, seeking to reinforce its long-term strategy after a series of relatively small sales drew scrutiny over its once-firm “never sell” stance.
Le told FOX Business that Strategy bought roughly 175,000 BTC and sold about 7,000 BTC this year — about 25 times more buying than selling. The company now holds more than 840,000 BTC, making it the largest institutional holder, but has sold Bitcoin on four occasions since May, most recently unloading 1,690 BTC to support preferred dividends, buybacks and its dollar reserve.
Those sales have highlighted the competing demands facing Strategy as it balances its Bitcoin accumulation strategy with obligations to common and preferred shareholders. The treasury model has also come under pressure. According to Novaque Research, when companies trade below Bitcoin net asset value, raising capital becomes increasingly dilutive and the financing cycle harder to sustain.
Phong Le appearing on FOX Business. Source: FOX
Bitcoin ETF demand rebounds as self-custody risks come into focus
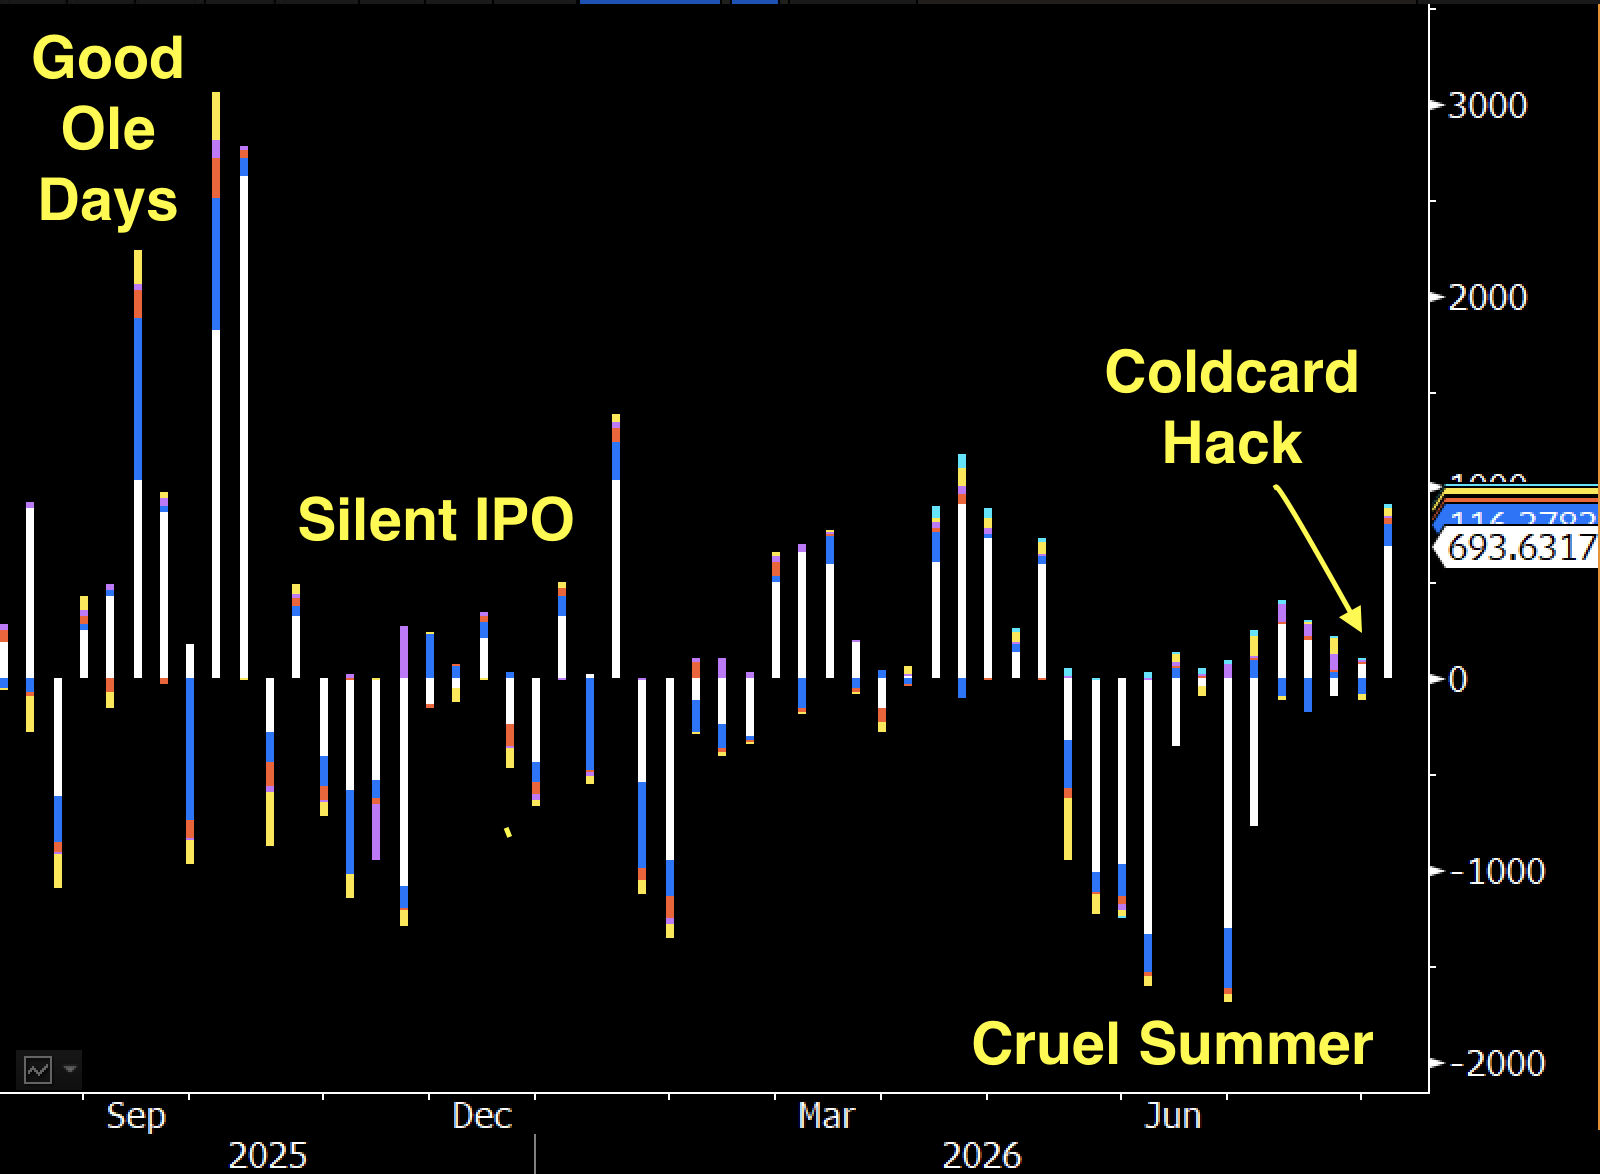
US spot Bitcoin ETFs attracted roughly $1 billion in net inflows for the week, signaling renewed institutional demand even as Bitcoin’s price remains subdued and a major hardware wallet exploit puts fresh attention on the risks of self-custody.
Bloomberg ETF analyst Eric Balchunas said it was the third-best week since October, a period he described as Bitcoin’s “silent IPO,” a term popularized by investor Jordi Visser. The theory holds that early investors have been selling into growing ETF and institutional demand, creating enough supply to keep Bitcoin subdued despite fresh capital entering the market.
The rebound also followed a Coldcard hardware wallet exploit linked to faulty key generation that drained about $116 million in Bitcoin. Balchunas said the incident could ultimately bolster ETFs’ appeal among investors concerned about self-custody risks, pointing to post-hack inflows as a possible, though unproven, connection.
He cautioned that correlation does not imply causation, but added that “long-term I can’t imagine there aren’t some who migrate over.”
Source: Eric Balchunas
Anthropic reportedly struck a $9 billion compute deal with Bitcoin miner Riot
Anthropic reportedly struck a $9 billion deal with Riot Platforms for 191 megawatts of capacity from the Bitcoin miner’s Texas campus, highlighting how access to power is becoming increasingly valuable as AI data centers face capacity constraints.
Riot said it secured a 20-year agreement to supply 191 megawatts from its Rockdale campus to a “leading frontier AI” company, which Bloomberg identified as Anthropic. The deal follows Anthropic’s $19 billion TeraWulf data center lease and adds Riot to a growing list of Bitcoin miners expanding into AI, including Bitdeer, CleanSpark, MARA Holdings, Core Scientific, Hut 8 and IREN.
Riot shares fell 5.4% Monday before rising 21% overnight and are up roughly 50% year-to-date. The fourth-largest Bitcoin miner has a $7.33 billion market capitalization, while Bernstein said partnerships between AI companies and miners could help address the power crunch constraining data center expansion.
Trump Media to revamp crypto treasury strategy after $238 million Q2 loss
Trump Media said it will revamp its digital asset treasury strategy after unrealized losses on crypto and securities helped push the company to a $238 million second-quarter net loss, highlighting the balance-sheet risks of corporate crypto holdings.
The company reported $190.4 million in unrealized losses across its digital assets, and pledged digital assets and equity securities in the second quarter. It held 9,477.16 Bitcoin as of June 30, down from 9,542.16 the prior quarter. In July, it sold $159.6 million in Bitcoin-related securities and used the proceeds to buy more Bitcoin, bringing its holdings to about 14,139 BTC worth $890.5 million by July 31.
Trump Media warned that generating additional income from its Bitcoin holdings could expose it to counterparty risk, particularly if a partner should default or become insolvent. In some cases, the company could be unable to recover Bitcoin committed under unsecured arrangements. It also plans to direct more resources to Truth Social, Truth+ and other media operations as part of a broader shift in capital allocation.
Crypto Biz is your weekly pulse on the business behind blockchain and crypto, delivered directly to your inbox every Thursday.
Crypto World
Bullish (BLSH), Coinbase (COIN), Circle (CRCL) slide as SEC delay weighs on tokenization trade


The moves followed CoinDesk’s report late Thursday that the Securities and Exchange Commission (SEC) was set to further delay its anticipated “innovation exemption,” which is expected to make it easier for companies to offer trading in tokenized securities. Concerns from the White House and Wall Street over the proposal’s legal footing and potential market impact have held up the plan.
Adding to the uncertainty, the SEC canceled a meeting scheduled for Friday where commissioners planned to consider whether to propose new rules creating a tailored offering regime for certain investment contracts involving crypto assets.
The impact wasn’t limited to stocks. The innovation exemption had also been expected to provide some regulatory relief for trading through decentralized finance venues, meaning the delay reaches beyond publicly traded tokenization companies. Uniswap’s UNI (UNI), the native token of the decentralized exchange, fell 7% over the past 24 hours, making it the weakest performer in the CoinDesk 20 Index both Friday and this week.
For comparison, the Nasdaq 100, S&P 500 and bitcoin were all mostly flat during the day.
A ‘speed bump,’ not the end of the tokenization trade
The setback could stretch out the timeline for U.S. tokenization, but it doesn’t necessarily change the longer-term story, according to Owen Lau, managing director and senior analyst at Clear Street.

Bitcoin traders are entering a tense stretch as leveraged long positions come under pressure, with onchain analytics suggesting that a broader liquidation “cleanout” may be starting. According to CryptoQuant analysis published Thursday, the interaction between Binance futures open interest and BTC/USD price has shifted in a way that often accompanies long positions being stopped out or liquidated.
At the same time, CryptoQuant CEO Ki Young Ju warned that the conditions typically associated with a renewed Bitcoin bull market have not yet fallen into place—an important reminder for investors who may be betting on a quick rebound after consolidation.
Key takeaways
- CryptoQuant analysis links the latest BTC downside move with signs of leveraged long positions being flushed out via Binance open interest dynamics.
- The price-to-open-interest correlation reportedly fell to 0.25 after both price and open interest declined, consistent with weakening longs.
- CryptoQuant data previously showed Binance open interest rising while BTC traded in a narrow range, pointing to leverage building during consolidation.
- CoinGlass data showed $236 million in total cross-crypto liquidations over the prior 24 hours at the time of writing.
- Ki Young Ju says a sustained bull-market setup has not materialized yet, with key onchain indicators still in “bear” territory.
Binance open interest signals a leveraged long squeeze
CryptoQuant’s Thursday analysis, authored by community analyst “BorisD,” focuses on Binance open interest (OI) and its relationship with BTC price action. Open interest reflects total active derivative positions—longs and shorts combined—and is often used as a proxy for how much capital is committed to leveraged trading.
While BTC traded in a relatively tight range after June, CryptoQuant data showed Binance open interest climbing gradually, reaching $8.15 billion on Wednesday. In the analyst’s framing, this rise suggested futures activity was increasingly dominating while spot participation lagged, creating conditions where leveraged positioning could become vulnerable if price broke down.
As lower time frames started showing downside volatility, CryptoQuant said the price-to-OI relationship shifted into a “flux” state. The key idea: when price falls while open interest stays elevated or rises, it can indicate that traders are doubling down on exposure—sometimes turning into a rapid liquidation cascade if the move accelerates.
“Initially, as the price fell, the correlation shifted to the negative side, indicating that OI was rising despite declining prices,” the analyst wrote. “This showed a double-sided squeeze and [an] increasingly complex liquidity structure — driven by long positions trying to buy the dip on one end, and additional short positions entering the market on the other.”
CryptoQuant’s latest correlation reading reportedly came in at 0.25. In the analysis, that number is presented as evidence of declining long positions as BTC continues to move lower—supporting the view that the market is moving toward the “anticipated cleanout” phase.
From correlation shift to liquidation risk
CryptoQuant’s interpretation ties the recent correlation behavior to the fate of leveraged longs. The analyst said the “simultaneous drop in both price and OI” typically points to longs “giving up,” being stopped out, or getting liquidated—especially when downside volatility increases.
While open interest alone does not specify whether liquidations are primarily long- or short-driven, combining it with price direction can help traders anticipate where forced exits may concentrate. In this case, the analysis emphasizes long exposure vulnerability as BTC approaches lower levels seen earlier in August.
Market-wide liquidation pressure also appeared to be present. According to CoinGlass liquidation data (reported via a screenshot in the original analysis), total cross-crypto liquidations were $236 million over the prior 24 hours at the time of writing, underscoring that the broader ecosystem was not immune to leverage unwinds.
Why this matters after range trading
One reason the Binance OI story is taking center stage is that it follows a period of relatively tight trading. When price compresses, leverage can build quietly—especially if futures markets attract more participation than spot. CryptoQuant’s earlier observation that Binance OI increased while BTC stayed within a narrow range aligns with that pattern.
For investors and traders, the practical implication is that a breakout does not always arrive in a smooth, orderly way. When range-bound conditions end—particularly after rising open interest—liquidations can amplify the direction of the move as positions fail and traders scramble to reduce risk. CryptoQuant’s commentary suggests that this kind of acceleration may be underway as BTC/USD heads toward fresh month-to-date lows.
However, the analysis also implies uncertainty about timing and magnitude. The correlation metric provides a signal about what is likely happening in positioning, but it does not guarantee whether the market will continue sliding immediately, rebound quickly, or enter another brief consolidation before the next leg.
CryptoQuant CEO: bull-market conditions still not in place
Even if liquidation-driven volatility creates opportunities for tactical entries, sentiment cues from onchain leaders remain cautious. In his latest market commentary, CryptoQuant CEO Ki Young Ju said that the “stars haven’t aligned” for a Bitcoin bull run yet.
Ju framed his view using a “basket of onchain indicators,” which he described as still residing in “bear” territory. Earlier coverage from Cointelegraph had similarly cited composite onchain metrics reaching prolonged “capitulation” conditions; one example referenced at the time was Glassnode’s view that Bitcoin is in its longest “capitulation” phase since the end of the last bear market in 2022.
Taken together, the message is two-sided: liquidation dynamics can force near-term downside and create mechanical market pressure, while the bigger question—whether investor behavior and onchain signals have shifted into a durable accumulation phase—remains unresolved.
Traders should watch whether Binance open interest continues to contract alongside price (which would be consistent with longs being removed) or whether OI stabilizes even as price tries to recover. At the same time, investors looking for a bull-market shift should monitor whether the onchain indicator “bear” conditions that Ki Young Ju referenced begin to improve, rather than relying solely on short-term volatility swings.
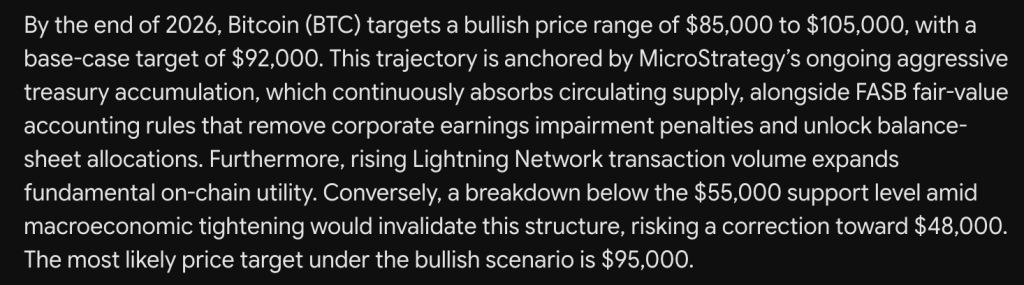
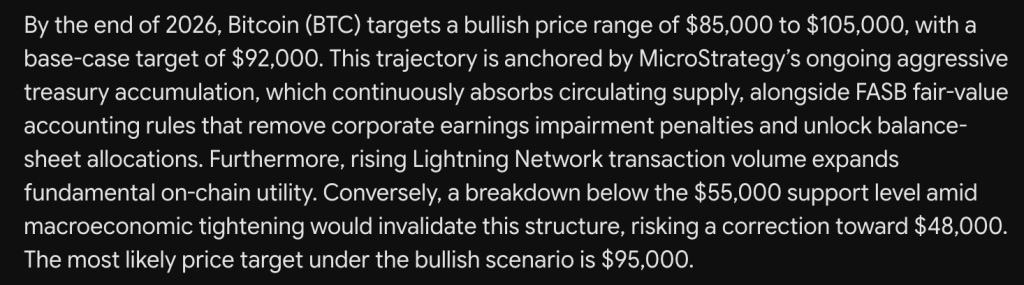
An accounting rule change might be the most underrated catalyst on this list. Google Gemini AI predicts it will help carry Bitcoin to $85,000 to $105,000 by the end of 2026, and the price prediction settles on a $92,000 base case, with $95,000 as the most likely outcome.
Corporate accumulation sits at the center. Gemini points to ongoing aggressive treasury buying that continues to absorb circulating supply.
FASB fair-value accounting rules make that easier. They remove earnings impairment penalties that previously punished companies for holding a volatile asset.
That unlocks balance-sheet allocations that were previously blocked. Finance teams no longer face write-downs on paper losses they never realized.
Lightning Network transaction volume adds utility to the layer. Rising throughput there expands fundamental on-chain activity beyond storage alone.
The bear case has one clear trigger. A breakdown below $55,000 support amid macroeconomic tightening would invalidate the entire structure.
That scenario risks a correction toward $48,000. Gemini treats the level as the dividing line rather than a soft warning.
Everything above it keeps the bullish path intact. Everything below it completely changes the picture.

Bitcoin Price Prediction: An Accounting Rule Quietly Opened Corporate Treasuries, What’s Next For Gemini AI Predicts?
The chart shows a market well past its highs. Bitcoin peaked near $126,000 last October before the trend gave way.
November dragged the price down from $116,000 toward $82,000. A December recovery reached $98,000 and failed.
February brought the capitulation move to roughly $59,000. Spring rebuilt strongly toward $83,000 by May.
June erased that again, marking the low near $58,000. July recovered to the mid-$60s before stalling.
The close reads $62,964, down 0.72% and $454 on the session. The daily range covered $62,879 to $63,553.
Support sits at $62,000, then $58,000 and $55,000, as the line Gemini flags. Resistance appears at $66,000, then $70,000 and $76,000.
RSI reads 42.74 with its signal line above at 48.99. The oscillator trails by more than 6 points, showing momentum rolling over after the July bounce.
Both readings sit below the midline. Sellers have regained the edge in the short term.
Gemini’s base case needs roughly 46% from here. Holding $58,000 is what keeps that conversation alive at all.
Trade Ethereum on Bybit and Get a Chance to Win Our $1,000 USDT Airdrop
Bitcoin Needs Corporate Buyers. LiquidChain Needs Far Less Capital to Move
Bitcoin’s path to $95,000 depends on increasingly large pools of capital continuing to absorb supply. That works at scale, but it also means every new leg higher requires billions more to make a visible difference.
LiquidChain sits at the opposite end of that equation.
The project is building a single execution layer across Bitcoin, Ethereum, and Solana, targeting one of DeFi’s most persistent problems: liquidity and applications trapped inside separate ecosystems. Instead of forcing users to go through repeated bridges, fees, and fragmented deployments, LiquidChain is designed so that a single deployment can reach all 3 networks.
At a presale price of $0.01454 with just over $938,000 raised, it does not need Bitcoin-sized inflows to reprice dramatically. That is the asymmetry: infrastructure solving a real multi-chain problem while the market cap is still small enough for early capital to matter.
Explore the LiquidChain Presale
The post Google Gemini AI Predicts Bitcoin Price by the End of 2026 appeared first on Cryptonews.

UK Reform leader Nigel Farage is facing an ongoing probe by the UK Parliamentary Commissioner for Standards over an alleged failure to register certain financial interests tied to crypto-linked donations. The investigation, shown on the Commissioner’s website as of Friday, was briefly paused after Farage resigned his seat following his July exit from Parliament, but restarted after his return as Member of Parliament for Clacton.
According to the Parliamentary Commissioner for Standards’ public register of allegations currently under investigation, the concern centers on whether Farage properly disclosed interests related to receiving millions of dollars’ worth of donations and gifts connected to two figures in the crypto sphere. The scrutiny could carry consequences under UK parliamentary rules, including potential suspension from Parliament.
Key takeaways
- Farage is under investigation for “failure to register an interest,” according to the UK Parliamentary Commissioner for Standards.
- The probe relates to crypto-linked giving from Christopher Harborne, described in reporting as worth $6.7 million, and to funding connected to Farage’s staff and security.
- Under UK rules, MPs must register current interests within a month of election and disclose relevant benefits received in the prior 12 months.
- If the investigation finds a breach, Farage could face suspension—potentially triggering another by-election.
- The political fallout has also reignited UK discussions about whether to restrict “crypto gifts” to prevent possible foreign influence.
Why the standards investigation is back on
The Parliamentary Commissioner for Standards’ allegations page currently lists Farage as being investigated for failing to register an interest tied to donations and gifts from individuals connected to the crypto industry. The investigation had been halted in July after Farage resigned from Parliament—an action that followed earlier reporting on the donation controversy—before resuming after he was reelected as MP for Clacton.
Farage’s return came after a by-election in which he secured a commanding victory. Earlier coverage of the July by-election reported he won with 63% of the vote, defeating satirical candidate Count Binface’s 27%, and that none of the other major parties participated in the race.
What the probe is expected to examine
While the standards record frames the issue as a failure to register an interest, the substance of the inquiry is tied to specific arrangements and the timing of disclosure.
The Commissioner’s listing—alongside related reporting—points to the alleged gifts and benefits potentially received by Farage and his operations. Reporting cited in the article states the probe will consider:
- Crypto billionaire Christopher Harborne giving Farage $6.7 million.
- Farage’s staff and security being funded by George Cottrell, described in reporting as a convicted fraudster tied to a crypto casino.
The relevant UK framework requires newly elected MPs to register financial interests within one month of their election. They are also expected to report benefits received in the 12 months preceding their election.
Farage’s stated characterization of the gifts
The underlying dispute is not only about whether the interests were disclosed, but how they were described and treated under parliamentary expectations. Reporting referenced in the source article notes that Farage initially characterized Cottrell’s donation as a “reward” for campaigning related to Brexit and later referred to both men’s contributions as “gifts” provided “on an unconditional basis.”
Those descriptions may matter because the standards process focuses on registration obligations rather than intent alone. The central question for the Commissioner will be whether the benefits required disclosure were entered into the register correctly and within the required timeframe.
Potential parliamentary consequences
If the investigation concludes that Farage breached parliamentary rules, the sanctions can be significant. The possible outcome highlighted in the reporting includes suspension from Parliament, which would likely trigger another by-election.
Cointelegraph attempted to obtain comment from the Parliamentary Commissioner for Standards on the probe but did not receive an immediate response.
Beyond Farage personally, the case also underscores the scrutiny UK lawmakers face around political donations and gifts—particularly when the money originates from complex, cross-border financial ecosystems that include crypto businesses.
Broader pressure to tighten crypto donation rules
The investigation has arrived amid renewed policy debate inside the UK. The source article states that Labour lawmakers have reportedly proposed making a previously discussed moratorium on crypto donations permanent—originally linked to measures announced in March—to address concerns about the potential influence of foreign actors.
That discussion is set against guidance referenced from the International Bar Association. According to the source, unincorporated associations are allowed to give more than $675 directly to UK politicians, a structure that the IBA has described as creating a potential loophole. The concern, as characterized in the reporting, is that such arrangements could be used as conduits for “foreign or dark money.”
Whether any new rules ultimately address the issues raised by the Farage investigation may depend on how regulators and lawmakers define “crypto gifts,” determine how they should be valued, and decide which entities must be considered when mapping beneficial ownership and control behind donations.
For investors, builders, and users watching UK policy, the next step is the standards investigation’s findings: what the Commissioner decides about disclosure timing, the classification of benefits as registrable interests, and whether this case drives faster regulatory action on crypto donations. Until the probe reaches a conclusion, the practical uncertainty is likely to remain—both for individual politicians and for the wider political fundraising rules that govern crypto-linked money.
Inner Circle Trading (ICT) is a price-action methodology developed by Michael J. Huddleston, also known as the Inner Circle Trader. It explains market behaviour through concepts such as liquidity, market structure, order blocks, fair value gaps, and trading session timing. Traders use them to analyse price movements from an institutional perspective. Although ICT trading is most commonly associated with the forex market, the methodology is also applied to indices, commodities, and other financial instruments.
This article explains the core ICT concepts, how they fit together, and how traders use them to develop market bias, identify potential liquidity targets, and analyse price action across different market conditions.
Key Takeaways
- ICT explains market movement through institutional behaviour, focusing on liquidity, structure, and order flow rather than indicators.
- The Inner Circle Trading method is used across forex, indices, and commodities on intraday and higher timeframes to interpret how major players influence price.
- Core ICT concepts include Break of Structure (BOS), Change of Character (CHoCH), Market Structure Shift (MSS), liquidity pools, order blocks, fair value gaps, optimal trade entries, and kill zones.
- ICT shows how price targets liquidity, reacts to imbalances, and shifts momentum, giving traders a clearer narrative of market intent.
- The framework combines structure, timing, and context, making it a detailed but discretionary approach to analysing market movement.
- The ICT methodology is not a mechanical strategy. It relies on discretionary analysis rather than fixed rules.
What Is ICT in Trading?
ICT, or Inner Circle Trading, is a price-based methodology developed by Michael J. Huddleston that offers a way to read institutional behaviour in the markets. It focuses on identifying where banks and large funds, the so-called “smart money,” enter, exit, and target liquidity. Traders use ICT across forex, indices, and commodities, mainly on intraday charts like the one-minute to one-hour, as well as higher timeframes when building directional bias.
The approach breaks price into structure, liquidity, and imbalance. It teaches traders to spot where the market takes stops, when momentum shifts, and where price often returns before moving again. Rather than relying on indicators, ICT centres on raw price action and the recurring patterns created by institutional order flow. This makes it a structured way to analyse short- and medium-term movements.
ICT is one interpretation of smart money concepts (SMC) rather than the whole field. Other institutional order-flow approaches exist and use different terms for similar ideas. What separates ICT is its specific vocabulary and its focus on when liquidity enters the market, not only where.
Who Developed ICT?
Inner Circle Trading was created by Michael J. Huddleston, widely known as “The Inner Circle Trader.” He is an online educator who built a large following by teaching institutional-style price action.
The abbreviation ICT refers to two things. It names Huddleston himself, and it names the body of concepts he teaches. When traders say they follow ICT, they usually mean the methodology rather than the person.
His public lessons shaped much of the terminology traders now associate with the Inner Circle Trader methodology, including order blocks, liquidity grabs, and kill zones.
How Do ICT and Smart Money Concepts Differ?
Smart money concepts is the broader term. It covers any approach that reads price through institutional order flow, including work by educators with no connection to Huddleston. ICT sits inside that category as one version of it, with its own vocabulary and its own sequence of analysis.
The two share most of their core ideas. Both read market structure, both treat liquidity as a target rather than a by-product, and both look for imbalances left behind by fast moves. The differences sit in the detail. The ICT methodology adds session timing through kill zones, defined entry models such as optimal trade entry, and terms like inducement and displacement that general SMC material often leaves out.
Traders frequently treat the two labels as identical. They are not. ICT is one branch of SMC, so ICT ideas are smart money ideas, while the reverse does not hold.
ICT vs Smart Money Concepts at a glance:
How Do ICT Concepts Differ From Traditional Technical Analysis?
Inner Circle Trading differs from traditional technical analysis because it focuses on reading institutional order flow rather than reacting to indicators. The approach strips charts back to structure, liquidity, and imbalance, giving traders a more price-driven way to analyse markets.
Traditional technical analysis tends to start with a tool, such as a moving average or an oscillator, and read price through it. Institutional trading concepts start with price itself and ask which levels large participants are likely to be working towards.
The main differences include:
- Focus on liquidity: ICT centres on where stop orders sit and how the market seeks them, while technical analysis relies on indicators or pattern recognition.
- Institutional logic: ICT frames moves as deliberate actions by large players. Traditional analysis often treats price swings as neutral or random.
- Market structure detail: ICT breaks trends into Break of Structure (BOS), Change of Character (CHoCH), Market Structure Shift (MSS), offering a tighter read on shifts in momentum than generic swing-high/swing-low analysis.
- Imbalance and displacement: Inner Circle Trading highlights rapid moves and Fair Value Gaps as signals of strength, whereas standard approaches often minimise the relevance of these gaps.
- Time-based context: ICT uses kill zones to track when liquidity enters the market, while technical analysis rarely factors in session timing.
What Are the Main ICT Trading Concepts?
Inner Circle Trading concepts are a group of price-action tools that explain how institutional traders move the market. They cover structure, which includes ideas like Break of Structure (BOS), a Change of Character (CHoCH), liquidity through pools, sweeps, and engineering, and order blocks that show where major players commit orders. It also works with fair value gaps, optimal trade entries built from retracements, and kill zones linked to specific trading sessions. Together, these concepts offer a clear framework for reading intraday and higher-time-frame behaviour.
The sections below group these ICT trading concepts into four blocks: structure, order blocks, liquidity, and imbalance, followed by the timing and entry tools that sit alongside them. To understand them, you can consider following along in FXOpen’s TickTrader platform.
1.Structure
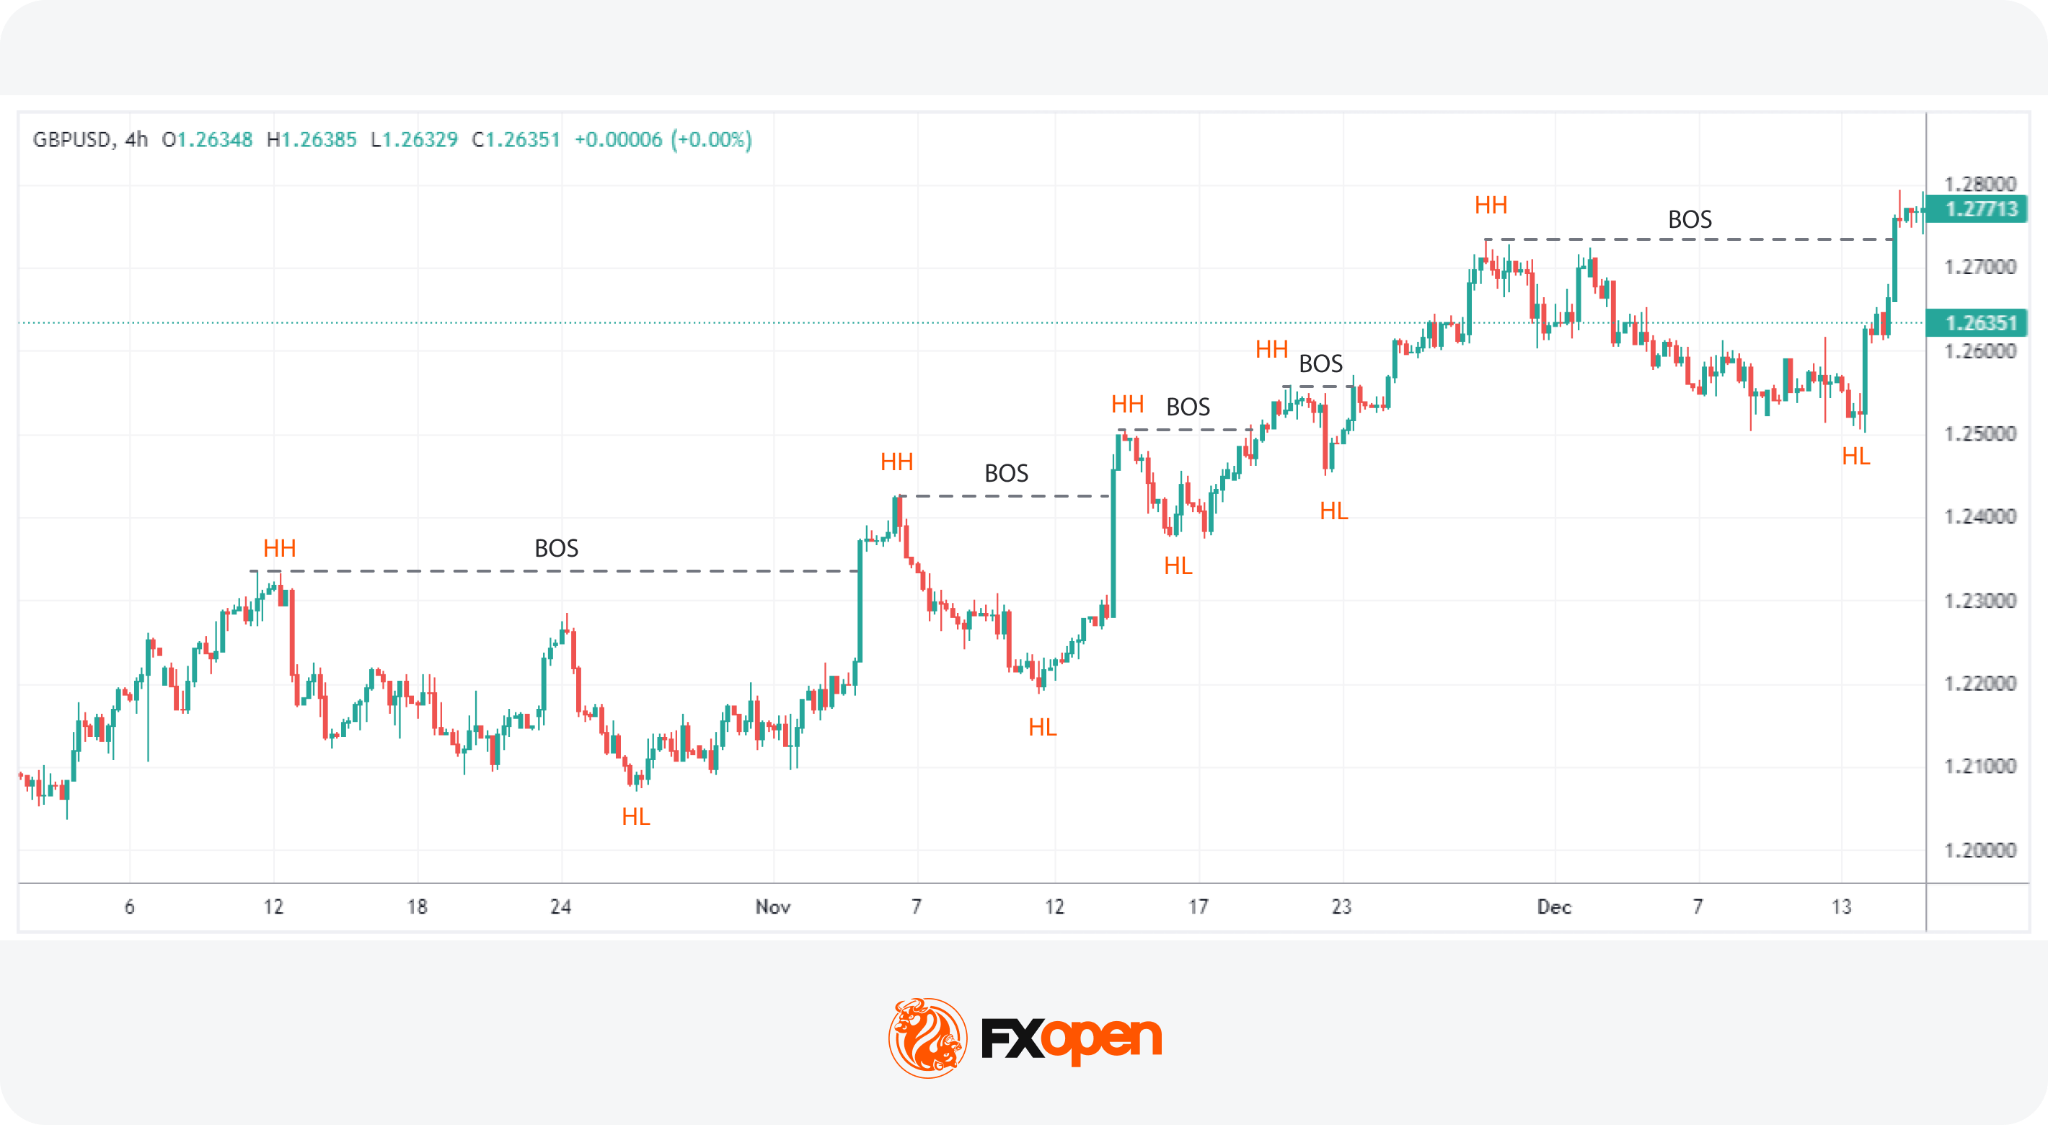
In the context of ICT, market structure is based on the idea that market direction can be identified through patterns of highs and lows. Within market structure, key structural events are split into distinct movements: a Break of Structure (BOS), a Change of Character (CHoCH), and a Market Structure Shift (MSS).
Market Structure
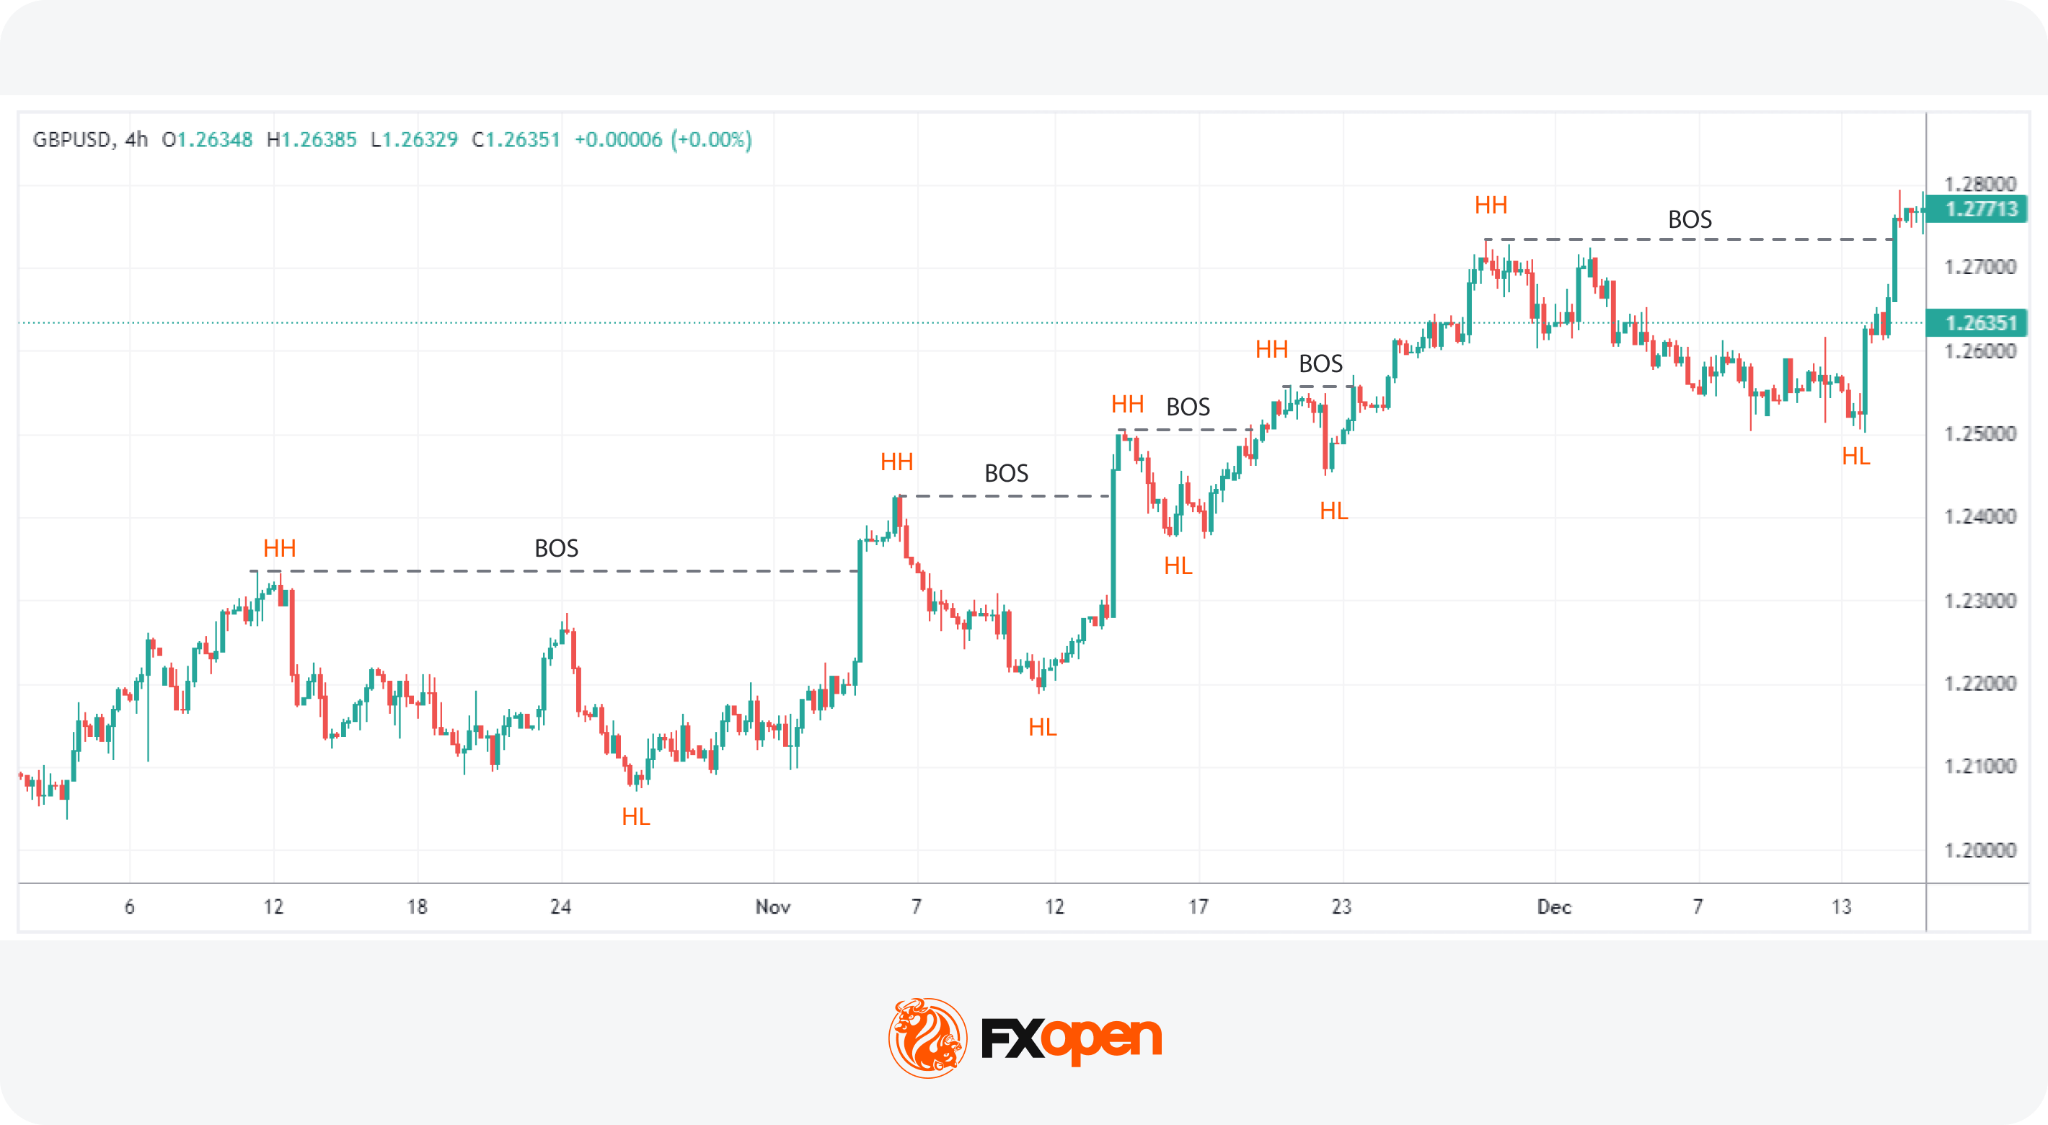
Market structure describes how price moves through a sequence of highs and lows. It shows whether the market trends up, trends down, or ranges, and gives traders a clear view of the current direction. In ICT, structure forms the foundation for reading intent behind price movements and deciding when a trend strengthens, weakens, or begins to reverse.
Specifically, structure is characterised by a series of higher highs and higher lows in an uptrend, or lower highs and lower lows in a downtrend.
For example, EUR/USD rises to 1.0850, pulls back to 1.0800, then pushes on to 1.0920 before dipping to 1.0870. Each high and each low sits above the one before it, so the structure stays bullish. That reading holds until the price closes below 1.0800.
Structure is also fractal, which means a downtrend on a 15-minute chart can be a single pullback inside a daily uptrend. Reading ICT market structure on more than one timeframe keeps that context visible, which is why traders often check the higher timeframe before acting on a lower one.
Break of Structure (BOS)
A Break of Structure (BOS) is a concept that confirms the continuation of the current market direction. It occurs when price moves beyond a key swing point that defines the current trend.
- Bullish BOS appears in an uptrend, when a candle moves above the most recent swing high while the prior swing low remains intact.
- Bearish BOS occurs in a downtrend, when a candle drops below the most recent swing low while the prior swing high holds.
An ICT BOS points to trend continuation, so it tells traders the existing direction is still intact rather than warning of a turn. Traders looking for signs of trend reversal watch for a Change of Character instead, which breaks the swing point on the opposite side of the move.
Change of Character (CHoCH)
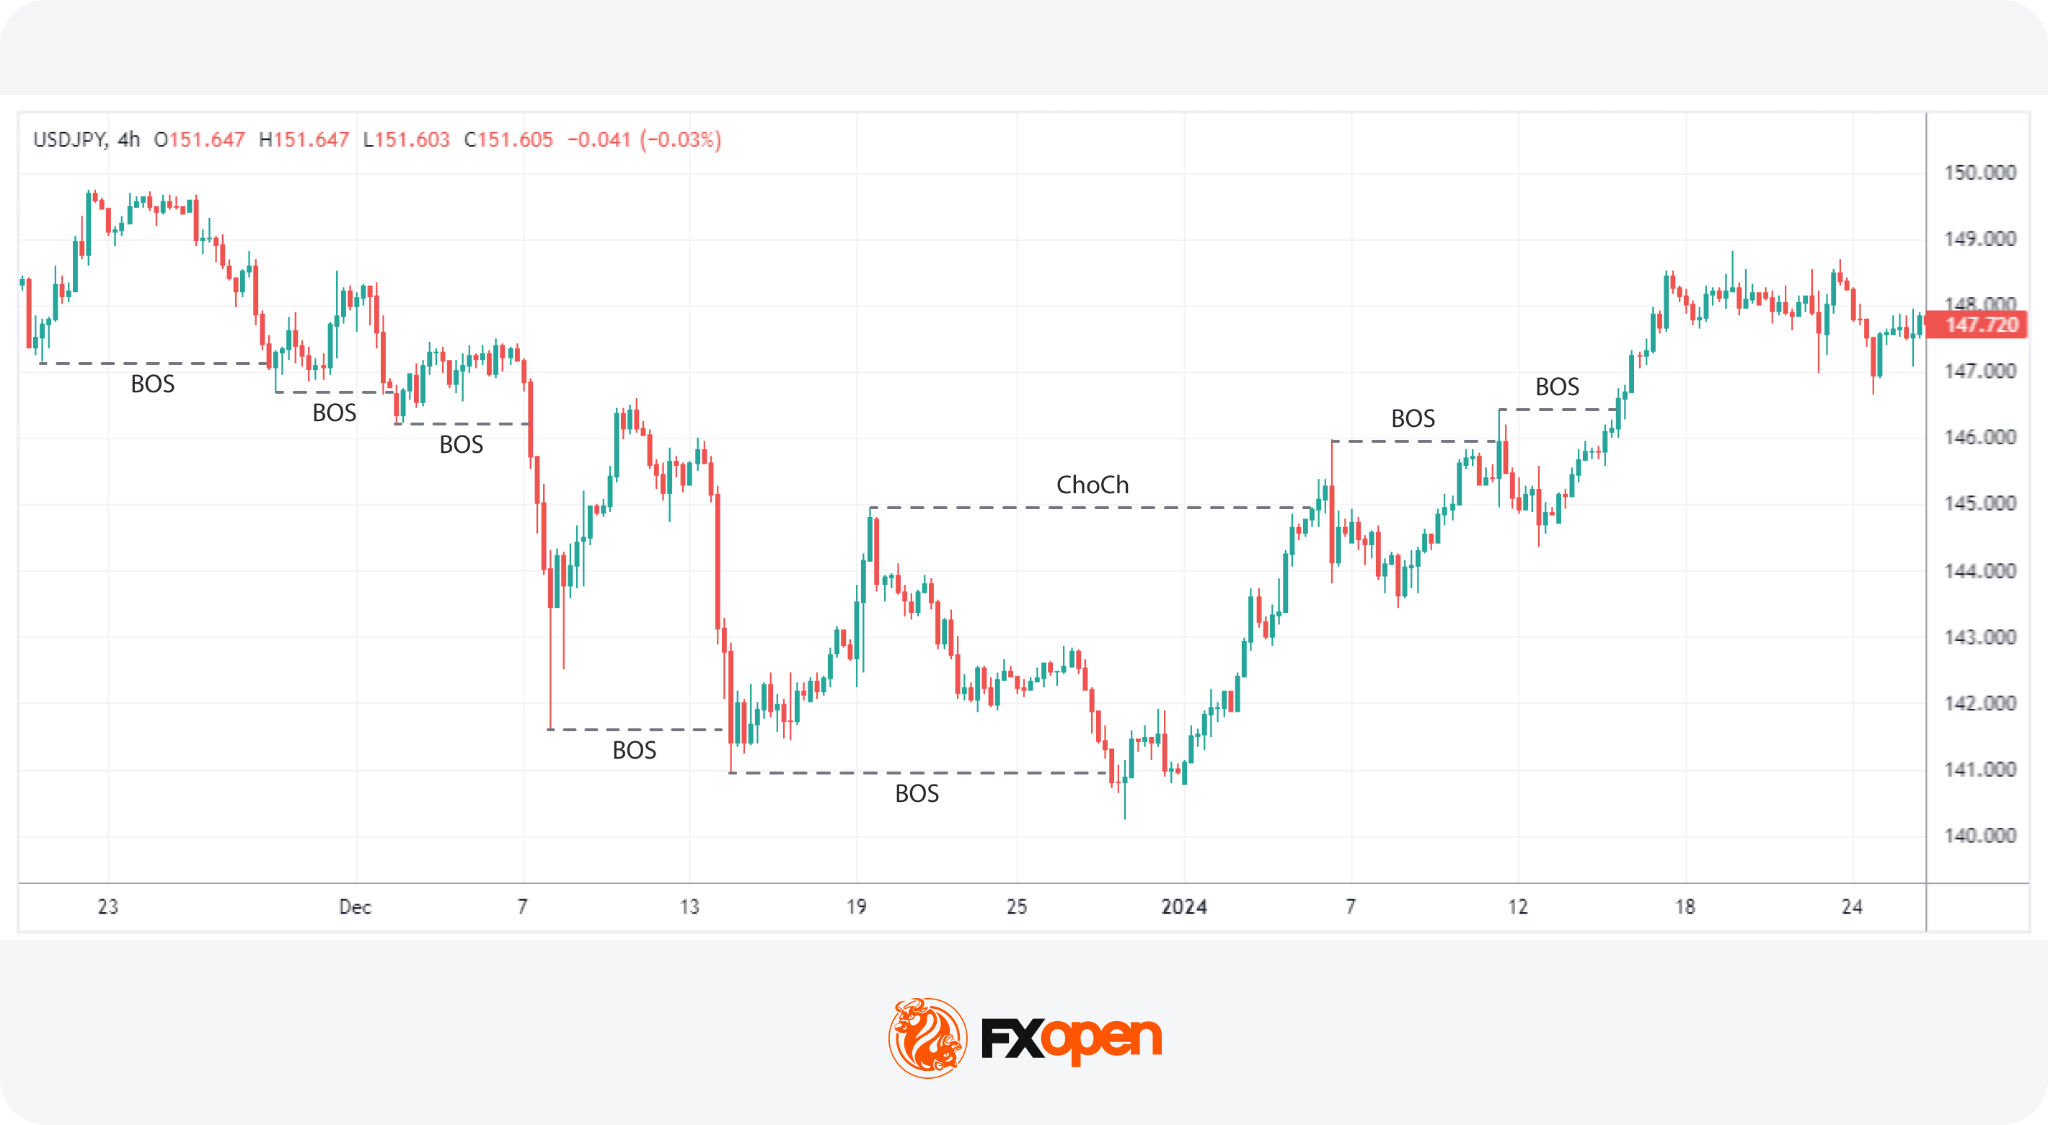
A Change of Character concept reflects a possible trend change. It occurs when price violates the swing point that protects the current trend, signalling the first meaningful shift in control. In an uptrend, a CHoCH forms when price fails to set a new high and then closes below the most recent swing low that previously held the trend. In a downtrend, it forms when price fails to create a fresh low and then closes above the most recent protective swing high.
An ICT CHoCH on its own does not confirm a reversal. It marks the first crack in the existing structure, and price often reclaims the level and continues in the original direction. Traders typically wait for follow-through, such as strong displacement that breaks a key structural level, before treating the shift as established.
Market Structure Shift (MSS)
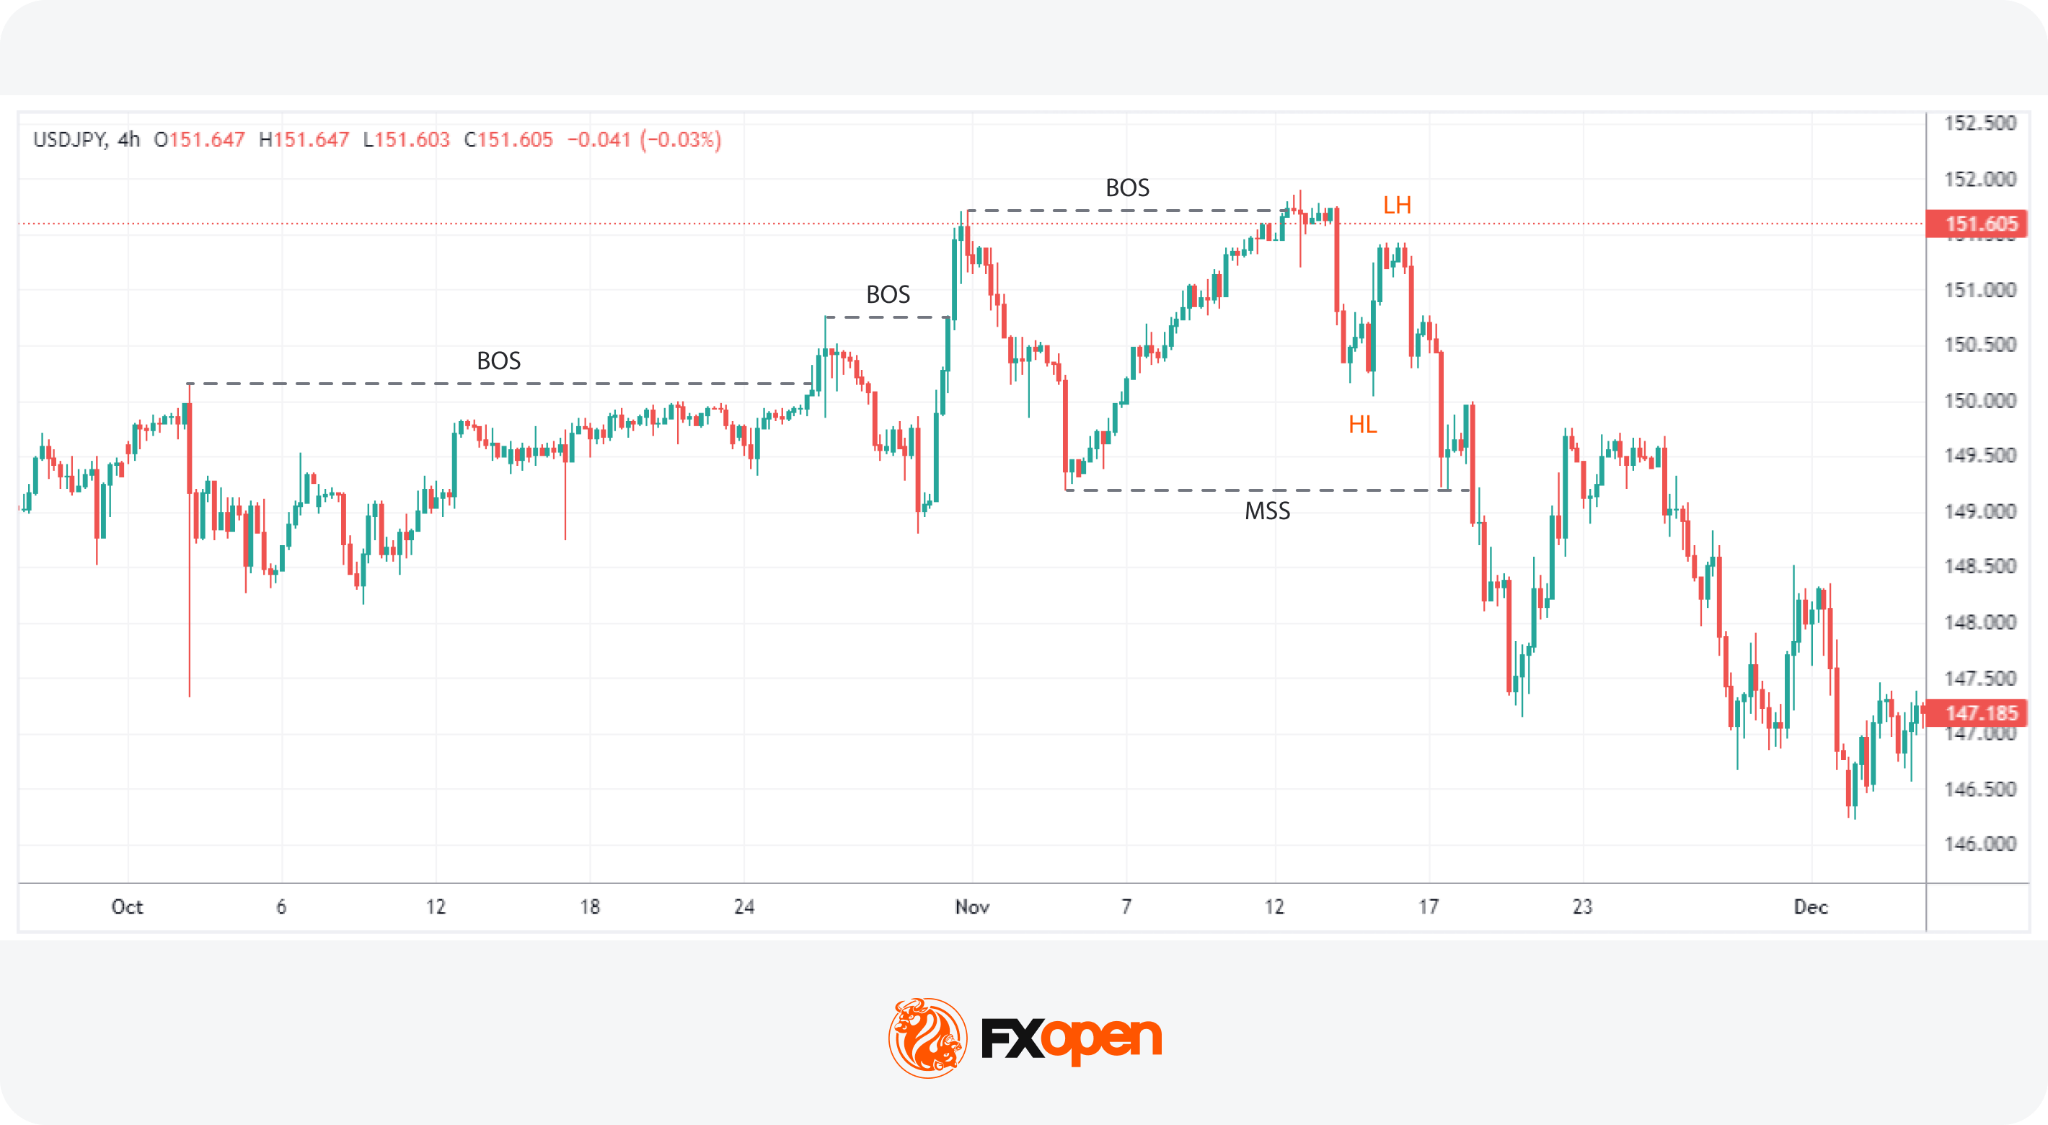
A Market Structure Shift is a significant change in the market that can disrupt the existing trend. This specific type of CHoCH is typically marked by a price moving sharply (a displacement) through a key structural level, such as a higher low in an uptrend or a lower high in a downtrend.
An ICT MSS differs from a CHoCH in how the level breaks rather than which level breaks. A CHoCH can form on a slow drift through the protective swing point, while an MSS requires a decisive move, often leaving an imbalance behind it.
These shifts can signal a profound change in market dynamics, with the sharp move often preceding a new sustained trend. Recognising an MSS allows traders to reevaluate their current bias and adapt to a new trend, given its clear signal.
2. Order Blocks
ICT order block meaning relates to a price area associated with the final buying or selling activity before a strong directional move. In ICT analysis, traders monitor these areas because price may later return to them and react.
There are a few different types of order blocks to be aware of: regular order blocks, breaker blocks, and mitigation blocks.
Regular Order Blocks
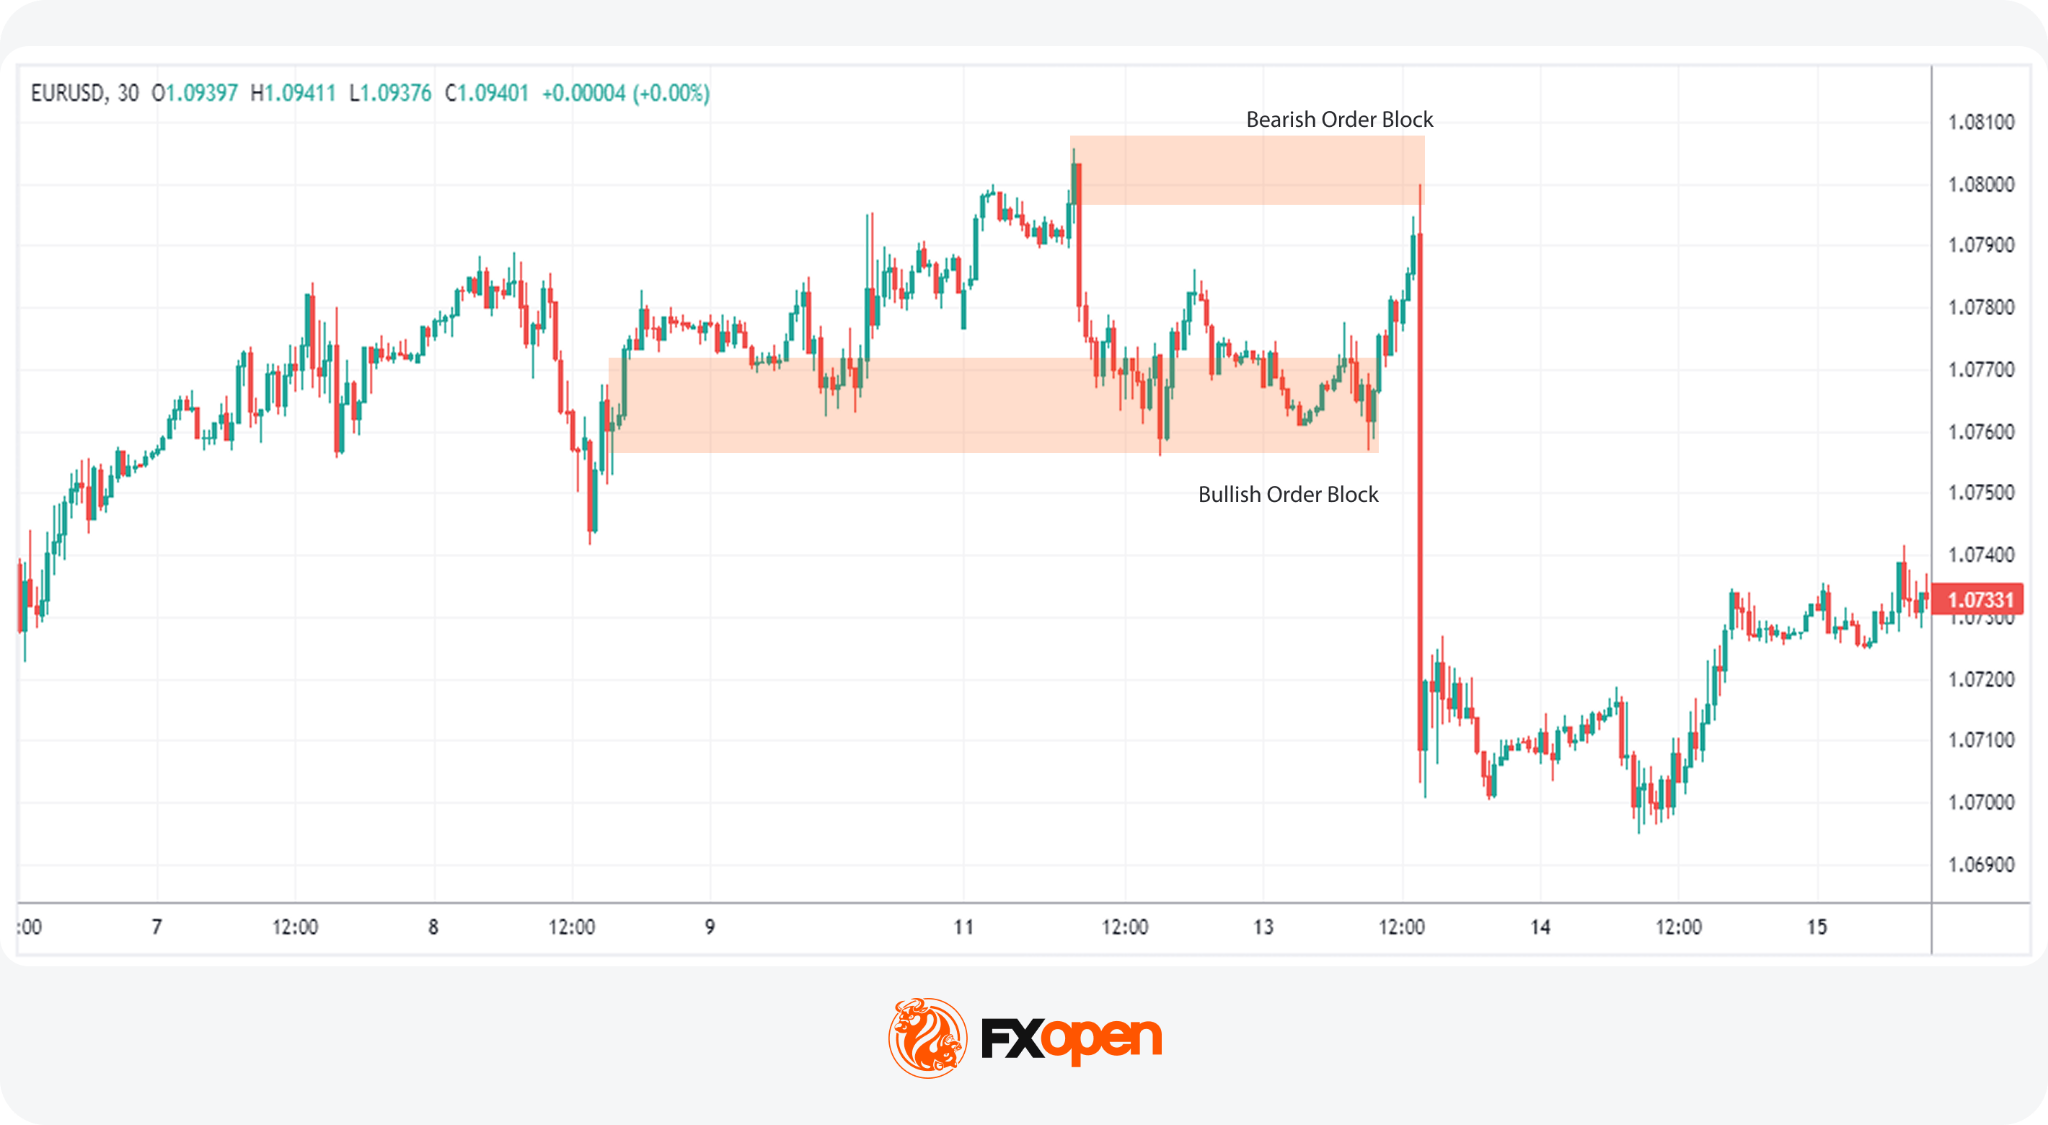
A regular ICT order block is an area on the price chart representing a concentration of buying (demand zone) or selling (supply zone) activity.
A bullish order block typically forms around the last bearish candle or price area before a strong move higher, while a bearish order block forms around the last bullish candle or area before a strong move lower. Depending on the existing market structure, the subsequent move may either continue the prevailing trend or contribute to a structural shift.
In the ICT trading strategy, order blocks are treated as potential reaction areas. In an established uptrend, for example, a bullish order block may form during a retracement before price moves higher and produces a bullish Break of Structure (BOS). If price later retraces into that order block, traders may monitor the area for a bullish reaction and potential continuation of the existing trend.
Conversely, in an established downtrend, a bearish order block may form during a retracement before price moves lower and produces a bearish Break of Structure (BOS). If price later retraces into that order block, traders may monitor the area for a bearish reaction and potential continuation of the existing trend.
Breaker Blocks
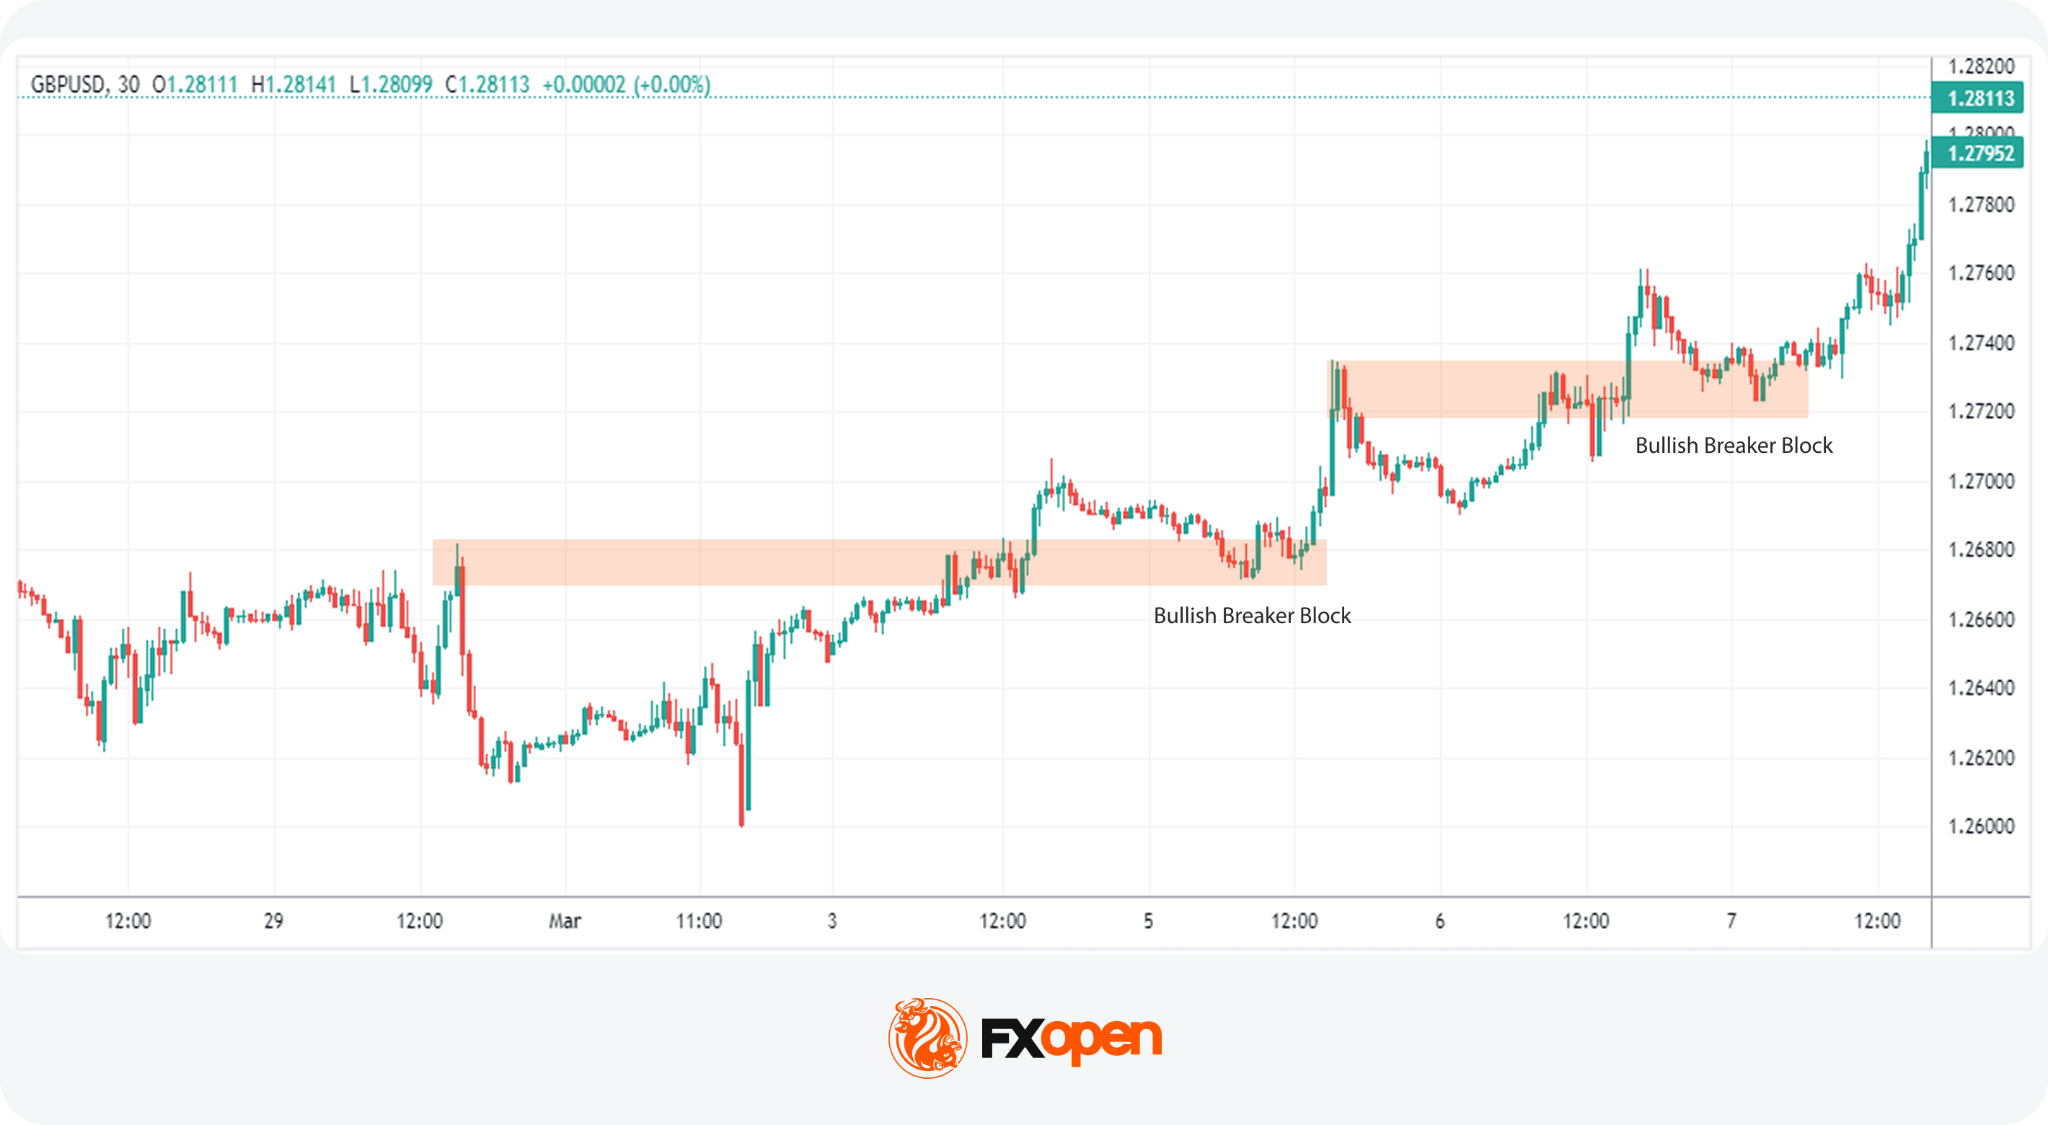
A breaker block forms when price invalidates an order block that should have held if the trend remained intact. This formation indicates that liquidity has been taken (fueling the movement through the order block) and that the trend is likely shifting.
For instance, in an uptrend, if the price creates a new high but then reverses below the previous higher low, the bullish order block above the low becomes a breaker block. Price often returns to that zone afterwards, and traders watch how it reacts there as the new direction develops.
Mitigation Blocks
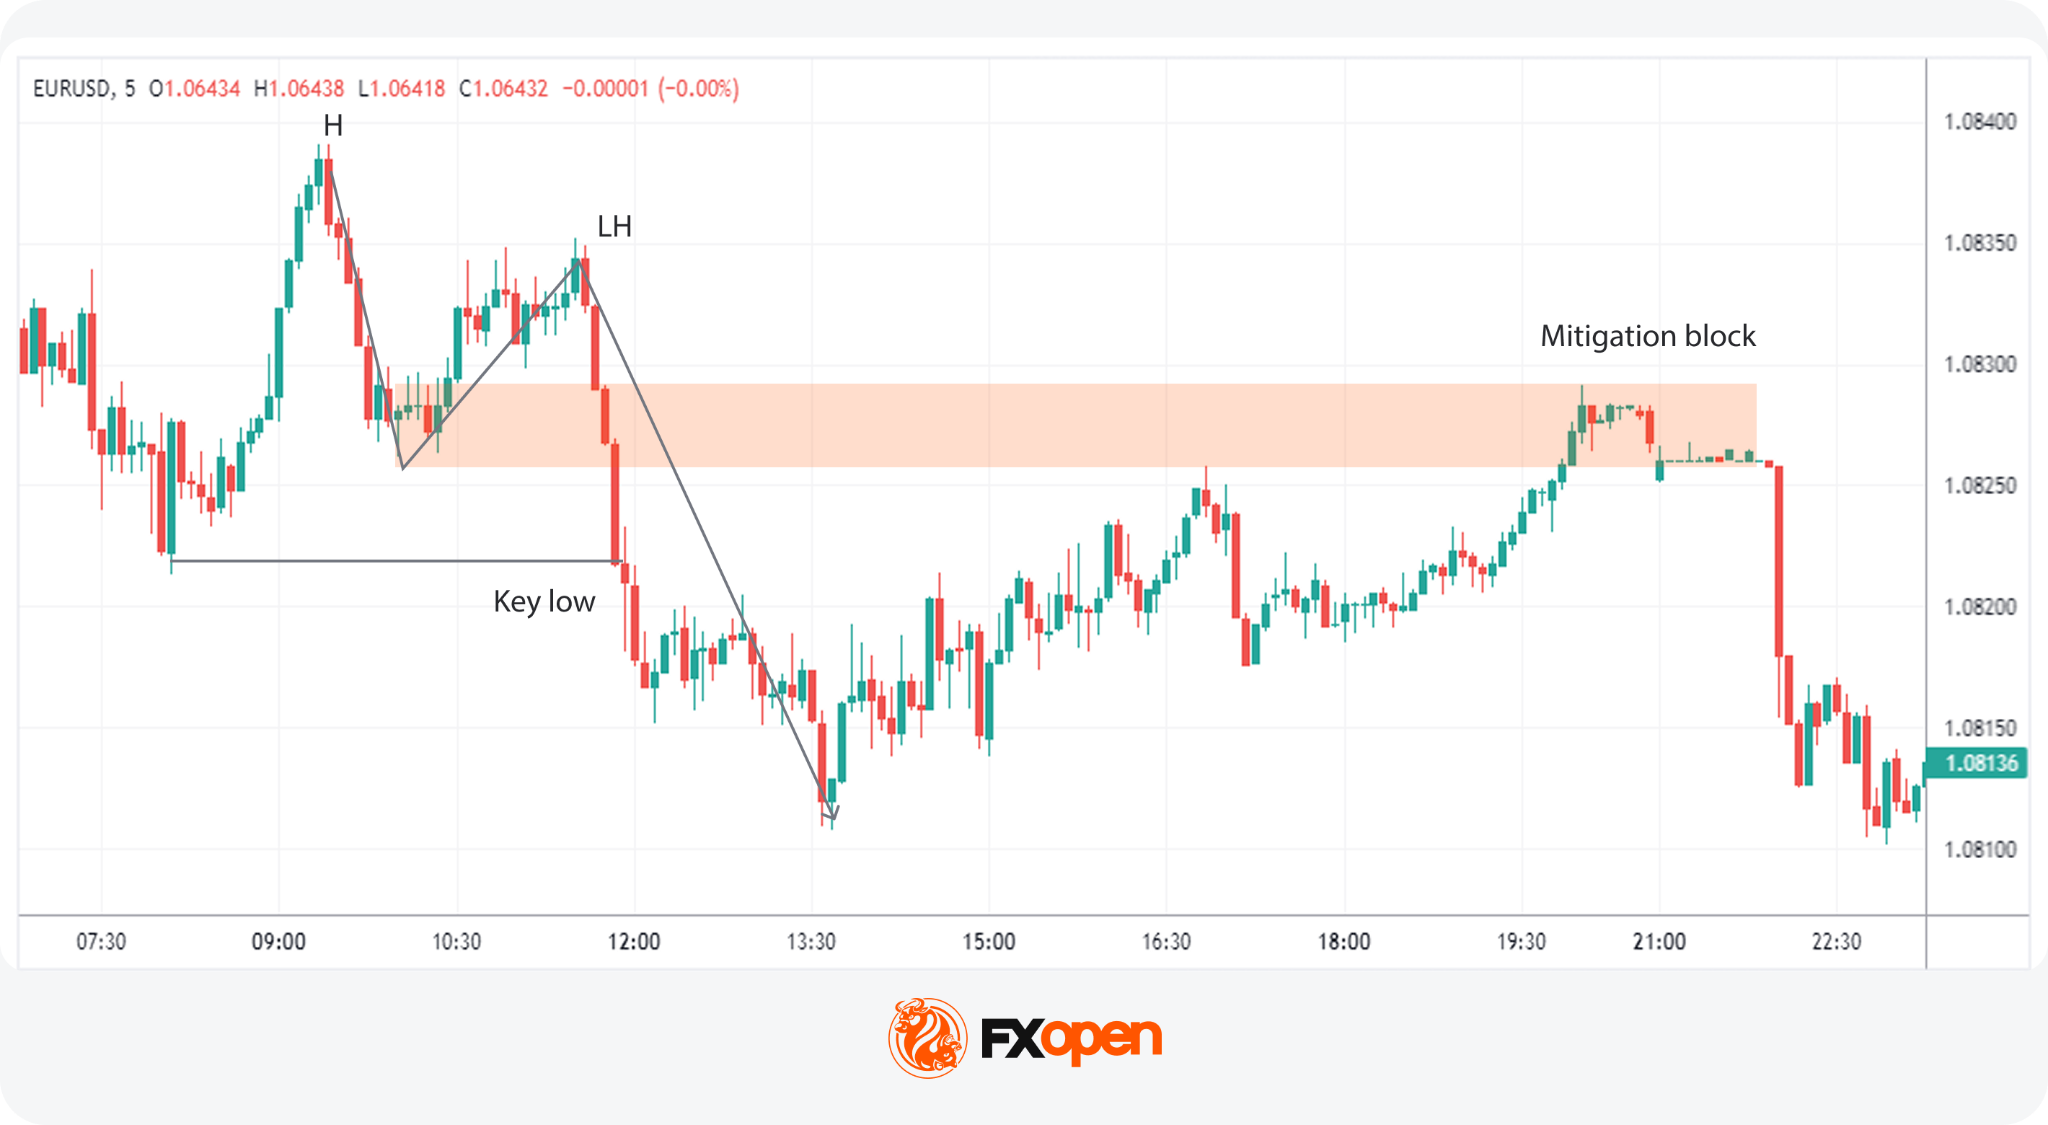
A mitigation block appears when institutional players place orders to offset (“mitigate”) losses from an earlier position that moved against them.
The sequence runs in three parts. A strong displacement moves price away from a level, a counter-move brings price back to where that displacement began, and institutions use the revisit to close out the earlier losing position and re-enter in the direction of the original move.
A bullish mitigation block is the last down candle before a strong upward displacement. A bearish one is the last up candle before a strong downward move, as in the example above. When price returns and reacts from that candle, ICT traders read it as the original order flow resuming.
3.Liquidity
Liquidity refers to areas on the price chart with a high concentration of trading activity, typically marked by stop orders. ICT liquidity concepts include: buy- and sell-side liquidity, liquidity grabs, and inducements.
Buy-Side and Sell-Side Liquidity
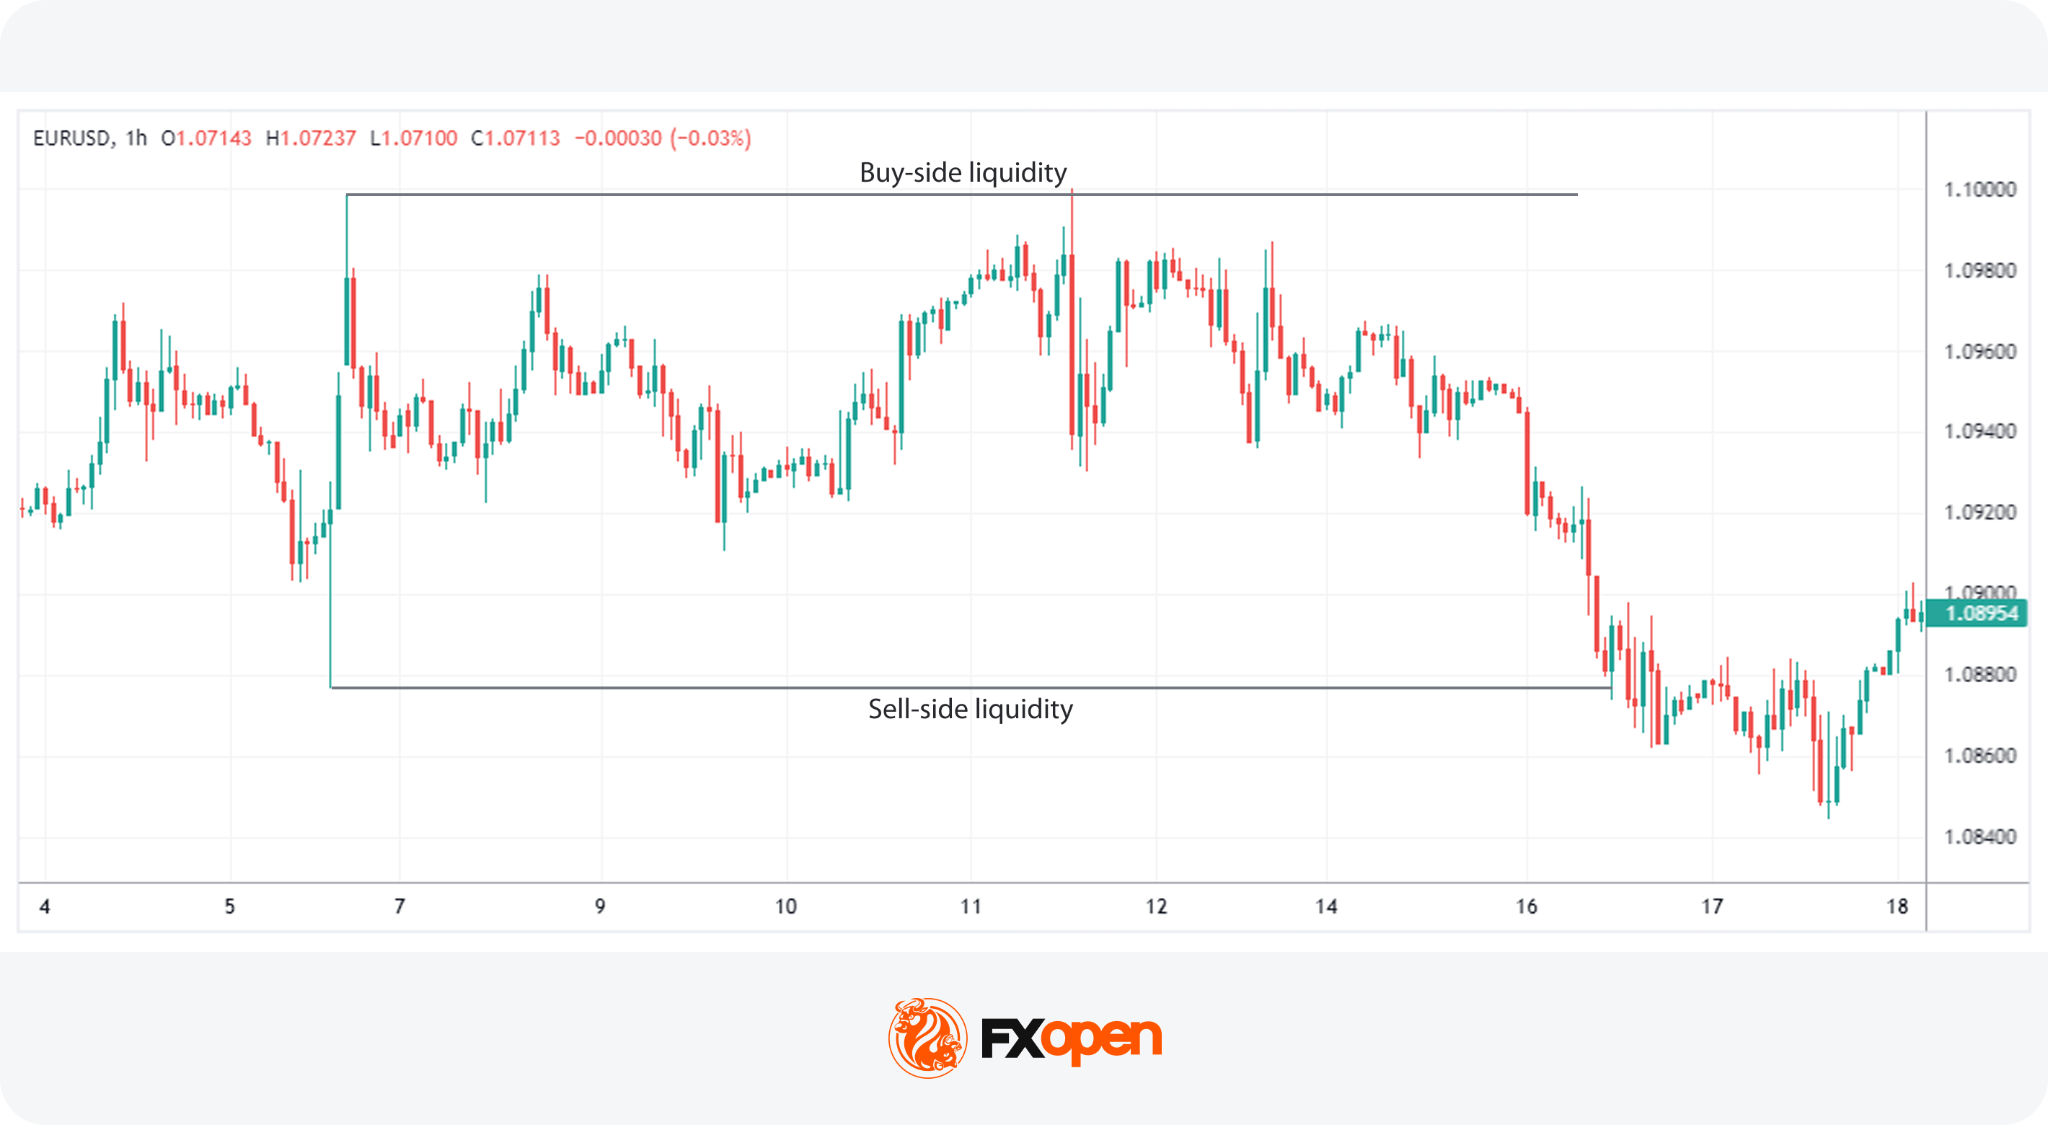
Buy-side liquidity is typically found above recent or equal highs, where stop-loss orders from short positions and breakout buy orders may cluster. When triggered, these orders can add buying pressure. Sell-side liquidity works inversely, with sell orders typically clustering below recent or equal lows.
In ICT analysis, if price moves beyond a high or low to take liquidity but quickly returns within the previous range, the move may be interpreted as a liquidity sweep and a potential reversal signal.
For example, if EUR/USD repeatedly fails to break 1.1500, buy-side liquidity may build above this level. Price may rise above 1.1500, trigger buy orders, and then fall back below it. ICT traders may interpret this rejection as a sweep of buy-side liquidity and watch for signs of a bearish reversal.
Liquidity Grabs
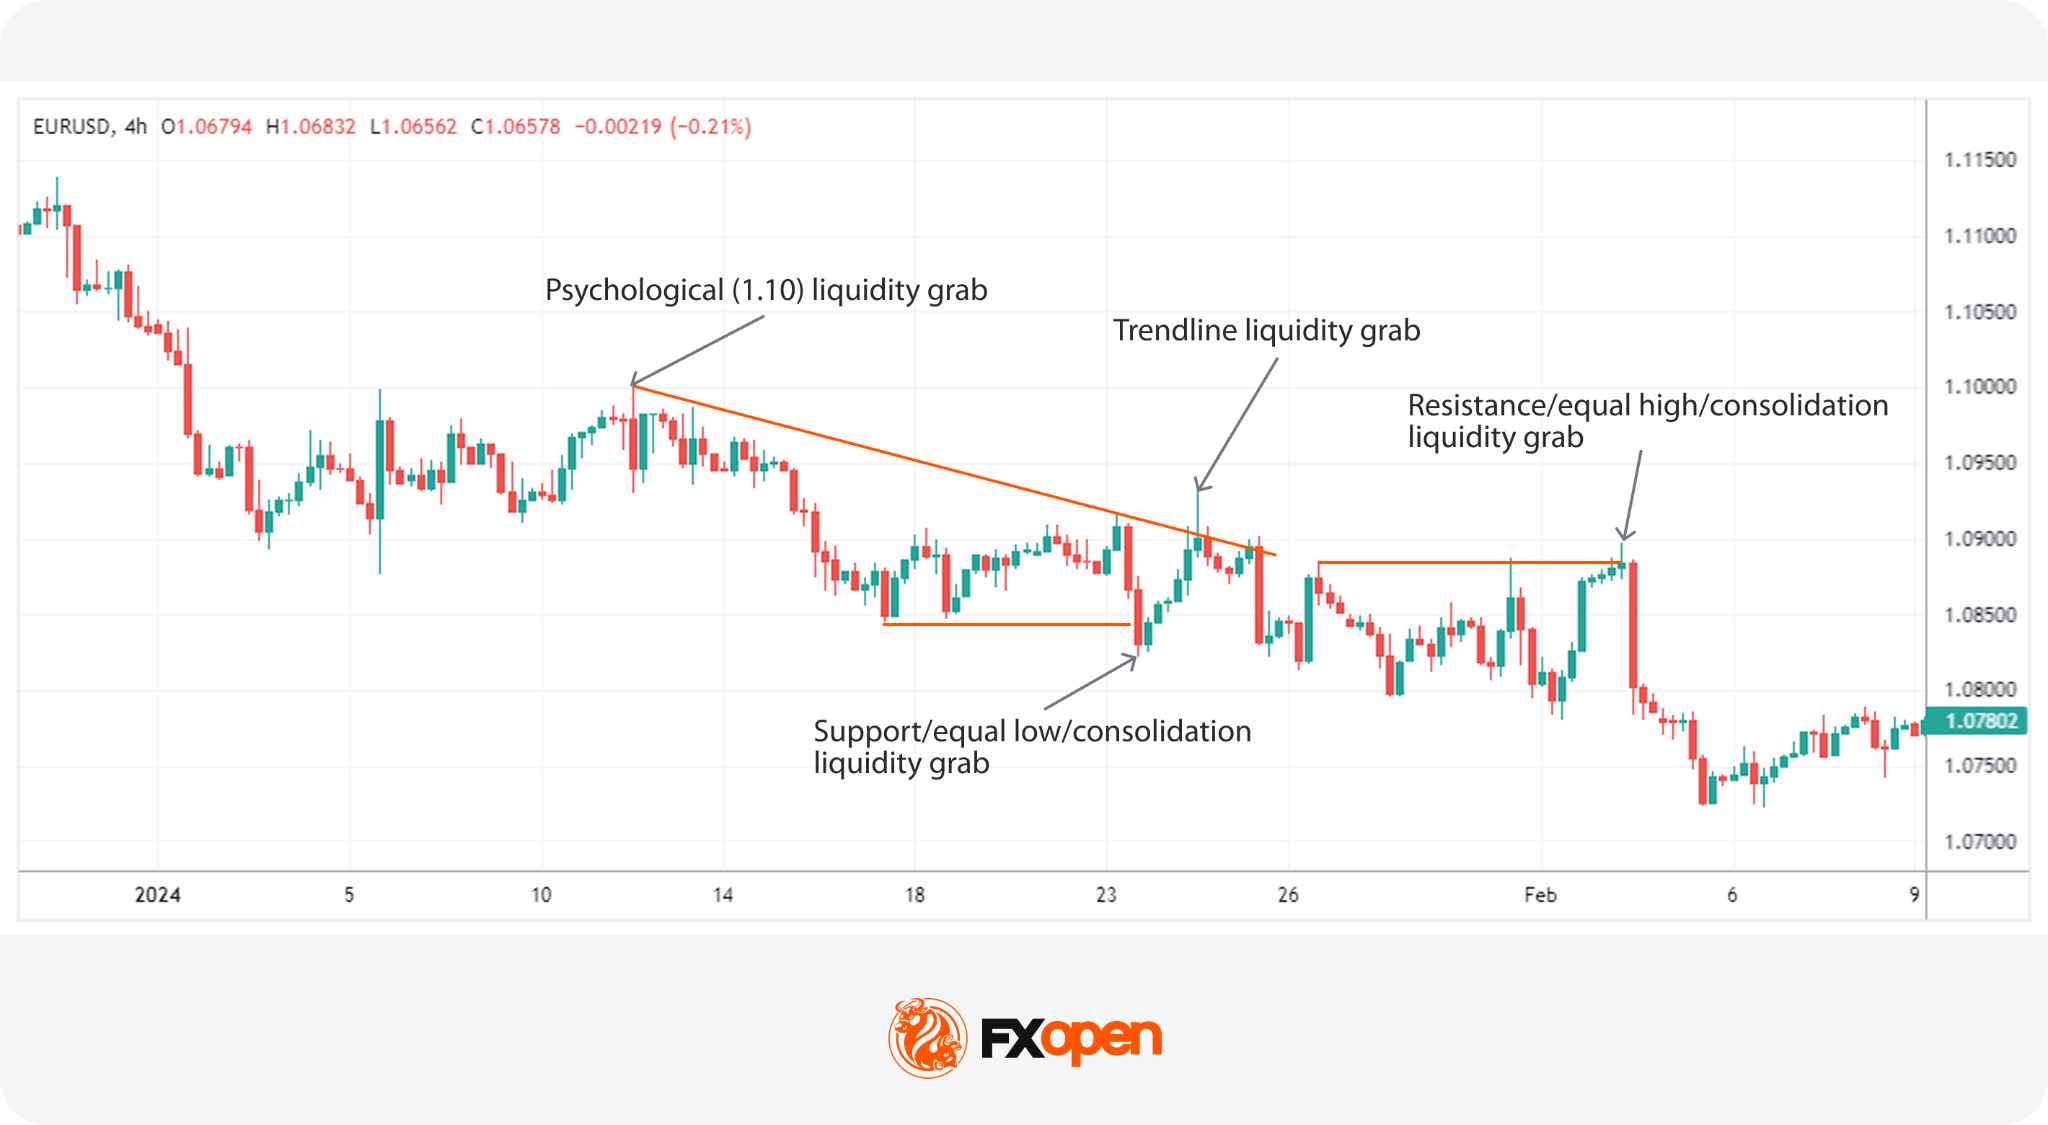
A liquidity grab occurs when the price quickly spikes into high-density order areas, triggering stops and then reversing direction. According to ICT methodology, larger participants take advantage of the resulting order flow to fill sizeable positions with limited slippage. The move temporarily shifts price momentum, usually just long enough to trigger the stops before direction reverses.
What traders observe is the pattern itself, and a liquidity sweep through an obvious high or low that immediately fails is the signature they look for.
Inducement
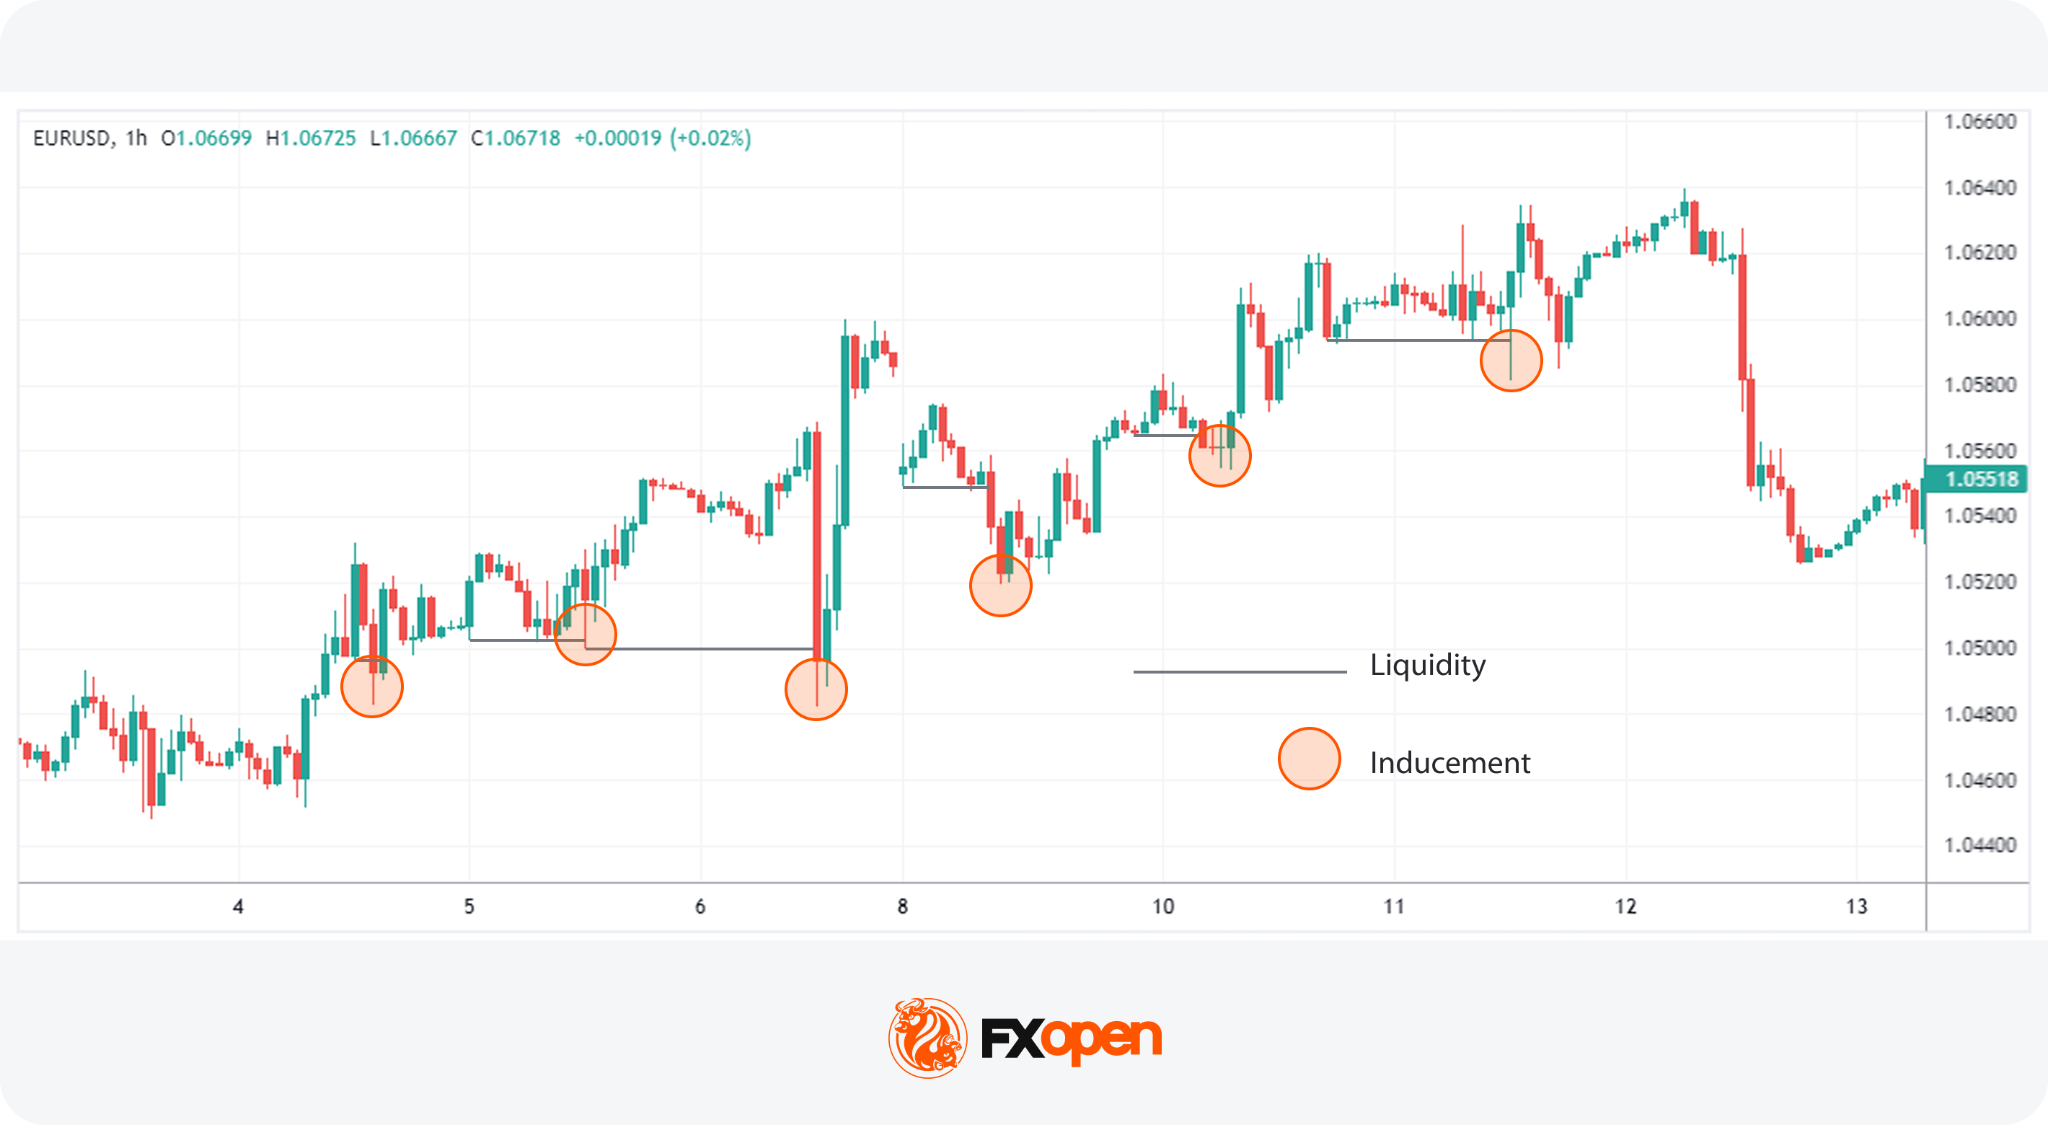
An inducement is a specific type of liquidity grab that triggers stops and makes other traders enter the market. It often appears as a peak or trough, typically into an area of liquidity, in a minor counter-trend within the larger market trend. The pattern creates the appearance of a trend change, which tends to attract entries in that direction. Price then reverses and continues with the original major trend, and the stops from those entries add to the order flow behind the move.
4.Fair Value Gaps and Displacement
In the Inner Circle Trading methodology, two specific types of sharp trending movements signal significant shifts in market dynamics: fair value gaps and displacements.
Fair Value Gaps (FVGs)
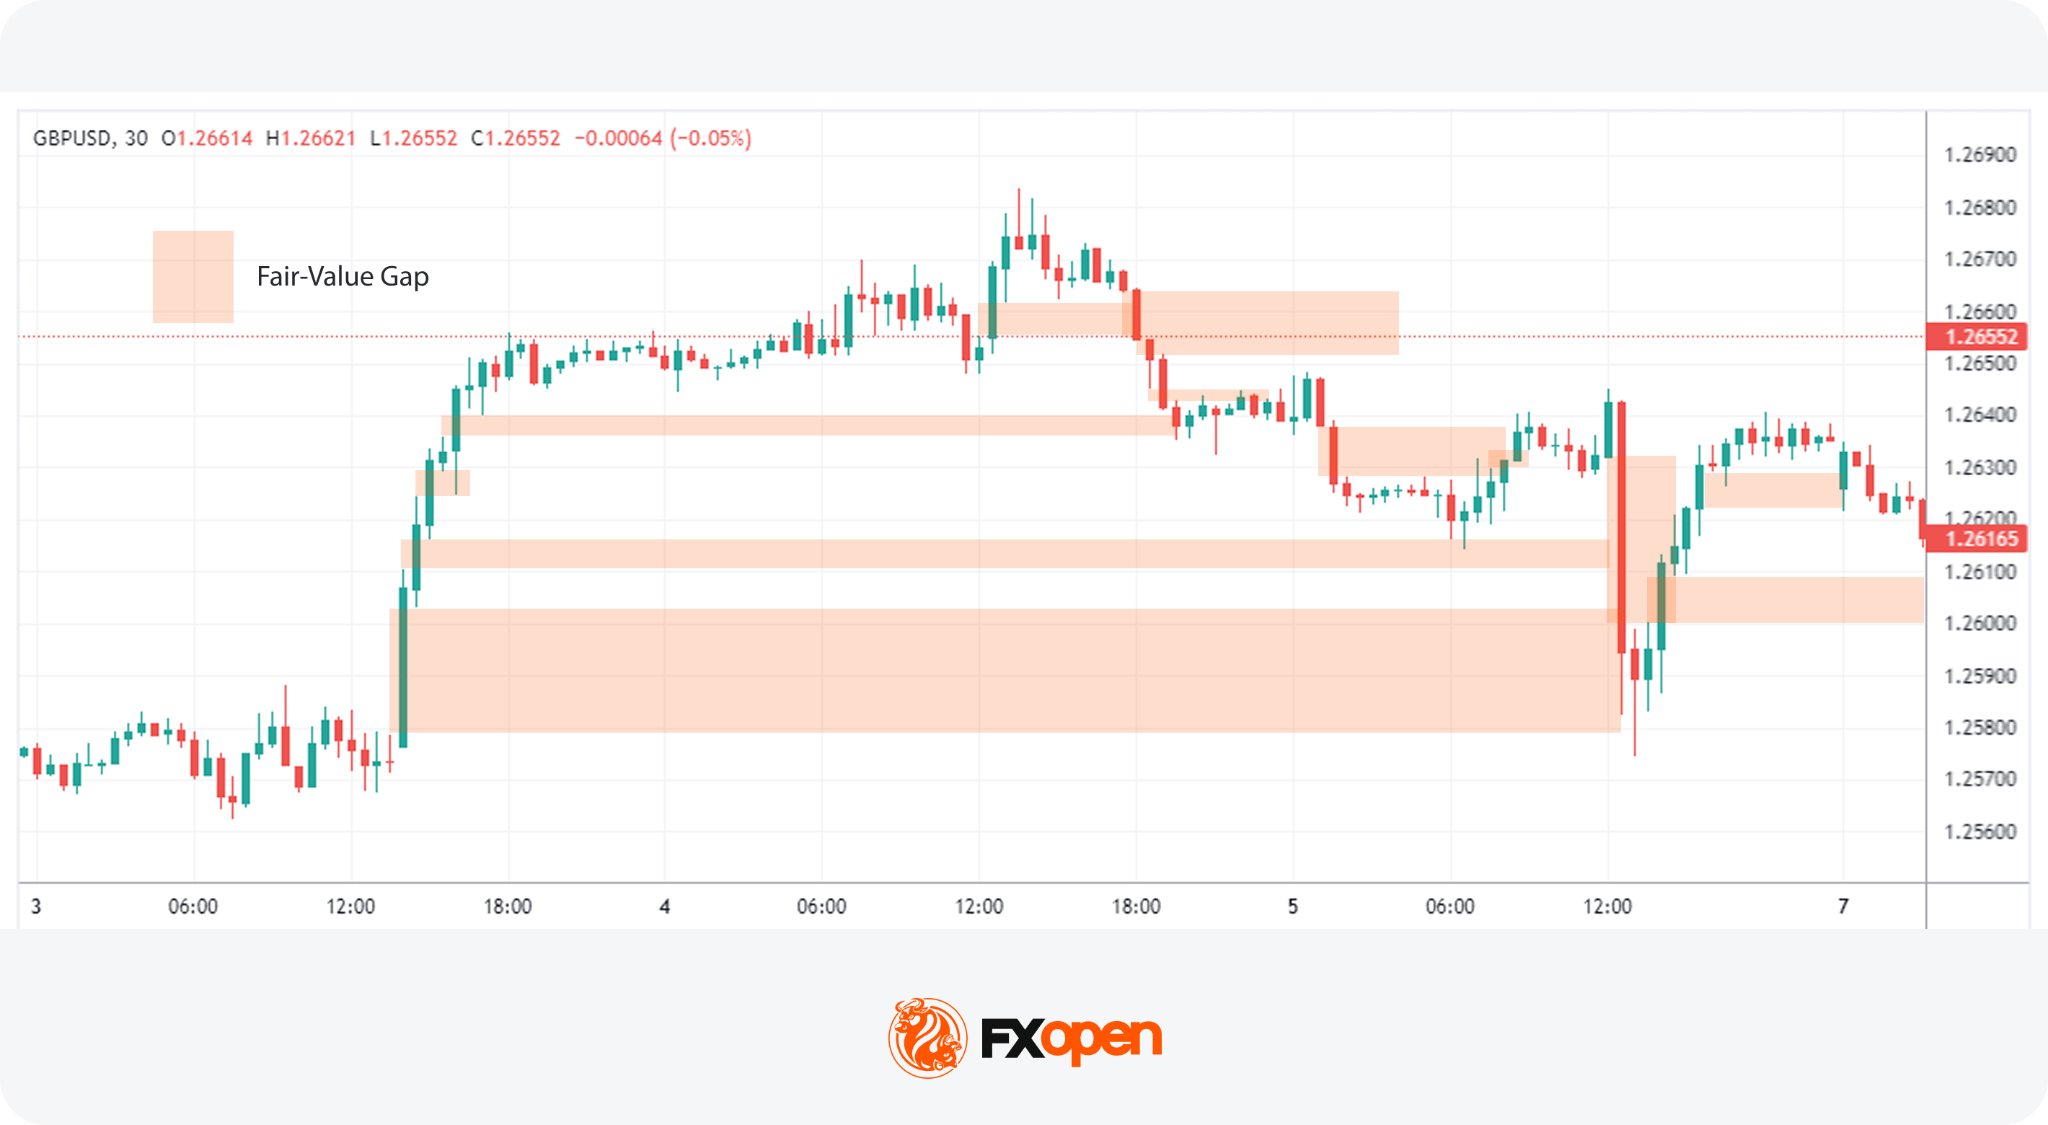
A fair value gap is a concept that reflects an imbalance in price caused by a fast, aggressive move where the market skips over prices that normally would be traded. It forms when a three-candle sequence leaves a space where the middle candle’s body and wick do not overlap with the wicks of the candles on either side. This shows that price moved so quickly in one direction that no trading occurred in that portion of the range.
Traders monitor revisits because the gap represents unfilled orders. Buyers and sellers who wanted to transact in that range never got the chance, and their orders may still be resting there. When price returns, that pending interest can produce a reaction, which is why an ICT fair value gap is often treated as a potential entry area rather than a target.
Displacements
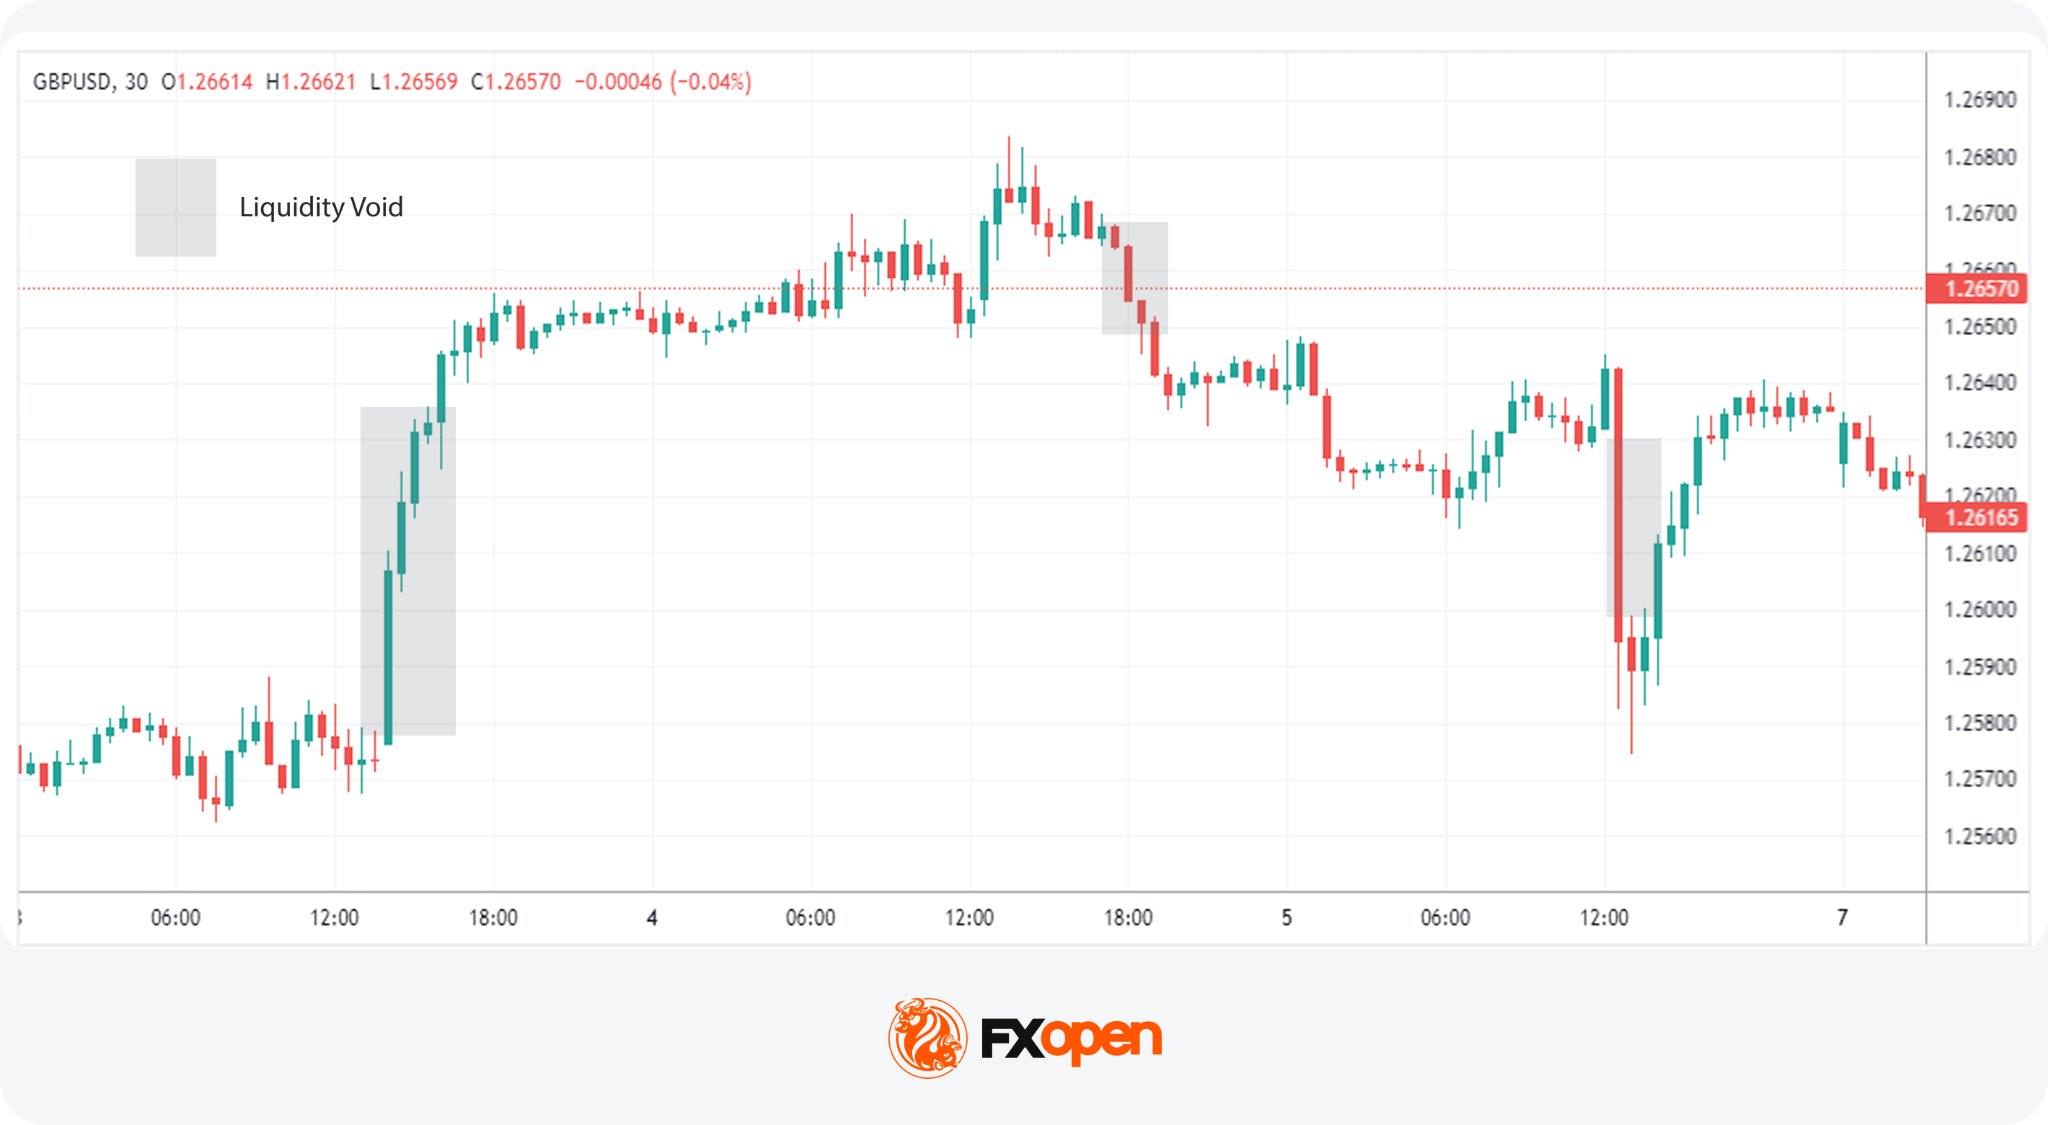
Displacements, also known as liquidity voids, is a sudden, forceful price move that leaves a large stretch of the chart with little trading activity behind it. It typically spans several candles and can contain multiple fair value gaps within it.
Displacement matters most for what it implies about intent. A slow drift through a level and a violent push through the same level are read differently, and the second is what turns a structural break into an MSS or gives an order block its significance.
5.Additional ICT Concepts
Beyond these ICT concepts, there are a few other niche components. These include Kill Zones, optimal trade entries, and balanced price ranges.
Kill Zones
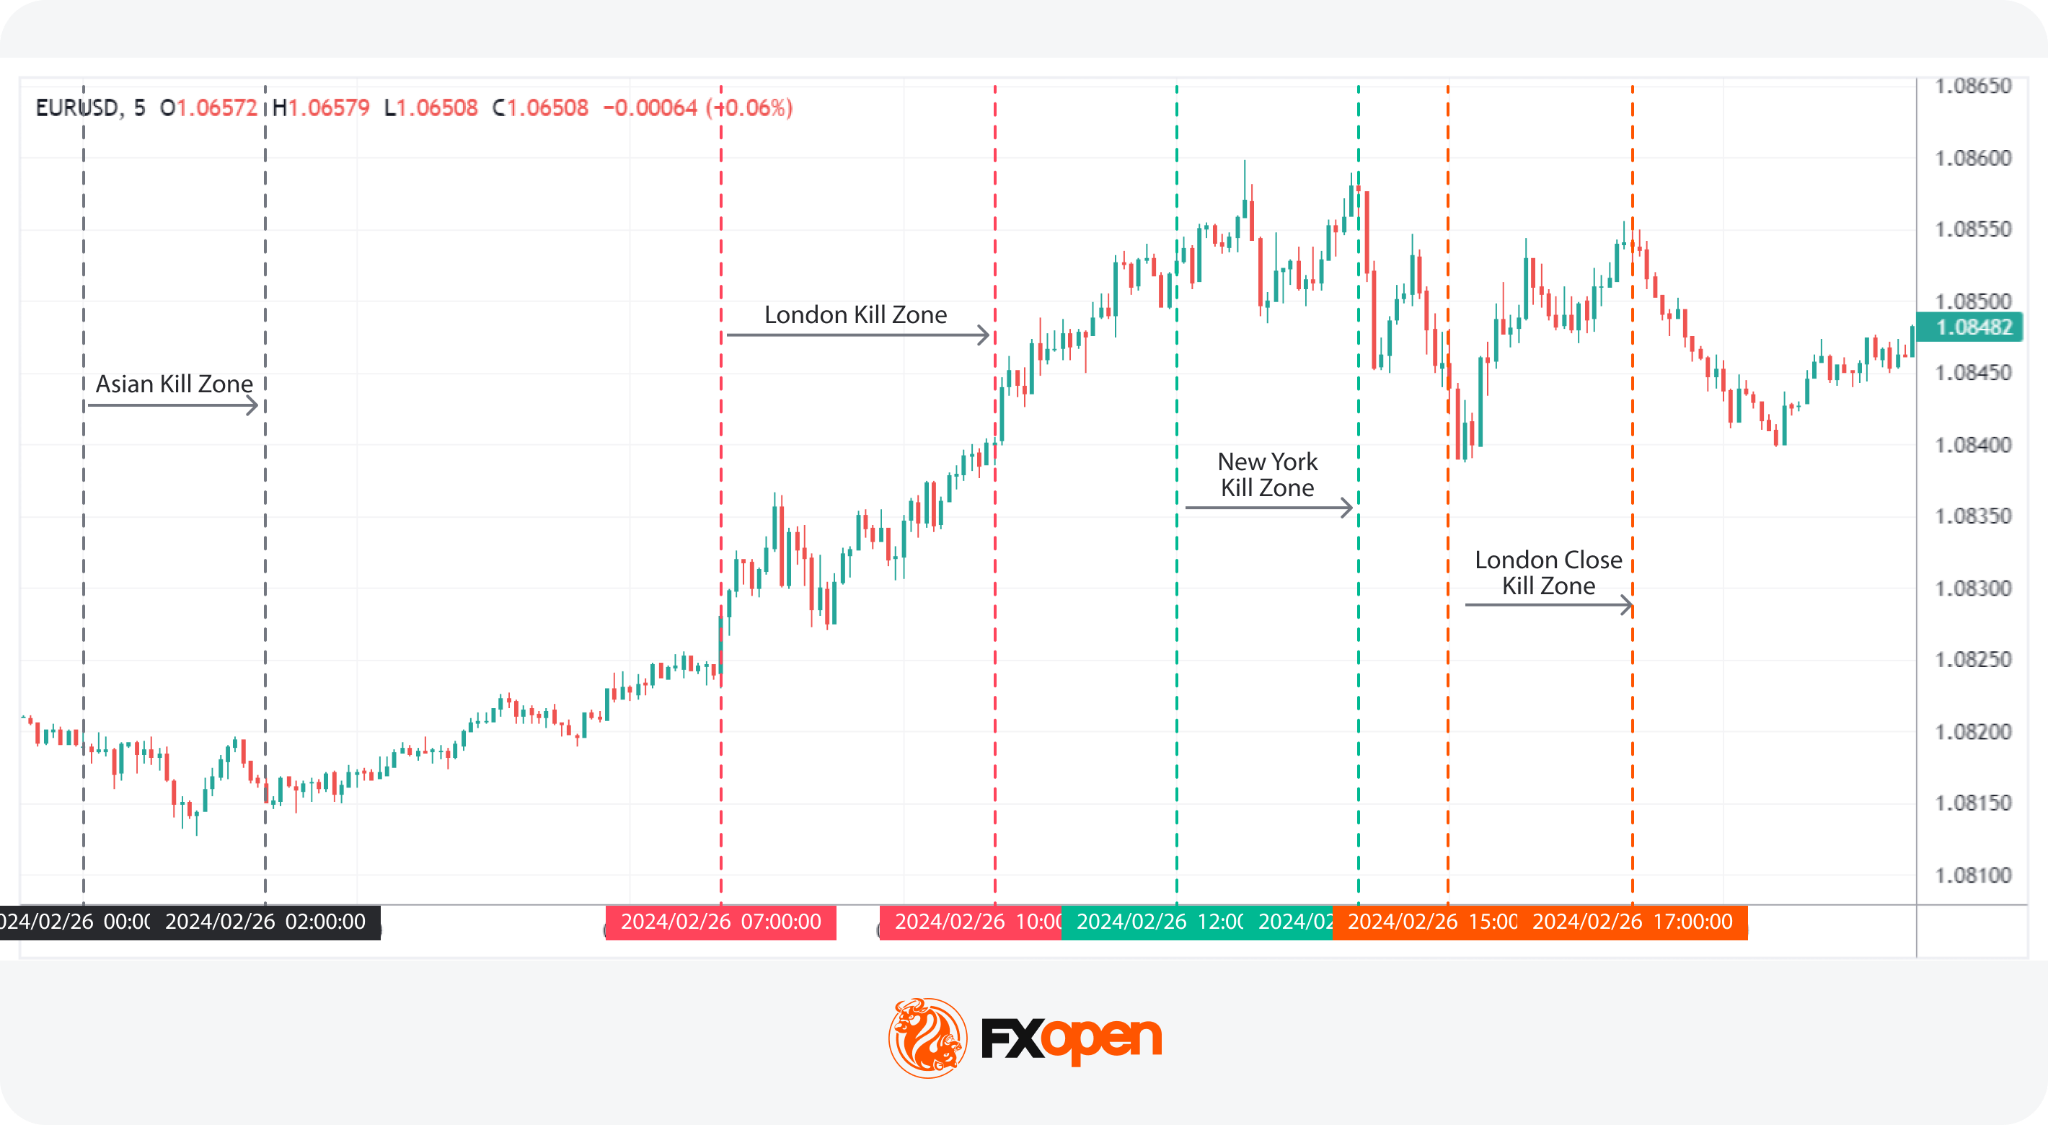
Kill Zones refer to specific periods during the trading day when market activity significantly increases due to the opening or closing of major financial centres. These periods often set the tone for price movements based on the increased volume and volatility.
The concentration is real. BIS data for April 2025 puts global OTC foreign exchange turnover at $9.6 trillion dollars a day, with sales desks in the United Kingdom handling around 38% of it and the United States about 19%. That is why ICT kill zones cluster around the hours those two centres are active.
Times shift by an hour when either region moves to daylight saving, so traders check the current session times against their own platform clock rather than relying on fixed hours.
Optimal Trade Entry (OTE)
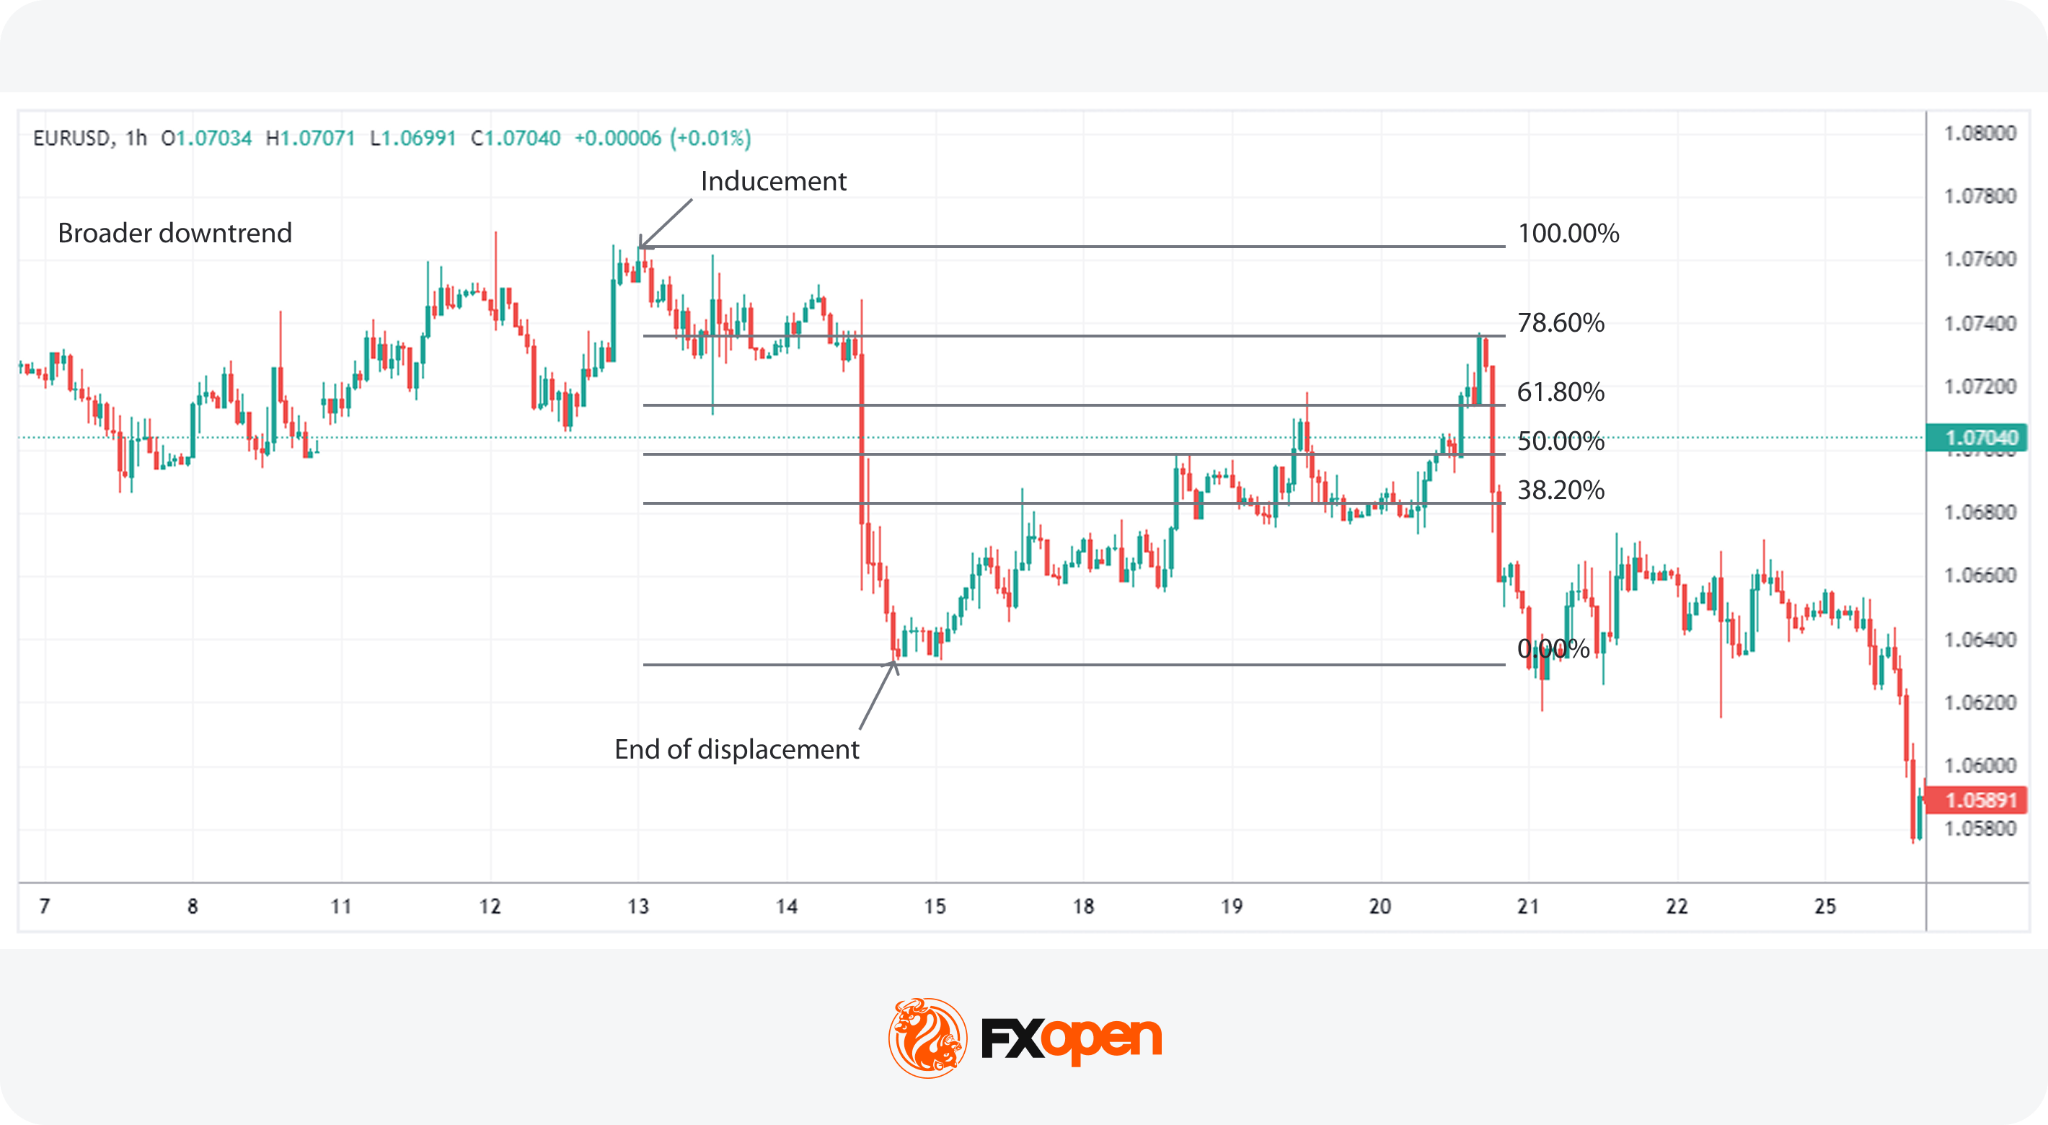
An optimal trade entry (OTE) is a type of Inner Circle trading strategy, found using Fibonacci retracement levels. After an inducement that prompts a displacement (leaving behind an FVG), traders use the Fibonacci retracement tool to pinpoint entry areas.
The Fibonacci tool is applied to the price move that created the displacement, from high to low in a bearish move and from low to high in a bullish move. Traders typically focus on the 61.8% to 78.6% retracement zone as a potential entry area.
Traders may also look for an order block or fair value gap within the ICT OTE zone. When these concepts overlap, they can provide additional confirmation for the setup.
Balanced Price Range (BPR)
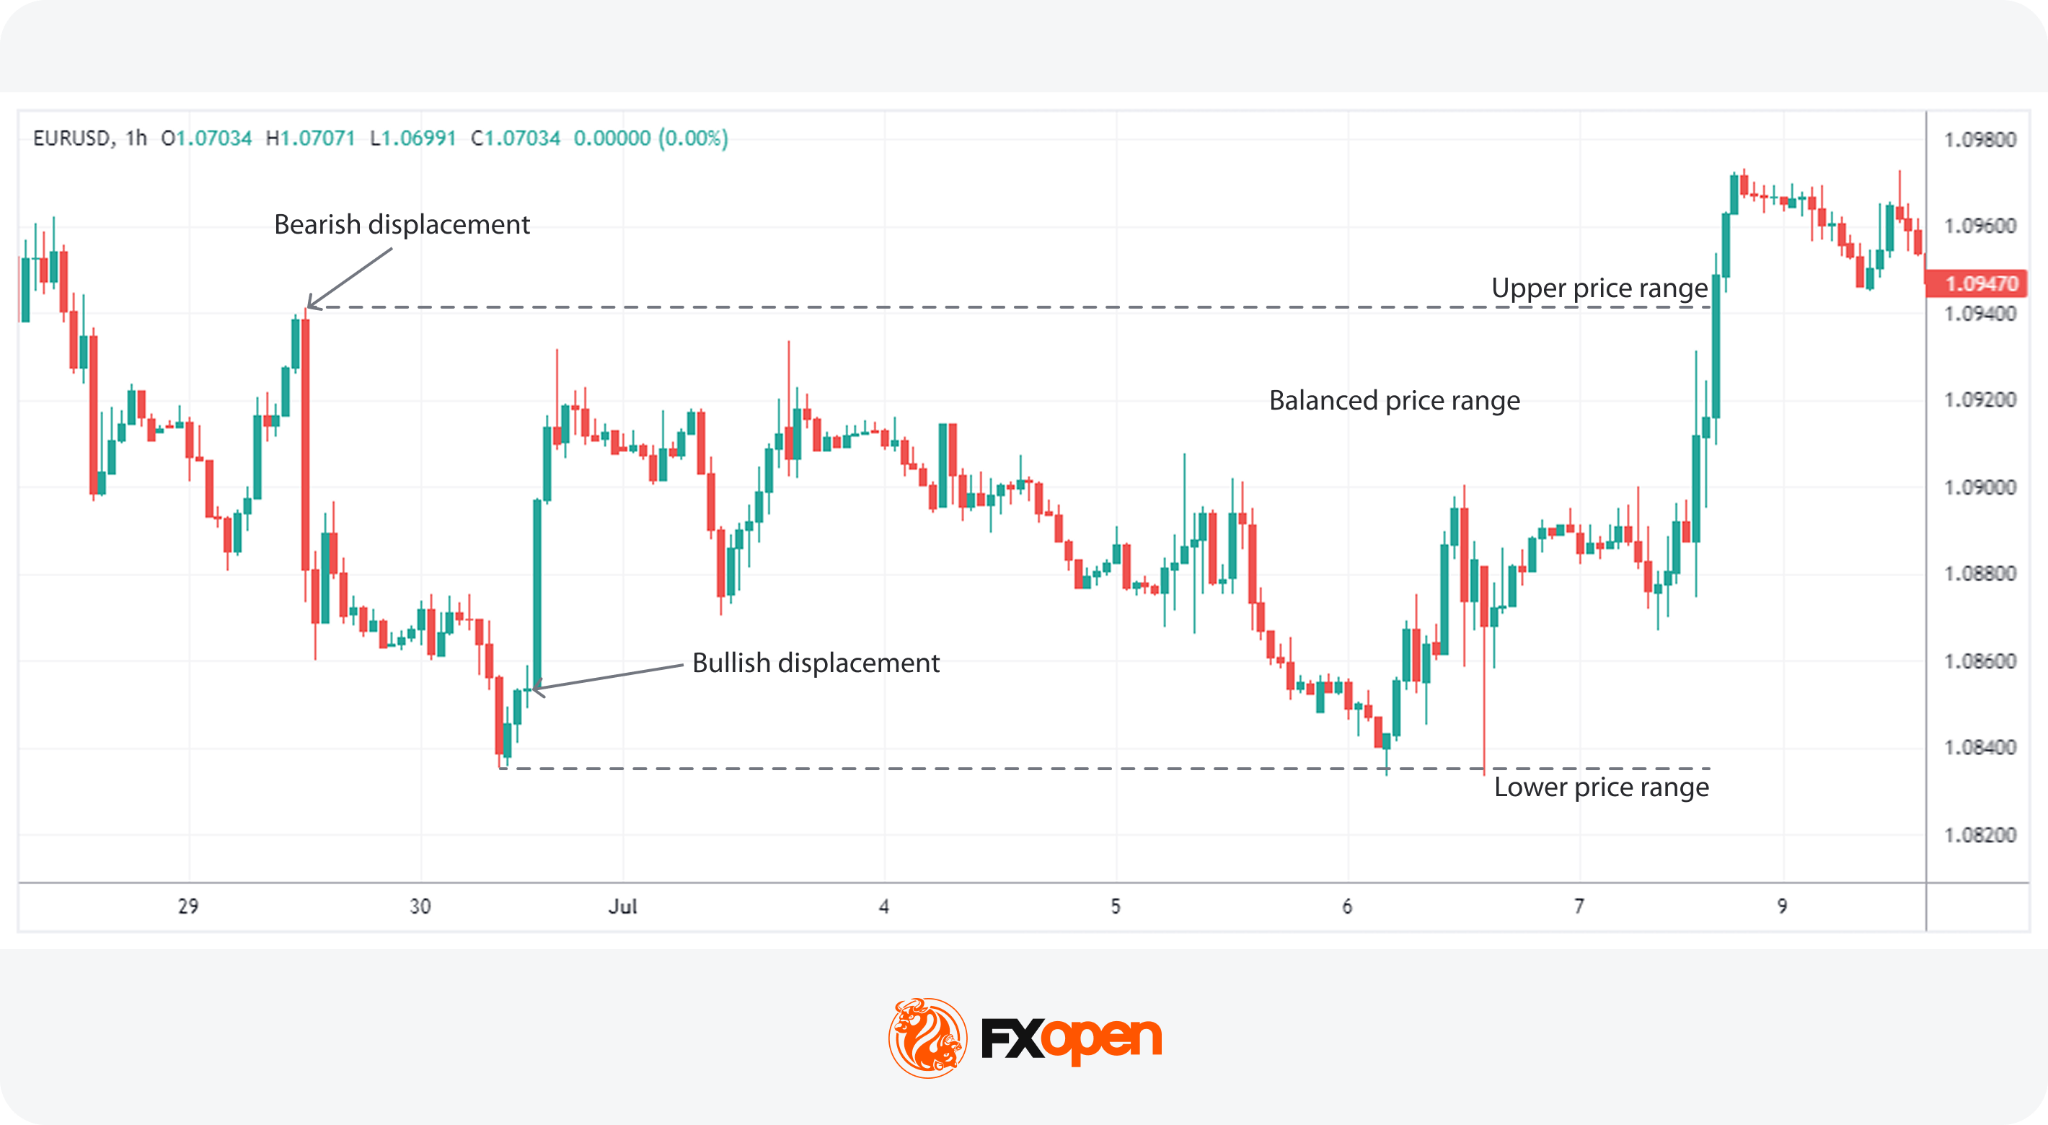
A balanced price range is a zone where price trades back and forth, rebalancing previous inefficiencies. Opposing displacements create overlapping FVGs, and the resulting zone shows where both directions have now traded. During this phase, price often oscillates between the extremes of the range as it works to resolve the imbalance.
A BPR gives traders defined boundaries rather than a single level. Reactions at the edges are watched for continuation, and a decisive move beyond either edge is read as the imbalance resolving in that direction.
ICT Trading Workflow
This is an analytical framework rather than a fixed rule set. Traders work through it in order, but each step involves judgment, and the sequence adapts to what the market is doing. It blends systematic market reading with judgment, context, and experience. The goal is to build a coherent narrative from higher-time-frame bias down to precise execution zones.
- Establishing a Higher Timeframe Bias
Traders begin by analysing the weekly, daily, and four-hour structure to identify the prevailing trend, key swing points, and major liquidity pools. This step frames whether the market is delivering higher or lower prices. - Marking Liquidity and Structural Levels
Traders identify buy-side and sell-side liquidity, including equal highs/lows, obvious stop clusters, and major swing points. Structural markers like BOS, CHoCH, and MSS may help traders understand whether momentum is intact or shifting. - Locating Imbalances and Institutional Footprints
Fair value gaps, order blocks, mitigation blocks, and displacements provide clues about where institutional orders may sit. Traders study how price reacts around these levels to understand whether smart money is adding to, mitigating, or closing positions. - Assessing Session Timing and Volatility Windows
Kill zones filter periods of heightened activity, potentially helping traders judge when ICT liquidity is likely to be taken. Timing adds context that chart patterns alone do not provide. - Building a Directional Narrative
Traders combine structural bias, liquidity targets, imbalances, and timing into a single market narrative. This sets expectations without forcing a mechanical decision. - Identify Potential Execution Zones
Areas such as retracements into order blocks, FVG fills, or OTE regions often align with points where momentum may resume. Traders use confluence, not a single signal, to refine these zones. - Review, Adapt, and ReassessAs price develops, traders reassess structure, liquidity, and displacement. The ICT strategy relies on active interpretation, so the process stays flexible.
Which Markets an ICT Concepts Be Used In?
ICT is built around price behaviour rather than the characteristics of any single market, so the same reading applies wherever there is enough participation to produce clean structure and visible liquidity.
ICT forex analysis is the most common application, particularly on major pairs, where session timing lines up directly with the London and New York kill zones. Index CFDs are the next most active area, since instruments tracking the S&P 500 or the DAX respond to the same session-driven volume. Commodities such as gold and oil, individual shares, and cryptocurrency* CFDs are all analysed with the same concepts, though liquidity and session behaviour vary between them.
Timeframes work the same way. Traders apply ICT concepts from the weekly chart down to the one-minute, usually running two or three timeframes together, with the higher one setting bias and the lower one refining entry areas. The shorter the timeframe, the more noise sits alongside the structure, which is why ICT concepts forex trading material tends to focus on the 15-minute to 1-hour range for execution.
What Challenges Do ICT Traders Face?
ICT presents several practical challenges because it demands strong chart interpretation skills and a good grasp of context. Traders often find the approach mentally demanding, especially when markets move quickly or produce conflicting signals.
Newer traders tend to struggle for a specific reason: individual concepts are easy to define, but they only make sense when combined, so learning definitions isn’t the same as being able to read a chart in real time.
The main challenges include:
- High complexity: ICT uses many concepts that interact with each other, so traders must read multiple layers of structure, liquidity, and imbalance at once.
- Context dependence: Signals rarely stand alone. Traders need to judge whether a displacement, BOS, or liquidity grab aligns with the broader narrative, which requires experience.
- Session-based variation: Price behaves differently across sessions, meaning traders must adapt to changing conditions rather than stick to fixed expectations.
- Discretion and nuance: ICT relies heavily on interpretation, so traders manage uncertainty and avoid forcing patterns that are not there.
- Emotional discipline: Because setups form quickly around liquidity events, traders face pressure to act without overreacting to noise.
ICT Trading Concepts: Advantages and Limitations
ICT trading offers a structured way to analyse price, but it also has clear limitations for traders to consider. The framework gives a detailed view of institutional behaviour, yet it remains demanding to apply consistently.
Advantages
- Institutional focus: ICT centres on how large players move price, giving traders a clearer read on why markets expand or reverse.
- Strong structural logic: Concepts like BOS, CHoCH, and MSS make trend shifts clearer than broad pattern-based methods.
- Precision in levels: Order blocks, liquidity pools, and FVGs provide well-defined areas that traders may use to take advantage of key price reactions.
- Multi-time-frame alignment: The framework links higher-time-frame bias with intraday execution, creating a coherent workflow.
Limitations
- Assumption of deliberate intent: ICT often interprets market moves as intentional actions by institutional traders, which may not always reflect how order flow actually operates.
- Steep learning curve: The depth of the framework means traders may require considerable time before applying it with consistency.
- Retrospective clarity: Many concepts appear clearer in hindsight, making them harder to apply consistently in real time.
- No fixed rules: The discretionary nature means consistency can be harder to maintain than with mechanical systems.
Whether ICT suits a particular trader depends less on the concepts themselves than on how they are used. This methodology rewards traders who are willing to tolerate uncertainty and form opinions based on multiple factors, and tends to disappoint those looking for a signal to enter a trade.
The Bottom Line
ICT trading brings market structure, liquidity, imbalances, and timing into a single framework for analysing price action. Rather than treating concepts such as BOS, order blocks, fair value gaps, and liquidity sweeps as isolated signals, traders can use them together to build a broader view of market direction and potential price reactions. As ICT relies heavily on interpretation, these concepts require practice and should be considered alongside appropriate risk management.
Traders interested in applying ICT concepts across forex and CFD markets can open an FXOpen account and access multiple markets with spreads from 0.0 pips and commissions from $1.50 per lot.
FAQs
What Is ICT Trading?
ICT (Inner Circle Trading) is a price-action methodology developed by Michael J. Huddleston. It focuses on market structure, liquidity, order blocks, fair value gaps, displacement, and session timing to analyse price movements and potential changes or continuations in market direction.
What Are the Main ICT Concepts?
The main ICT concepts include market structure, Break of Structure (BOS), Change of Character (CHoCH), Market Structure Shift (MSS), liquidity, order blocks, fair value gaps (FVGs), displacement, Optimal Trade Entry (OTE), and kill zones. Together, they form a framework for analysing price action.
What Is an ICT Trading Strategy?
An ICT trading strategy combines several concepts rather than relying on a single signal. Traders may establish a higher-timeframe bias, identify liquidity and market structure, and then look for potential entry areas using order blocks, fair value gaps, or OTE zones.
What Is the Difference Between ICT and SMC?
ICT (Inner Circle Trading) is a specific methodology developed by Michael J. Huddleston, while Smart Money Concepts (SMC) is a broader term for approaches that analyse price through liquidity and institutional market behaviour. They share concepts such as market structure, liquidity, and order blocks, while ICT uses specific terminology and models.
Is ICT Trading for Beginners?
ICT trading can be studied by beginners, but it involves numerous interconnected concepts and requires discretionary analysis. Understanding market structure, liquidity, and ICT price action first may make concepts such as order blocks, fair value gaps, and market structure shifts easier to interpret.
Does ICT Trading Use Indicators?
ICT trading primarily focuses on price action rather than technical indicators. Its core analysis is based on market structure, liquidity, imbalances, order blocks, and trading sessions. Some traders combine ICT concepts with indicators, but indicators are not central to the methodology.
Can ICT Concepts Be Used in Forex Trading?
Yes. ICT concepts are commonly applied to forex, as well as indices, commodities, shares, and other financial markets. Because the methodology focuses on price structure, liquidity, and timing, traders can analyse ICT concepts across different instruments and timeframes.
What Is the Difference Between BOS, CHoCH, and MSS?
A Break of Structure (BOS) generally indicates continuation of the existing market direction. A Change of Character (CHoCH) suggests that the current structure may be changing, while a Market Structure Shift (MSS) involves a structural change accompanied by strong displacement through a significant level.
What Is a Fair Value Gap in ICT Trading?
A Fair Value Gap (FVG) is a price imbalance created during a strong directional move. In ICT analysis, traders monitor these areas because price may later return to the gap before continuing or establishing a new direction.
Can ICT Be Combined With Other Trading Methods?
Yes. Traders may combine ICT concepts with other forms of technical analysis, such as support and resistance, trend analysis, or technical indicators. However, additional tools do not necessarily confirm an ICT setup, and each method should be assessed within the broader market context.
*Important: At FXOpen UK, Cryptocurrency trading via CFDs is only available to our Professional clients. They are not available for trading by Retail clients. To find out more information about how this may affect you, please get in touch with our team.
This article represents the opinion of the Companies operating under the FXOpen brand only. It is not to be construed as an offer, solicitation, or recommendation with respect to products and services provided by the Companies operating under the FXOpen brand, nor is it to be considered financial advice.

Get Walking Lanarkshire is looking for volunteers to assist with groups

Its most powerful production car ever

Luigi Mangione Pleads Guilty to Federal Charges


-

 News Videos6 days ago
Can Astrology Help Find Gold and Silver Trends? A Financial Astrology Guide
-

 Business5 days ago
Datadog: Best Of Breed For Multiple Reasons
-

 Tech7 days ago
Rinn Pharma & Biopharma to join NordicPharmaTrain network
-

 Business6 days ago
How to Start a Cleaning Business: A Step-by-Step Guide
-

 Business6 days ago
BDC Weekly Review: Private BDC Q2 Numbers Are Strong
-
 NewsBeat3 days ago
Communication cards help banking customers access services or report scams
-
 Business4 days ago
Oil Price Today (August 11): Crude oil rises to $88 after Trump’s compensation demand dents Hormuz opening. Here’s why
-
 Entertainment7 days ago
10 R-Rated Drama Movies That Can Be Called Masterpieces
-

 Fashion5 days ago
Amazon Sundays: Closet Care Before Fall
-

 Business7 days ago
SharkNinja Keeps Eating
-

 Politics6 days ago
Be quiet, Miriam! – spiked
-

 Business6 days ago
Mutual Fund Manager Scoops Up Beaten-Down Stocks
-

 Business5 days ago
5 Things You Must Know About Jorge Messi, the Father and Longtime Agent Who Shaped Lionel Messi’s Career
-

 Politics5 days ago
Ben-Gvir’s crocodile project halted but abuses at Ketziot Prison continue
-

 Politics7 days ago
Welsh independence campaign group YesCymru sets 2032 referendum target
-

 Tech7 days ago
Metabase SQLi zero-day exploited in customer data-theft attacks
-

 Politics5 days ago
The Church of England’s ruinous reparations racket
-
 Crypto World4 days ago
Why Did Nvidia Stock Fall on Monday Despite a $500 Billion Wall Street AI Deal?
-

 Politics6 days ago
Calls to permanently pedestrianise central Belfast following festival success
-

 Crypto World6 days ago
A Deep Dive Into One Of The Most Significant Hacks In Recent Memory
You must be logged in to post a comment Login