

Crypto World
Ripple Obtains Full MiCA License to Offer XRP Services in Europe


Ripple has received full authorization under the European Union’s Markets in Crypto-Assets (MiCA) framework after Luxembourg’s financial regulator granted the company a Crypto Asset Service Provider (CASP) license. The approval follows Ripple’s preliminary CASP approval earlier this year and, according to the company, completes its transition into the “post-transitional” MiCA regime.
The CASP authorization, combined with Ripple’s existing Electronic Money Institution (EMI) license, allows the blockchain payments firm to provide regulated crypto-asset services across the European Economic Area (EEA) under EU rules.
Key takeaways
- Ripple secured a CASP license in Luxembourg, completing its full MiCA authorization after preliminary approval in June.
- The authorization enables regulated crypto-asset services across the EEA, supported by Ripple’s existing EMI license.
- Ripple says it is among a relatively small group of firms fully authorized under MiCA.
- MiCA enforcement has begun across the EU, with ESMA maintaining an updated register of licensed providers and national regulators handling supervision.
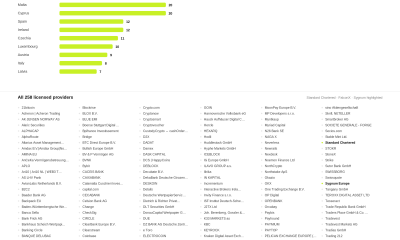
- ESMA’s latest CASP register shows licensed providers rising to 280 after 37 firms were added following the July 1 transition deadline.
Ripple’s MiCA authorization and what it enables
Ripple said it has now obtained full authorization under MiCA after Luxembourg’s regulator granted it a CASP license. The company previously received preliminary approval in June, and Ripple framed the new authorization as the end of its transition period under the EU framework.
In a statement, Cassie Craddock, Ripple’s managing director for the United Kingdom and Europe, said the CASP authorization means Ripple is “fully compliant” with MiCA and prepared to scale its operations.
For market participants, the practical significance of a MiCA CASP license is that it positions a crypto-asset service provider to operate as a regulated entity inside the EU’s MiCA system. Ripple’s mention of its additional EMI license is notable because it reflects that the company is not relying solely on the crypto-asset authorization path; instead, it brings together licensing coverage that can support a broader regulated service offering.
From transition to enforcement: MiCA’s July 1 deadline
Ripple’s authorization comes after the EU’s MiCA transition period ended on July 1. Under the framework, firms offering regulated crypto-asset services in the bloc needed authorization; otherwise, they were expected to stop offering such services.
MiCA also introduces an important structural change for authorized providers: in many cases, a single authorization can support “passporting” across the EEA, reducing the need for separate approvals in each member state. That is the mechanism Ripple is effectively leaning on, given its statement that it can offer regulated crypto-asset services across the EEA.
While licensing outcomes have improved since the deadline, the enforcement phase is now active. ESMA coordinates aspects of supervision through the register of authorized entities, but the day-to-day regulatory enforcement is carried out by national authorities—meaning implementation and pressure levels can differ across EU member states.
ESMA register update: licensed CASPs rise to 280
According to ESMA’s updated register, the number of licensed crypto-asset service providers stands at 280. The figure increased from 243 a week earlier after 37 additional companies were added, including Standard Chartered, FalconX and Sygnum Europe, as reported in the coverage linked from Cointelegraph.
This incremental jump matters for investors and counterparties because ESMA’s register acts as a key reference point for determining which entities are authorized to operate under MiCA. However, the register’s growth also highlights the uneven pace of authorization as firms work through licensing processes close to major deadlines.
Not all major players secured authorization before July 1. The source notes that Binance withdrew its MiCA application in Greece ahead of the transition and said it would pursue authorization elsewhere while working toward compliance.
Regulators step up: Belgium highlights unauthorized providers
With MiCA moving into enforcement, regulators at the member-state level have begun taking action. Belgium’s Financial Services and Markets Authority (FSMA) has already started applying the new rules.
On Monday, FSMA identified six crypto-asset service providers that it said were operating without authorization and added them to its list of unauthorized crypto-asset service providers, according to the coverage linked from Cointelegraph. The regulator also issued warnings to consumers and market participants about unauthorized platforms, underscoring that the transition is no longer a planning phase—it is an active compliance test.
For users and institutions working with EU-facing crypto service providers, this is a reminder that regulatory status is becoming a central operational variable. Authorization and supervision may be decisive factors for risk management, counterparties, and product availability.
Looking ahead, the key watch items are how quickly the authorization gap closes across remaining providers, how national regulators interpret and apply MiCA enforcement in practice, and whether additional major exchanges and service platforms reach full CASP authorization under the EU framework.

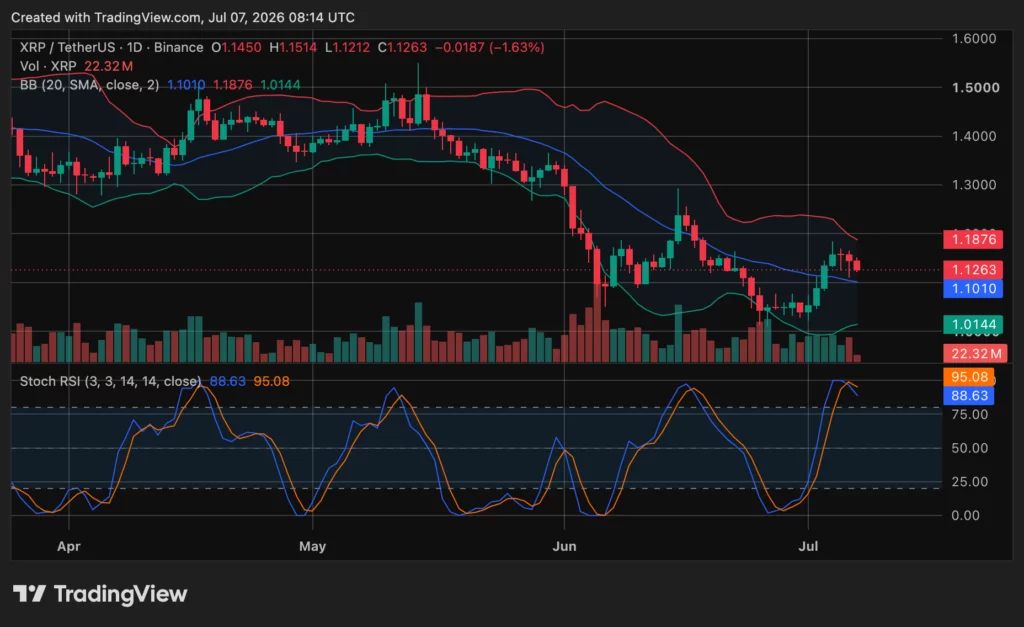
XRP traded near $1.13 on July 7, down 1.69% in the past 24 hours, according to crypto.news market data.
Summary
- XRP’s rebound needs a clear break above $1.14 to confirm stronger short-term momentum for bulls.
- ETF inflows remain positive, but CLARITY delays have removed a near-term policy catalyst for XRP.
- Spot CVD has improved across exchanges while Binance perpetual traders keep selling into rebounds.
The token moved between $1.11 and $1.16 during the session, while trading volume stood at about $1.73 billion.
The rebound from the late-June low near $1.00 remains intact, but buyers have not yet turned it into a stronger breakout. the token pushed back toward the $1.14 to $1.18 zone, but it failed to hold the upper part of that range.
The price now sits near a short-term decision area. A close above $1.14 would show that buyers are gaining control. A clean move above $1.18 to $1.20 would give bulls a stronger signal and place the next resistance levels back in focus.
The downside level is also clear. If XRP loses $1.10, the current rebound would weaken. A move below that area could expose $1.06, which some traders now see as the next retest zone.
XRP ETF inflows help, but policy catalyst slips
The recovery has come while XRP-linked investment products continue to attract demand. The latest background data showed spot XRP ETFs recorded a ninth straight week of net inflows, adding $17.19 million despite broader policy uncertainty.
Those inflows have helped support the market, but they have not been enough to break the larger downtrend. As previously reported, XRP ETFs gave investors regulated access, but they did not solve the wider legal question around XRP’s status under U.S. law.
The CLARITY Act remains the main policy catalyst for many traders. The bill missed its July 4 target and now faces an Aug. 7 deadline before the Senate’s summer break.
That delay removed a near-term trigger for digital assets. The bill has passed the House, cleared the Senate Banking Committee, and sits on the Senate calendar, but staff still need to merge Banking and Agriculture versions before a full Senate vote.
Moreover, Standard Chartered has said XRP ETFs could attract $4 billion to $8 billion in first-year inflows if CLARITY passes. That forecast depends on legal clarity unlocking larger institutional demand.
Technical setup stays mixed
The XRP/USDT daily chart shows price recovering from the late-June low, but the broader trend remains weak after the June breakdown. The token is trading above the middle Bollinger Band near $1.10, which keeps the short-term rebound alive.
The upper Bollinger Band sits near $1.18. That matches the area traders are watching for a stronger breakout. Until the token closes above that zone, the move remains a rebound inside a weak structure rather than a confirmed trend shift.
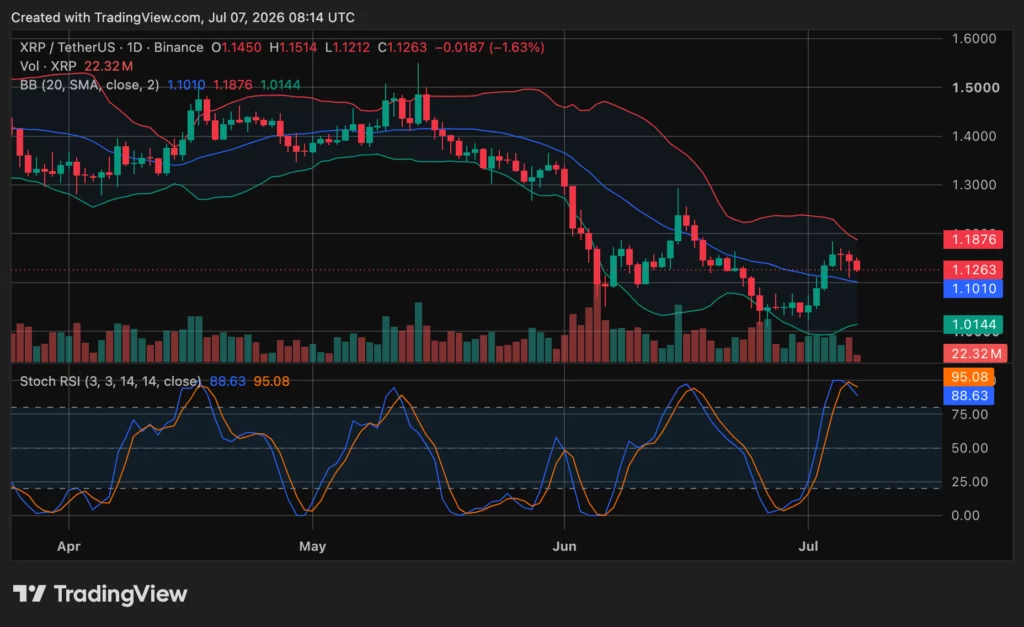
The lower Bollinger Band sits near $1.01. That level remains important if selling pressure returns. A break below $1.10 would increase the risk of a move back toward that area.
Momentum also shows a mixed picture. The Stochastic RSI is elevated, with readings near 88.63 and 95.08. That shows strong short-term momentum, but it also places XRP close to overbought territory. Since the faster line has moved below the slower line, the rebound may be losing some force.
EGRAG Crypto said XRP must defend $1.10 after moving below the 21 EMA on the four-hour chart. He said, “Hold $1.10 = structure still alive,” while a loss of $1.06 would increase caution.
Dark Defender took a more bullish weekly view and said XRP is “launching the Wave 5 without the Clarity Act.” Other analysts also pointed to higher long-term targets, but those views still depend on price clearing the current resistance zone first.
Spot demand rises while perps stay defensive
On-chain and derivatives data show a split market. CryptoQuant analyst Amr Taha said XRP’s estimated spot CVD across centralized exchanges rose from about minus $42 million on May 12 to plus $406 million by July 7.
That change points to stronger spot buying across exchanges. It suggests market buyers have absorbed more available XRP supply over the past two months.
The derivatives market shows the opposite trend. Binance perpetual CVD fell from about minus $48 million to minus $783 million over the same period. That shows sustained sell-side pressure from perpetual traders.
Open interest also fell from about $255 million on May 22 to $203 million on July 7. That drop suggests leveraged traders have reduced exposure while spot buyers have become more active.
Binance spot data has improved, but it has not turned positive. Estimated spot CVD on Binance rose from about minus $212 million on June 25 to minus $173 million on July 7, showing that selling pressure has eased but not fully reversed.
Disclosure: This article does not represent investment advice. The content and materials featured on this page are for educational purposes only.


Japanese bonds are challenging the boost bitcoin has received from shifting interest-rate expectations that lifted the price of the largest cryptocurrency by 8% in fewer than seven days.
The 10-year Japanese government bond (JGB) yield has surged to a 30-year high of 2.85%, adding 18 basis points since the start of the month and raising borrowing costs across other major developed markets.
The U.S. 10-year Treasury yield has gained nearly three basis points and is testing 4.5% for the first time in nearly a month. The German 10-year bund is approaching 3% and the U.K. 10-year gilt is yielding around 4.8%. Real yields, which are adjusted for inflation, are also climbing.
For years, Japan kept global yields suppressed through near-zero interest rates and aggressive quantitative easing. That policy fueled carry trades that involved borrowing yen at a low rate and investing in high-yielding bonds elsewhere. Thus, Japan indirectly capped borrowing costs in advanced nations.
This matters for bitcoin because higher government bond yields increase the opportunity cost of holding an asset that generates no cash. Capital parked in BTC is capital not earning the stronger, more reliable returns available in fixed income.
Solana (SOL) has climbed back to around $80.84 even as traders cut their leverage, and Solana TVL has reached its highest level since early June, a sign real money is backing the move.
Deposits into Solana apps and buying from long-term holders are rising while futures positioning shrinks. That combination points to spot demand rather than borrowed bets.
Leverage Comes Out After a Squeeze
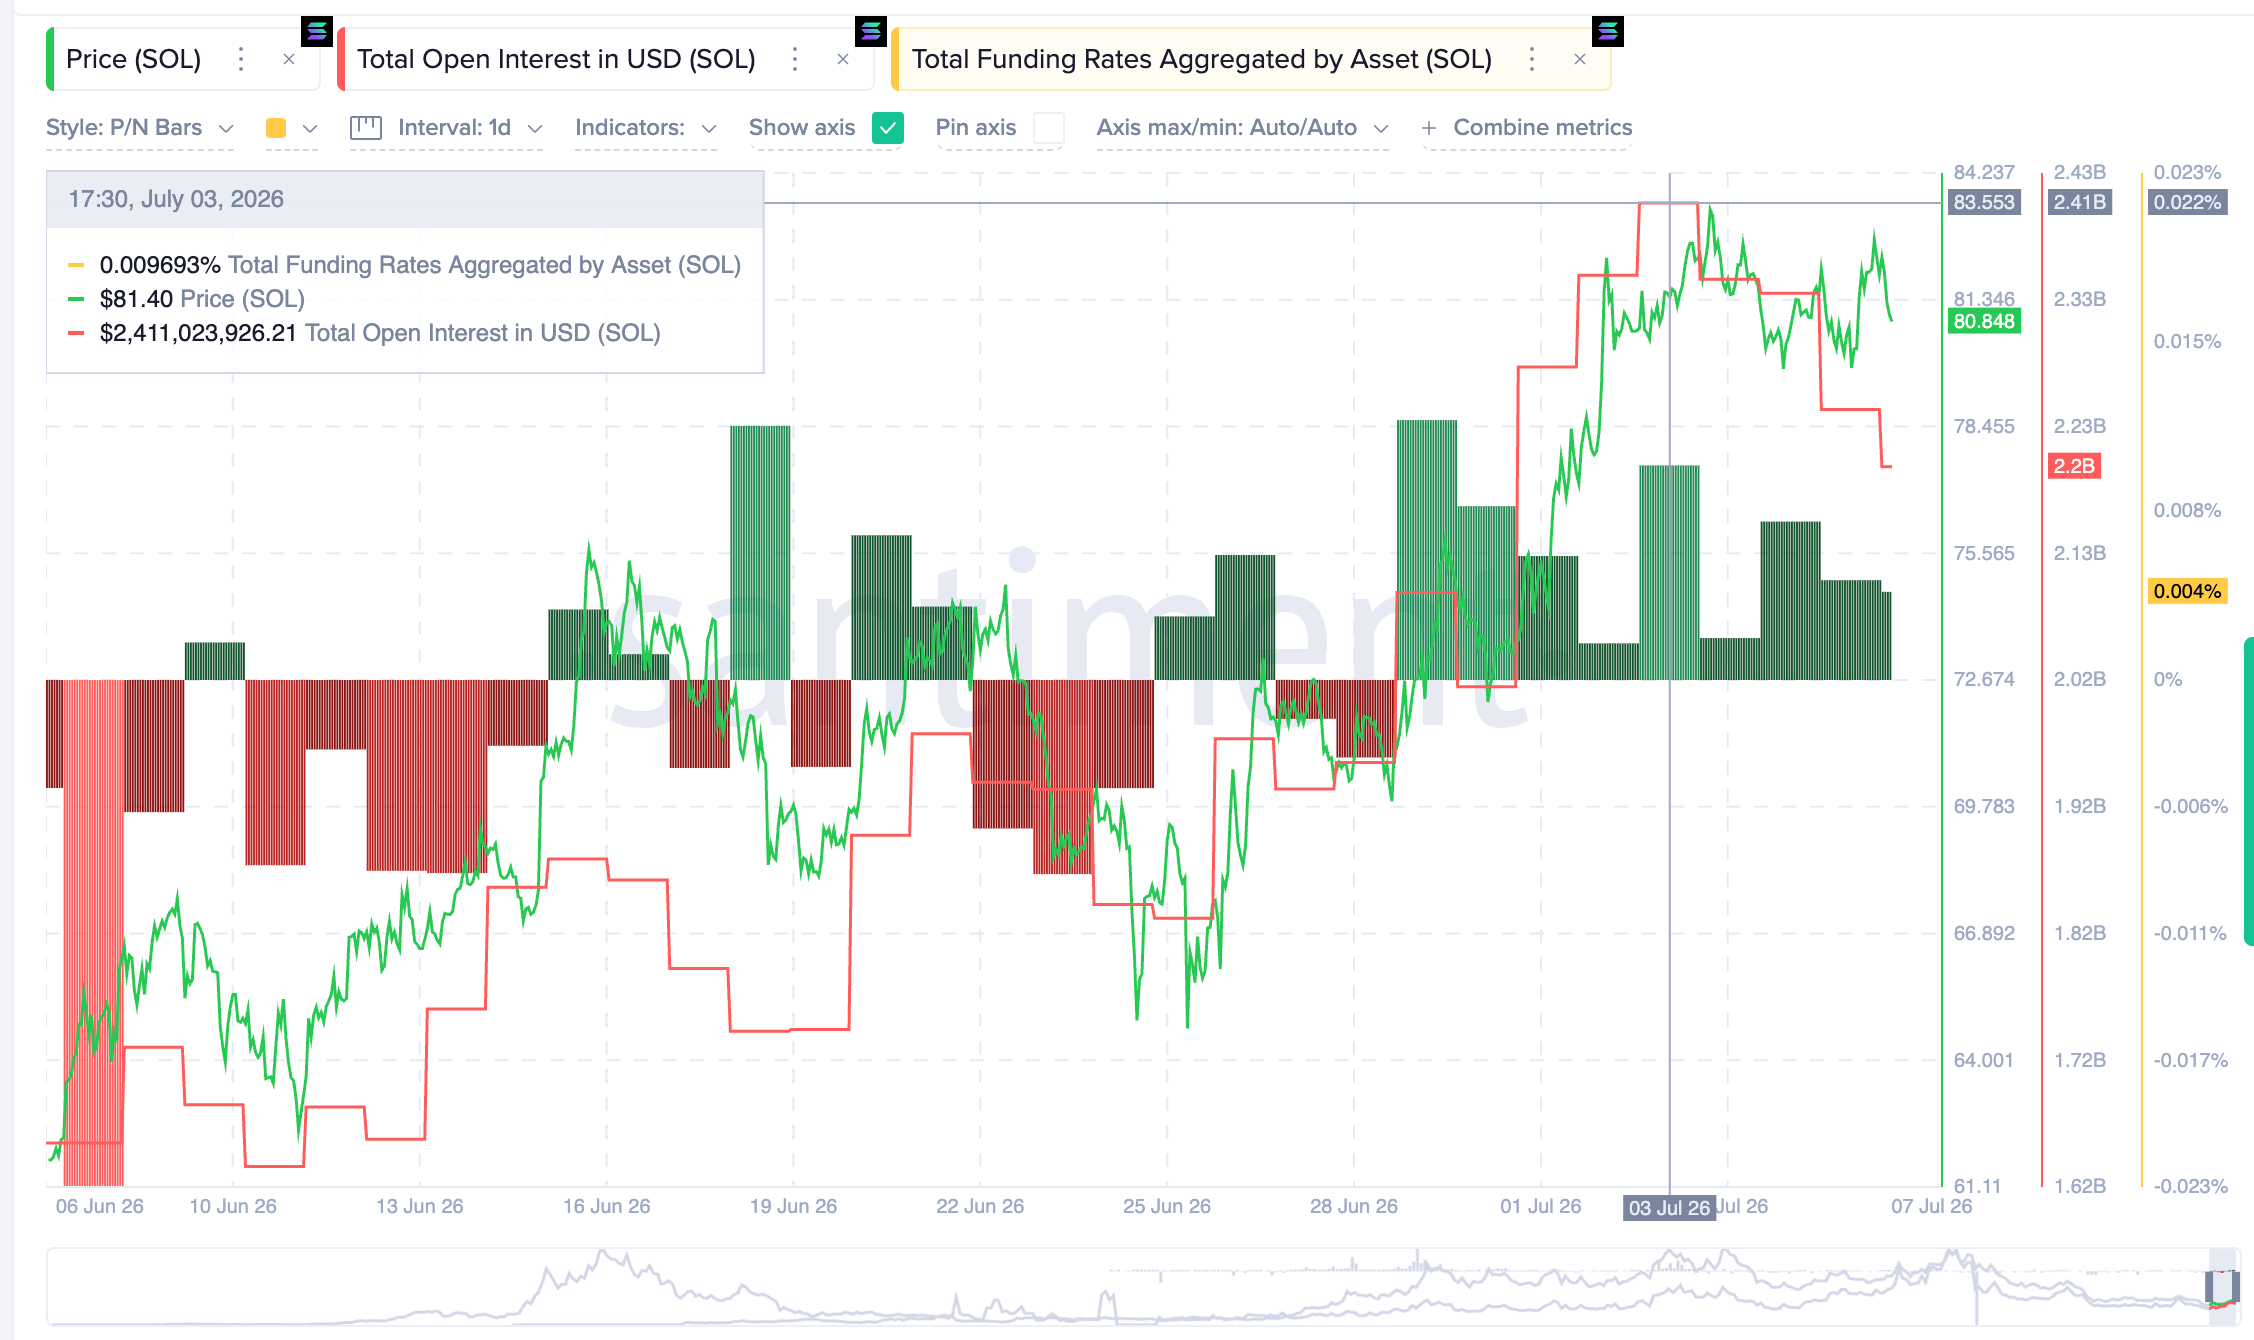
On July 4, SOL traded near $82 with open interest, the total value of active futures contracts, around $2.41 billion. Its funding rate, a small fee that shows whether traders lean long or short, sat positive at 0.009%, a mark of crowded long bets.
Want more token insights like this? Sign up for Editor Harsh Notariya’s Daily Crypto Newsletter here.
That positioning unwound when the market dipped, flushing leveraged longs and pulling SOL to about $79.72 on July 6, close to a 3% drop. A squeeze like that forces overstretched buyers to sell, but it also clears out fragile bets.

Since then, open interest has eased to about $2.20 billion and funding has cooled to 0.004%. Even so, the SOL price recovered to $80.84, so the bid now looks spot-driven rather than borrowed.
Rallies built on leverage tend to reverse fast once funding flips. A move that strengthens while open interest falls usually has real demand behind it.
Long-Term Holders Keep Buying the Dip
The recovery lines up with steady buying from Solana’s most patient wallets. Holders who have kept SOL for one to two years grew their share of supply from 14.64% to 15.60% since June 29. Holder conviction here comes from HODL Waves, an on-chain metric that groups Solana’s supply into cohorts by how long the coins have been held.

This cohort added coins through the shakeout rather than selling into it, marking the largest accumulation in weeks.
Because these long-term holders keep buying through volatility, the pool of coins available to sell keeps shrinking. That absorption helps explain why the July 4 flush did not deepen.
Solana TVL Hits a Five-Week High
The same conviction shows up in Solana TVL, or total value locked, the amount of money deposited across the network’s apps. It climbed about 10% from $4.66 billion on June 26 to about $5.11 billion on July 4, also its highest since early June.
Crucially, that Solana DeFi TVL kept rising while open interest fell, and it held the high through the price dip. Capital is flowing into apps, not leverage into futures.
The deposit growth began around late June, the same window long-term holders started adding. That overlap suggests the two trends share a source, steady conviction rather than a quick trade.

Stablecoin supply on Solana strengthens the case. It sits around $15.6 billion, just below the roughly $16 billion peak set on July 3, leaving dry powder that can fund more buying if demand holds. The stablecoin supply still remains higher than late June levels.
Together, the leverage reset, holder accumulation, and rising Solana TVL point one way. The move rests on deposits and patient buyers, not funding, which gives it a firmer base than a leveraged bounce. More so when the Solana price is up over 9% in the weekly timeframe. Whether it lasts may show first in TVL (network health) and holder flows (on-chain conviction).
The post Solana TVL Just Hit a 5-Week High: Should Traders Pay Attention? appeared first on BeInCrypto.
Key Takeaways
- South Korea’s benchmark KOSPI index plummeted 4.9%, activating circuit breakers for the sixth occasion in 2025
- Samsung projected a 19-fold surge in Q2 operating profit, yet its stock price declined nearly 7%
- Market experts suggest AI-related earnings projections have become unsustainably elevated
- Individual traders capitalized on the downturn, snapping up 3.2 trillion won worth of stocks
- SK Hynix unveiled a $28 billion American share offering, attracting preliminary investor attention
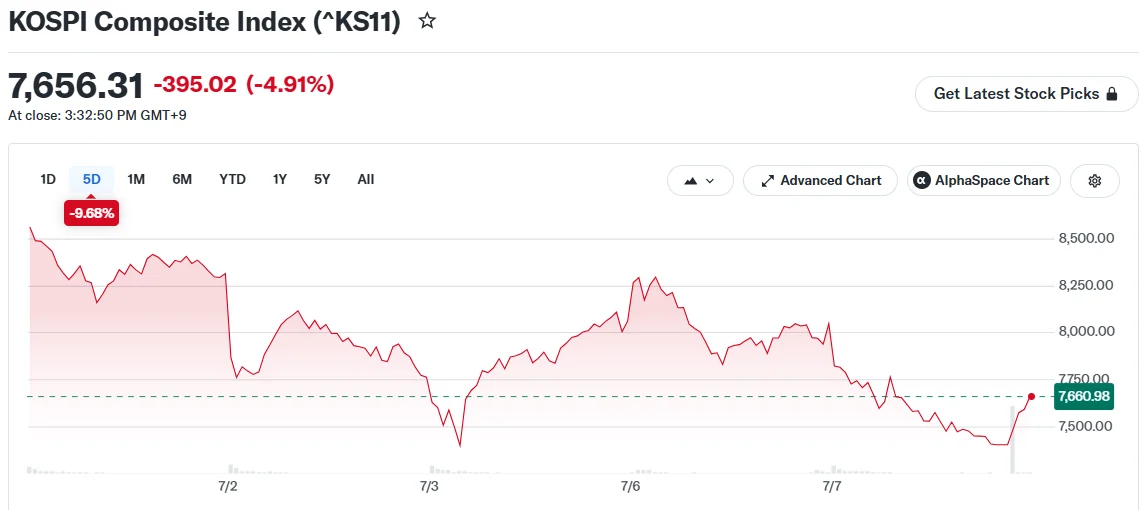
Tuesday proved turbulent for South Korea’s equity markets. The KOSPI benchmark concluded trading down 4.9%, settling at 7,656.31. During intraday trading, the index had plummeted more than 8%.
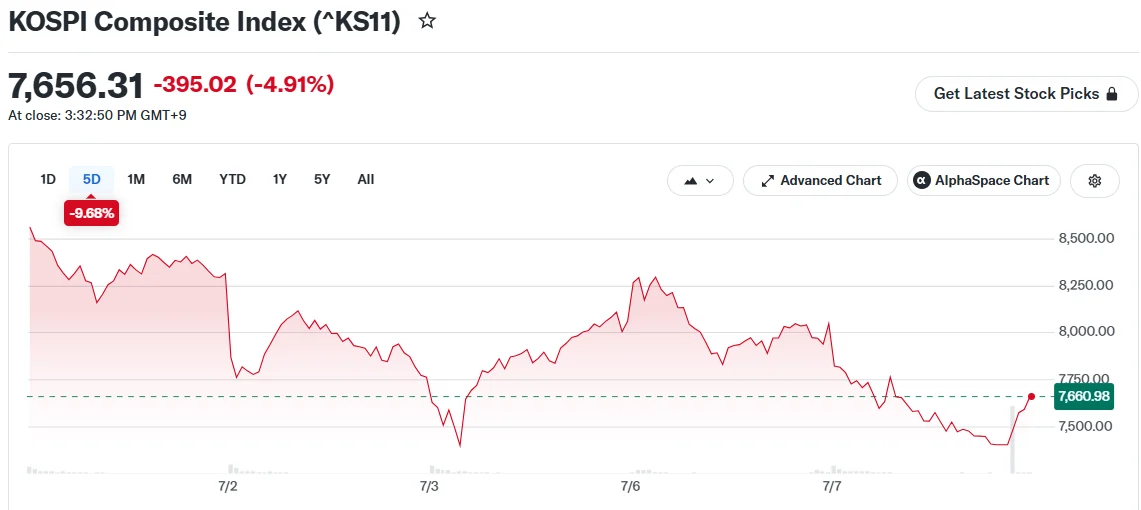
Trading halts were activated through circuit breaker mechanisms. This marked the sixth such interruption in 2025 amid semiconductor stock turbulence.
Record Samsung Results Meet Market Skepticism
Samsung Electronics found itself in the eye of the storm. The tech giant projected second-quarter operating profit at 89.4 trillion won, approximately $58 billion. This represents a nineteen-fold expansion compared to last year’s corresponding quarter and marks its third consecutive record-breaking period.
Yet Samsung’s shares tumbled nearly 7% during the session. Intraday declines exceeded 10% at their worst.
Market observers indicate these impressive figures had already been priced into valuations. Seo Sang-young from Mirae Asset Securities noted, “Market expectations have grown too high to be raised further.”
Competitor SK Hynix declined 6.1%. Japan’s memory chip manufacturer Kioxia experienced losses surpassing 10%.
The KOSPI had more than doubled year-to-date before reaching an all-time peak in late June. Since that milestone, approximately 20% has evaporated.
Changing Dynamics in AI Investment Sentiment
The market’s response indicates a transformation in investor attitudes toward artificial intelligence stocks. Throughout recent months, semiconductor companies enjoyed rewards merely for exceeding earnings projections. That pattern now appears to be evolving.
Charu Chanana of Saxo Markets observed, “Strong earnings are no longer enough.” She emphasized that investors now demand robust earnings, optimistic guidance, and evidence of sustainable pricing advantages.
Albert Yong from Petra Capital Management suggested the sharp decline reflects investor attention shifting toward the memory cycle’s long-term trajectory rather than immediate quarterly results.
International investors offloaded 2.9 trillion won in Korean equities Tuesday. Domestic retail traders countered by purchasing 3.2 trillion won, moderating the index’s early steep losses.
AI Investment Activity Continues Despite Volatility
Not every development suggested retreat from artificial intelligence exposure. SK Hynix initiated an American share issuance targeting approximately $28 billion, generating initial enthusiasm from significant institutional investors.
Broadcom extended its semiconductor supply agreement with Apple through 2031, alleviating worries that Apple might internalize additional chip production.
Wall Street advanced overnight. The Dow increased 0.29%, the S&P 500 rose 0.72%, and the Nasdaq gained 1.12%, buoyed by optimism surrounding AI-powered earnings performance.
Additional Market Developments
LG Energy Solution fell 6.4% following its projection of a 77% operating profit decline attributed to softening electric vehicle demand.
Hanwha Ocean crashed 22.7% after Canada selected German submarines over South Korean alternatives.
Crude oil prices advanced following a tanker incident near the Strait of Hormuz. US crude climbed to $68.92 while Brent reached $72.34.
Investors remain attentive to the upcoming Federal Reserve meeting minutes release, the inaugural publication under new Fed Chair Kevin Warsh.



Binance has introduced a product for bitcoin holders looking to earn extra yield on their investment without selling any of it, joining the likes of BlackRock in helping them maximize returns.
The product, BTC Yield, is available inside Binance Earn and is designed exclusively for people who already hold bitcoin.
Users deposit their bitcoin into the product and receive an internal position called BTCY, which tracks their share in the strategy. Everything remains denominated in BTC, and the product cannot be funded with stablecoins or other assets.
Binance holds the deposited bitcoin as collateral while systematically selling BTC call options, that is, it writes insurance against price rallies in BTC. The call seller, or writer, gets compensated with a premium. Binance collects those premiums and shares most of them with participants.
This covered-call approach, common in crypto and traditional finance, has typically required deep options knowledge to execute. Binance’s version makes it accessible to regular traders by handling everything behind the scenes.
Two types of return
The product generates potential returns in two ways.
First, a portion of the collected premiums is converted to bitcoin and distributed to users’ spot accounts every Friday as a possible weekly payout.
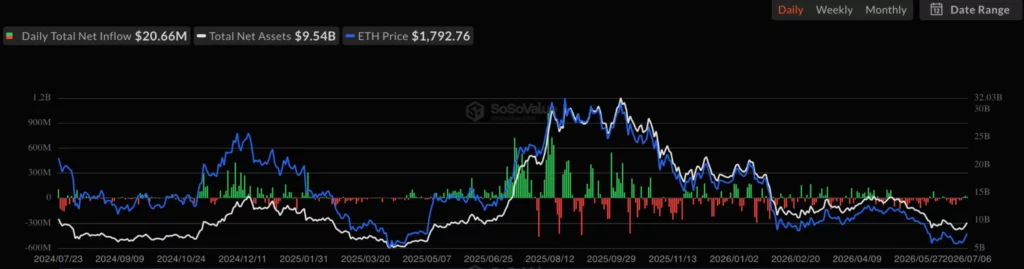
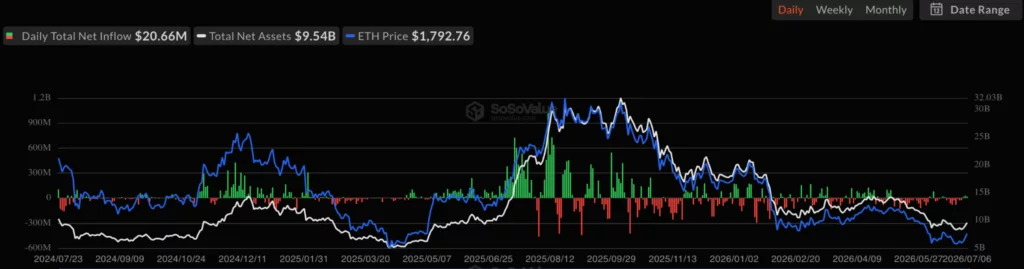
Ethereum traded near $1,777.49 at the time of writing, up 0.5% in the past 24 hours, according to crypto.news market data.
Summary
- Ethereum must close above $1,800 to strengthen the short-term bullish setup, analysts say.
- Binance liquidity has improved, but rising exchange reserves still pose selling pressure near $2,000 resistance.
- MACD and RSI support recovery, while $1,750 remains the key level for bullish invalidation.
The token had a 24-hour low of $1,732.10 and a high of $1,819.88, while daily trading volume stood near $17.08 billion.
The move kept ETH close to the $1,800 area, which traders now view as the main short-term resistance zone. The token has recovered from the sharp June selloff after buyers defended the $1,500 to $1,600 area.
The current setup has turned attention to a daily close above $1,800. Analysts say that level could decide whether ETH builds a stronger recovery or stays trapped in a range above $1,700.
Ethereum climbed about 12% from July 1 as weaker U.S. jobs data and renewed spot ETF inflows brought buyers back into the market. According to SoSoValue data, on July 6, Ethereum spot ETFs recorded a total net inflow of USD 29.082 million, led by BlackRock’s ETHA with USD 29.742 million in single-day net inflows.
Analysts watch $1,800 and $1,844
Analyst Ali Charts said Ethereum is testing the 0.8 MVRV Pricing Band near $1,796. He said the same area aligns with the TD Sequential resistance trendline, making it a key technical level for traders.
Ali said a daily close above $1,796, followed by a hold as support, would strengthen the bullish case. He added that a move through the TD risk line at $1,816 could open the way for a test of the channel resistance near $1,844.
“A break above both $1,796 and $1,816 could trigger a bullish breakout,” Ali said in his Ethereum setup. He placed Ethereum’s realized price target near $2,245 if buyers clear those levels and hold momentum.
Daan Crypto Trades also pointed to $1,800 as the level that matters most on the current timeframe. “If bulls can get a daily close over $1,800, that’d be the first sign of strength for me,” he said in an X post.
The lower level remains clear. Daan and Ali both pointed to $1,750 as the support that bulls must defend. A loss of that level would weaken the current setup and could return focus to the $1,700 area.
Indicators support short-term recovery
The ETH/USDT daily chart shows a recovery from the June low. ETH bounced from the $1,500 to $1,600 range and moved toward $1,800 before cooling slightly.
Momentum indicators support the rebound. The MACD histogram is positive near 31.83, while the MACD line sits near -4.67 and above the signal line near -36.50. This shows improving momentum, though the MACD line still needs to move above zero to confirm a stronger trend shift.
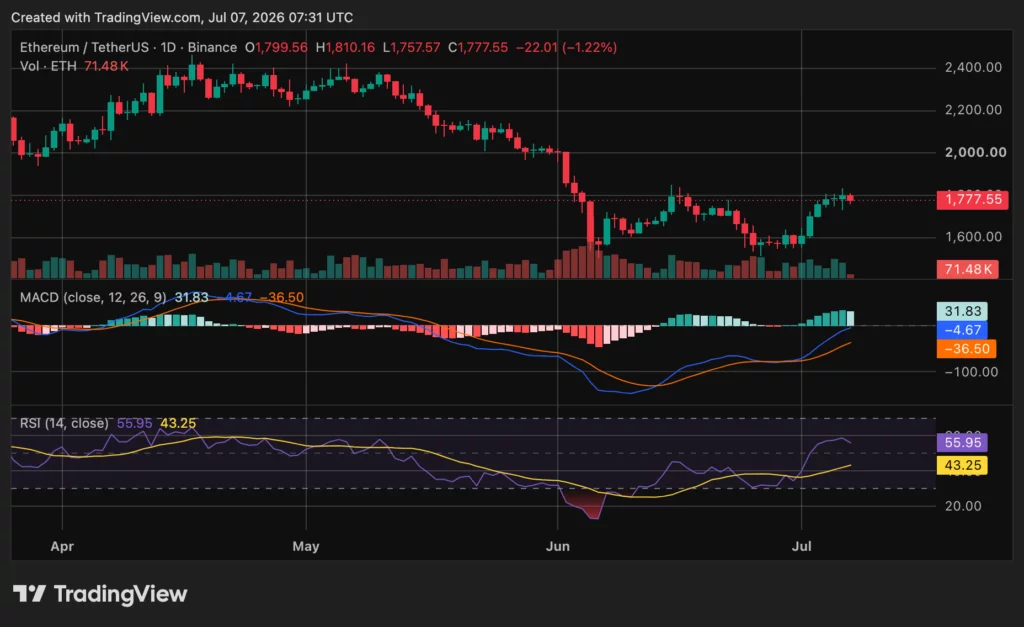
The RSI is also improving. It sits near 55.95, above its moving average near 43.25. That places RSI above the neutral 50 level, which shows buyers have short-term control without pushing the token into overbought territory.
As previously reported, Ethereum had already shown a rare TD buy signal while spot Ethereum ETF inflows returned.
Binance liquidity improves, but reserves raise risk
On-chain data gives a mixed view. CryptoQuant analyst Arab Chain said the ETH Binance 30-day exchange liquidity ratio rose to about 5.22. The reading was based on about 20.32 million ETH in 30-day trading volume and around 3.8 million ETH in Binance reserves.
That means each ETH held on Binance turned over more than five times during the period. The reading points to active trading and better use of available exchange liquidity. It also suggests that Binance can support strong ETH trading activity without a large rise in reserves.
Still, rising exchange supply remains a risk. CryptoQuant analyst BorisD said Binance held about 3.893 million ETH, while Bitfinex held 2.2 million ETH, OKX held 1.18 million ETH, and Bybit held 314,000 ETH. He said ETH inflows into Binance and OKX could add selling pressure if demand fails to absorb the extra supply.
Moreover, Binance users had already increased their ETH balances by 10.17% to about 4.14 million ETH in its June proof-of-reserves snapshot. Larger user balances can reflect deposits, purchases, internal transfers, or account activity, so the data does not show one clear reason.
The next test sits near $1,800. A clean daily close above that level could push ETH toward $1,844, then $2,060 and $2,245. A rejection, or a break below $1,750, would keep Ethereum in a choppy range and raise the risk of another move toward $1,700.
Disclosure: This article does not represent investment advice. The content and materials featured on this page are for educational purposes only.

Key Takeaways
- Sixteen months have passed since Trump’s executive order establishing a Strategic Bitcoin Reserve, yet implementation remains stalled
- A jurisdictional battle between Treasury and Commerce departments has created operational paralysis
- DOJ involvement seeks to clarify which agency possesses legitimate legal oversight
- Two congressional bills—the BITCOIN Act and ARMA Act—aim to provide statutory framework for the reserve
- America’s current Bitcoin holdings total 328,372 BTC, valued at approximately $21 billion
A bureaucratic turf war between federal agencies has thrown a wrench into the Trump administration’s ambitious plan to establish a Strategic Bitcoin Reserve.
In March 2025, President Trump issued an executive order designating the Treasury Department as the custodian for this digital asset reserve. The directive also called on additional federal entities to contribute to the stockpile through confiscated assets.
However, more than a year later, the initiative has yet to materialize. According to a Bloomberg report, the Commerce Department has now positioned itself as an alternative candidate for managing the cryptocurrency holdings.
The central dispute revolves around regulatory jurisdiction. Concerns have surfaced regarding Treasury’s legal capacity to manage Bitcoin, with some citing the cryptocurrency’s inherent price fluctuations as a complicating factor.
The Department of Justice has entered the fray, collaborating with both competing agencies to determine viable legal pathways forward.
The White House has maintained neutrality in this inter-agency conflict. Press Secretary Liz Huston stated the administration is “continuing to evaluate the best structure” for implementing the reserve.
Legislative Efforts to Establish Legal Framework
Congressional lawmakers have introduced two separate bills designed to provide statutory legitimacy to the reserve concept. Both the BITCOIN Act and the ARMA Act, filed in May, propose accumulating up to one million Bitcoin over a five-year timeline using fiscally neutral mechanisms.
White House cryptocurrency advisor Patrick Witt characterized ARMA as “Version 2” of the BITCOIN Act. He noted that significant White House resources have been dedicated to examining the legal complexities surrounding reserve establishment.
ARMA includes provisions requiring any Bitcoin deposited into the reserve to remain untouched for a minimum of two decades, with the sole exception being sales to offset the national debt, which is nearing $40 trillion.
Neither bill has advanced to passage. Should Republicans forfeit their House majority in upcoming midterm elections, the probability of legislative success would diminish substantially.
America’s Existing Bitcoin Position
The US government presently controls 328,372 Bitcoin, with a market value hovering around $21 billion. This position establishes the United States as the world’s largest sovereign Bitcoin holder.
That said, segments of these holdings have been liquidated periodically through judicially mandated sales.
At the time Trump signed his initial executive order, Bitcoin was trading near $93,000. The price has subsequently declined to approximately $64,000, representing a roughly 33% decrease.
Despite the delays and price volatility, some industry observers maintain optimism. Tim Kotzman, host of the Bitcoin Treasuries Podcast, suggested the reserve legitimizes “an entirely new category of capital allocation.”
On a global scale, 15 nation-states maintain Bitcoin holdings. El Salvador stands alone as the only country to have formally institutionalized a Bitcoin reserve program with regular acquisition protocols.
According to his latest financial disclosure documents, Trump personally holds Bitcoin assets exceeding $50 million.
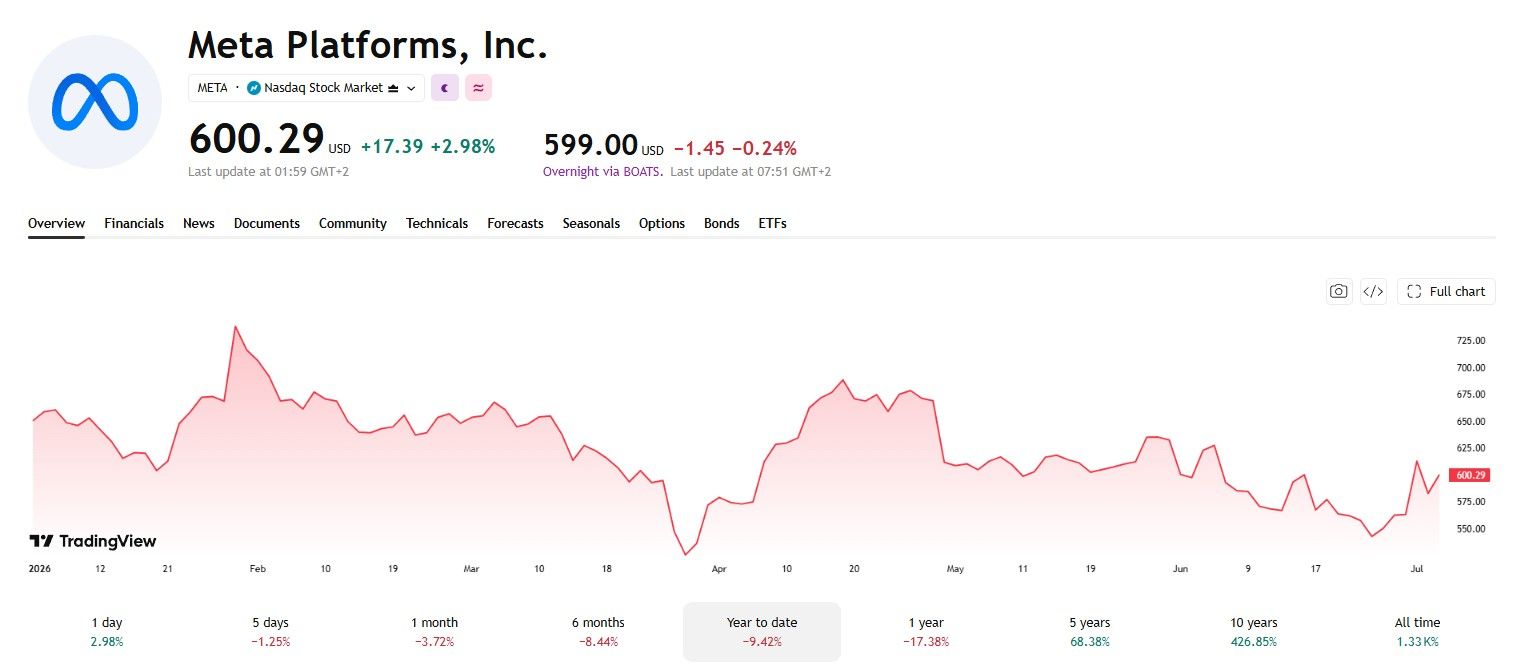
Meta Platforms disclosed that four US states want $1.4 trillion in penalties over claims it built Facebook and Instagram to addict teenage users.
California, Colorado, Kentucky, and New Jersey filed the demand ahead of a federal trial in Oakland this August. Meta called the figure unsupported by the evidence.
A Penalty That Nearly Matches Meta’s Market Cap
The demand sits just below Meta’s market capitalization of roughly $1.5 trillion. In other words, the four states want almost everything the company is worth.
The tech giant revealed the number in a court filing that responded to the states’ proposed penalty math. The company argued that no consumer protection case in US history comes close.
“A sanction of that size has no analog in the history of consumer protection enforcement.”
The disclosure caps a bruising year. The stock already saw $175 billion wiped off its market capitalization in one April session after a $145 billion AI spending outlook rattled shareholders.
How the States Calculated the Fine
The states’ filings remain sealed. However, they told the court in June that they multiplied estimated violations against young users by fine amounts set in state law.
The August trial covers far more than four states. Overall, 29 states accuse Meta of collecting children’s data without parental consent under the Children’s Online Privacy Protection Act (COPPA).
Judge Yvonne Gonzalez Rogers rejected Meta’s bid to cancel the trial last month. Meanwhile, the teen mental health debate around the company keeps growing louder.
Meta denies the claims. It argues that social media addiction is not an established psychiatric condition, so its safety statements could not mislead anyone.
A further 14 states will press similar claims at a second trial in February. Therefore, the Oakland case only opens a much longer legal fight.
Meta Stock Shrugs Off the Trillion-Dollar Threat
The stock closed near $600 on July 6, up almost 3% on the day. Investors clearly treat the $1.4 trillion figure as an opening bid rather than a likely outcome.

Still, the shares have dropped about 10% in 2026, and large funds keep rotating into Google stock. Polymarket traders also bet on rising tech layoffs as Meta employee morale craters.
New Mexico offers a warning, though. A jury there ordered Meta to pay $375 million in March for misleading consumers about child safety.
The Oakland verdict will show how far state consumer laws can stretch against Big Tech. Meta also faces a separate class action over data sharing, so its courtroom calendar stays full into 2027.
The post Meta Faces $1.4 Trillion Penalty Demand in US Youth Safety Lawsuit appeared first on BeInCrypto.
Gold is attempting to break its medium-term trend, with the latest US labour market data acting as the main catalyst. The US employment report released on 2 July came in noticeably weaker than expected, with the pace of hiring slowing to its lowest level in several months. This may have dampened expectations of a near-term Federal Reserve rate hike, while the minutes of the Fed’s June meeting, due to be released on 8 July, could provide further insight into how long this pause in the central bank’s rhetoric is likely to last. For now, markets are pricing in a more dovish scenario, supporting safe-haven assets such as gold.
Technical Analysis
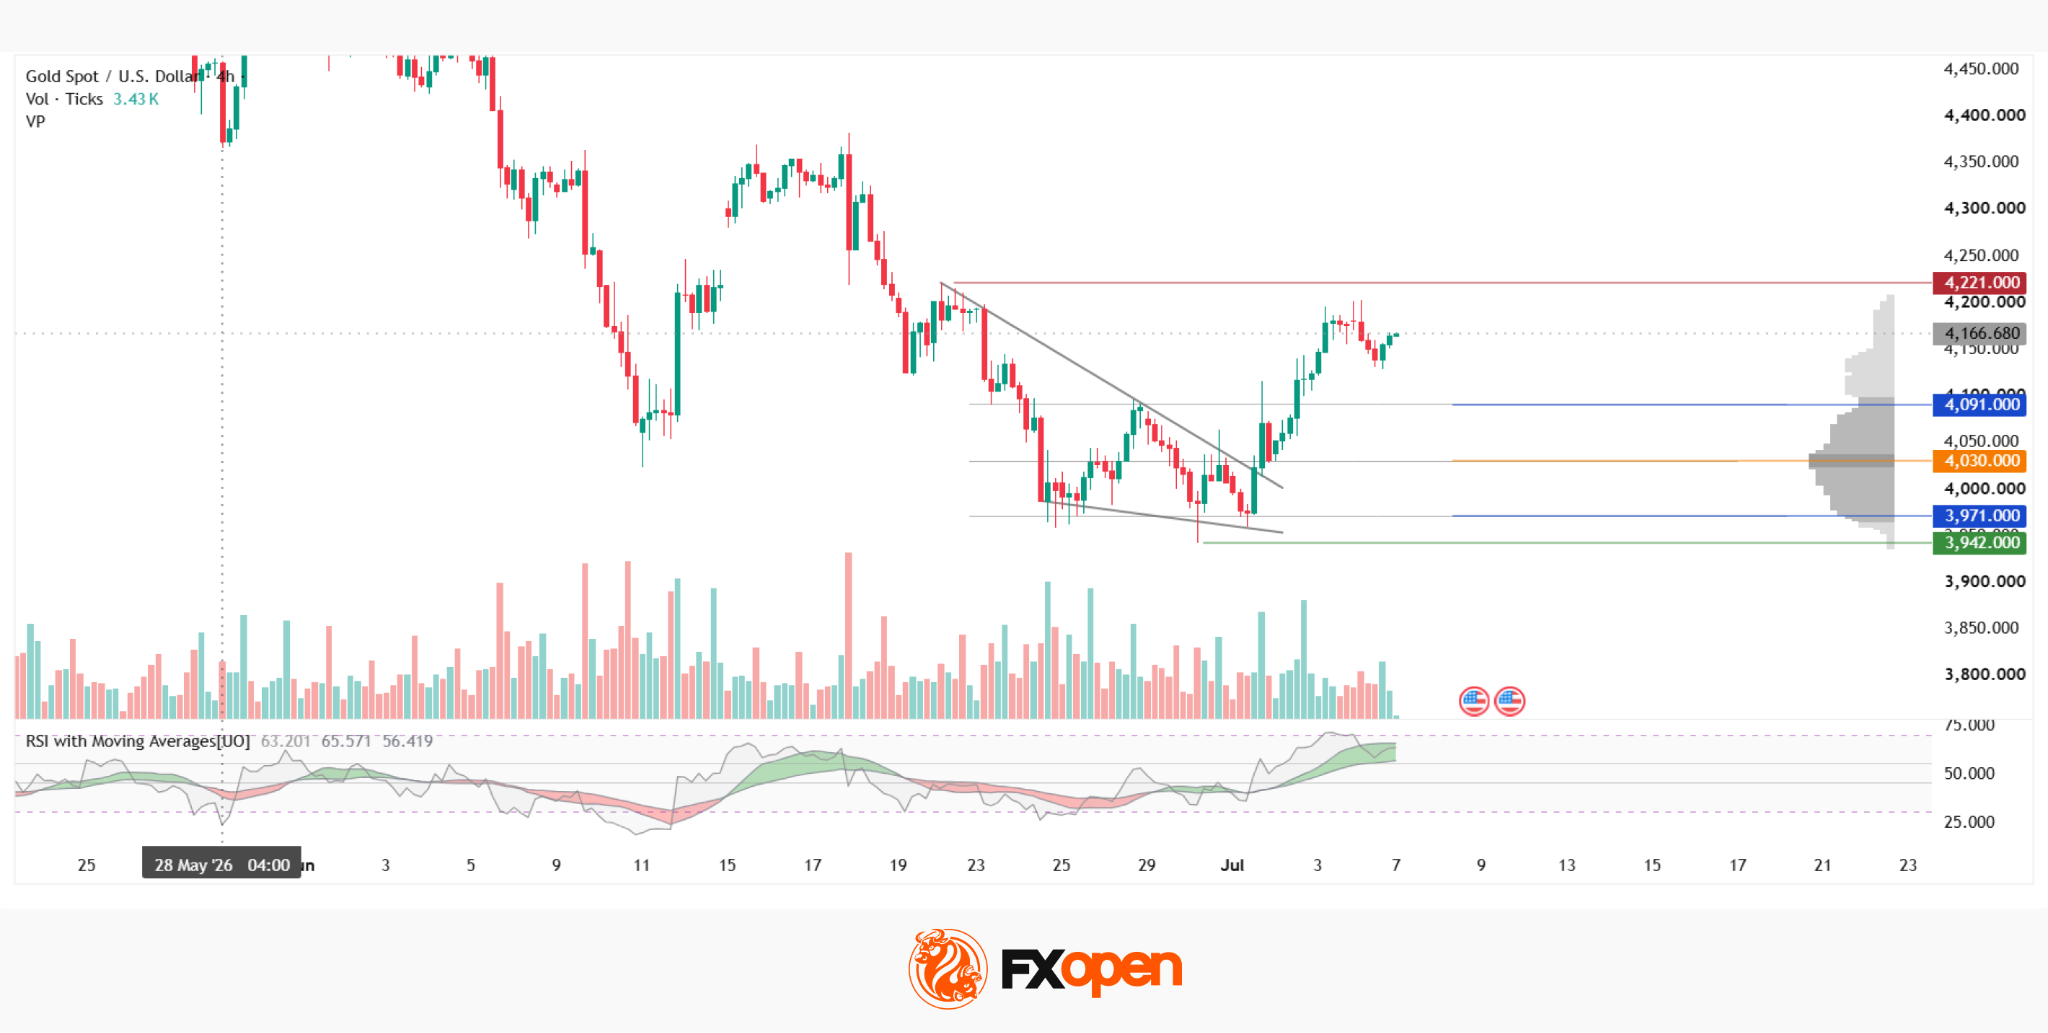
On the four-hour chart, XAU/USD declined from the $4,221 area in late June to around $3,942, where a recovery began. The decline formed a descending wedge, with its lower boundary attracting strong buying interest. This resulted in a sharp rebound, accompanied by a decisive breakout above both the pattern and the current market profile.
On 2 July, price closed above the upper boundary of the market profile at $4,091 and, if the rally continues, could target the base of the wedge. Should the market reverse, price is likely to retest the profile’s high-volume area, while the Point of Control (POC) at $4,030 and the lower profile boundary at $3,971 could provide support for buyers.
The RSI + MAs indicator currently stands at 62, 65 and 55. All three lines remain above the neutral level and continue to point higher, while the moving averages are still signalling bullish momentum. However, it is worth noting that the RSI has already entered overbought territory, suggesting that expectations for a substantial continuation of the rally should remain cautious.
Key Takeaways
The breakout from the descending wedge may have been interpreted by market participants as the beginning of a local trend reversal. However, a move towards the red resistance zone and a test of that area remain highly uncertain, particularly ahead of the release of the Federal Reserve’s June meeting minutes, which could significantly reshape market expectations.
Trade over 50 forex markets 24 hours a day with FXOpen. Take advantage of low commissions, deep liquidity, and spreads from 0.0 pips (additional fees may apply). Open your FXOpen account now or learn more about trading forex with FXOpen.
This article represents the opinion of the Companies operating under the FXOpen brand only. It is not to be construed as an offer, solicitation, or recommendation with respect to products and services provided by the Companies operating under the FXOpen brand, nor is it to be considered financial advice.
SpaceX stock (SPCX) enters the Nasdaq-100 before US markets open on Tuesday. The move lands as SPCX trades roughly 29% below its recent peak.
Nasdaq confirmed on June 26 that SPCX would join, less than a month after its June 12 listing.
SPCX Stock Gives Back Its Post-IPO Gains
Space Exploration Technologies Corp went public on June 12, reaching a valuation of nearly $2 trillion. The shares opened near $150, well above the $135 IPO price.
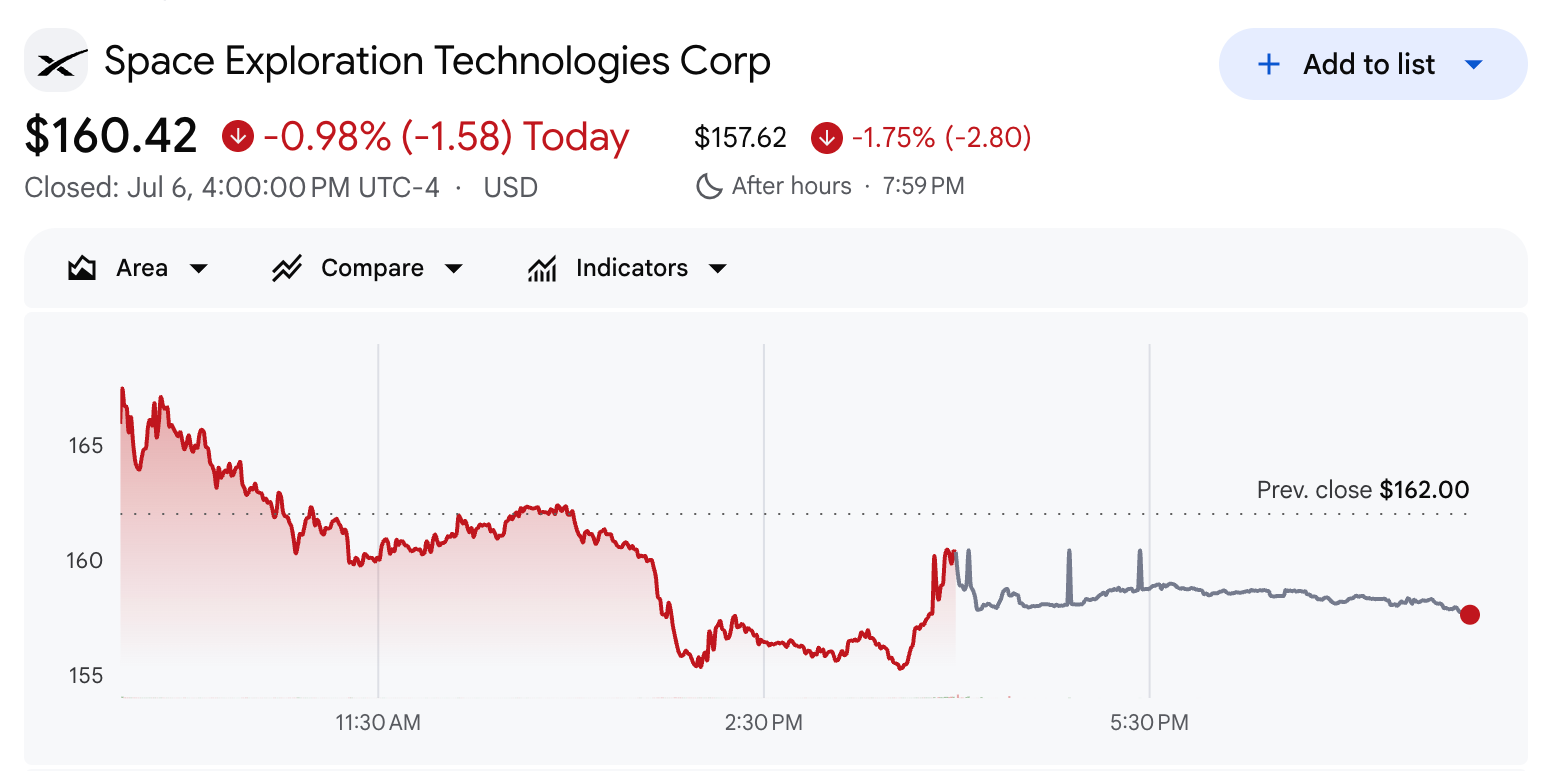
The initial rally carried the SPCX stock to an all-time high of $225.64. However, the stock has since retreated sharply.
SPCX has fallen roughly 29% over the past few weeks. The stock closed at $160.42 on Monday, down -0.98%.

What the Inclusion Means for SPCX
Index-tracking funds must buy SPCX to match the benchmark. That demand can lift a stock, though the effect depends on its weight.
Follow us on X to get the latest news as it happens
JPMorgan estimates SpaceX will carry about a 1.3% weight, ranking near 21st, behind names like Nvidia, Walmart, Intel, and Tesla.
“But the smaller the percentage weighting within the index that any given constituent holds, the less stock anybody trying to track that index is going to have,” Mike Khouw, chief strategist at OpenInterest.PRO, told CNBC. “Make no mistake, this is still very high volatility.”
Volatility also remains a concern. JJ Kinahan, senior vice president at Cboe, urged caution over near-term swings.
“We know volatility is high. There’s a sense volatility may increase. Are you comfortable with a $20 expected move over the next 11 days?” he said.
Meanwhile, expiring lockups could work against the buying. Insider restrictions lift in tranches between 70 and 135 days after the June 12 IPO. Shares held by Elon Musk and other large backers stay locked for 366 days.
Susquehanna analyst Charles Minervino called the schedule a near-term overhang for the stock, since fresh supply may hit just as index demand builds. The next sessions will test whether index buying can offset that overhang.
Subscribe to our YouTube channel to watch leaders and journalists provide expert insights
The post SpaceX Joins Nasdaq-100 Tuesday as SPCX Drops Roughly 29% appeared first on BeInCrypto.

Motorcyclist dies in crash involving crop sprayer

Info Edge shares surge 11% after Q1FY27 billings rise 14% YoY

Steve McBee Makes 1st McBee Dynasty Season 3 Cameo Before Jail


-

 Fashion4 days ago
Weekend Open Thread: High Hopes
-

 Fashion16 hours ago
Open Thread: What Great Books Have You Read Recently?
-

 Politics4 days ago
The House | “Reframing the debate from a binary discussion of winners and losers”: Yuan Yang reviews ‘We Are Not Machines’
-
 NewsBeat2 days ago
Taylor Swift and Travis Kelce wedding staffer hilariously struggles to keep her cool while checking in megastars
-

 News Videos7 days ago
How to Build INSANE Live Financial Dashboards With Claude
-
Crypto World6 days ago
Airdrop Registration Becomes Key Focus For Remittix As RTX Launch Updates Approach
-

 Sports6 days ago
Broncos roster: OL Ben Powers (No. 74) entering final year of contract
-

 Crypto World5 days ago
Binance stock trading tops $1B in first month after launch
-

 NewsBeat6 days ago
Presenter Caroline Flack’s brother Paul Flack dies aged 55
-
 Crypto World4 days ago
Standard Chartered Secures MiCA License as ESMA Adds 37 New Crypto Firms
-

 Crypto World5 days ago
Alibaba-affiliate Ant Group enters the humanoid robot market with 12 deals
-

 Crypto World2 days ago
South Africa proposes crypto tax guidance under existing rules
-

 News Videos17 hours ago
Best Time to Enter Small Caps Right Now? Another Bull Run? | Financially Free
-

 Business5 days ago
Meta Platforms Stock Jumps 7% Today as Bloomberg Reports Company Plans to Enter the Cloud Business
-
 NewsBeat5 days ago
New exhibition reflects five decades of movement between island of Ireland and GB
-
 Tech2 days ago
Lenovo laptops are now shipping with YMTC SSDs, a sign of Chinese NAND entering the mainstream
-

 Business4 days ago
What a 10 Percent Drop Means for Buyers, Sellers and Renters
-

 Crypto World4 days ago
Binance Re-Enters Philippines As EU MiCA Rules Restrict Access
-

 News Videos5 hours ago
Whats Hidden Inside This Cash Register? #treasure #reselling #money
-

 News Videos20 hours ago
Avoid entering in FOMO #bitcoin #cryptocurrency #trading #scalping
You must be logged in to post a comment Login