

Crypto World
Saylor Signals BTC Buy Ahead of Preferred Dividend Date Vote


Strategy, the billion-dollar holder of Bitcoin in the corporate treasury space, is once again sparking investor intrigue as a pivotal proxy vote on its STRC dividend schedule nears. Executive chairman Michael Saylor used social media to hint at forthcoming news regarding the company’s BTC holdings, posting a chart that tracks Strategy’s Bitcoin purchases over nearly six years. The message, paired with a broader push from the firm’s leadership, arrives just days before shareholders vote on whether STRC dividends should switch from a monthly cadence to a semi-monthly one.
Market context matters here. Strategy is reported to own 843,706 BTC, with an average cost basis of about $75,701 per coin. Bitcoin itself traded around $62,150 during the reporting window, having declined roughly 16.6% over the past week. The numbers underscore a contrast between a large, patient holder and the near-term price volatility that can accompany major treasury moves.
Last week, Strategy paused new Bitcoin accumulation after repurchasing some corporate debt, a move that briefly unsettled traders who feared potential liquidity needs could force BTC sales. The interplay between debt management, treasury buybacks, and the proposed dividend change forms the core of the current investor dialogue.
Key takeaways
- Michael Saylor signaled potential news on Strategy’s Bitcoin holdings through a social post and a tracking chart, suggesting upcoming disclosure or activity ahead of the STRC dividend vote.
- Strategy reportedly holds 843,706 BTC with an average purchase price near $75,701 per Bitcoin, while BTC traded near $62,150 amid a weekly price drop of about 16.6% (CoinMarketCap data).
- The STRC dividend proposal would shift from monthly to semi-monthly payments, aiming to reduce reinvestment lag, improve liquidity, and enhance market efficiency, pending approval by 50% of outstanding shares as of a set date.
- A recent debt repurchase pause raised concerns about funding flexibility and potential BTC selling, highlighting the delicate balance Strategy must maintain between liquidity needs and its Bitcoin accumulation strategy.
- Retail proxy-voting participation remains modest relative to institutions, a dynamic that could influence the outcome of the STRC vote regardless of the underlying fundamentals.
Hints of renewed BTC activity as the vote approaches
In a highly anticipated sequence of moves, Saylor’s X post—“A good time to add more dots”—was accompanied by a link to a chart tracking Strategy’s Bitcoin purchases since the firm began accumulating BTC. The chart, maintained by StrategyTracker.com (an Iceland-registered tracker used by the investor community), has become a recurring preface to any news about new BTC activity from Strategy. The cadence and visibility of these posts have underlined Saylor’s appetite for transparency around Strategy’s Bitcoin treasury, even as the voting process unfolds.
Phonemically echoing the same theme, Strategy’s CEO Phong Le amplified the message, stating that the company’s corporate strategy is to increase net Bitcoin and Bitcoin per share over time. “Rumors otherwise are just rumors,” he said in a follow-up post, reinforcing the leadership’s stance that the treasury strategy remains intentional and forward-looking.
For investors, the implications hinge on whether Strategy uses any new purchases to support an expanding BTC stack or to reinforce the existing position’s cost basis amid a volatile price backdrop. The average cost of 75,701 per BTC provides a rough guide for evaluating near-term purchases against current price levels, though market dynamics and funding considerations will ultimately shape execution if and when purchases are announced.
BTC’s price context matters too. The firm’s holdings sit against a broader market where Bitcoin traded around $62,000, after a pronounced weekly drop. Such price action can influence decisions on timing and size of any new acquisitions, particularly for a publicly traded vehicle with a stated objective of growing BTC exposure per share.
Readers may recall that last week’s debt repurchase move temporarily paused additional Bitcoin accumulation. In the immediate aftermath, traders weighed the possibility that the company could be compelled to liquidate some BTC to finance buybacks. While there is no public indication that such a sale is imminent, the episode underscores the tension between liquidity management and ongoing accumulation goals.
STRC dividend cadence: what the proxy asks for and why it matters
The current ballot asks Strategy’s shareholders to approve a change in the way STRC dividends are paid—from a traditional monthly cadence to semi-monthly installments. Management argues that semi-monthly payments could reduce reinvestment lag, improve market liquidity, increase price stability, and narrow spreads by offering more frequent entry and exit points for investors. In a keynote tied to the Synergy26 conference for registered investment advisers, Saylor described the potential impact as a reduction in volatility and an improvement to the Sharpe ratio, noting that while thousands of companies pay quarterly dividends and a subset pays monthly, Strategy would be among the few to pay twice monthly if approved.
The mechanics of passage are clear: the amendment requires the support of 50% of all STRC shares outstanding as of April 17, 2026, which totals 85 million shares. The final decision is expected to land at Monday’s shareholder meeting, pending any last-minute developments. In practice, the voting dynamic could hinge on how many retail holders participate. A Harvard Law School Forum on Corporate Governance acknowledgment of voting patterns shows retail investors historically casting around 29% of their shares, compared with 77% by institutional holders, a gap that could influence outcomes that depend as much on participation as on price signals.
In parallel coverage, market observers have also noted Strategy’s leverage-facing dynamics in its broader Bitcoin model, with discussions of stress tests and the resilience of a treasury-driven approach in the face of volatility. While such analyses provide important context, the STRC vote remains the decisive lever for governance-related changes to the company’s dividend policy and liquidity management framework.
For reference, the STRC-vote story sits within a larger ecosystem of corporate treasury strategies and how, in practice, large BTC holders navigate liquidity, leverage, and governance risk. Related coverage on Strategy’s leveraged Bitcoin approach has highlighted the stress-testing dimensions that accompany a treasury-led model, underscoring that even well-capitalized programs must adapt to market conditions and shareholder expectations.
What comes next and what to watch
The next days will clarify whether Strategy moves forward with new BTC activity and how the STRC dividend change is received by the market. Investors should watch for any formal disclosures of additional Bitcoin purchases, as indicated by Saylor’s public signals and the StrategyTracker channel, alongside updates from Strategy’s proxy solicitations and voting results as the Monday meeting concludes.
In the broader context, the vote reinforces ongoing debates about how corporate treasuries should balance growth objectives with liquidity and governance norms. As Strategy contends with market volatility and a changing dividend landscape, readers should monitor how the outcome could affect correlations between Bitcoin holdings and shareholder value, especially for investors tracking how treasury policy translates into market behavior and risk-adjusted returns.
Next steps will hinge on the voting outcome, potential new BTC activity, and how the market perceives the balance between Strategy’s treasury strategy and the evolving needs of its investors. If the semi-monthly dividend shift passes, expect increased attention on how the company times reinvestments and how liquidity management shapes future BTC accumulation decisions.



Robinhood reports Q2 earnings on July 29, covering a quarter that ended June 30. Robinhood Chain launched July 1. The company’s biggest strategic bet contributed exactly zero to the numbers being reported, which makes Wednesday’s call something rarer than a results event: a live interrogation of three weeks of casino data, with retail shareholders holding the microphone.
Summary
- Robinhood reports second-quarter results after the close on July 29, with consensus at roughly $0.41 per share on about $1.27 billion in revenue and options markets pricing a 12.6% post-earnings move, well above the 9% average.
- The quarter ended June 30; Robinhood Chain launched July 1. The company’s defining strategic project contributed nothing to the period being reported, making the call a disclosure event about three weeks of post-quarter data rather than a results event.
- That data is awkward: roughly $13 million in tokenized stocks against a single memecoin that touched $156 million, daily chain fees near $198,000 inflated by a 90-day gas subsidy, and a security-incident string capped by the SCATMAN account hijack.
- The Q1 template looms over everything: crypto revenue fell 47% to $134 million, broke the quarter, and triggered a 13% selloff, while event-contract revenue surged 320% to $147 million, quietly passing crypto as a transaction line.
- The structural dates matter more than the print: the chain’s gas subsidy expires around the end of September, a $121 million HOOD unlock adds supply, and the shareholder Q&A platform guarantees the chain questions get asked on the record.
Earnings calls are usually about the past, which is why Robinhood’s on July 29 is worth more attention than its consensus estimates suggest: it is structurally incapable of being about the past. The second quarter the company will report ended on June 30. Robinhood Chain, the Ethereum layer-2 that chairman Vlad Tenev has framed as the company’s bridge to tokenized finance, went live on July 1, one day into the next quarter. Every number in the release, revenue, crypto take rates, event-contract volumes, describes a company that did not yet have its blockchain, while every question that matters on the call describes the three weeks in which it did: weeks that produced a top-five DEX by volume, a $156 million cat-themed memecoin named after the company’s original working name, roughly $13 million in the tokenized stocks the chain was ostensibly built for, and a hijacked SpaceX account rug-pulling a token on Robinhood’s own rails. Management will present the quarter it had. The market, the analysts, and, through Robinhood’s upvoted shareholder Q&A, its own retail base will interrogate the quarter it is having. That gap, between the reported period and the reportable story, is the cleanest lens on Wednesday’s event, and this piece maps both sides of it: the print the consensus is pricing, and the chain accounting nobody has seen yet.
The print: what Q2’s actual numbers must answer
Start with the quarter that will legally be the subject, because its shape is inherited from a first quarter that ended badly and instructively.
Q1, reported April 28, was a miss with a diagnosis. Total revenue of $1.07 billion grew 15% but landed below the $1.13-1.17 billion analysts expected, net income rose 3% to $346 million, or $0.38 per share, and the stock fell 13% the next day, because one line broke the quarter: cryptocurrency transaction revenue collapsed 47% year over year to $134 million, from $252 million, on crypto volumes down 48% to $24 billion, the third consecutive quarter of declining transaction revenue, which the company attributed plainly to falling crypto asset prices. The same release contained the offsetting story that has since become the bull case’s center of gravity: other transaction revenue, primarily event contracts, surged 320% to $147 million on a record 8.8 billion contracts traded. Read those two lines together and a structural fact emerges that the coverage has been slow to absorb: prediction markets already out-earn crypto trading at Robinhood. The company’s future-of-finance revenue engine, for now, is not tokens. It is contracts on outcomes, the product category currently being litigated across a dozen states in the war this publication mapped last week.
Q2’s consensus builds on that base: roughly $0.41 per share, down about 2% year over year, on revenue near $1.27 billion, up 28%, with the mix expected to rhyme with Q1, strong equities and options (management said April volumes tracked toward the highest month of the year, with CFO Shiv Verma noting “Q2 is off to a good start in April”), continued event-contract momentum through a World Cup June in which the category’s platforms printed record volumes, and a crypto line that KeyBanc’s upgraded-but-clear-eyed preview expects to stay subdued into the second half. The options market prices a 12.6% move against a 9% four-quarter average, which is the derivatives desk’s way of saying this print carries more scenario risk than usual. The analyst posture into it is constructive and repriced upward, KeyBanc to $125, Needham to $123 with its financial-super-app framing, and both raises cite a variable no spreadsheet contains: the CLARITY Act, whose Senate endgame is running this exact week, and whose passage would reprice the regulatory footing of every crypto revenue line Robinhood reports.
The absence: what the chain’s zero contribution means
Now the structural oddity, because it defines the event.
Robinhood Chain launched its public mainnet on July 1, which means the quarter under report contains not one day, dollar, or transaction of the company’s most-discussed initiative. That is not a triviality of the calendar; it changes the epistemics of the call. In a normal quarter, management’s claims are disciplined by the reported numbers sitting beside them. On Wednesday, everything said about the chain will be forward-looking commentary on post-period data that the company curates, selectively, in whatever frame it chooses, and the frames available range widely, because the three weeks in question produced numbers that support any narrative. Bullish selection: top-five DEX status within a fortnight, $3.1 billion in weekly DEX volume at peak, roughly $300 million in TVL, 3.6 million daily transactions, 65,000-plus holders of tokenized stocks, $300 million in stablecoins parked on the network, day-one integrations with Uniswap, Morpho, and Chainlink, and a Bernstein note calling the debut strong. Bearish selection, from the identical dataset: tokenized real-world assets, the chain’s stated purpose, at roughly $13 million, about 4% of activity, against a single memecoin, CASHCAT, that touched $156 million, twelve times all tokenized assets combined; transaction counts inflated by a 90-day gas-fee subsidy that makes every comparison flattering; chain fees around $198,000 a day, real but rounding-error revenue for a $101 billion company; a launchpad boom that generated an estimated $12 million in fees before going dark over token quality; and the SCATMAN incident, in which hijacked SpaceX and Starlink accounts rug-pulled a memecoin on Robinhood’s rails eleven days into the chain’s life.
The interrogation layer makes the selective-framing game harder than usual, and this is the underappreciated mechanic of Wednesday’s call. Robinhood runs its earnings Q&A partly through an upvoted shareholder-question platform, which means the chain questions do not depend on sell-side politeness; the retail base that watched CASHCAT trade twelve times the stock-token float will put its questions on the record by volume of upvotes, and management has committed to answering a selection of the most-upvoted live. Add the professional layer, where the first analyst question about chain unit economics, sequencer revenue, subsidy cost, custody of the $300 million in parked stablecoins, forces the company to either disclose a new reporting line or conspicuously decline to, and the call becomes what this piece named it at the top: not a results event but a disclosure event, the first time Robinhood must describe its chain in the register of accountability rather than launch marketing.
What to listen for, specifically: whether the chain gets its own metrics in the release or deck, which would signal permanent reporting; any number attached to Stock Token adoption beyond the on-chain estimates everyone has been reading off Dune; the treatment of the gas subsidy, cost line now, pricing power question later; and any guidance about what happens at day 90, because the subsidy that has been inflating the chain’s activity since July 1 expires around the end of September, at which point Robinhood Chain’s organic demand gets its first honest measurement, one quarter before it appears in reported results for the first time.
The stakes: two readings of the same launch
The earnings frame sharpens the strategic question the launch coverage blurred, so state both readings the way Wednesday’s participants will.
The optionality reading, which is Bernstein’s and the raised price targets’: the chain is cheap, early, and structurally aligned with everything working at Robinhood. The memecoin froth is what permissionless launches look like, the $300 million in parked stablecoins and the Morpho lending base are stickier than DEX volume, the tokenized-equity product has 65,000 real holders three weeks in, and the company holds a fresh $2.2 billion zero-coupon convertible war chest raised in June, capital available precisely for bets like this. On this reading, Q2’s numbers, carried by options, equities, and the event-contract engine, buy the chain all the time it needs, CLARITY’s potential passage de-risks the entire crypto stack, and the correct analyst posture is to price the chain as a free option on tokenization while the core business compounds. The 12.6% implied move, in this frame, is upside convexity.
The distraction reading, which the Q1 tape supports: Robinhood’s crypto revenue has fallen for three consecutive quarters, the line that broke Q1 remains broken, and the company’s response was to launch infrastructure whose first month monetized the exact activity, memecoin speculation, that its CEO publicly disparaged the week before embracing.
The chain’s honest economics to date are $198,000 a day in subsidized fees against a $13 million RWA book, the regulatory proposition, a licensed brokerage extending compliant rails into DeFi, took a visible hit when the SCATMAN rug ran through it, and the $121 million HOOD unlock adds supply into whatever the print delivers. On this reading, Wednesday risks a specific failure mode: a fine quarter overshadowed by the first public accounting of a launch whose numbers, honestly presented, describe a casino with a stock-token kiosk in the lobby, and the implied move is downside convexity with a marketing problem attached.
Both readings will survive Wednesday, because three weeks of subsidized data cannot settle them. What Wednesday does settle is the disclosure regime: whether the chain becomes a measured, reported, guided-upon business line or stays a narrative asset described in prepared remarks. Companies choose that fork exactly once, at the first earnings event after launch, and the choice tells you how management privately scores the first month. A new reporting line says the numbers can bear weight. Adjectives say they cannot yet.
The prediction-market pivot hiding in plain sight
One structural story inside these numbers deserves its own treatment before the watchlist, because it reframes what kind of company is actually reporting on Wednesday, and it connects this print to the biggest regulatory fight in American consumer finance.
The line that grew 320% in Q1, other transaction revenue at $147 million, is mostly event contracts, and its crossing above crypto revenue was not a fluke of one weak crypto quarter; it is the visible edge of a deliberate reallocation. Robinhood entered prediction markets through its Kalshi partnership, built the category into a headline product, launched its own Rothera exchange in the second quarter, and rode a June in which the World Cup drove the category to records across every venue, Kalshi alone clearing $31 billion in monthly volume. For Q2, the reasonable expectation is that event contracts extend their lead over crypto as a transaction line, and possibly begin closing on options, which would make Robinhood, measured by revenue mix, one of the largest regulated betting-adjacent businesses in the United States, inside a brokerage wrapper, without most of its shareholders having consciously repriced it as such.
The regulatory exposure travels with the revenue. Event contracts are the product at the center of the twelve-state federalism war this publication mapped last week, the cease-and-desist orders, the tribal litigation at the Ninth Circuit, the CFTC suing states on the platforms’ behalf, and Robinhood sits in the same legal architecture as Kalshi and Polymarket: CFTC-registered instruments that state gaming regulators call unlicensed betting. Every dollar of the fastest-growing line on Wednesday’s release is contested revenue in at least a dozen jurisdictions, a fact no earnings preview prices and no prepared remark will volunteer. The sports-heavy composition of category volume makes the exposure seasonal too: football season begins in September, the category’s biggest quarter, with the legal map still unsettled and the NFL’s own posture toward event contracts hardening.
Put the pivot beside the chain and the company’s actual strategic position clarifies. Robinhood is running two simultaneous bets on post-crypto transaction revenue: prediction markets, which already generate nine figures a quarter and carry live litigation risk, and tokenized assets, which generate approximately nothing yet and carry a launch-month casino reputation. The first bet funds the patience the second requires. Wednesday’s call will be scored on the chain questions, because the chain is the story, but the number that decides whether Robinhood’s next four quarters compound is the event-contract line, and the risk that actually threatens it sits in courtrooms this publication’s readers already know by docket. The chain missed the quarter by a day. The prediction-market war is in it on every page.
What to watch
The disclosure fork itself. Chain metrics in the release or deck, any Stock Token adoption figure sourced from the company rather than Dune, and any sequencer-revenue or subsidy-cost line. This is the event’s real binary, more informative than the EPS beat or miss.
The crypto line against the Q1 template. A fourth consecutive transaction-revenue decline, or crypto revenue near the $134 million floor, re-runs April’s selloff mechanics into a market pricing a 12.6% move, with the HOOD unlock supplying the sell-side flow. Stabilization plus event-contract momentum flips the same setup bullish.
The September 29 subsidy cliff. Any management commentary on post-subsidy pricing is guidance on the chain’s first honest quarter, Q3’s, which will be the first to contain the chain at all. The gap between subsidized July activity and October’s organic demand is where the launch’s truth lives, and Wednesday is management’s only chance to pre-frame it.
The CLARITY shadow. The Senate’s endgame runs the same week as this print. Passage before or near the call hands management a regulatory tailwind to reframe every crypto question; failure leaves the crypto line’s three-quarter decline standing alone. Robinhood’s earnings and crypto’s biggest bill sharing a news cycle is either the launch story’s best luck or its worst timing, and nobody controls which.
The quarter Robinhood reports on Wednesday will be a reasonable one, carried by the businesses that were never the story. The quarter it will be asked about started one day too late to appear in it, and exists, for now, only as three weeks of numbers that flatter and indict the chain in equal measure. That asymmetry, results without the story, story without results, is rare enough in public markets to be worth naming, and it resolves on a schedule: the subsidy expires in September, the chain enters the reported numbers in October, and Wednesday is the last earnings call on which Robinhood’s blockchain remains, in the accounting sense, imaginary. The company gets one more quarter of describing it. After that, it gets measured.
Disclaimer: This article is for information and educational purposes only and does not constitute financial or investment advice. It discusses a scheduled earnings event whose results, disclosures, and market reaction are unknown, and figures cited for post-quarter chain activity come from third-party trackers subject to revision. Nothing here is a recommendation to buy, sell, or hold any security or asset. Always do your own research. Information is accurate as of July 23, 2026.
Frequently Asked Questions
When does Robinhood report Q2 2026 earnings?
After market close on Wednesday, July 29, with a video call at 2:00 PM PT / 5:00 PM ET hosted by Chairman and CEO Vlad Tenev and CFO Shiv Verma. The company also runs an upvoted shareholder Q&A through Say Technologies, with management answering a selection of the most-upvoted questions live, a mechanism that makes retail-submitted questions about Robinhood Chain likely to be addressed on the record.
What are analysts expecting from the quarter?
Consensus sits near $0.41 in earnings per share, down about 2% year over year, on revenue around $1.27 billion, up roughly 28%. Options markets price an implied post-earnings move of about 12.6%, above the 9% average of the past four quarters. Analyst targets rose into the print, with KeyBanc at $125 and Needham at $123, both citing broad metric strength and potential regulatory support from the CLARITY Act.
Why does the article say the chain missed the quarter?
Because of the calendar: the second quarter ended June 30 and Robinhood Chain’s public mainnet launched July 1. The reported financials therefore contain no chain activity at all, while the earnings call arrives after three heavily covered weeks of post-quarter chain data, making the event a forward-looking disclosure exercise about numbers outside the reported period.
What has Robinhood Chain actually produced since launch?
A genuinely mixed dataset: top-five DEX volume rankings with about $3.1 billion in a peak week, roughly $300 million in total value locked, 3.6 million daily transactions, and 65,000-plus tokenized-stock holders, against roughly $13 million in total tokenized real-world assets, a $156 million peak market cap for the CASHCAT memecoin alone, chain fees near $198,000 a day inflated by a 90-day gas subsidy, and the SCATMAN account-hijack rug pull on its rails.
What happened in Q1 that frames this report?
Revenue of $1.07 billion missed estimates because crypto transaction revenue fell 47% year over year to $134 million on volumes down 48%, the third straight quarterly decline in transaction revenue, and the stock fell 13% the next day. The same release showed event-contract revenue up 320% to $147 million, meaning prediction markets surpassed crypto as a transaction-revenue line, a structural shift in what actually drives Robinhood’s growth.
What is the significance of the gas subsidy expiring?
Robinhood subsidized chain gas fees for the first 90 days from the July 1 launch, inflating activity metrics and making comparisons with other networks unreliable. The subsidy lapses around late September, just before the chain’s first fully reported quarter, so post-subsidy activity in October will provide the first honest measure of organic demand. Any management commentary on post-subsidy pricing effectively serves as guidance for that test.
How does the CLARITY Act affect this earnings event?
The Senate’s decisive window on the crypto market-structure bill overlaps this exact week. Passage would strengthen the regulatory footing of Robinhood’s crypto revenue and its chain strategy, a tailwind analysts already cite, while failure would leave the three-quarter crypto revenue decline without an offsetting narrative. The coincidence of timing means macro-legislative news could swamp the print itself in either direction.
What should investors watch beyond the headline numbers?
Whether the chain receives its own disclosed metrics, the first signal it is becoming a reported business line instead of a narrative; the crypto revenue line against Q1’s $134 million; any company-sourced Stock Token adoption figures; commentary on sequencer economics and the subsidy cost; and the $121 million HOOD token unlock adding potential supply around the event. This is educational analysis, not investment advice.
Alphabet has disclosed a $94.1 billion stake in Elon Musk’s SpaceX more than a decade after Google joined a $1 billion funding round for the rocket company.
Summary
- Alphabet disclosed a $94.1 billion SpaceX stake, equal to roughly 6% of the company.
- Google first backed SpaceX through a $1 billion funding round with Fidelity in 2015.
- SpaceX shares remain below their $135 IPO price, trimming Alphabet’s paper gains.
Alphabet’s second-quarter 10-Q filing showed that the Google parent owns roughly 6% of the newly listed company, providing the clearest public measure of an investment it previously valued using private-market estimates.
The disclosure splits the holding into about $80 billion of shares under short-term sale restrictions and another $14.1 billion subject to longer restrictions through the third quarter of 2027.
Google began building its position in January 2015, when it joined Fidelity Investments in a $1 billion financing round for SpaceX. The two investors received a combined stake of just under 10%, while the funding supported work on space transportation, reusable rockets and satellite manufacturing.
At the time, the deal valued SpaceX at about $12 billion. Reports placed Google’s contribution between $500 million and $900 million, with estimates suggesting that the company initially controlled about 7.5% of SpaceX. Its ownership percentage later fell as the rocket maker issued additional shares during subsequent fundraising rounds.
Although that dilution reduced Google’s share of the company, SpaceX’s rising valuation pushed the dollar value of the holding much higher. SpaceX used later financing to expand its Starlink satellite network, develop the Starship launch system and increase its reusable-rocket operations.
A major change came in February 2026, when SpaceX acquired Musk’s artificial intelligence company xAI. crypto.news reported earlier that the transaction valued SpaceX at $1 trillion and xAI at $250 billion, creating a combined business worth $1.25 trillion before the stock-market listing.
Under the deal’s structure, xAI became a wholly owned SpaceX subsidiary while retaining some legal separation from the parent company. The arrangement allowed investors to defer capital-gains taxes and reduced the risk that xAI’s debts or legal disputes would directly affect SpaceX.
SpaceX lockups restrict Alphabet’s exit
SpaceX priced its initial public offering at $135 per share before trading began on Nasdaq under the SPCX ticker on June 12. The company sold about 555.6 million shares and targeted roughly $75 billion in proceeds, giving it an initial valuation of around $1.75 trillion, according to its amended offering documents.
Alphabet and other early shareholders could not immediately sell most of their holdings after the debut. The restrictions disclosed in Alphabet’s quarterly filing leave the company exposed to changes in SPCX’s market price until the relevant lockup periods expire.
The listing nevertheless allowed Alphabet to replace conservative private-company estimates with a value based on publicly traded shares. Before the IPO, reports placed Alphabet’s effective ownership near 5% after years of financing rounds and adjustments linked to the xAI transaction. Its latest filing puts the stake closer to 6%.
Alphabet also recorded $98 billion in other income during the second quarter, which the company attributed mainly to unrealized gains on equity investments. While Alphabet did not identify how much came from each holding, the company owns stakes in SpaceX, Anthropic and Databricks.
Its Anthropic investment has also increased sharply in value. Anthropic announced in May that it had raised $65 billion at a $965 billion post-money valuation, while previous filings placed Google’s ownership of the AI company at about 14%. Any contribution from Anthropic or Databricks means the entire $98 billion gain cannot be assigned to SpaceX alone.
SPCX decline trims the paper windfall
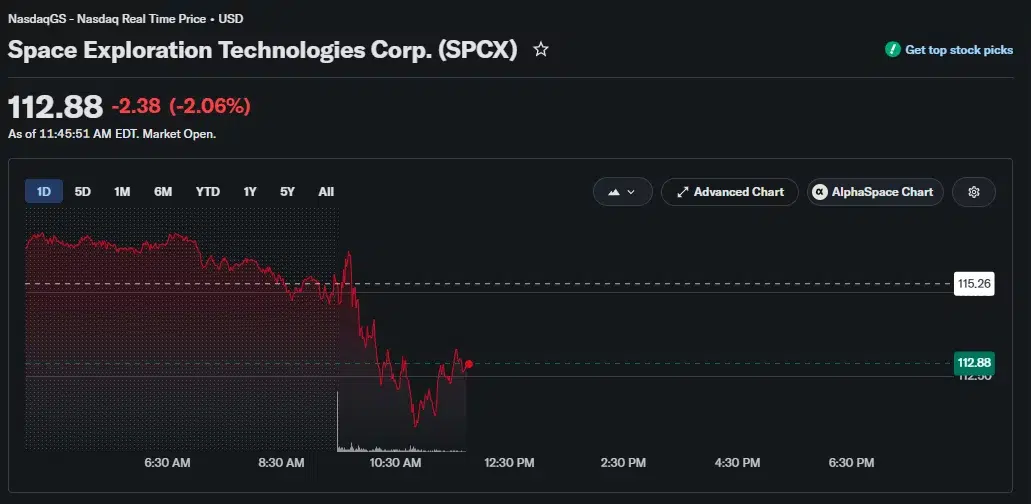
SpaceX’s public-market performance has weakened since its June listing. SPCX fell to $112.88 on July 23, placing the stock about 16% below its $135 IPO price despite Tesla’s second-quarter results and another planned Starship launch attempt.
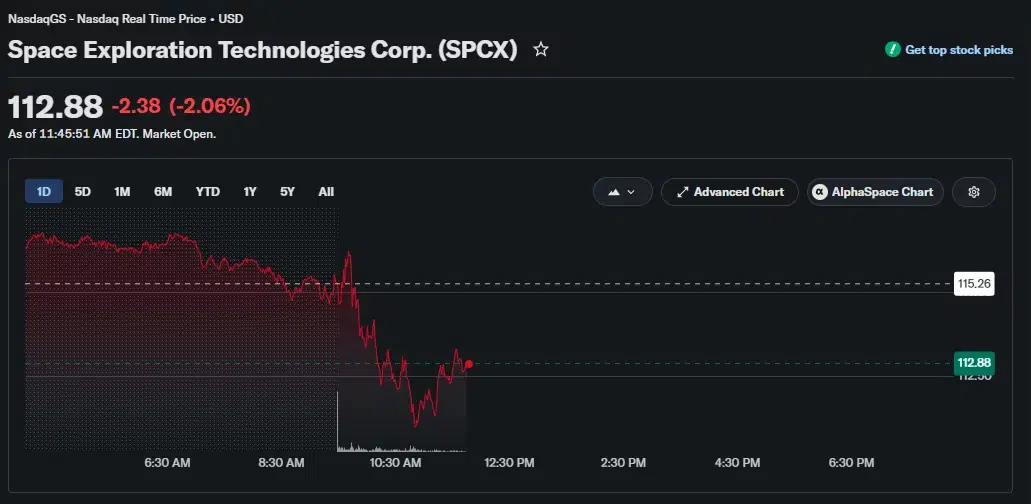
The decline followed a sharp post-listing rally that carried SpaceX shares above $225. Based on the July 23 market price, the company’s valuation had dropped to roughly $1.52 trillion. Alphabet’s disclosed holding therefore remains subject to further paper gains or losses while its shares stay locked.
Musk’s other publicly traded company added another source of investor attention. Tesla reported that it kept its 11,509 Bitcoin reserve unchanged during the second quarter while recording a $112 million after-tax loss on digital assets. At a Bitcoin price near $65,840 after Tesla’s earnings release, the reserve was worth about $758 million.
For Alphabet, however, the SpaceX filing has placed a firm public figure on one of its longest-held private investments. A position built through the 2015 financing round is now worth $94.1 billion on paper, even after SPCX erased its early post-IPO gains.
Economist Peter Schiff has warned that Brent crude’s surge above $100 could reverse June’s 0.4% monthly CPI decline and produce a sharp US inflation rebound in July.
Summary
- Peter Schiff warns oil’s rebound above $100 could drive July inflation sharply higher.
- Brent surged as Houthi attacks and restricted shipping intensified global supply concerns.
- Markets price a 37.6% chance of a Fed rate hike in July.
Peter Schiff linked the risk to oil’s rapid recovery after energy costs helped pull headline inflation below forecasts in June. In a post on X, Schiff noted that crude had already climbed about 30% in July and returned above $90 per barrel when he issued the warning.
“Investors celebrated the June CPI, as a 30% fall in the price of oil led to a larger-than-expected decline. But so far in July, the price of oil is already up 30%, back above $90 per barrel.”
At the time, Schiff estimated that a move to $100 before the end of July would represent a 43% increase from oil’s recent low. Brent crossed that level hours later as attacks on Saudi tankers created another threat to energy shipments from the Middle East.
“If the price hits $100 by month-end, that will be a 43% rise. July CPI could be a doozy!” Schiff added.
Answering a user who asked whether the increase would produce only a temporary supply shock, Schiff argued that June’s improvement depended heavily on cheaper oil. In his view, an even larger July increase could reverse much of that contribution rather than create a new source of inflation.
Oil’s reversal threatens to lift July inflation
June data from the US Bureau of Labor Statistics showed that headline CPI fell 0.4% from May, compared with the 0.1% decline economists polled by Reuters had expected. Annual inflation slowed to 3.5% from 4.2%, also beating the consensus estimate of 3.8%.
Energy prices supplied much of that relief. According to the BLS, the energy index dropped 5.7% during June, its steepest monthly fall since April 2020, while gasoline costs fell 9.7%. Core CPI, which excludes food and energy, was unchanged for the month and rose 2.6% from a year earlier.
Despite June’s monthly fall, the BLS reported that energy prices remained 15.7% higher than a year earlier. Gasoline increased 26.7% over the same period, leaving household costs exposed to another rise if crude prices remain elevated through the rest of July.
Fresh supply concerns have since changed the oil market’s direction. Brent climbed about 7% to $100.71 on Thursday, its highest level in nearly two months, while US West Texas Intermediate moved above $90 for the first time since June.
Oil prices rose following a Houthi attack on two Saudi tankers in the Red Sea and a declared blockade of Saudi-linked shipments through the Bab el-Mandeb Strait. The threat has become more serious because Saudi exporters have relied more heavily on that route while tanker traffic through the Strait of Hormuz remains severely restricted.
According to Reuters, Iranian oil exports have also fallen from as much as 2 million barrels per day to almost zero during the conflict. Goldman Sachs analysts told the news agency that Brent could exceed $120 if disruptions persist, although that forecast depends on the duration and scale of the supply losses.
Diplomatic efforts have yet to restore stable shipping conditions. The US Secretary of State Marco Rubio maintained Washington’s willingness to negotiate but accused Iran of failing to show that it was prepared to reach an agreement. Continued US strikes and Iranian military activity have kept traders focused on possible damage to oil infrastructure and transport routes.
Fed traders still favor a July hold
Higher energy prices have also complicated expectations for the Federal Reserve’s July 28–29 meeting. Fed officials have treated oil as an important influence on headline inflation, while several policymakers have argued that one cooler CPI report is insufficient to establish a lasting downward trend.
Fed Governor Christopher Waller said after the June inflation release that he would need to see “several months” of softer data before becoming confident that inflation was moving back toward the central bank’s 2% target.
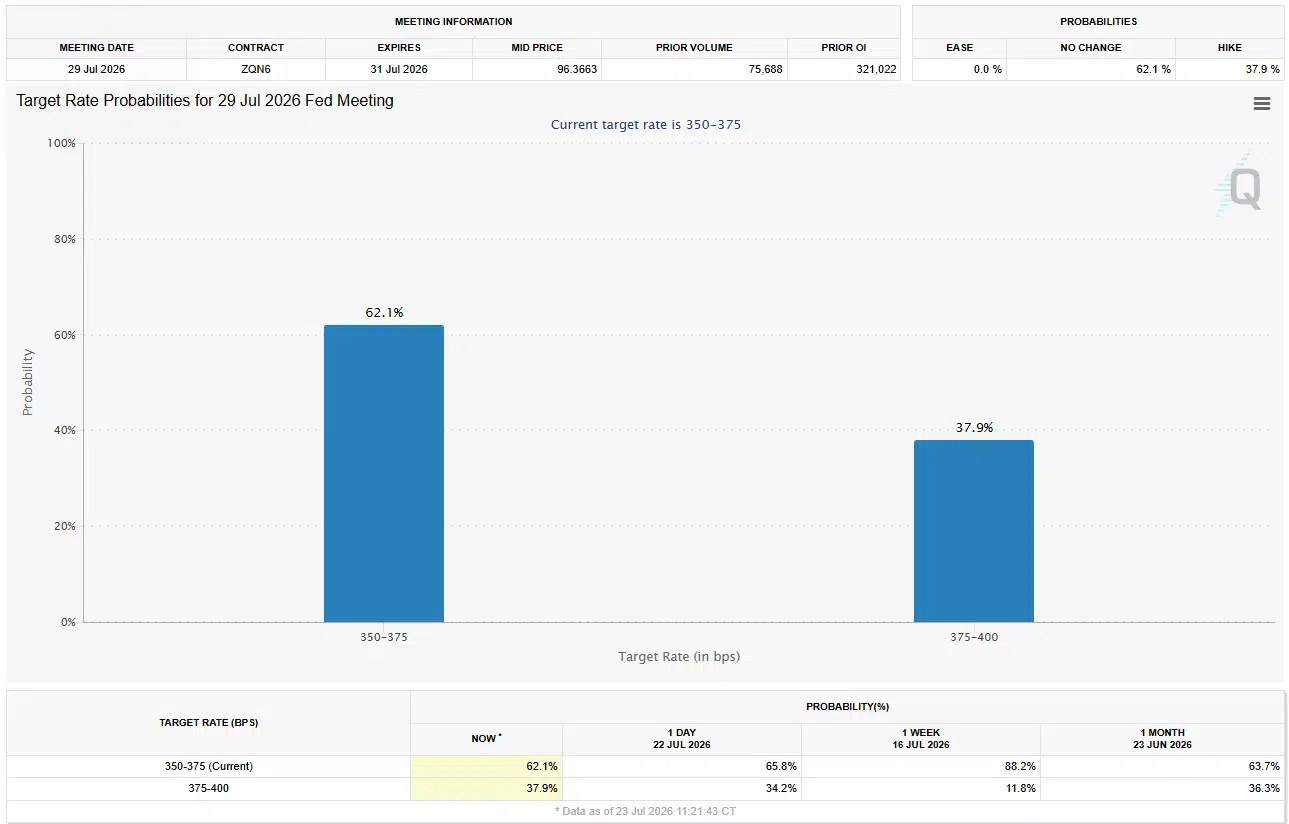
Futures traders still favored no change at the July meeting as of July 23. Market pricing showed a 62.1% probability that the Fed would keep its target range at 3.50%–3.75%, while assigning a 37.9% chance to a quarter-point increase, according to data derived from the CME FedWatch Tool.
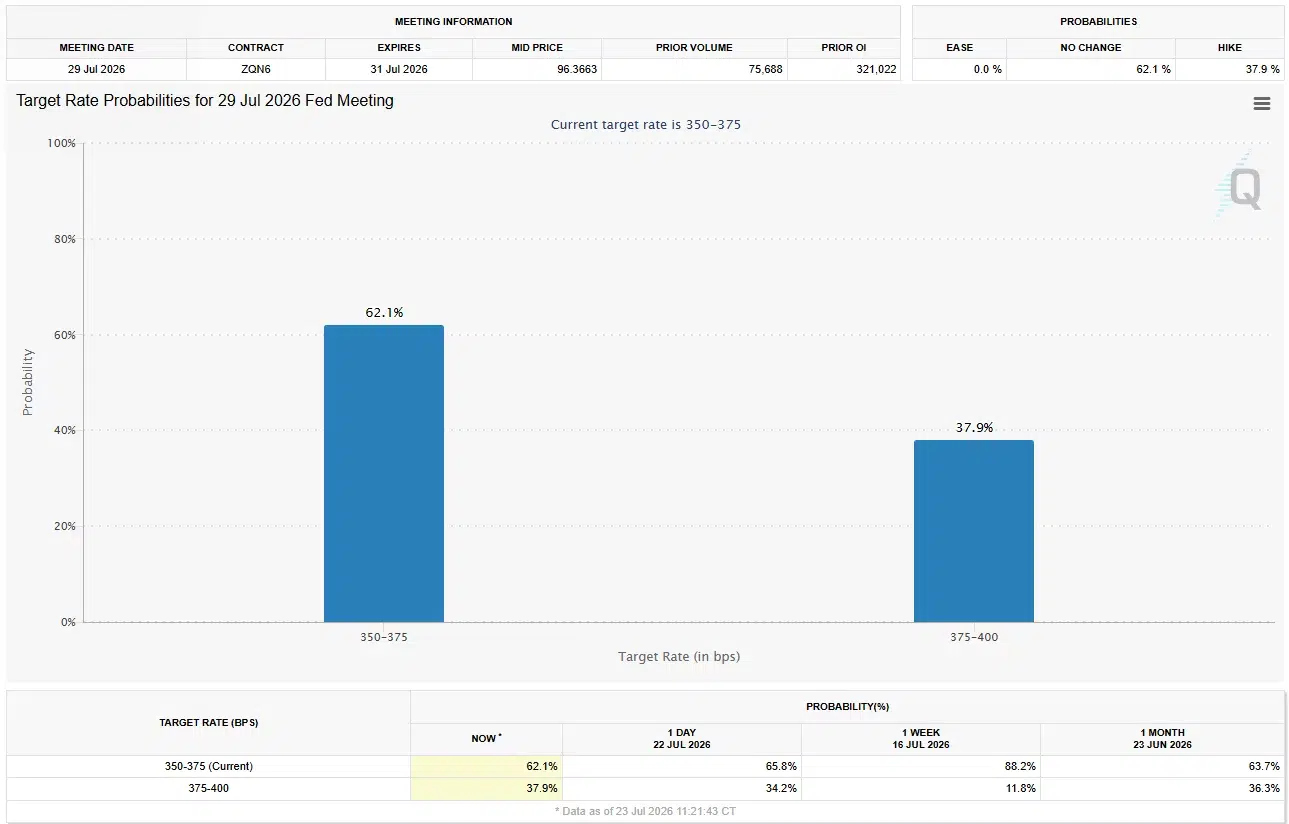
The probability of a July hike has risen sharply since the inflation report. On July 14, traders initially placed only a 10% chance on an increase after June CPI came in below forecasts.
July inflation data will not arrive before the Fed meeting, as the BLS has scheduled the report for Aug. 12. Policymakers will therefore make their decision without knowing the full effect of oil’s rebound, while Schiff’s warning points to energy prices as a potential obstacle to extending June’s inflation progress.
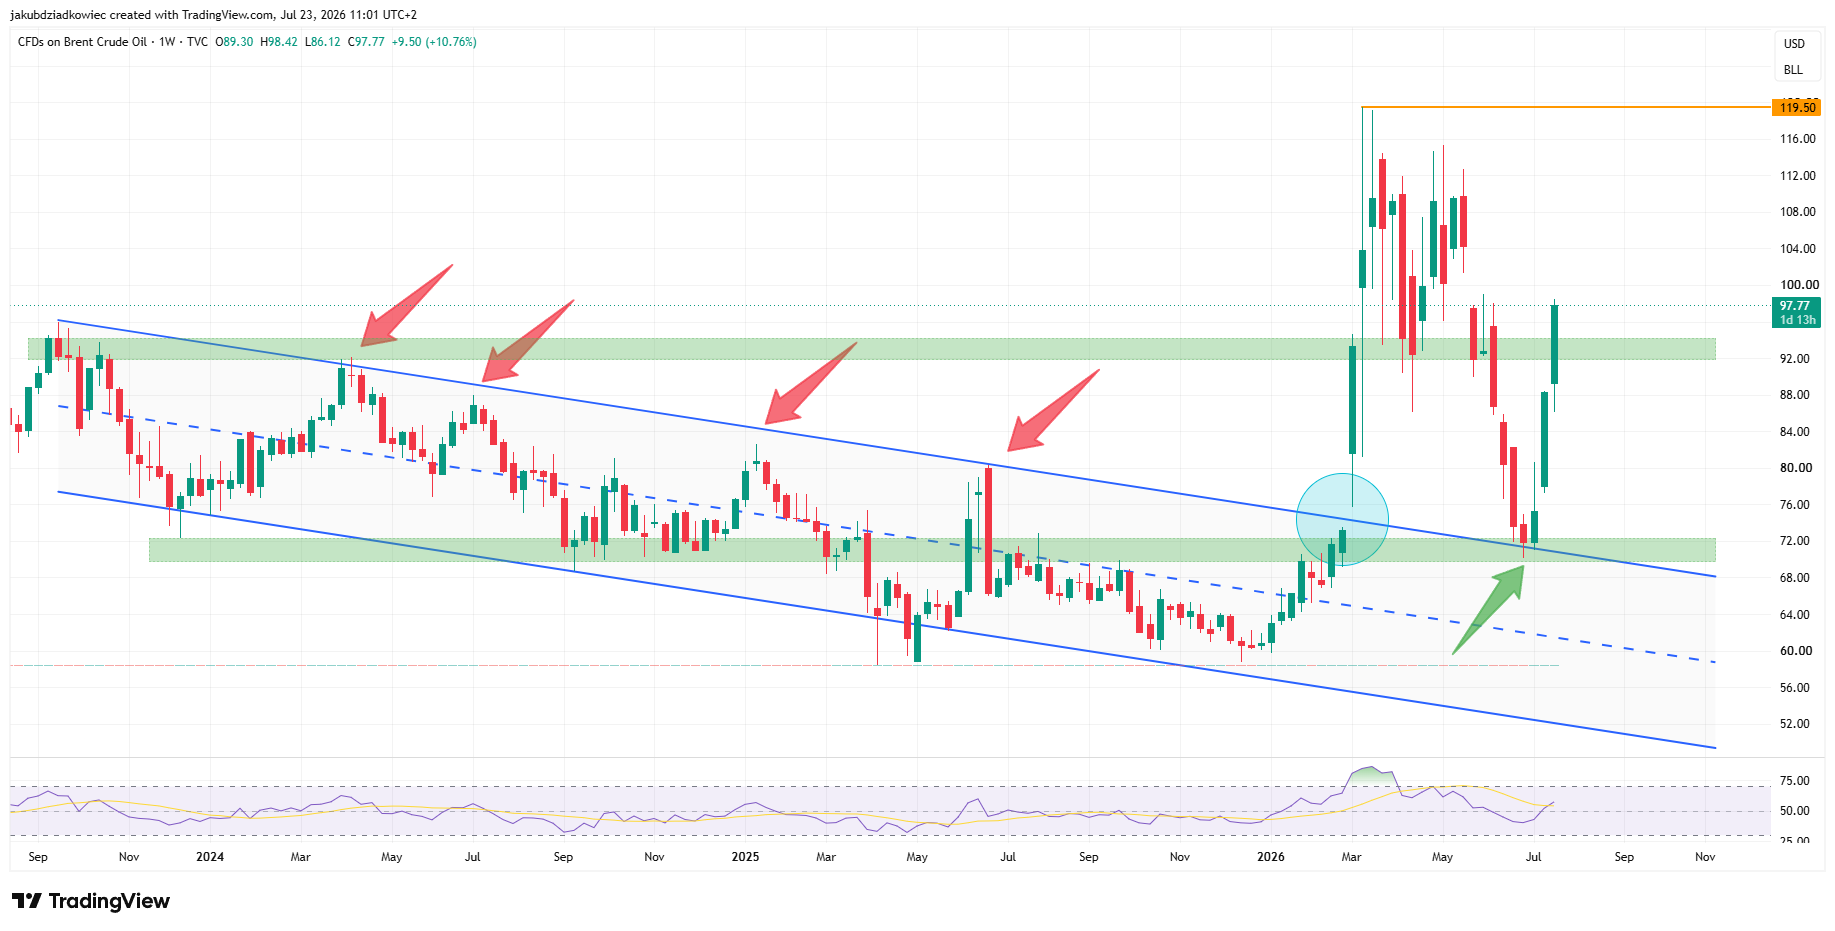
The Brent crude oil price climbed to a six-week high near $96 on Thursday after Iran-backed Houthi forces struck two Saudi tankers in the Red Sea. The attacks pose a second threat to global supply beyond the Strait of Hormuz.
Brent has gained more than 10% this week after a 17.35% surge last week. The charts show price pressing against the $100 mark, where a key Fibonacci level meets strong psychological resistance.
Red Sea Attacks Open a Second Supply Front
Brent rose 1.8% to $95.70 on Thursday, its fifth consecutive daily gain, according to Trading Economics data. The benchmark has climbed almost 30% over the past month and 38% year over year.
The rally gained pace after Houthi militants hit two Saudi tankers with missiles and drones on Wednesday. These were the first direct tanker strikes in the Red Sea during the current conflict. The group also declared a maritime embargo on Saudi-linked shipping, and three crude carriers bound for Asia reversed course.
The route matters because Bab el-Mandeb handled about 5.4 million barrels of oil per day in the first quarter, per US Energy Information Administration figures. A blockade would force vessels around southern Africa, lifting freight and insurance costs.
Meanwhile, US forces struck Iranian targets for a 12th consecutive day. President Donald Trump warned that Washington would hit Iranian infrastructure if Tehran attacked ships in Hormuz.
Iran threatened retaliation against US-linked energy assets, and both sides played down ceasefire prospects.
Supply stress also spread beyond the Middle East. The Caspian Pipeline Consortium halted intake from Kazakhstan after drone attacks near its Black Sea terminal.
In contrast, the lone bearish signal came from the EIA, which reported a surprise 1.4 million barrel build in US crude stocks.
Weekly Chart Shows a Breakout Above the $92 Resistance
The weekly chart favors the bulls. Brent has added 10.76% so far this week, extending the 17.35% advance from the week before. More importantly, price broke above the $92 zone, which had rejected it several times since 2023.
Earlier this month, a sharp correction from the war-driven highs found support at $72. That horizontal level coincided with the upper band of a descending parallel channel. The same channel line capped price through most of 2024 and 2025, so former resistance now acts as support.

The weekly Relative Strength Index (RSI) is turning bullish but remains in neutral territory just above 50. Therefore, momentum still has room before reaching overbought conditions. As long as Brent holds above $92, that zone is likely to serve as the new support.
Brent Crude Oil Price Prediction Rests on the $100 Test
The daily chart tells a similar story. Brent bounced sharply from $70.14 and quickly reclaimed the 0.382 Fibonacci retracement at $89. It then cleared the $92 zone and the 0.5 Fibonacci level at $94.82.
The decisive test now sits at the 0.618 Fibonacci retracement at $100.64. This level coincides with a previous support and resistance region and the psychological $100 mark. Historically, such confluences produce strong reactions on the first approach.

A daily close above $100.64 could open the way to the swing high at $119.50. That would represent a move of roughly 19% from the breakout level. On the downside, $94.82 provides the first support, with the $92 zone below it. A drop back under $92 would invalidate the bullish outlook.
The daily RSI has just crossed into bullish territory and is continuing to rise, with no bearish divergence yet. However, the fundamental driver remains binary.
A broader blockade could push Brent above $100, feeding inflationary pressure and weighing on crypto markets. A lasting truce, in contrast, could unwind the war premium.
Brent either clears the $100.64 barrier and targets $119.50, or stalls at the Fibonacci wall and retests $92.
The post Brent Crude Oil Price Could Surge to $100 After Iran’s Red Sea Attack appeared first on BeInCrypto.
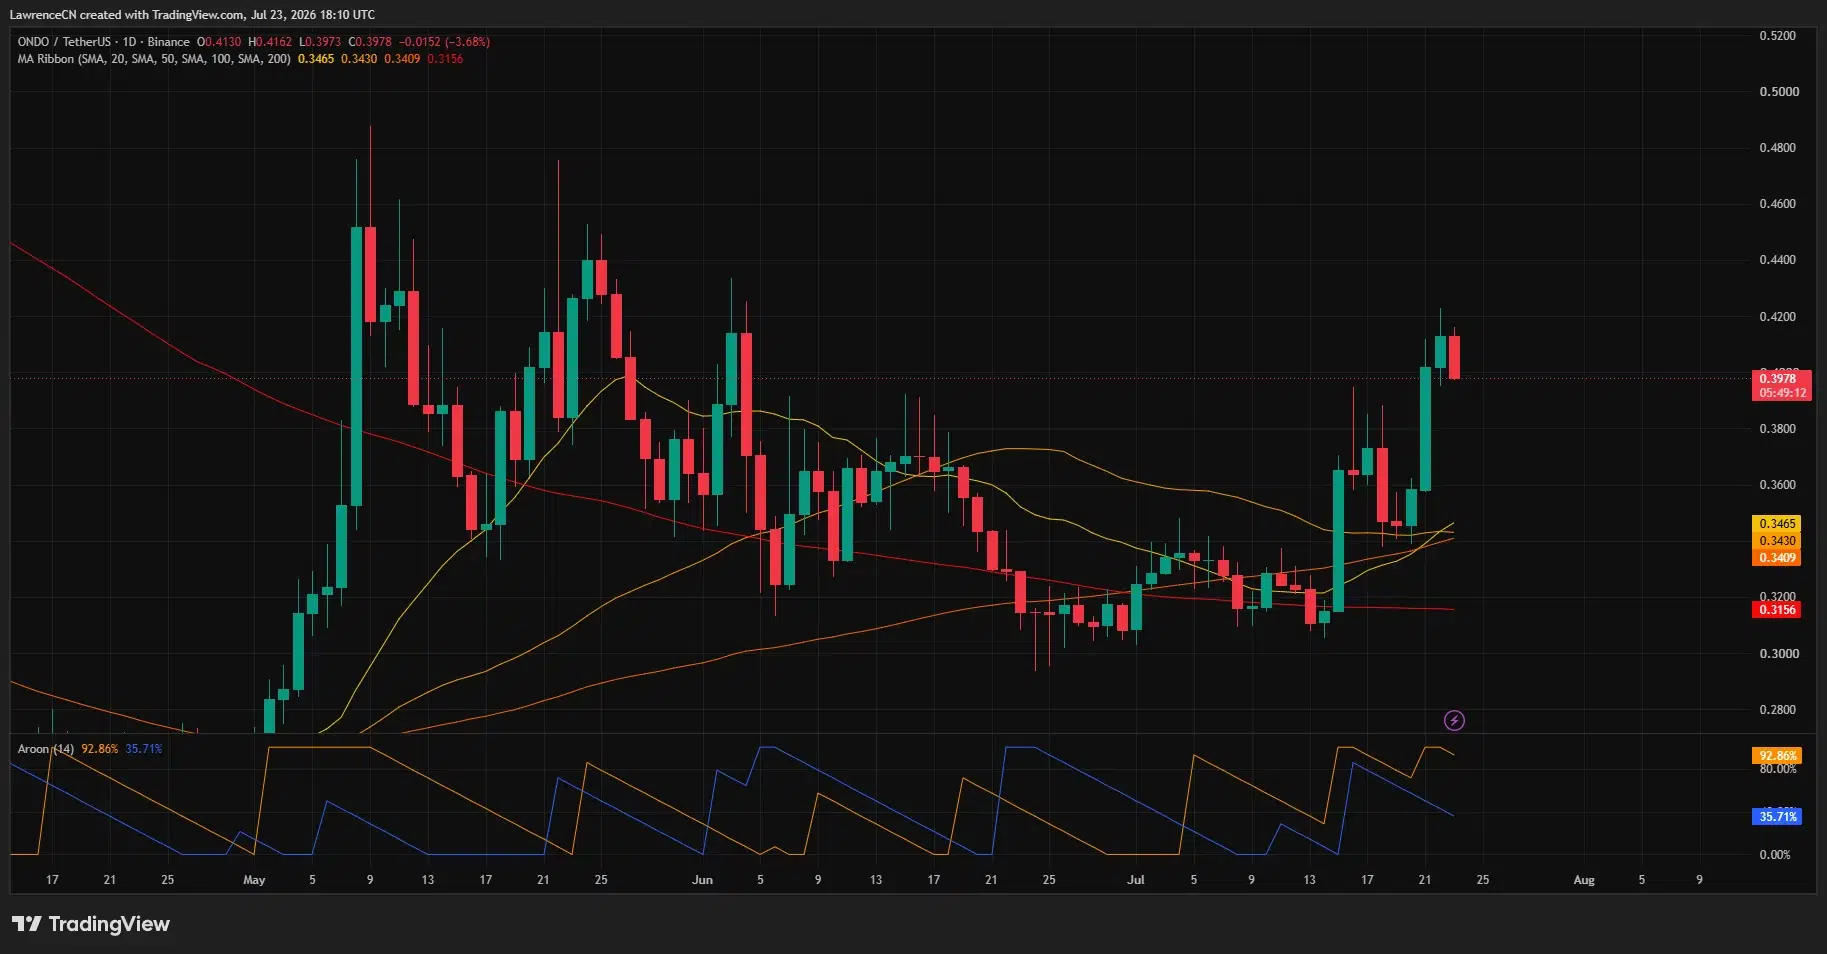
Ondo Finance has secured FINRA authorizations covering tokenized NMS stocks, exchange-traded funds, mutual funds, index funds and IPO securities for U.S. investors.
Summary
- Oasis Pro secured FINRA permissions for tokenized stocks, funds and IPO securities in the U.S.
- The framework supports stablecoin settlement and access through brokers, advisers and retirement accounts.
- ONDO faces resistance near $0.42 while holding above all four major moving averages.
Ondo Finance announced on July 23 that its SEC-registered broker-dealer subsidiary, Oasis Pro Markets, had received the permissions needed to launch regulated tokenized securities services under SEC and FINRA oversight.
According to the company, the authorizations cover over-the-counter retail transactions, underwritten primary offerings, private placements and other securities activities. Oasis Pro Markets can also operate a venue where U.S. issuers conduct primary offerings and eligible retail and institutional investors trade the resulting assets in secondary markets.
The approved framework supports settlement in fiat currencies or selected stablecoins, including transfers made directly between blockchain wallets, Ondo said. Supported products include National Market System equities, ETFs, mutual funds, index funds and securities issued through initial public offerings.
Oasis Pro Markets may also use omnibus account structures, allowing broker-dealers and registered investment advisers to connect their existing systems. Ondo said the arrangement could give institutional clients, retail investors and retirement accounts access through their current financial providers, reducing the need to open accounts on a separate platform.
The company cautioned that FINRA membership and SEC registration do not guarantee compliance with every rule. Neither regulator has recommended the products, approved them as investments or verified Ondo’s announcement, according to the disclaimer accompanying the release.
Authorization opens regulated U.S. distribution
Completed in October 2025, Ondo’s acquisition of Oasis Pro brought an SEC-registered broker-dealer, alternative trading system and transfer agent into the group. Oasis Pro Markets has been a FINRA member since 2020 and previously received authorization to settle digital securities using fiat, USDC and DAI, according to Ondo’s acquisition announcement.
Through Oasis Pro TA, the group can manage capitalization tables onchain while administering shareholder rights and transfers. Ondo said the transfer-agent unit also supports movement of collateral across asset types, giving the company regulated infrastructure for both issuing and servicing tokenized securities.
Earlier in July, Ondo introduced tokenized versions of BlackRock’s iShares Core S&P 500 ETF and Micron shares in partnership with Broadridge. Under the structure described by Ondo, the underlying securities remain within the established U.S. custody system while corresponding tokens are issued on Ethereum and held by regulated custodians.
The model follows a third-party custodial structure discussed by the SEC in January 2026. Ondo said each token is backed one-for-one by the underlying shares and carries the same shareholder rights and protections, including voting rights handled through Broadridge.
Before this U.S. rollout, Ondo Stocks mainly served eligible investors outside the country. The platform’s current terms still state that its existing Ondo Stocks tokens cannot be offered to U.S. persons unless they are registered or qualify for an exemption, meaning the new authorizations provide infrastructure for compliant U.S. services rather than automatically removing every product restriction.
Ondo reported in early 2026 that its tokenized products had exceeded $2.5 billion in total value locked, citing RWA.xyz and DefiLlama. At the time, the company said Ondo Stocks had generated more than $7 billion in cumulative trading volume across over 200 tokenized stocks, while its tokenized Treasury products accounted for about $2 billion in value.
Regulatory uncertainty had previously limited Ondo’s U.S. plans. In December 2025, the company reported that the SEC had closed a confidential, multi-year investigation without filing charges, although the closure did not amount to formal approval of Ondo’s products.
ONDO price faces resistance at $0.42
Ondo (ONDO) price traded near $0.40 at the time of analysis after falling roughly 3% over 24 hours, while its 7-day performance remained positive. Its market cap stood near $1.94 billion, based on a circulating supply of about 4.9 billion tokens, with daily volume above $130 million.
On the supplied Binance daily chart, ONDO rose as high as $0.4162 before retreating to about $0.398. The rejection places initial resistance between $0.416 and $0.42, where sellers interrupted the latest advance.
Despite the pullback, the chart shows ONDO trading above its four displayed moving averages. The 20-day average stands near $0.343, followed by the 50-day at $0.3465, the 100-day at $0.3409 and the 200-day at $0.3156.
Aroon readings also favor the recent advance, with Aroon Up at 92.86% compared with Aroon Down at 35.71%. Based on the chart, a daily close above $0.42 would clear the latest swing high, while failure to hold $0.38 could expose the moving-average cluster between $0.341 and $0.347.
Disclosure: This article does not represent investment advice. The content and materials featured on this page are for educational purposes only.


Bitcoin has fallen below $65,000 after the Trump administration announced tariffs of 10% to 12.5% on imports from 60 trading partners covering more than 99% of U.S. trade.
Summary
- Bitcoin fell below $65,000 after Trump announced new tariffs covering 60 major trading partners.
- Strong U.S. jobless claims data and rising Treasury yields added pressure on risk assets.
- Crypto liquidations reached about $162 million as leveraged long traders absorbed most of the losses.
CNBC reported that the duties will take effect at 12:01 a.m. ET on Friday, replacing the temporary 10% global tariff scheduled to expire the same day. The Office of the U.S. Trade Representative has linked the measures to what it described as inadequate enforcement against goods made with forced labor.
Bitcoin traded as low as $64,985 on Thursday, July 23, before briefly recovering above $65,000. crypto.news data showed the asset down about 1.5% over 24 hours, with its market capitalization standing near $1.3 trillion.
Selling resumed after details of the tariff plan emerged, leaving the rebound above $65,000 short-lived. Short-interval charts showed consecutive bearish candles during the decline, while CoinGlass recorded rising liquidations of leveraged long positions as traders faced another risk-off development.
The tariff announcement arrived during a difficult session for risk assets. The Nasdaq Composite fell about 2.2% to a four-week low, while the S&P 500 lost 1.2% and the Dow Jones Industrial Average dropped about 507 points.
Escalating tensions between the United States and Iran had already pressured Bitcoin earlier in the day. Al Jazeera reported that President Donald Trump had threatened an unprecedented “massive attack” on Iran as military exchanges continued across the region.
Strong labor data has added pressure on Bitcoin
Fresh U.S. employment data gave traders another reason to reassess interest-rate expectations. The Labor Department reported that initial jobless claims fell by 22,000 to 187,000 in the week ending July 18, the lowest total since September 1969.
Economists surveyed by Reuters had expected claims to rise to 212,000. Continuing claims also fell by 2,000 to 1.796 million, according to the department, showing that layoffs remained limited despite slower hiring and uncertainty surrounding trade policy.
Stronger labor figures can reduce the urgency for the Federal Reserve to ease monetary policy because they suggest that the economy can withstand restrictive borrowing costs. Interest-rate futures indicated that traders were considering the possibility of a Fed rate increase by September, Reuters reported, as higher oil prices added to inflation concerns.
Treasury yields climbed alongside those expectations, with the 10-year yield reaching about 4.70%, according to Investors Business Daily. Higher bond yields can weigh on cryptocurrencies because they raise the return available from traditional assets that carry less risk than Bitcoin.
Leveraged traders took most of the immediate damage from the decline. CoinGlass data showed that 62,869 crypto traders were liquidated over 24 hours, with total liquidations reaching about $162 million. Separate Coinalyze figures placed Bitcoin liquidations near $28.7 million, including roughly $26.2 million in long positions.
Bitcoin’s fall followed a brief advance toward $67,000 earlier in the week. BTC was approaching a seven-week high on July 21 despite the conflict with Iran and the pending tariff decision, but buyers failed to maintain that move as macroeconomic pressure intensified.
New tariffs have rebuilt Trump’s trade barrier
The administration has imposed the tariffs under Section 301 of the Trade Act of 1974, which allows Washington to respond to trade practices it considers unfair. The legal route differs from the emergency powers used for an earlier set of tariffs that the Supreme Court struck down in February.
A senior administration official described the measures as the most extensive international labor-rights trade action ever taken by any country. According to the administration, the rates depend on how much progress each trading partner has made in restricting imports produced with forced labor.
Countries and territories that have introduced partial restrictions or made related commitments will face a 10% rate. USTR documents show that the group includes Canada, Mexico, the European Union, the United Kingdom, Taiwan, Argentina and several Southeast Asian and Latin American economies.
A 12.5% tariff will apply to partners that the USTR determined had made less progress, including China, India, Japan, South Korea, Vietnam, Australia and New Zealand. U.S. Trade Representative Jamieson Greer has argued that weak enforcement abroad forces American workers to compete against goods linked to abusive labor practices.
Several major product groups will remain outside the new duties. Reuters reported that the exemptions include crude oil, petroleum products, pharmaceuticals, rare-earth materials, aircraft parts and some foods, while goods already covered by Section 232 tariffs will not face an additional charge.
Canadian and Mexican products that comply with the U.S.-Mexico-Canada Agreement will also be exempt. Administration officials said the new steel and aluminum duties would not stack on top of existing national-security tariffs.
The USTR has not published an estimate of how much revenue the tariff package will produce, according to CNBC. Trading partners can potentially secure lower rates by strengthening their forced-labor import rules, although officials said no country currently enforces a complete prohibition.
For Bitcoin, the announcement has added trade uncertainty to a session already shaped by geopolitical tension, rising oil prices, stronger labor data and higher Treasury yields. CoinGecko data placed BTC close to $65,000 at the time of reporting, leaving the level as the immediate test for buyers after the latest decline.
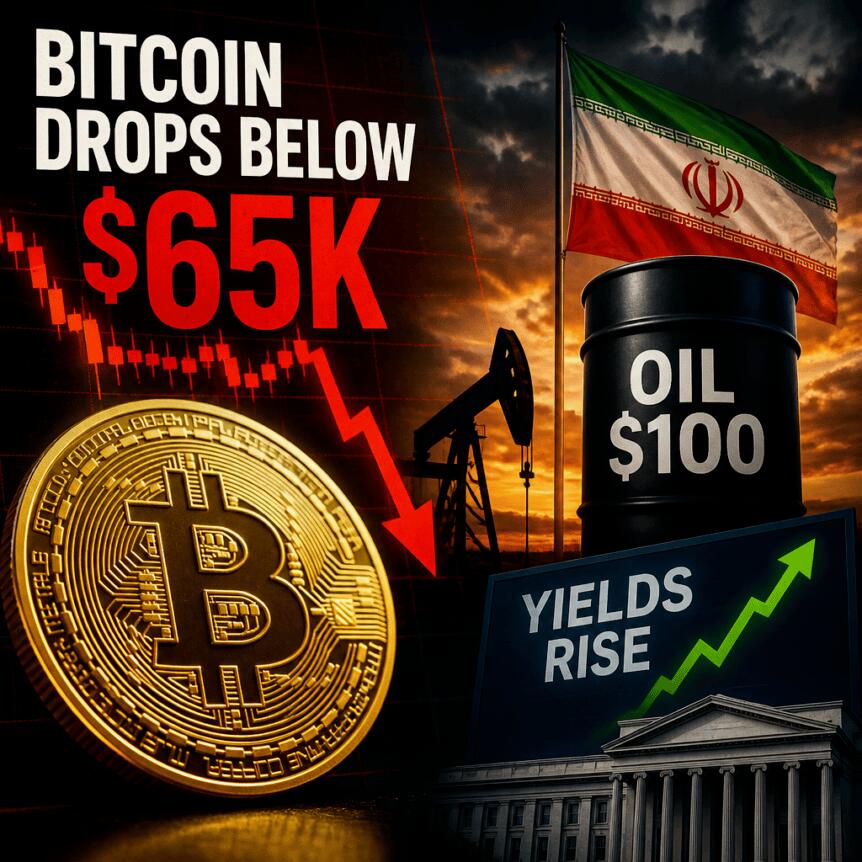
Bitcoin slipped below the $65,000 mark on Thursday, touching a three-day low around $64,799 on Bitstamp, as broader risk markets weakened amid renewed US-Iran tensions. The drop came alongside a selloff in US equities, a rally in oil, and rising expectations that US interest rates could stay higher for longer.
With traders split over whether recent relief will extend—or fade—attention has turned to nearby technical levels, including a widely watched moving-average area that could influence the next leg of momentum.
Key takeaways
- Bitcoin fell to three-day lows near $64,799 on Bitstamp as the S&P 500 and Nasdaq slid on Thursday.
- US-Iran escalation fears fed into risk-off sentiment, lifting oil prices and pushing yields higher.
- Coinciding with the selloff, CME FedWatch odds shifted toward a potential 0.25% hike by the upcoming FOMC, a typical headwind for crypto.
- Traders are watching moving-average support and the $68,000 resistance zone for clues on whether BTC can attempt a bigger breakout.
Geopolitics hits risk assets, and BTC follows
According to TradingView data cited in the report, BTC/USD reached three-day lows of $64,799 on Bitstamp. The move lower was part of a broader pattern: when equities and other high-beta assets struggle, crypto often struggles too.
US market pressure intensified after President Donald Trump warned that he would blame Iran for recent Houthi strikes on Saudi commercial vessels. In a post on Truth Social, Trump said he was “very disappointed” in the Houthis and referenced attacks on US ships from 2025.
By the close of New York trading, the S&P 500 had fallen 1.2%, while the Nasdaq dropped 2.2%. Oil strengthened sharply as well, with Brent crude rising to its highest level since early June and topping $100 per barrel.
That mix—weak equities, higher energy prices, and tightening financial conditions—can be hard for speculative assets. One signal highlighted by The Kobeissi Letter on X was that inflation expectations and interest rates were rising again, reinforcing the sense of renewed macro pressure on risk-taking.
Fed expectations shift: a potential 0.25% hike becomes more likely
Crypto traders often treat changes in Federal Reserve expectations as a direct input into near-term risk appetite. In this case, the report pointed to CME Group’s FedWatch Tool showing an increased chance of a 0.25% hike ahead of the Federal Reserve’s next decision.
Odds neared 40% on Thursday, compared with roughly 12% a week earlier. Historically, expectations for additional rate hikes tend to weigh on assets that typically benefit from easier financial conditions.
The Kobeissi Letter also referenced 18-month highs in US 10-year bond yields, framing the move as evidence of fresh economic stress. Higher yields can tighten liquidity and raise discount rates—conditions that often challenge the multiples and leverage embedded in speculative markets.
BTC traders disagree on the path forward
As price weakened, the market message wasn’t consistent. The report described a split among traders about whether BTC’s relief could continue or whether the recent rally was approaching a turning point.
One commentator, Exitpump, argued on X that the “July rally” may end by late July and that traders should be prepared for downside if price breaks below $65,000. Their view—posted late on Wednesday—was effectively a stop-out narrative for longs: close positions near resistance and turn cautious once the $65K area gives way.
Other traders were more constructive. Crypto trader Jelle suggested BTC was “still making progress,” describing a path in which clearing a local area could open a route toward the $70K region and potentially establish a new trading range. The difference in outlook matters because it determines how quickly traders reposition—whether they treat the current decline as a continuation of bearish momentum or as consolidation before the next attempt higher.
Technical focus: moving averages and the $68,000 hurdle
Beyond macro catalysts, technical levels are currently driving day-to-day decision-making. The report highlighted crypto analyst Michaël van de Poppe’s view that a 21-week simple moving average (SMA) around $64,073 represents key support.
Van de Poppe said, via an X post dated Thursday, that as long as BTC remains above the 21-Day MA, there should be room for a higher valuation in the near term. In the same post, he pointed to the “final hurdle” for a larger breakout: the $68,000 resistance zone, which he noted had been tested once and would now face a second attempt.
He also outlined a bullish target near $73,000 if BTC can break through that resistance area. For traders, this framing matters because it sets up a clear conditional roadmap: support preservation may keep the higher valuation thesis alive, while a sustained failure below key averages could invalidate the breakout scenario.
Heading into the next sessions, traders will likely keep one eye on macro signals—especially Fed expectations and bond yields—and the other on whether BTC can hold the $64K moving-average area and challenge $68,000 again without another sharp slide. The tension between geopolitics-driven risk aversion and the technical bullish targets is likely to define how quickly conviction returns to either side.
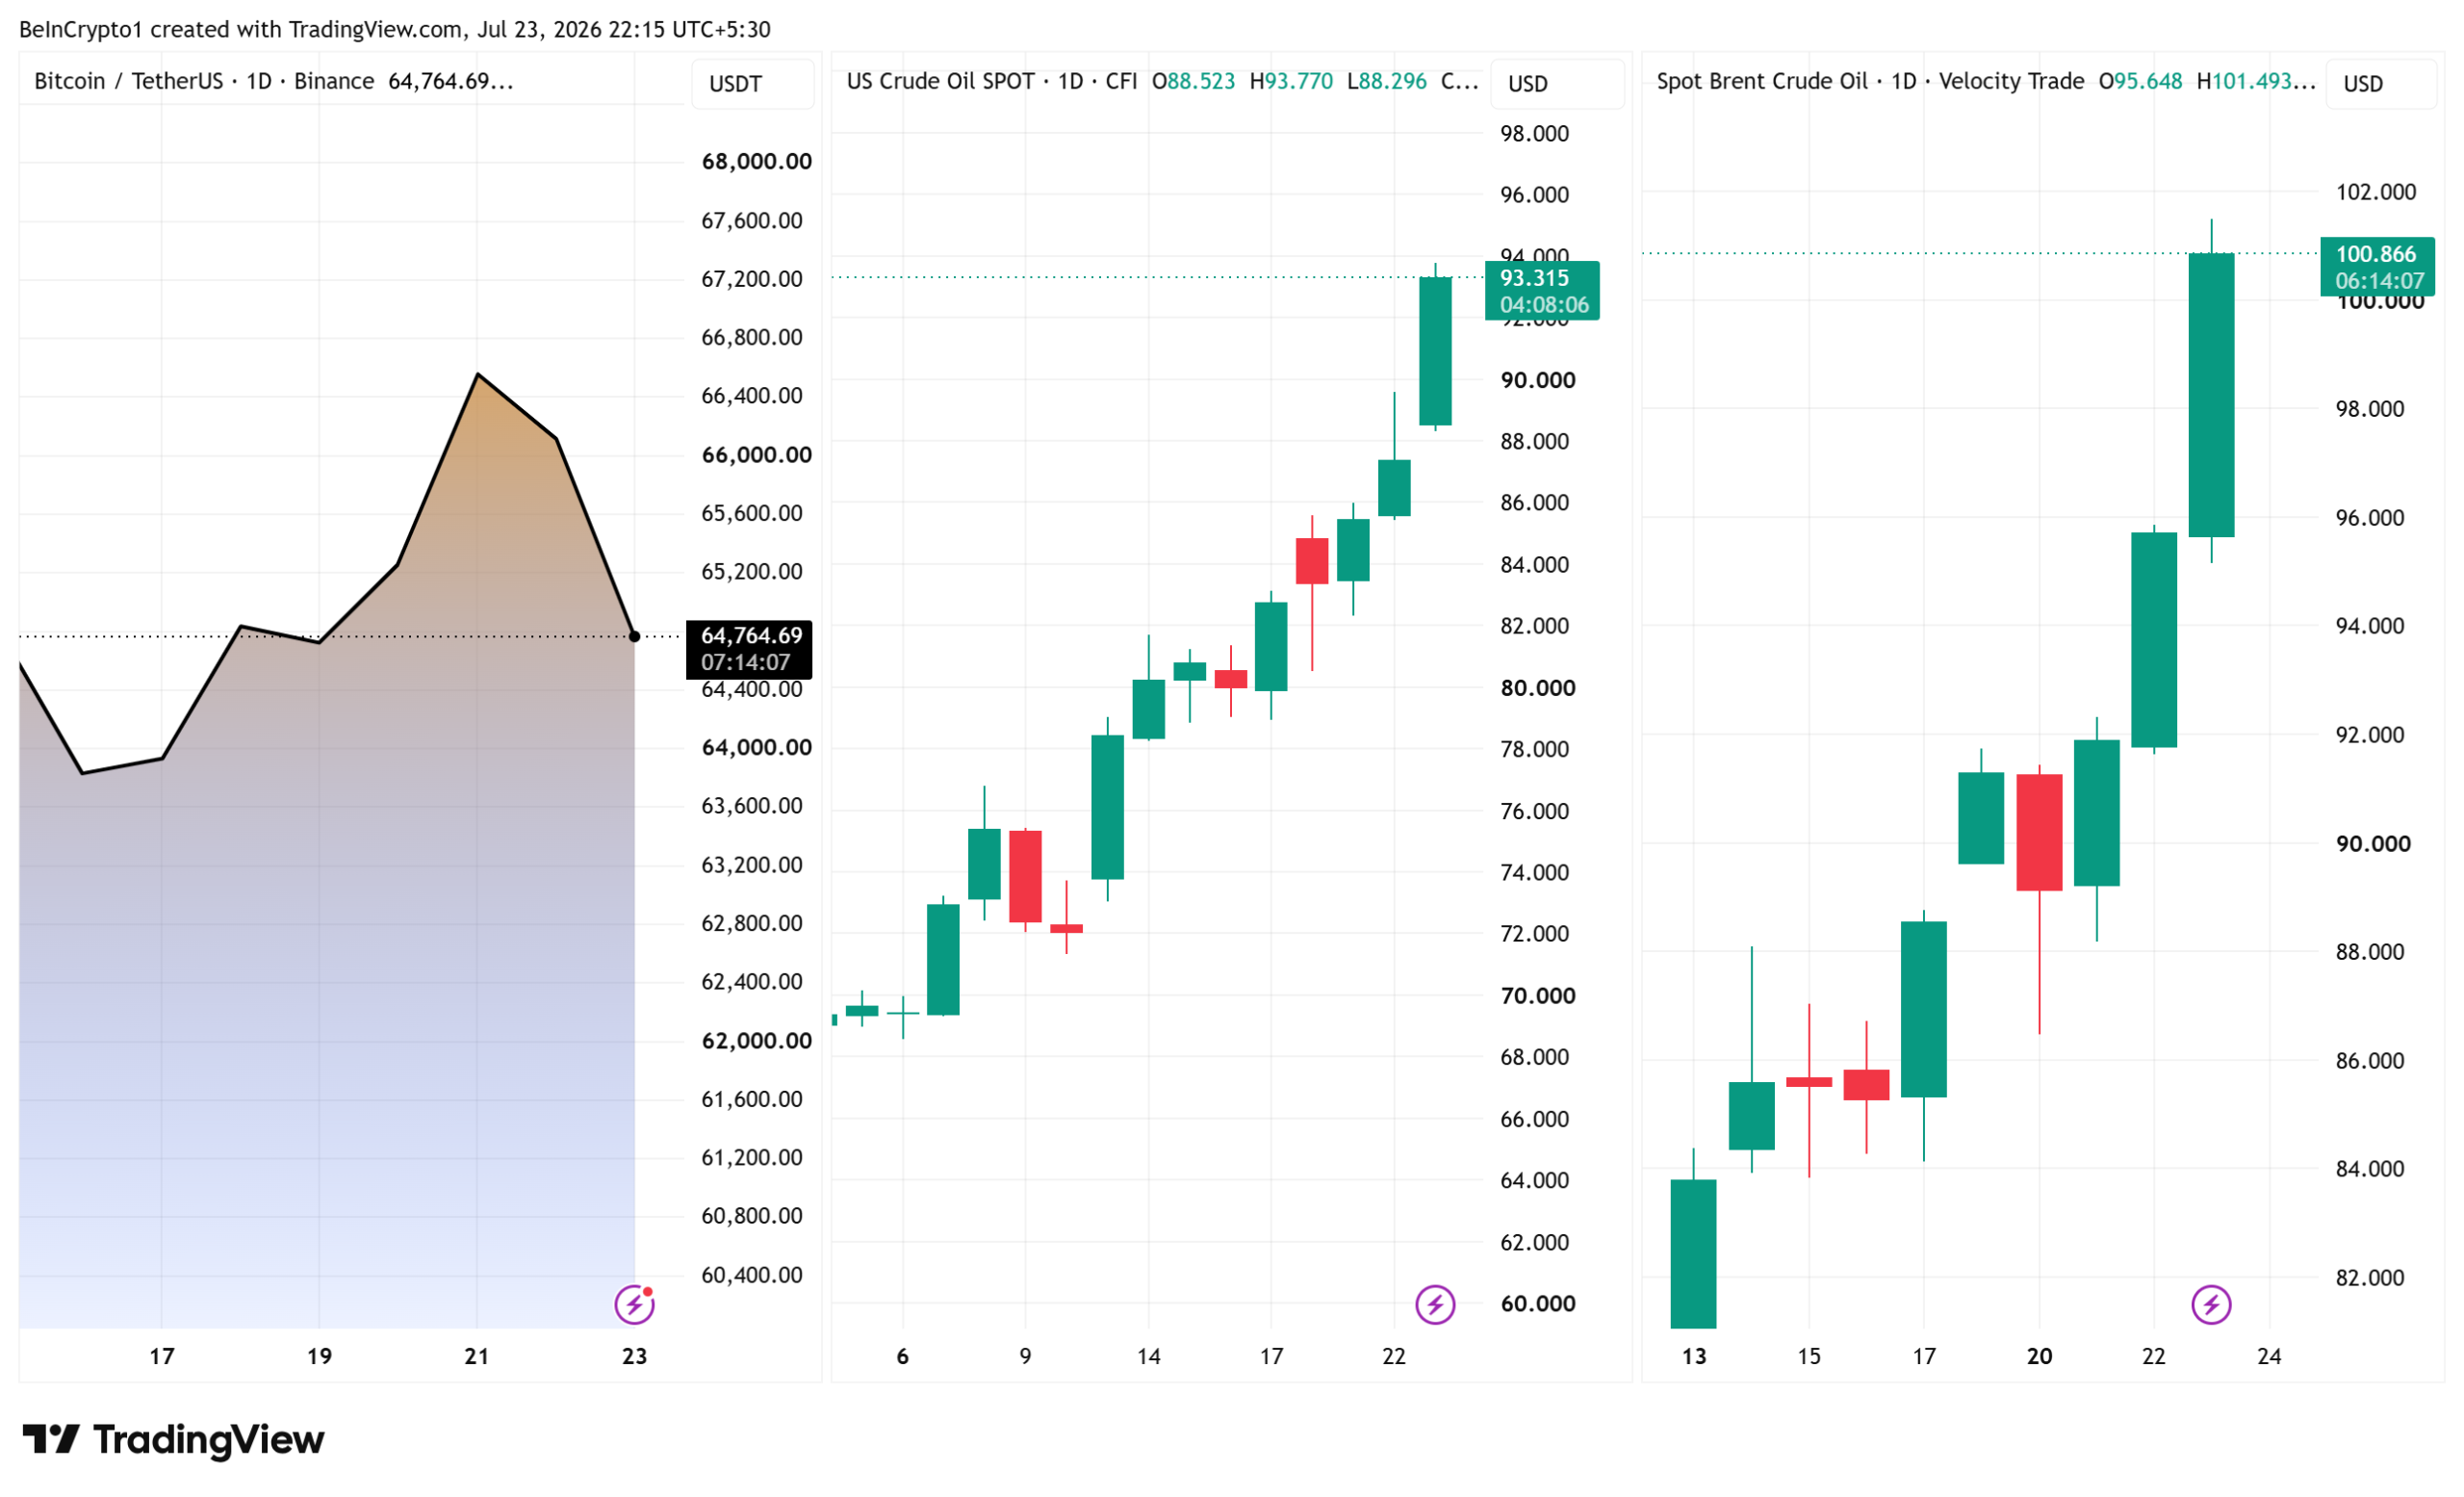
Oil prices jumped on Thursday. Brent crude topped $100 a barrel. The cause was one man. President Donald Trump said he is close to ordering a massive strike on Iran.
Reportedly, he told Axios he has not made a final call. But he says everything is ready. His decision could push oil even higher.

Trump’s Decision Could Push Oil Prices Higher
Trump said any new attack would be bigger than the last one. That earlier US campaign was called Operation Epic Fury. He said a decision is close, but not final.
“I am considering a massive attack. Bigger than ever before. I am close to making a decision. We are all set for it,” Axios reported.
The fight has grown over the past 12 days. The US wants to stop Iran from hitting ships in the Strait of Hormuz. About 20 million barrels of oil pass through that narrow route each day. That is close to a fifth of the world’s supply, the US Energy Information Administration (EIA) says.
The two sides had stopped fighting under a late-June truce. But tensions came back this month. US officials say no strike order has been given yet.
Iran-backed rebels in Yemen, the Houthis, have started hitting Saudi ships in the Red Sea. That puts a second oil route at risk, the Bab el-Mandeb strait. It handles millions of barrels a day too, EIA data show. Trump wrote on Truth Social that he would blame Iran for more attacks.
A bigger strike could block these oil ships and push prices up fast. The same thing happened on July 8. Bitcoin (BTC) fell below $62,000 and oil jumped when Trump ended an earlier deal with Iran.
For now, US crude sits near $93. Brent, the main global price, stays above $100. A full war would be very unpopular in the US.
Bitcoin Falls as Traders Play It Safe
Bitcoin fell about 2% in a day. It now trades near $64,755. It has barely moved over the past week.

The pioneer crypto has been stuck near $65,000 for weeks. However, crypto often falls when oil jumps on Middle East fears. Some traders had shrugged off Iran tensions earlier in July. Thursday’s threat changed that.
Trump set no deadline. So markets are left guessing. His next move will steer both oil and Bitcoin.
The post One Trump Decision Now Stands Between Oil and Its Next Surge As Brent Tops $100 appeared first on BeInCrypto.
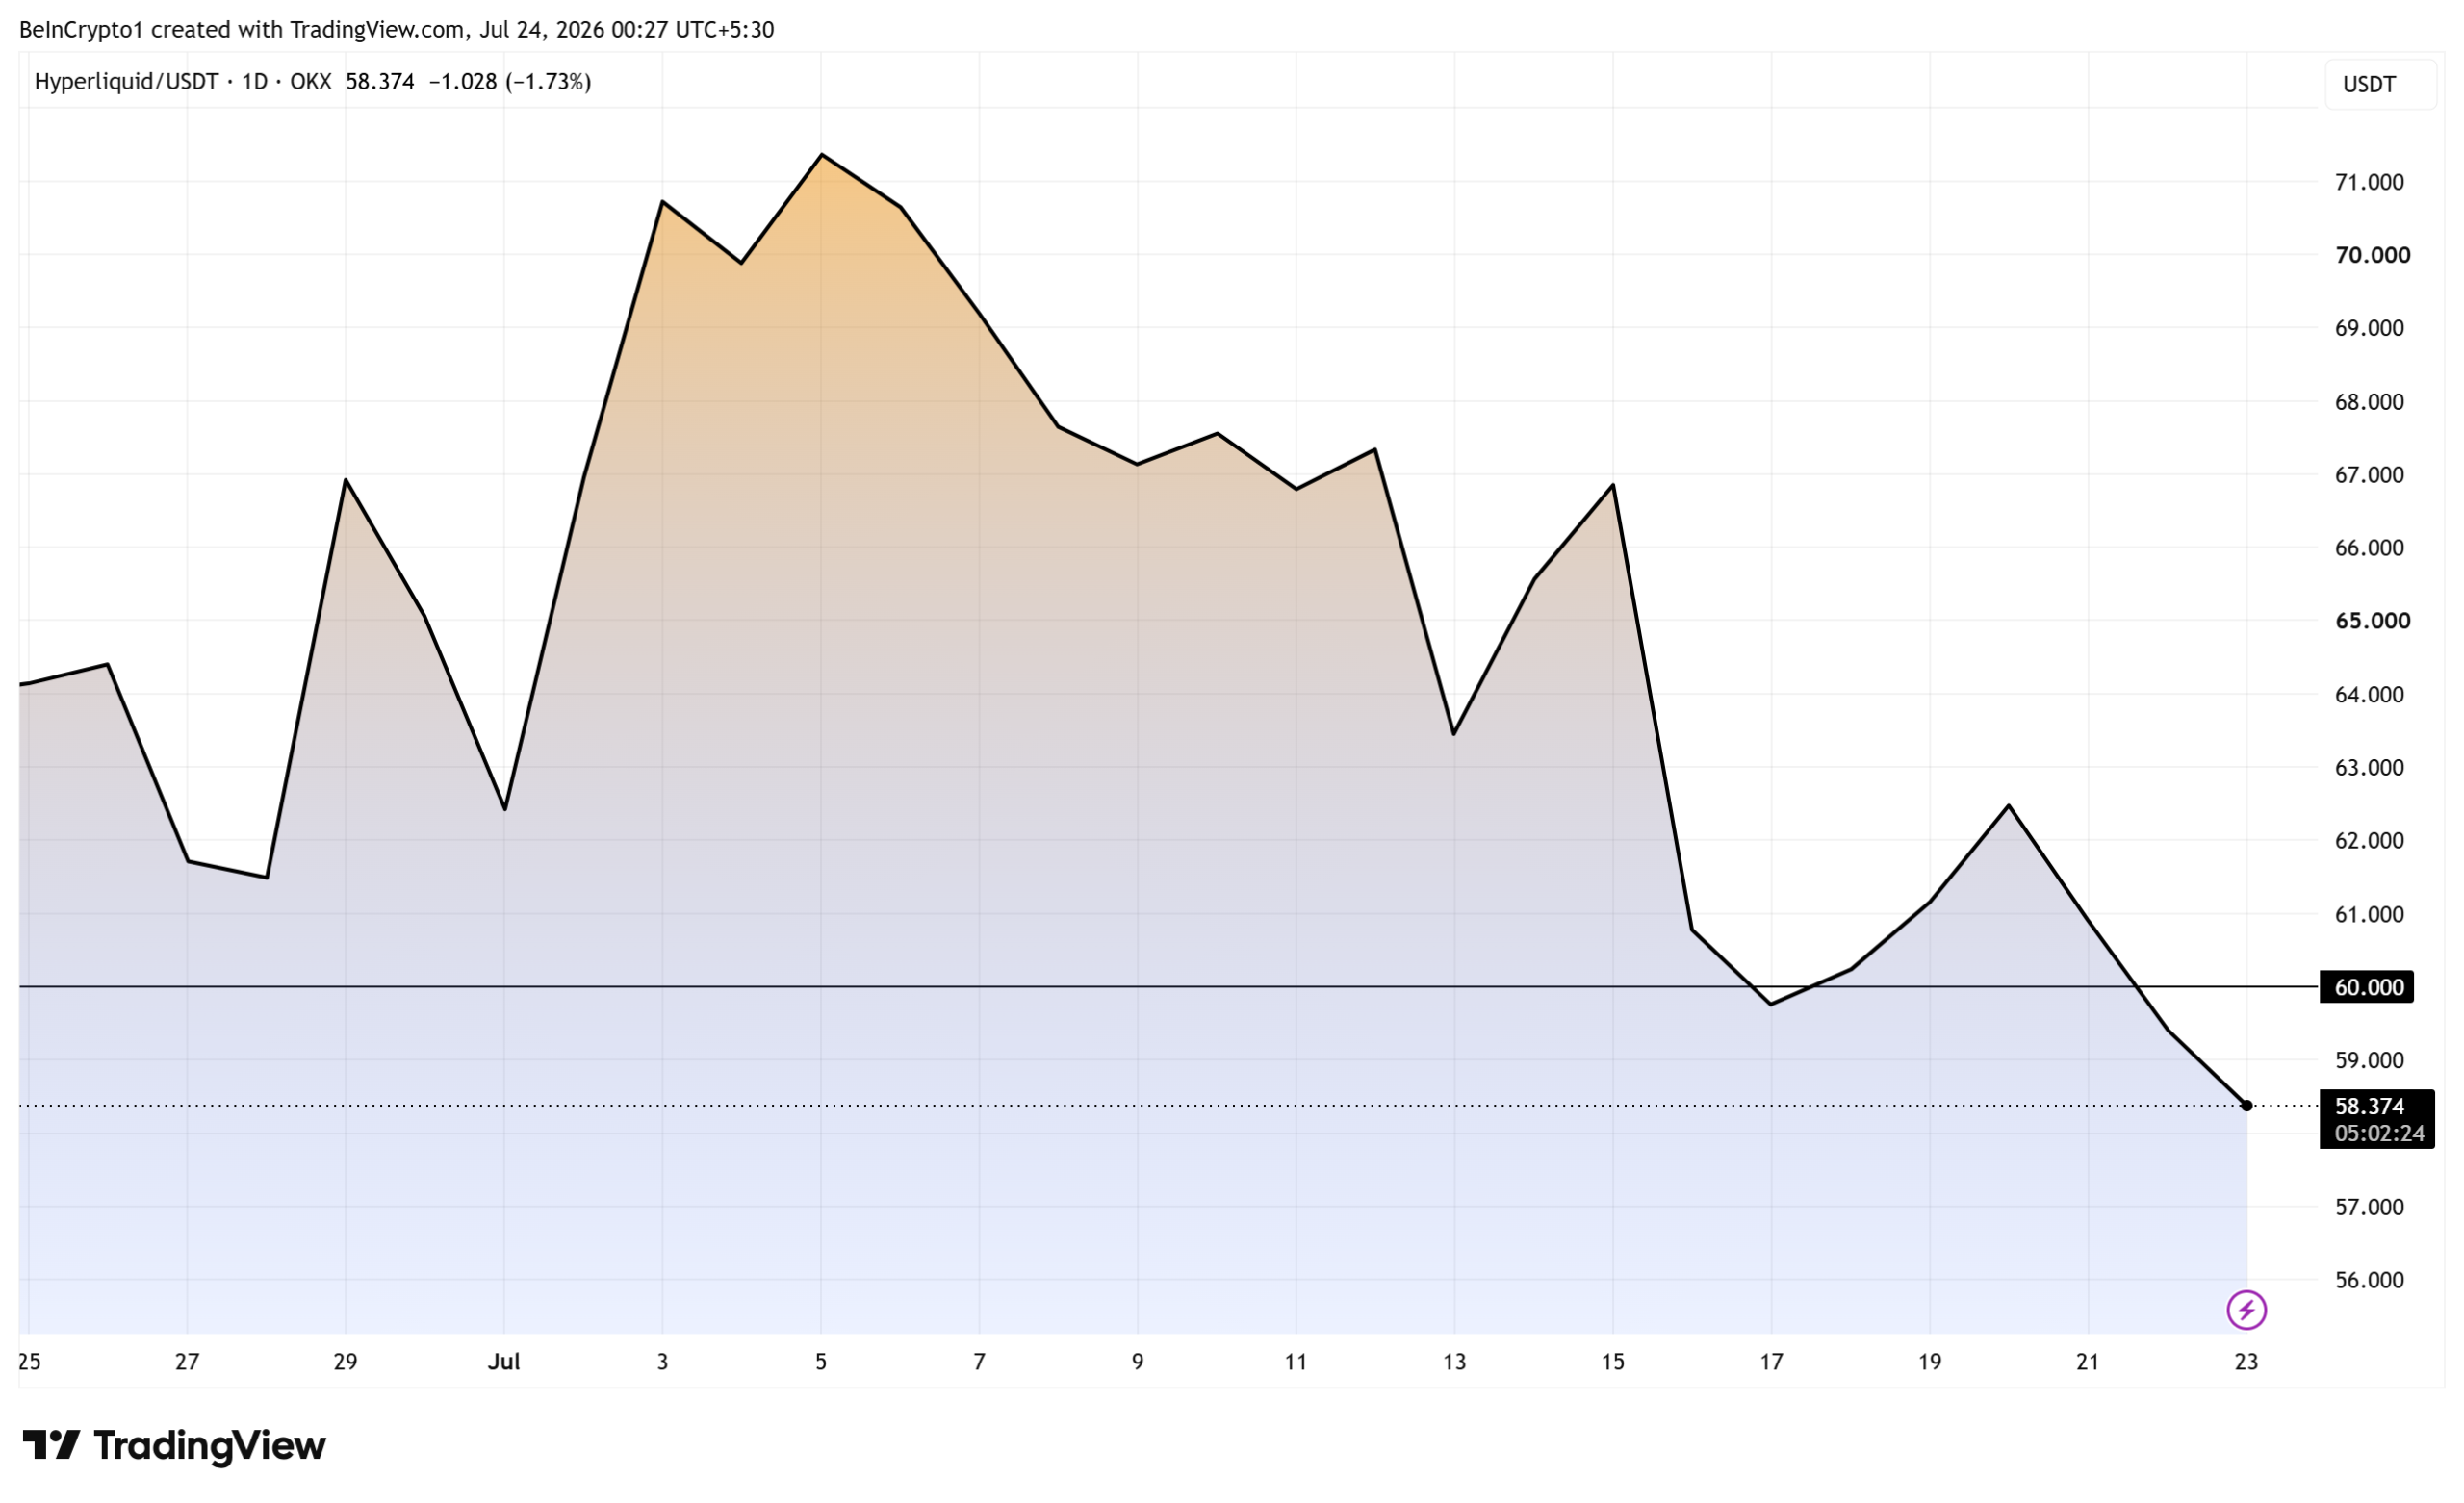
Two of crypto’s biggest funds just unstaked about $291 million of Hyperliquid (HYPE) in days. The token fell below $60, and traders feared a wave of selling.
Unstaking frees locked tokens for sale. But Multicoin says it is not selling, and on-chain data backs that up.
Why HYPE Fell Below $60
Hyperliquid is one of crypto’s busiest trading platforms. HYPE is now a top-10 token. It was trading for $58. That is down about 2% on the day. It sits about 24% below its June record of $76.70.

Multicoin unstaked close to 2 million HYPE, worth about $120 million. On-chain monitoring by MLM reveals that Paradigm unstaked even more. That was 2.92 million HYPE, worth around $171 million. Paradigm has not commented.
Together, that is about $291 million. It equals roughly 85% of HYPE’s daily trading volume. That is huge for a thin market. Lookonchain first spotted the Multicoin transfers. Some coins went to Coinbase Prime, a custody service.
Multicoin Says the HYPE Unstaking is Not a Sale
Multicoin cofounder Tushar Jain pushed back fast. He said the fund unstaked HYPE, but not to sell it.
“Yesterday we unstaked a large slug of HYPE. We did not unstake to sell… Our funds are constantly tracked, forcing regular wallet rotations. Institutions need privacy to operate”
Big funds are watched on-chain all the time. So they rotate wallets to stay private. Jain made the same case in an earlier interview. His firm holds a bullish HYPE forecast for 2028.
Why is every move visible? Hyperliquid took no venture money. It gave HYPE away in a 2024 airdrop. So big holders bought on the open market. Every wallet they use is easy to track.
On-chain account Markets Alpha checked the wallets. Its analysis found four linked wallets. They moved the unstaked HYPE into custody, not onto the market to sell.
One group even sent about 1 million HYPE to Grayscale. That helped fill its new Hyperliquid ETF, HYPG. The fund began trading on Nasdaq in June.
Why Some Traders are not Worried
Not everyone sees a problem. Trader Elon Trades said HYPE usage barely changed. He pointed to its growing derivatives market share and steady revenue.
Still, more coins may soon hit the market. On Hyperliquid, unstaking takes about seven days, per its documentation. Most unlock near the end of July.
What happens next? The funds could restake, hold, or sell. For now, the project’s fundamentals look solid. But the HYPE unstaking still hangs over the price. To recover, HYPE must climb back above $60.
The post Hyperliquid Slips Below $60 as Institutions Unstake $291M: Will Selling Follow? appeared first on BeInCrypto.
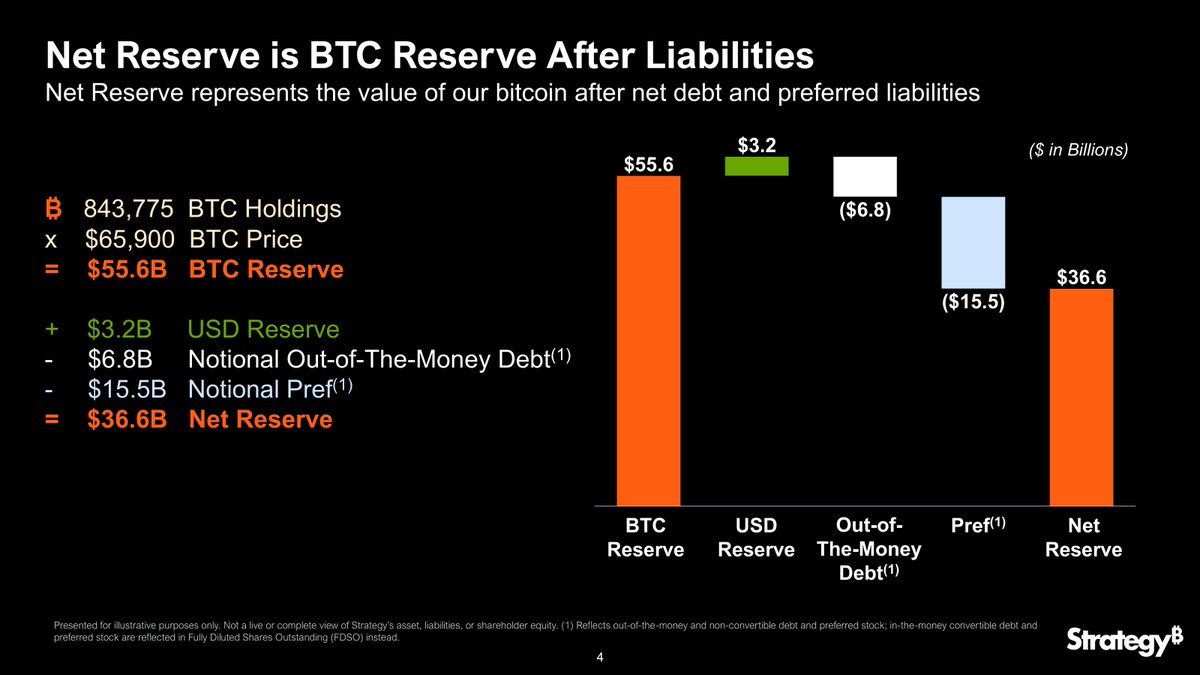
Strategy, formerly MicroStrategy, has overhauled the MSTR metrics it reports, and the new numbers make one thing clear. Much of its huge Bitcoin (BTC) pile is already promised to lenders and preferred investors, not regular shareholders.
The company says the change gives common shareholders a fairer picture. It shows how much Bitcoin is truly theirs after everyone else is paid first.
What the New Metrics Really Show
Strategy holds about 843,775 Bitcoin. That is the largest stash owned by any public company. On paper, its live dashboard values that Bitcoin at around $58 billion. But not all of it belongs to shareholders.
Lenders and preferred investors get paid first. They are owed about $22 billion. Take that out, and roughly $36 billion in Bitcoin is left for common shareholders. Strategy now calls this the net reserve.

The firm took on that debt to buy more Bitcoin. It laid out the approach in its Digital Credit framework this year. It also tested new numbers during an earlier metrics debate in June.
The Real Cost of the Debt
There is a catch. Servicing that debt and preferred stock costs about $1.8 billion a year. Strategy pays it in interest and dividends. It even keeps a cash reserve, set up in December, to cover those bills.
The new metrics also show the risk. A number called amplification, now about 1.53x, measures it. Put simply, shareholders gain more when Bitcoin rises. They also lose more when it falls. The stock proves the point. MSTR has dropped about 77% in a year, far more than Bitcoin’s 45% fall.

MicroStrategy also reworked its main value gauge, known as mNAV. It compares the share price to the Bitcoin left for shareholders, and it now sits at 1.00x. In plain terms, the old premium is gone.
The company admits its older numbers hid this. They left out the investors who get paid first. So Bitcoin bought with borrowed money may never reach common shareholders. Critics have questioned the mNAV model for months.
“Bitcoin Capital Markets require a new financial language,” said, Michael Saylor, the firm’s founder and executive chairman.
Bitcoin traded near $65,136 as of this writing, down about 1.4% on the day. When it falls, shareholders feel it first, which decides who absorbs the losses.
The plan itself has not changed. Strategy still buys Bitcoin, and it still owes its lenders first. But shareholders can now see how much Bitcoin is really theirs.
The post MicroStrategy Changes the MSTR-Bitcoin Link: What Do Shareholders Own? appeared first on BeInCrypto.

The quarter Robinhood’s chain missed by one day

Scottie Scheffler gets little things right in surprise 3M Open debut

BASICally, Its Retro Machine Language


-

 Fashion6 days ago
Weekend Open Thread – Corporette.com
-

 Politics6 days ago
The House | The City of London can help the new chancellor deliver growth in every postcode
-
 Crypto World6 days ago
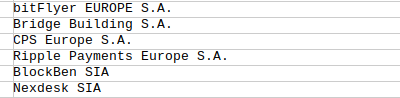
Ripple Payments Joins MiCA With 14 Firms, Does It Mean Anything For XRP?
-
 Crypto World7 days ago
Two July Windows Left: The CLARITY Act’s Senate Fight and What Failure Means
-

 Politics4 days ago
Democrats look to World Cup watch parties to register thousands of voters
-

 Crypto World6 days ago
Ripple wins EU-wide access as ESMA adds it to MiCA register
-

 Crypto World3 days ago
Grayscale Files For Worldcoin ETF, WLD Registers Sharp Rise
-

 NewsBeat4 days ago
Unregistered fitter used Gas Safe logo on business flyers
-
 Tech3 days ago
Sail Virtually Aboard The “Itanic” With IA-64 Emulator
-
 Tech3 days ago
Turtle Beach Command Series KB7 review: a nifty screen-equipped gaming keyboard
-

 NewsBeat6 days ago
Registration is now open for March for Men with Kev 2026
-

 News Videos4 days ago
Big Money Is Entering XRP
-
 Business2 days ago
New Jersey voter registration controversy explained: How 6,600 noncitizens got on the rolls, and what happens next
-

 News Videos7 days ago
Money | Class 12 Economics | CBSE Board Exam 2026-27
-

 Business7 days ago
Banco Bilbao Vizcaya Argentaria, S.A. (BBVA) Discusses Global Macro Environment and Economic Outlook for Core Markets Transcript
-

 Crypto World5 days ago
Kaspersky exposes OkoBot’s 20-module crypto wallet attack
-
 Entertainment2 days ago
Johnny Depp’s R-Rated Gothic Cult Classic Gets New Release Ahead of Sydney Sweeney Remake
-

 Business6 days ago
Airlines warn Sunshine Protection Act could disrupt flight scheduling
-

 NewsBeat6 days ago
Durham County Council to send out electoral registration emails
-
Business7 days ago
Nephros, Inc. (NEPH) Discusses Evolving Water Safety Strategies and Expansion Beyond Filtration Transcript
You must be logged in to post a comment Login