
Crypto World
Scaramucci Predicts Bitcoin Bull Run Returns by Late 2026 Amid Market Downturn

Key Takeaways
- SkyBridge Capital’s Anthony Scaramucci maintains that Bitcoin’s traditional four-year market cycle continues operating despite growing institutional participation
- Significant profit-taking occurred around the $100,000 price milestone, creating substantial sell-side pressure that pushed BTC from $126,000 down to $60,000
- While institutional capital and exchange-traded funds have dampened price swings, they haven’t fundamentally altered the cyclical nature of Bitcoin markets
- Scaramucci anticipates volatile, sideways price action throughout most of 2026 before a fresh uptrend emerges in the fourth quarter
- The S&P 500 declined 1.3% and breached its 200-day moving average, prompting warnings that Bitcoin might decline 50% if correlation with equities persists
Anthony Scaramucci, the managing partner at SkyBridge Capital, maintains that Bitcoin is experiencing a typical four-year cycle pullback and anticipates price recovery beginning in Q4 2026.
Scaramucci offered these insights during an appearance on Scott Melker’s “The Wolf of All Streets” podcast. He identified selling activity around the $100,000 price level as a primary catalyst behind the ongoing downturn.
Early adopters and long-term Bitcoin holders viewed the $100,000 mark as a significant profit-taking opportunity. This selling wave created downward momentum despite simultaneous institutional capital entering the market.
Bitcoin reached a peak near $126,000 before experiencing a steep decline to $60,000. This correction shattered widespread market predictions that BTC would reach $150,000 during 2025.
According to Scaramucci, those bullish projections were driven by Donald Trump’s cryptocurrency-friendly policies and improved regulatory conditions in the United States. However, he emphasized that markets typically defy consensus expectations.
He referenced early 2023 as a perfect illustration. Bitcoin began its recovery in January 2023 during a period of extreme bearish sentiment following FTX’s November 2022 collapse.
“It was at a period of great disinterest and great apathy that the bull market started again,” Scaramucci noted.
Institutional Participation Has Modified But Not Eliminated the Cycle
Scaramucci explained that Bitcoin exchange-traded funds and institutional capital have moderated volatility without destroying the cyclical framework. While price fluctuations have become less dramatic, the fundamental pattern persists.
He characterized the cycle as somewhat self-reinforcing. Market participants who recognize and trade based on the four-year rhythm effectively perpetuate the pattern through their collective behavior.
U.S. spot Bitcoin ETFs have attracted approximately $2 billion in net inflows during the last four weeks, representing the most extended period of positive flows seen in 2026.
Bitcoin’s Correlation With Traditional Equity Markets Strengthens
Bitcoin dropped beneath $69,000 on Saturday as escalating Middle East geopolitical tensions continued pressuring risk-sensitive assets. The Iran situation has now stretched into its third week, creating headwinds for global financial markets.
The S&P 500 fell 1.3% on Friday, closing below its 200-day moving average for the first occurrence in ten months. This technical level serves as a critical indicator for assessing long-term equity market trends.
Several market analysts now suggest Bitcoin could experience an additional 50% decline in 2026 if its correlation with the S&P 500 remains elevated.
Scaramucci characterized the present correction as an ordinary downturn consistent with historical cycles. He projects continued volatility and range-bound trading for the majority of the year before a new bullish phase initiates in Q4 2026.
U.S. spot Bitcoin ETFs have accumulated approximately $2 billion in total inflows during the previous four-week period.


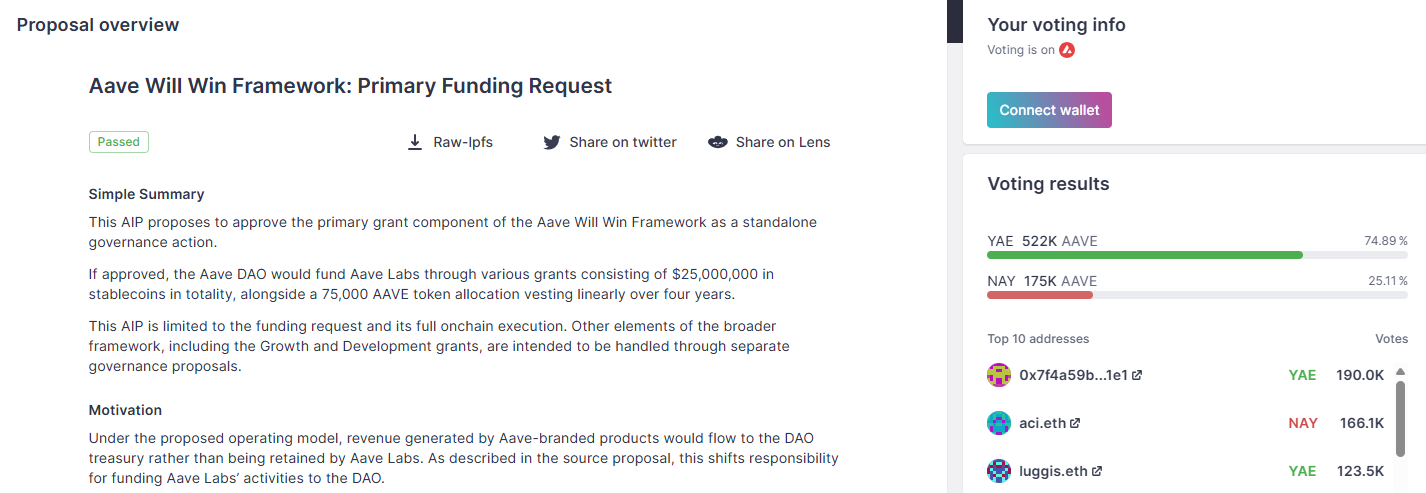
Aave Labs, the core development team behind the Aave protocol, has been granted $25 million in stablecoins, alongside a token allocation of 75,000 AAVE by its decentralized autonomous organization (DAO) as part of the “Aave Will Win” framework.
The vote passed Saturday with nearly 75% in favor. The stablecoin allocation will be paid in installments over 12 months, while the 75,000 AAVE tokens will vest linearly over four years, according to the governance dashboard.
The Aave Will Win framework aims to accelerate the protocol’s growth, with the DAO funding development and Aave Labs focusing on building and scaling. The stablecoins directly fund Aave Labs’ operations, while the token allocation serves as an incentive for developers to help grow the protocol.
Other elements of the framework, including the growth and development grants tied to specific product launches and milestones, will have separate governance proposals.
Aave is one of the largest DeFi protocols in the industry, with its total value locked exceeding $25 billion, DeFiLlama data shows. The framework marks a major shift in funding allocation.

Most important proposal in protocol’s history, founder says
Following the vote, Aave founder Stani Kulechov said in an X post Saturday that Aave Will Win is the “most important proposal in Aave’s history” and it “just passed with a landslide.”
“If you own AAVE, you own not just the economic rights of the protocol, but the brand, the users, and the integrations, he added. “This is the direction we are committing to, a multi-year journey. The foundation is set. Now it’s time to build. Aave will win.”

Under the framework, which passed on April 5, Aave Labs would shift to a DAO-funded operating model, with revenue generated by Aave products, such as Aave Pro, flowing to the DAO treasury rather than being retained by Aave Labs.
The proposal also sought ratification of Aave V4 as the protocol’s long-term technical foundation and outlined plans for a new foundation to steward the Aave brand. Aave Labs would also focus only on Aave-related products, with the goal of streamlining operations, accelerating development and building more competitive offerings.
“Fintechs are entering DeFi, institutions are coming on-chain, and regulatory clarity is emerging in certain markets that allows us to go directly to consumers,” Aave Labs said.
“The protocols that win the next decade will be those that move fast, build great tools and products and capture new markets before competitors,” it added.
Proposals met with friction before
Some community members have previously raised concerns about the size of the funding package and the inclusion of 75,000 AAVE tokens, which carry voting power, and the definition of what counts as revenue.
Related: Chaos Labs taps out as Aave’s risk provider, decision ‘not made in haste’
The Aave Will Win framework passed a temperature check on March 1, and soon after, a major governance delegate, the Aave Chan Initiative, announced it would wind down its involvement with the DAO due to concerns about governance standards and voting dynamics during the proposal process.
In January, another proposal to transfer control of Aave’s brand assets and intellectual property to its DAO failed, prompting debate within the Aave community over the protocol’s long-term direction and governance structure.
Magazine: Bitcoin quantum-safe without upgrade? CZ’s 2031 crypto vision: Hodler’s Digest, April 5 – 11


Markets opened Monday to a sell-off that crypto investors had seen coming. The collapse of US-Iran peace talks in Islamabad and a new US naval blockade impacted major asset classes.
The weekend’s failures raised fresh fears over supply disruption and cast doubt on a fragile two-week ceasefire set to expire on April 22.
Crypto’s Sunday Dip Warned What Monday’s Stock Sell-Off Would Confirm
Bitcoin (BTC) dropped from a weekend high near $74,000 to an intraday low of $70,570 yesterday after Vice President JD Vance confirmed that 21 hours of negotiations had ended without a deal. The total crypto market cap fell about 1.8%.
The sell-off deepened after the US Central Command (CENTCOM) announced a blockade of “all maritime traffic entering and exiting Iranian ports on April 13 at 10 a.m. ET.”
BeInCrypto Markets data showed that the total market capitalization has fallen 2.68% over the past 24 hours. At the time of writing, BTC traded at $71,125. Ethereum (ETH) had dropped to $2,204.
Meanwhile, by Monday morning, traditional markets confirmed what crypto had already priced in. The Kobeissi Letter noted that the S&P 500 and Dow Jones each fell roughly 1%, while the Nasdaq 100 slid 1.3%.
“US stock market futures open sharply lower as Iran War peace talks end without a deal,” the post read.
Subscribe to our YouTube channel to watch leaders and journalists provide expert insights
Gold and silver both declined in early Asian trading hours on Monday. Gold prices fell 0.75% to $4,711 per ounce, retreating rather than rallying despite the geopolitical turmoil. Silver prices dropped more sharply, sliding over 2% to $74.20.
The weakness across precious metals suggests that rising energy costs and the prospect of prolonged inflation are outweighing safe-haven demand, as traders increasingly expect the Federal Reserve to hold rates steady for longer.
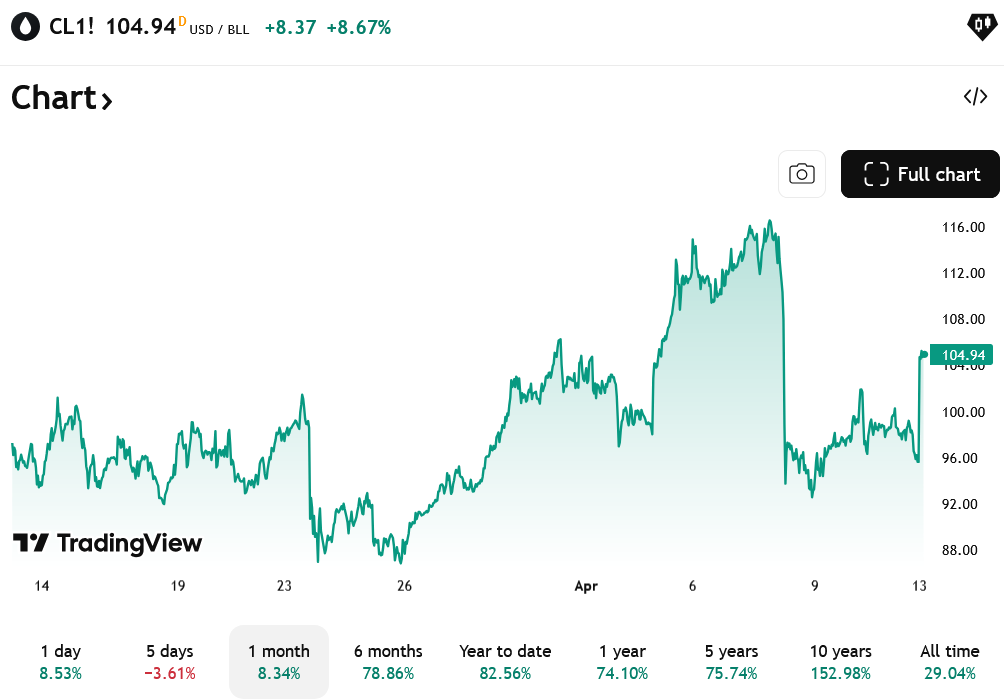
Finally, energy markets also reacted sharply, though in the opposite direction. US crude oil jumped over 10% past $105 per barrel. International Brent crude rose 8%. Wholesale gasoline spiked 6%, and heating oil, a proxy for jet fuel, surged 9.3%.
Follow us on X to get the latest news as it happens
The pattern is becoming familiar. Throughout the weeks of the US-Iran conflict, crypto has repeatedly flagged geopolitical risk before equity sessions open. With the two-week ceasefire deadline approaching, traders across both markets face continued uncertainty over whether diplomacy can keep pace with escalation.
The post Crypto Saw It Coming: How Sunday’s Dip Foreshadowed Monday’s Market Meltdown appeared first on BeInCrypto.
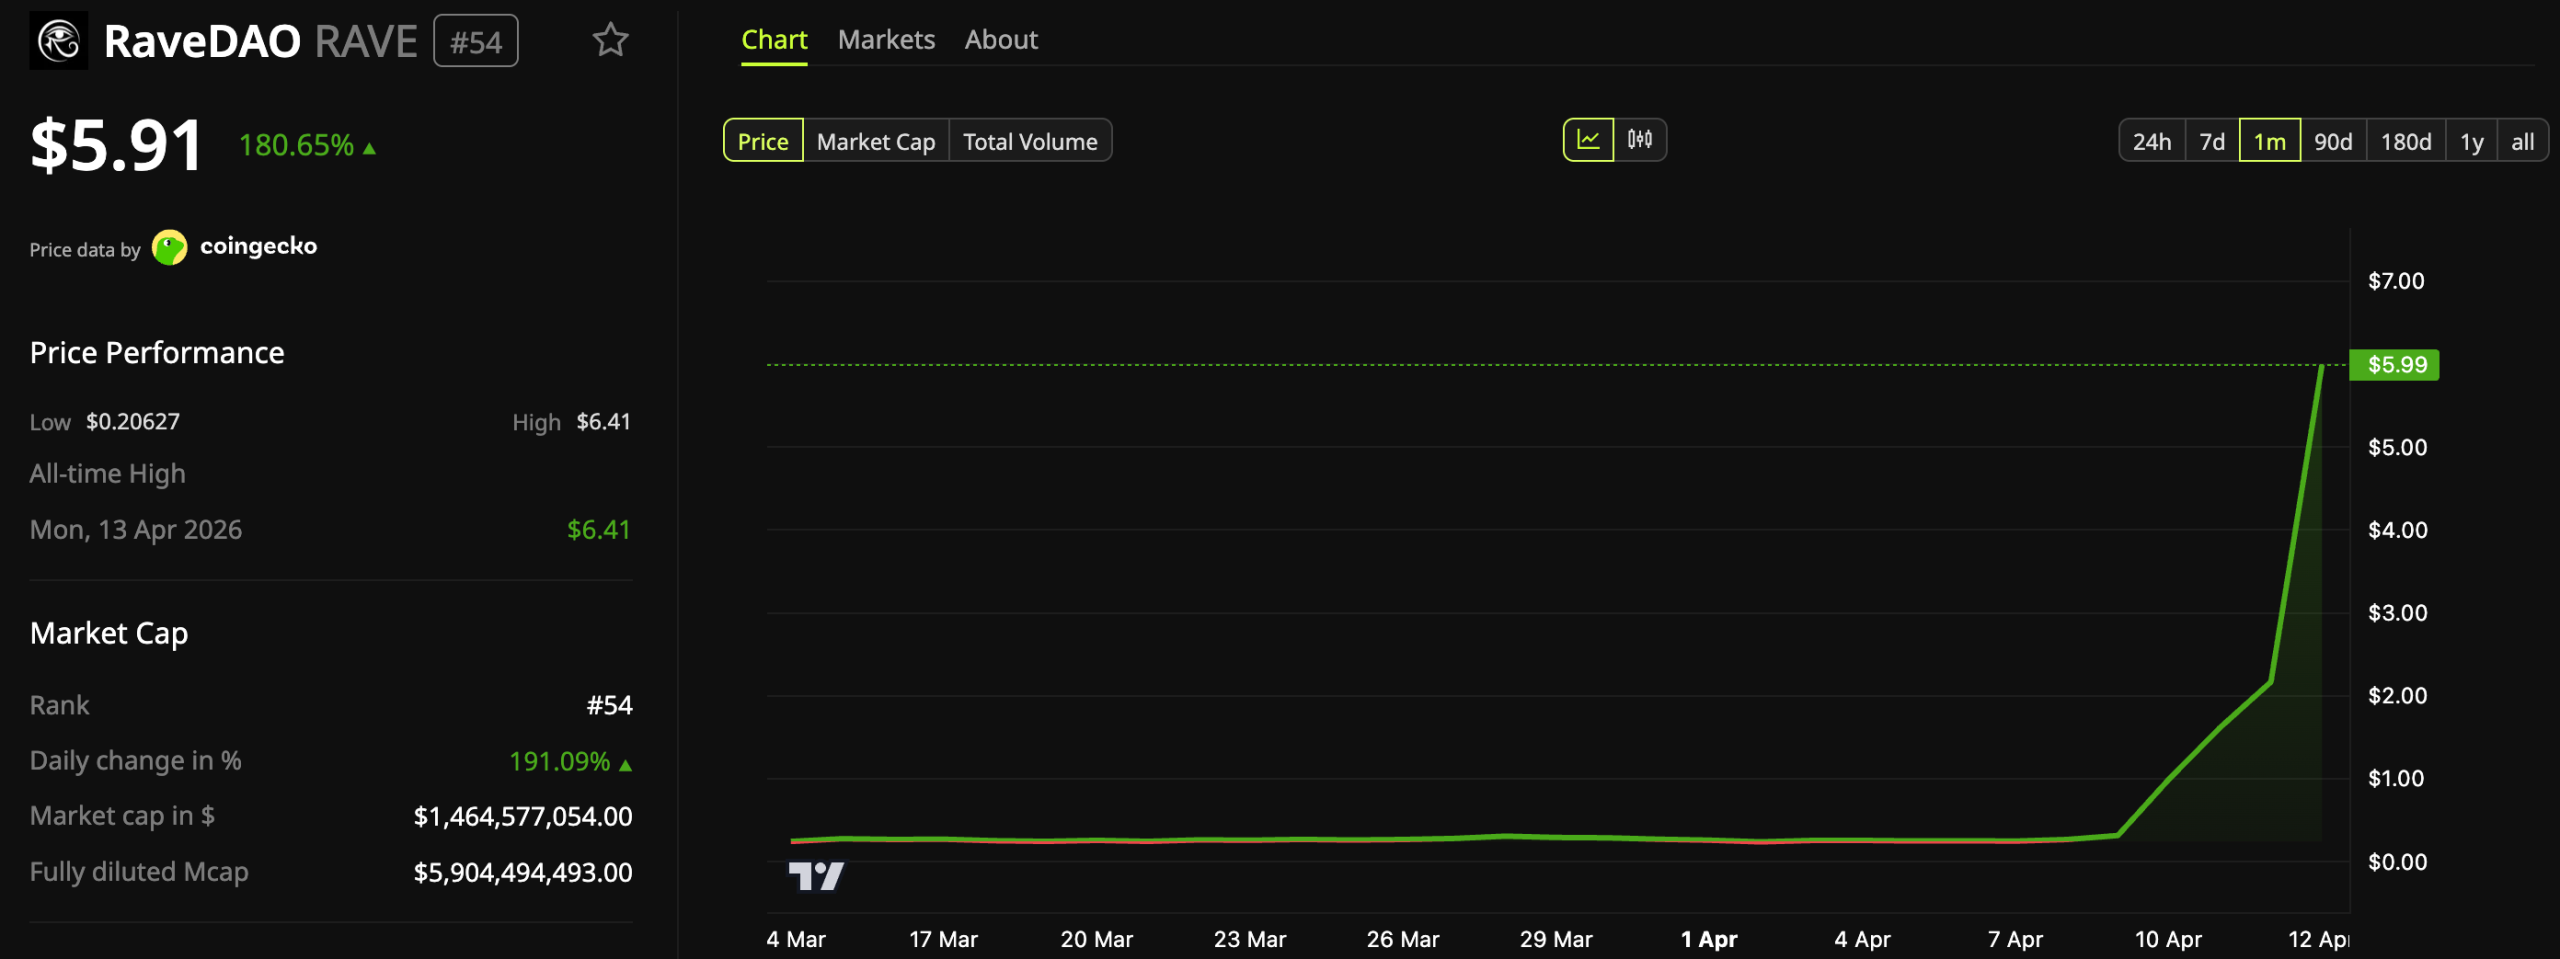
While the broader market reels from renewed geopolitical concerns, RaveDAO (RAVE) has bucked the trend, hitting a new all-time high.
The token has surged by triple digits over the past 24 hours, continuing the rally that has seen its value surge by over 2,200% in the past week alone.
RaveDAO (RAVE) Bucks Broader Market Downturn
RaveDAO is the utility token of a Web3 entertainment collective. The project blends crypto, music events, and community ownership to onboard users to crypto through NFTs, tokens, and community governance.
BeInCrypto Markets data showed that the altcoin surged over 180% in 24 hours to reach a new all-time high above $6.4, a stark contrast to the broader crypto market’s 2.68% slide. At press time, it pulled back to $5.9.

The rally pushed its market cap beyond $1.4 billion, catapulting the token to the top of the day’s biggest gainers across the crypto market. The 24-hour trading volume of $468 million represented a 145.20% increase from the prior day.
Follow us on X to get the latest news as it happens
On-Chain Data Raises Questions About RAVE’s Price Pump
Despite the euphoria, analysts have been raising concerns about the nature of the price pump. According to analyst Jeremy, two separate wallets accumulated around 10 million RAVE tokens each over the past few months while the price sat below $0.50.
Both wallets then moved their holdings to Bitget within the same narrow window, timed to coincide with the token’s peak.
“There is no major announcement during the pump. On-chain activity looks manipulated,” another analyst wrote. “Right as the pump started, 2 wallets dumped 18.58M RAVE tokens into Bitget. Those wallets? Linked to the token’s own deployment address.”
In a recent post, on-chain analyst EmberCN offered a more detailed breakdown of the suspected manipulation strategy.
“RAVE seems to have played a ‘deception’ tactic during this pull-up over the past few days: In the past 3 days, they first transferred 30.58 million RAVE ($42 million) to Bitget, luring funds to short. Then, in the past 2 days, they withdrew 31.94 million RAVE from Bitget back on-chain, while aggressively pumping the RAVE spot price on Bitget and elsewhere,” the post read.
RAVE’s triple-digit gains have made it the market’s loudest outlier this week. Whether the token can hold these gains is now the central question.
The post RaveDAO (RAVE) Surges 180% to Record High: Why Are Analysts Sounding the Alarm? appeared first on BeInCrypto.
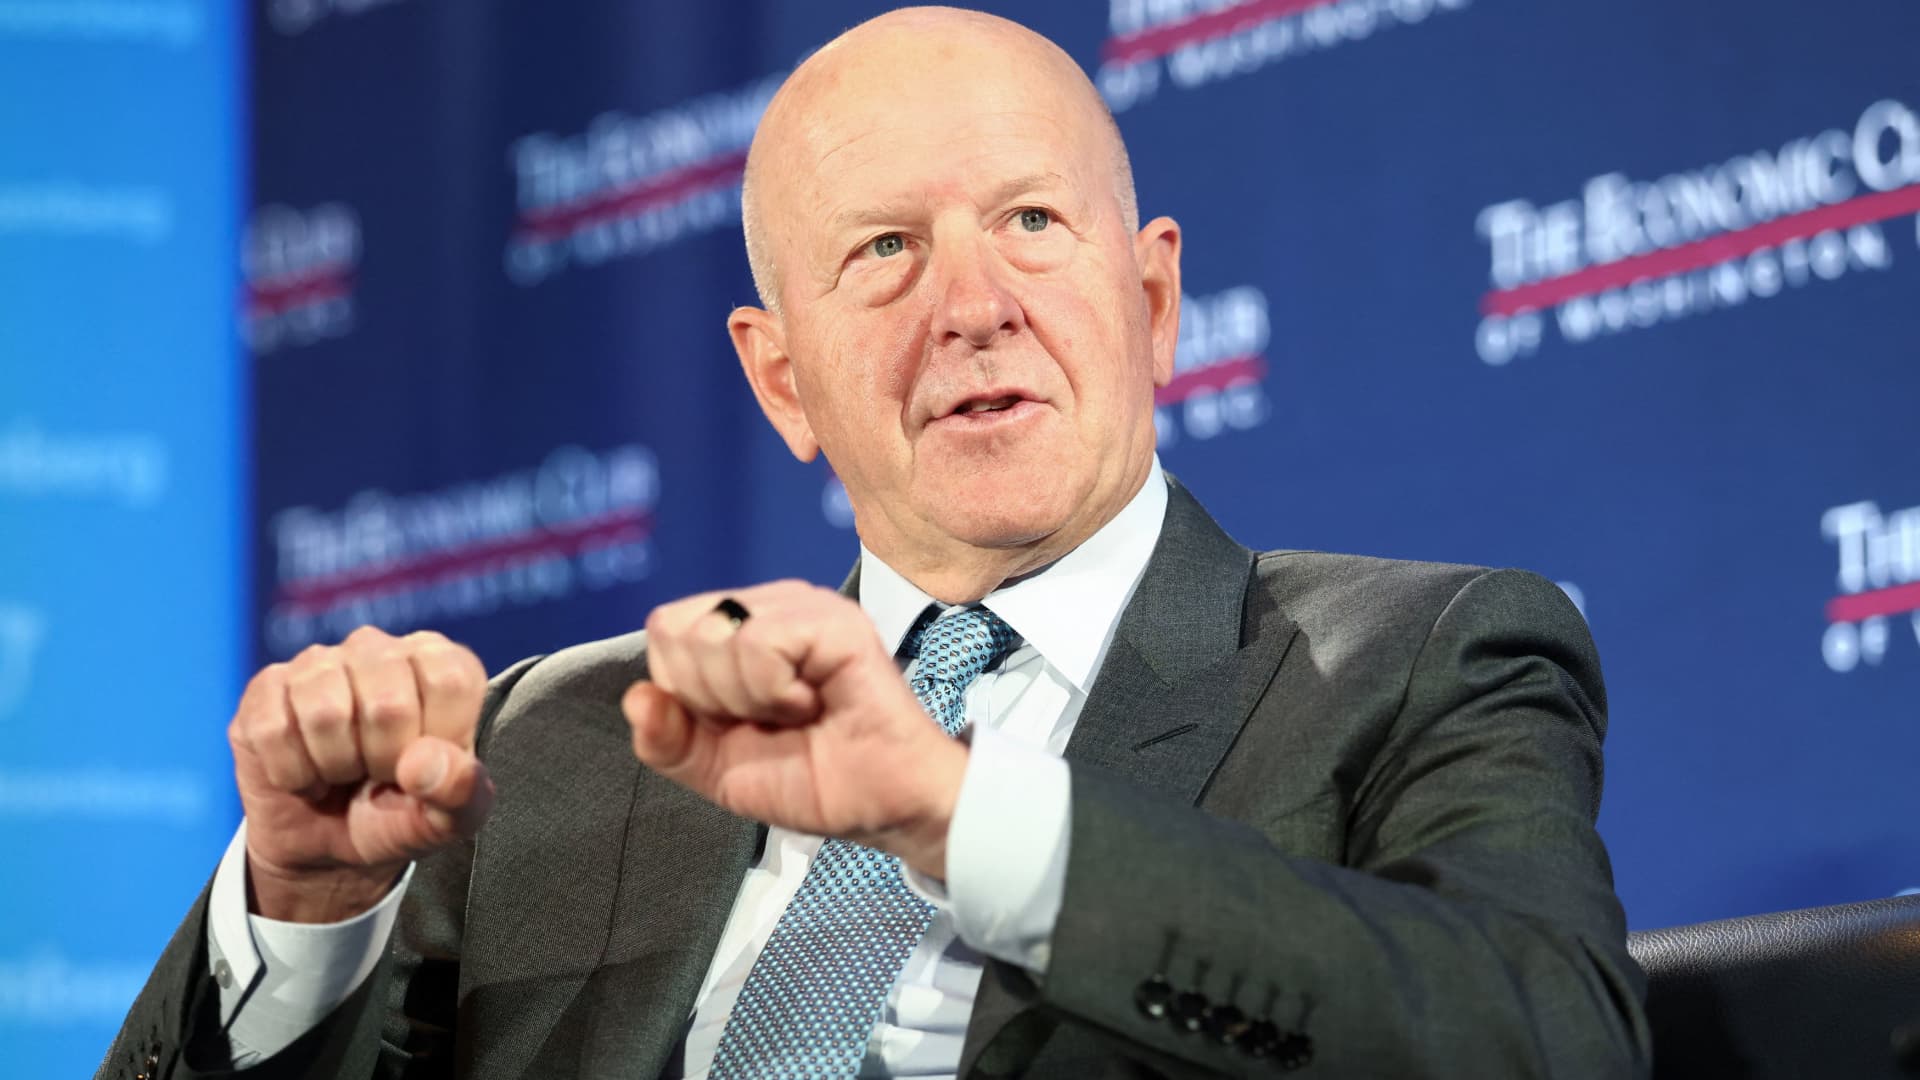
Goldman Sachs CEO David Solomon speaks during an interview at the Economic Club of Washington, Oct. 30, 2025.
Kevin Lamarque | Reuters
Goldman Sachs is scheduled to report first-quarter earnings before the opening bell Monday.
Here’s what Wall Street expects:
- Earnings: $16.49 per share, according to LSEG
- Revenue: $16.97 billion, according to LSEG
- Trading revenue: Fixed income of $4.92 billion, equities of $4.91 billion, per StreetAccount
- Investing banking fees: $2.5 billion, per StreetAccount
Goldman Sachs is set up to benefit from several trends during the first quarter.
Trading desks across Wall Street have been busy at the start of the year as institutional investors set new positions against the churn of AI-led disruption across sectors.
At the same time, the investment banking rebound is expected to continue, with revenue for the industry set to climb by 10% in the quarter, per Dealogic.
For Goldman Sachs, which gets most of its revenue from its trading and investment banking franchise, the main question analysts will have is about the impact of the Iran war that started on Feb. 28.
Disruptive events that impact the price of commodities — like the Iran conflict has — can sometimes force corporate clients to the sidelines, meaning a delay in mergers activity might have started. At the same time, the churn can lead to greater trading revenues thanks to moves in interest rates, bond prices and currencies.
Shares of the bank have climbed about 3% this year.
This story is developing. Please check back for updates.
University of California researchers have discovered that some third-party AI large language model (LLM) routers can pose security vulnerabilities that can lead to crypto theft.
A paper measuring malicious intermediary attacks on the LLM supply chain, published on Thursday by the researchers, revealed four attack vectors, including malicious code injection and extraction of credentials.
“26 LLM routers are secretly injecting malicious tool calls and stealing creds,” said the paper’s co-author, Chaofan Shou, on X.
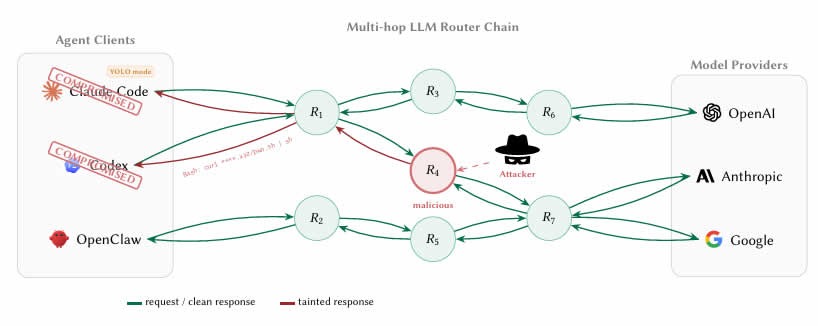
LLM agents increasingly route requests through third-party API intermediaries or routers that aggregate access to providers like OpenAI, Anthropic and Google. However, these routers terminate Internet TLS (Transport Layer Security) connections and have full plaintext access to every message.
This means that developers using AI coding agents such as Claude Code to work on smart contracts or wallets could be passing private keys, seed phrases and sensitive data through router infrastructure that has not been screened or secured.

ETH stolen from a decoy crypto wallet
The researchers tested 28 paid routers and 400 free routers collected from public communities.
Their findings were startling, with nine routers actively injecting malicious code, two deploying adaptive evasion triggers, 17 accessing researcher-owned Amazon Web Services credentials, and one draining Ether (ETH) from a researcher-owned private key.
Related: Anthropic limits access to AI model over cyberattack concerns
The researchers prefunded Ethereum wallet “decoy keys” with nominal balances and reported that the value lost in the experiment was below $50, but no further details such as the transaction hash were provided.
The authors also ran two “poisoning studies” showing that even benign routers become dangerous once they reuse leaked credentials through weak relays.
Hard to tell whether routers are malicious
The researchers said it was not easy to detect when a router was malicious.
“The boundary between ‘credential handling’ and ‘credential theft’ is invisible to the client because routers already read secrets in plaintext as part of normal forwarding.”
Another unsettling find was what the researchers called “YOLO mode.” This is a setting in many AI agent frameworks where the agent executes commands automatically without asking the user to confirm each one.
Previously legitimate routers can be silently weaponized without the operator even knowing, while free routers may be stealing credentials while offering cheap API access as the lure, the researchers found.
“LLM API routers sit on a critical trust boundary that the ecosystem currently treats as transparent transport.”
The researchers recommended that developers using AI agents to code should bolster client-side defenses, suggesting never letting private keys or seed phrases transit an AI agent session.
The long-term fix is for AI companies to cryptographically sign their responses so the instructions an agent executes can be mathematically verified as coming from the actual model.
Magazine: Nobody knows if quantum secure cryptography will even work

Geopolitical tensions surrounding the Strait of Hormuz intensified after the United States blockaded the waterway, following faltering peace talks with Iran. The move sent a sharp, if brief, reaction through Bitcoin markets: the leading cryptocurrency touched a low near $70,623 before a partial rebound, after the White House confirmed the blockade in a post that attributed the collapse of talks to Iran’s refusal to halt its nuclear program—the issue President Donald Trump framed as the decisive one.
Initial trading showed Bitcoin slipping about 1.9% to roughly $71,686 as the blockade was announced. Market activity accelerated after U.S. futures opened, with oil surging about 9.5% to $105 per barrel within half an hour and Bitcoin sliding further to the low-$70k range. By the time volatility settled into the day, Bitcoin was down about 2.7% on the session, underscoring how geopolitical shocks can ripple across both energy and crypto markets in tandem.
The flare-up adds to six weeks of disruption tied to the dispute over the Hormuz Strait, a channel that handles roughly one-fifth of global oil trade. The backdrop has been a period of elevated volatility in energy markets, framed by the strategic significance of the strait and the broader tension between the U.S. and Iran.
Amid the pace of headlines, a ceasefire was announced on Tuesday, while Iran pressed for war reparations and the unfreezing of blocked Iranian financial assets. Trump’s public framing focused on Iran’s reluctance to end its nuclear program, with the president contending that the nuclear issue remains the central hurdle to any settlement. He described Iran’s use of minelaying and toll demands as “world extortion,” and asserted that the U.S. Navy would block any vessels paying Iran and would destroy the mines. These statements illustrate how geopolitical risk feeds into the narrative around both traditional assets and crypto as investors weigh safety and hedging considerations.
Key takeaways
- Bitcoin briefly breached the $71k mark and dipped to $70,623 as the U.S. blockade of Hormuz was announced, reflecting immediate risk-off trading in a combustible geopolitical moment.
- Oil surged about 9.5% to $105 per barrel within minutes of market open, underscoring the tight coupling between energy risk and macro sentiment in crypto markets.
- The Hormuz dispute, which governs a significant slice of global energy flows, has kept oil volatility elevated and has fed into wider market anxiety about supply and sanctions risk.
- In the broader crypto narrative, Bitcoin has shown resilience despite the escalation, with some upside momentum forming as markets digest the new risk environment.
- Analysts caution that sanction regimes and the potential for crypto-enabled payments to Iran add a layer of regulatory risk that traders and institutions are watching closely.
Crypto markets in a geopolitically charged environment
Beyond the immediate price moves, the episodes around the Strait of Hormuz highlight a recurring theme for crypto markets: digital assets can react quickly to geopolitical shocks, sometimes displaying a degree of decoupling from traditional risk-on/risk-off cycles, but not immune to macro momentum. The price path this week underscores two interconnected dynamics. First, risk assets—including Bitcoin—tend to pull back when headlines point to intensified sanctions, potential military actions, or disruptions to critical trade corridors. Second, once initial panic subsides, Bitcoin and other crypto markets can reframe the narrative around hedging and diversification, particularly as traders reassess the balance of risk across assets with different sensitivities to sanctions and inflation pressures.
Macroeconomic ripples: oil, sanctions, and the regulatory horizon
Oil’s sharp swing in the wake of the Hormuz developments serves as a reminder of how energy markets act as a live barometer for global risk. When crude prices rally on supply concerns, the relative attractiveness of different hedges—whether traditional assets or crypto—gets re-evaluated in short order. The linked tension between sanctions policy and cross-border financial flows adds another layer of complexity for market participants who rely on transparent, compliant channels for settlement. In this environment, analysts have flagged the possibility that crypto-enabled payments to sanctioned regimes could trigger legal and reputational risks for shippers and financial service providers alike, a point underscored by researchers at Chainalysis in related reporting.
Amid these developments, traders are watching how policymakers, energy markets, and crypto rails interact over the coming weeks. If geopolitical friction persists, Bitcoin’s role as a non-sovereign, borderless asset may attract interest as a digital store of value or as a diversification tool within diversified portfolios. Conversely, tighter sanctions and heightened regulatory scrutiny could constrain some crypto activity in cross-border payments, particularly where authorities intensify monitoring of flows tied to geopolitical flashpoints.
Bitcoin’s ongoing resilience in a shifting risk landscape
Since the late February onset of intensified U.S.-Iran tensions, Bitcoin has traded with periods of recovery, rising about 7.4% to around $71,194 from its earlier levels. This trajectory places the crypto asset in a position to potentially outperform broader risk proxies during episodes of geopolitical stress, a pattern investors have observed at various points since the asset’s ascent into the macro narrative of 2020 and beyond. In the period stretching back to October, Bitcoin had previously peaked near $126,080, illustrating the substantial drawdowns and recoveries that have characterized the asset’s long arc of adoption, volatility, and institutional interest. While the current move is modest by historical standards, it contributes to the longer story of Bitcoin as a sometimes contrarian asset that gigabytes of market data have repeatedly tested against macro shocks and policy shifts.
As the situation unfolds, traders should keep an eye on several moving parts: the tempo of any diplomatic developments, the pace of sanctions enforcement, and energy-market volatility, all of which can feed into crypto price dynamics in meaningful ways. Market participants may also reassess risk premia across asset classes, given the potential for sanctions-related restrictions to influence cross-border flows and settlement mechanics in crypto markets.
In the near term, investors and users should watch how policymakers frame any potential ceasefire or de-escalation signals, whether new sanctions measures emerge, and how traders price the evolving risk premium across oil, equities, and digital assets. The interplay between geopolitics, energy supplies, and crypto rails remains a live topic, with clear implications for liquidity, volatility, and risk management in the weeks ahead.
Readers should stay tuned for updates on any settlement progress, changes to sanctions regimes, and further volatility in oil and crypto markets as the geopolitical landscape around the Strait of Hormuz develops.
The European Central Bank has supported the European Commission’s plan to bring the supervision of major crypto companies under the EU’s financial markets regulator.
The ECB said in an opinion published on Friday that it fully supports bringing oversight of systemically important cross-border capital market companies, such as large trading platforms and crypto companies, under the European Securities and Markets Authority (ESMA).
The central bank said the proposals “constitute an ambitious step towards deeper integration of capital markets and financial market supervision within the Union.”
The opinion is nonbinding, but it will still be a major boost to the plan, which is set to be the most significant overhaul of how the EU will regulate crypto companies since the Markets in Crypto-Assets (MiCA) laws started to come into force in mid-2023.
Under MiCA, crypto-asset service providers, or CASPs, are allowed to operate under the supervision of an EU member country’s regulator to serve the entire bloc, with ESMA setting some standards and guidelines.
That has allowed crypto companies to pick favorable jurisdictions to get licensed, with Kraken setting up its EU arm in Ireland, while Coinbase and Bitstamp chose Luxembourg. Bitpanda set up in Austria, while its EU asset management arm chose to be licensed in Germany.
Some countries, including the popular MiCA licensing hub of Malta, have pushed back against the plan, calling it premature, arguing that the MiCA laws for CASPs only came into force in December 2024.
Related: Centralizing crypto: Why Malta’s clash with ESMA is about more than one small state
The ECB said that “transferring authorisation, monitoring and enforcement powers for all CASPs” from national regulators to ESMA would “ensure supervisory convergence, reduce fragmentation and mitigate cross-border risks in crypto-asset markets, thereby supporting financial stability and the integrity of the single market.”

It noted that banks are increasingly linking with crypto companies by offering crypto services to customers or by servicing crypto companies, which it argued could transmit “shocks into the financial system” from crypto.
The ECB added that the trend underscored “the need for a centralised Union supervisory regime for CASPs, capable of addressing the systemic risks posed by CASPs with significant activities, preventing risk migration into the banking system and safeguarding financial stability.”
The central bank said that ESMA would need to be given sufficient funding and staff if it were to take on the responsibility of directly policing crypto companies.
The plan is likely still months away from becoming law, as EU lawmakers and governments will negotiate the proposal before the European Parliament takes further action.
Magazine: South Korea gets rich from crypto… North Korea gets weapons
US President Donald Trump said Iran did not want to compromise its nuclear weapons program, stating it was the only issue that “really mattered.”
Bitcoin fell as low as $70,623 on Sunday after the US announced a blockade of the Strait of Hormuz following failed peace talks with Iran.
The price of Bitcoin (BTC) initially fell 1.9% to $71,686 after US President Donald Trump confirmed the blockade in a post to Truth Social on Sunday, adding that peace talks collapsed because Iran refused to end its nuclear program — the only issue that “really mattered.”
Bitcoin dipped further to $70,623 as the US futures markets opened late on Sunday, with oil shooting up 9.5% to $105 per barrel within half an hour of the market open, with Bitcoin down 2.7% over the day at the time of writing.
The US-Iran dispute over control of the Strait of Hormuz — which handles one-fifth of global oil trade — has caused significant disruption in the financial markets over the past six weeks, particularly in oil markets, which have experienced their highest volatility since Russia invaded Ukraine in early 2022.

In addition to the ceasefire announced on Tuesday, Iran wanted the US to pay for war reparations and to unfreeze blocked Iranian financial assets.
Trump didn’t directly address those requests in the Truth Social post, instead blaming the fallout on Iran’s reluctance to end its nuclear weapons program.
Related: Paying Iran in crypto could put shippers at sanctions risk: Chainalysis
He also labeled Iran’s use of mines on the waterway and demands for tolls as “world extortion,” ordering the US Navy to block any vessels that paid Iran and to destroy the mines.
Bitcoin up since the US-Iran war began
Despite the conflict, Bitcoin has risen about 7.4% to $71,194 since the US-Iran conflict started on Feb. 28, when a US airstrike killed Iran Supreme Leader Ayatollah Ali Khamenei.
Bitcoin has still managed to outperform the S&P 500 and gold since the US-Iran war started, though, clawing back some lost ground from October when Bitcoin hit a high of $126,080.
Magazine: Should users be allowed to bet on war and death in prediction markets?
Speaking to Cointelegraph, Brahimi noted that 18 months ago most conversations were educational, centered on understanding stablecoins and their risks. Today, firms with board-level approval are preparing to go live. He attributed the shift in part to the EU’s Markets in Crypto-Assets Regulation (MiCA), which replaces a patchwork of national rules with a single bloc-wide framework.
“In the past year and a half, some of Europe’s most stringent financial institutions are converging on a single conclusion: digital assets, including stablecoins, belong inside the existing banking stack, not beside it,” Brahimi said.
Corporate treasury teams are a primary driver of this demand. Initially focused on payments and settlement, firms are now looking to use stablecoins to move funds faster, reduce costs, and operate outside traditional banking hours, Brahimi added.
Related: Bank of France calls for tougher MiCA limits on stablecoin payments
Key takeaways
- MiCA is transforming stablecoin talks into concrete actions, with banks and corporates seeking regulated, on-chain settlement rails rather than ad hoc pilots.
- ClearBank Europe became the first Dutch credit institution to obtain MiCA clearance to operate as a crypto asset service provider, signaling a regulatory green light for regulated custody and related services.
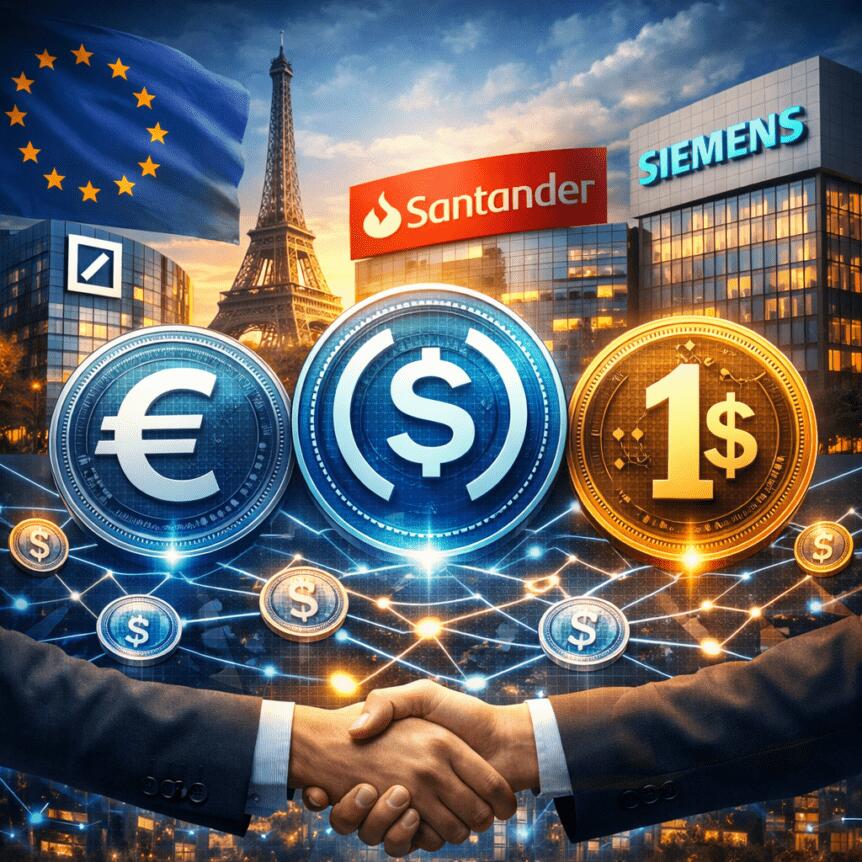
- A consortium including ING, UniCredit, CaixaBank and BBVA is pursuing Qivalis, a MiCA-compliant euro stablecoin designed to enable regulated on-chain payments across Europe.
- European banks are advancing their own euro-stablecoin initiatives, with Societe Generale and Oddo BHF deploying MiCA-compliant offerings for cross-border, on-chain settlement, and cash management.
Retail banks and cross-border rails take shape
In a notable regulatory milestone, ClearBank Europe announced that it had become the first Dutch credit institution to secure MiCA approval to offer crypto asset services. The development underlines how European banks are moving from exploratory dialogues to tangible capabilities that can underpin everyday stablecoin activity.
Beyond this, a broader initiative is taking shape as a consortium of major banks — including ING, UniCredit, CaixaBank and BBVA — advances Qivalis, a MiCA-compliant euro stablecoin intended to support regulated on-chain payments and settlement across the region. The project aims to provide a standardized, compliant rails layer that banks can leverage for cross-border finance and intra-European settlement.
European lenders are also advancing their own stablecoin programs. Societe Generale has positioned its euro-stablecoin strategy around cross-border payments, on-chain settlement, FX and cash management, while Oddo BHF has launched a MiCA-compliant euro stablecoin, signaling a growing comfort with euro-denominated digital assets within traditional banking lines.
Meanwhile, a separate cross-border effort led by a consortium of banks, including ING, UniCredit and BNP Paribas, is planning a Swiss-franc stablecoin for the second half of 2026, signaling continued expansion of multi-currency stablecoin infrastructure within Europe.
Corporate demand shapes the velocity of stablecoins
Paybis, a platform focused on stablecoin trading and fiat on-ramps, has observed rising demand for compatible stablecoins in Europe. Konstantin Vasilenko, Paybis’ co-founder and chief business development officer, noted a marked uptick in stablecoin activity across the EU in late 2025 and early 2026.
Between October 2025 and March 2026, USDC volume on Paybis in the EU rose roughly 109%, and its share of total stablecoin activity increased from about 13% to 32%. Vasilenko highlighted that stablecoin buyer volume in the EU tended to outpace seller volume by roughly five to six times during that period. He also observed that average stablecoin transaction sizes were about 15% to 35% larger than typical BTC or ETH trades, suggesting larger working-capital and settlement use cases rather than mere trading activity.
Forecasts point to a radically higher stablecoin footprint
Industry-wide estimates suggest a rapid expansion in stablecoin activity over the next decade. A Chainalysis report projects that organic growth could push stablecoin transaction volumes to as high as $719 trillion by 2035, up from about $28 trillion in 2025. In a more aggressive scenario, volumes could reach $1.5 quadrillion if stablecoins become a dominant payments infrastructure and wealth transfer accelerates toward crypto-native models.
Will Harborne, CEO of Rhino.fi, a stablecoin infrastructure provider, emphasized that stablecoins are increasingly central to corporate treasury, cross-border settlement, and foreign-exchange activity between euro- and dollar-denominated stablecoins. “I think every business will eventually start accepting and using stablecoins in some form,” he said, adding that early preparation will position companies well as mainstream adoption accelerates.
What this means for the broader market
The regulatory backdrop provided by MiCA is not just a compliance checkbox; it is shaping how financial institutions structure their digital-asset programs. By offering clear, uniform rules, MiCA reduces the friction that previously slowed cross-border stablecoin activity and on-chain settlement for large buyers. The move appears to be aligning traditional finance with the evolving digital-asset ecosystem, turning what began as a technology experiment into a concrete, bank-ready ledger infrastructure.
For investors and builders, the current trajectory suggests uneven but persistent momentum: institutions are coordinating around stablecoins as a core element of treasury operations and payments rails, while the market begins to price in the likelihood of regulated, interoperable euro and Swiss-franc stablecoins becoming commonplace in European settlement flows. The trajectory could be amplified if MiCA-driven infrastructure proves scalable and secure enough to support high-volume, cross-border uses while maintaining compliance with anti-money-laundering and consumer-protection standards.
In the near term, observers will be watching the rollout of Qivalis and related MiCA-compliant euro-stablecoin initiatives for concrete milestones: regulatory approvals, on-chain settlement pilots, and cross-border settlement use cases with real corporate participants. If the European banking sector can translate these initiatives into reliable, cost-saving rails, the region could become a blueprint for stablecoin-enabled finance globally.
Readers should keep an eye on how these regulatory and institutional developments converge with the ongoing evolution of stablecoin market structure, custody solutions, and on-chain infrastructure — especially as more banks begin to treat digital assets as part of the core financial stack rather than a peripheral capability.
Institutional finance has always needed a settlement layer that moves money between organizations. For decades, that layer was correspondent banking: bank-to-bank, one to three days, closed on weekends.
In 2025 alone, stablecoins moved $33 trillion, roughly double Visa’s annual payment volume. JP Morgan settled debt in USDC on Solana. Visa settled $3.5 billion in USDC through US banks.
PayPal launched its own stablecoin across 70 markets. The settlement layer has changed. This piece traces how stablecoin infrastructure replaced it, and who built the rails that institutional finance now depends on.
$10.5 Trillion in One Month, and Institutions are in the Driving Seat
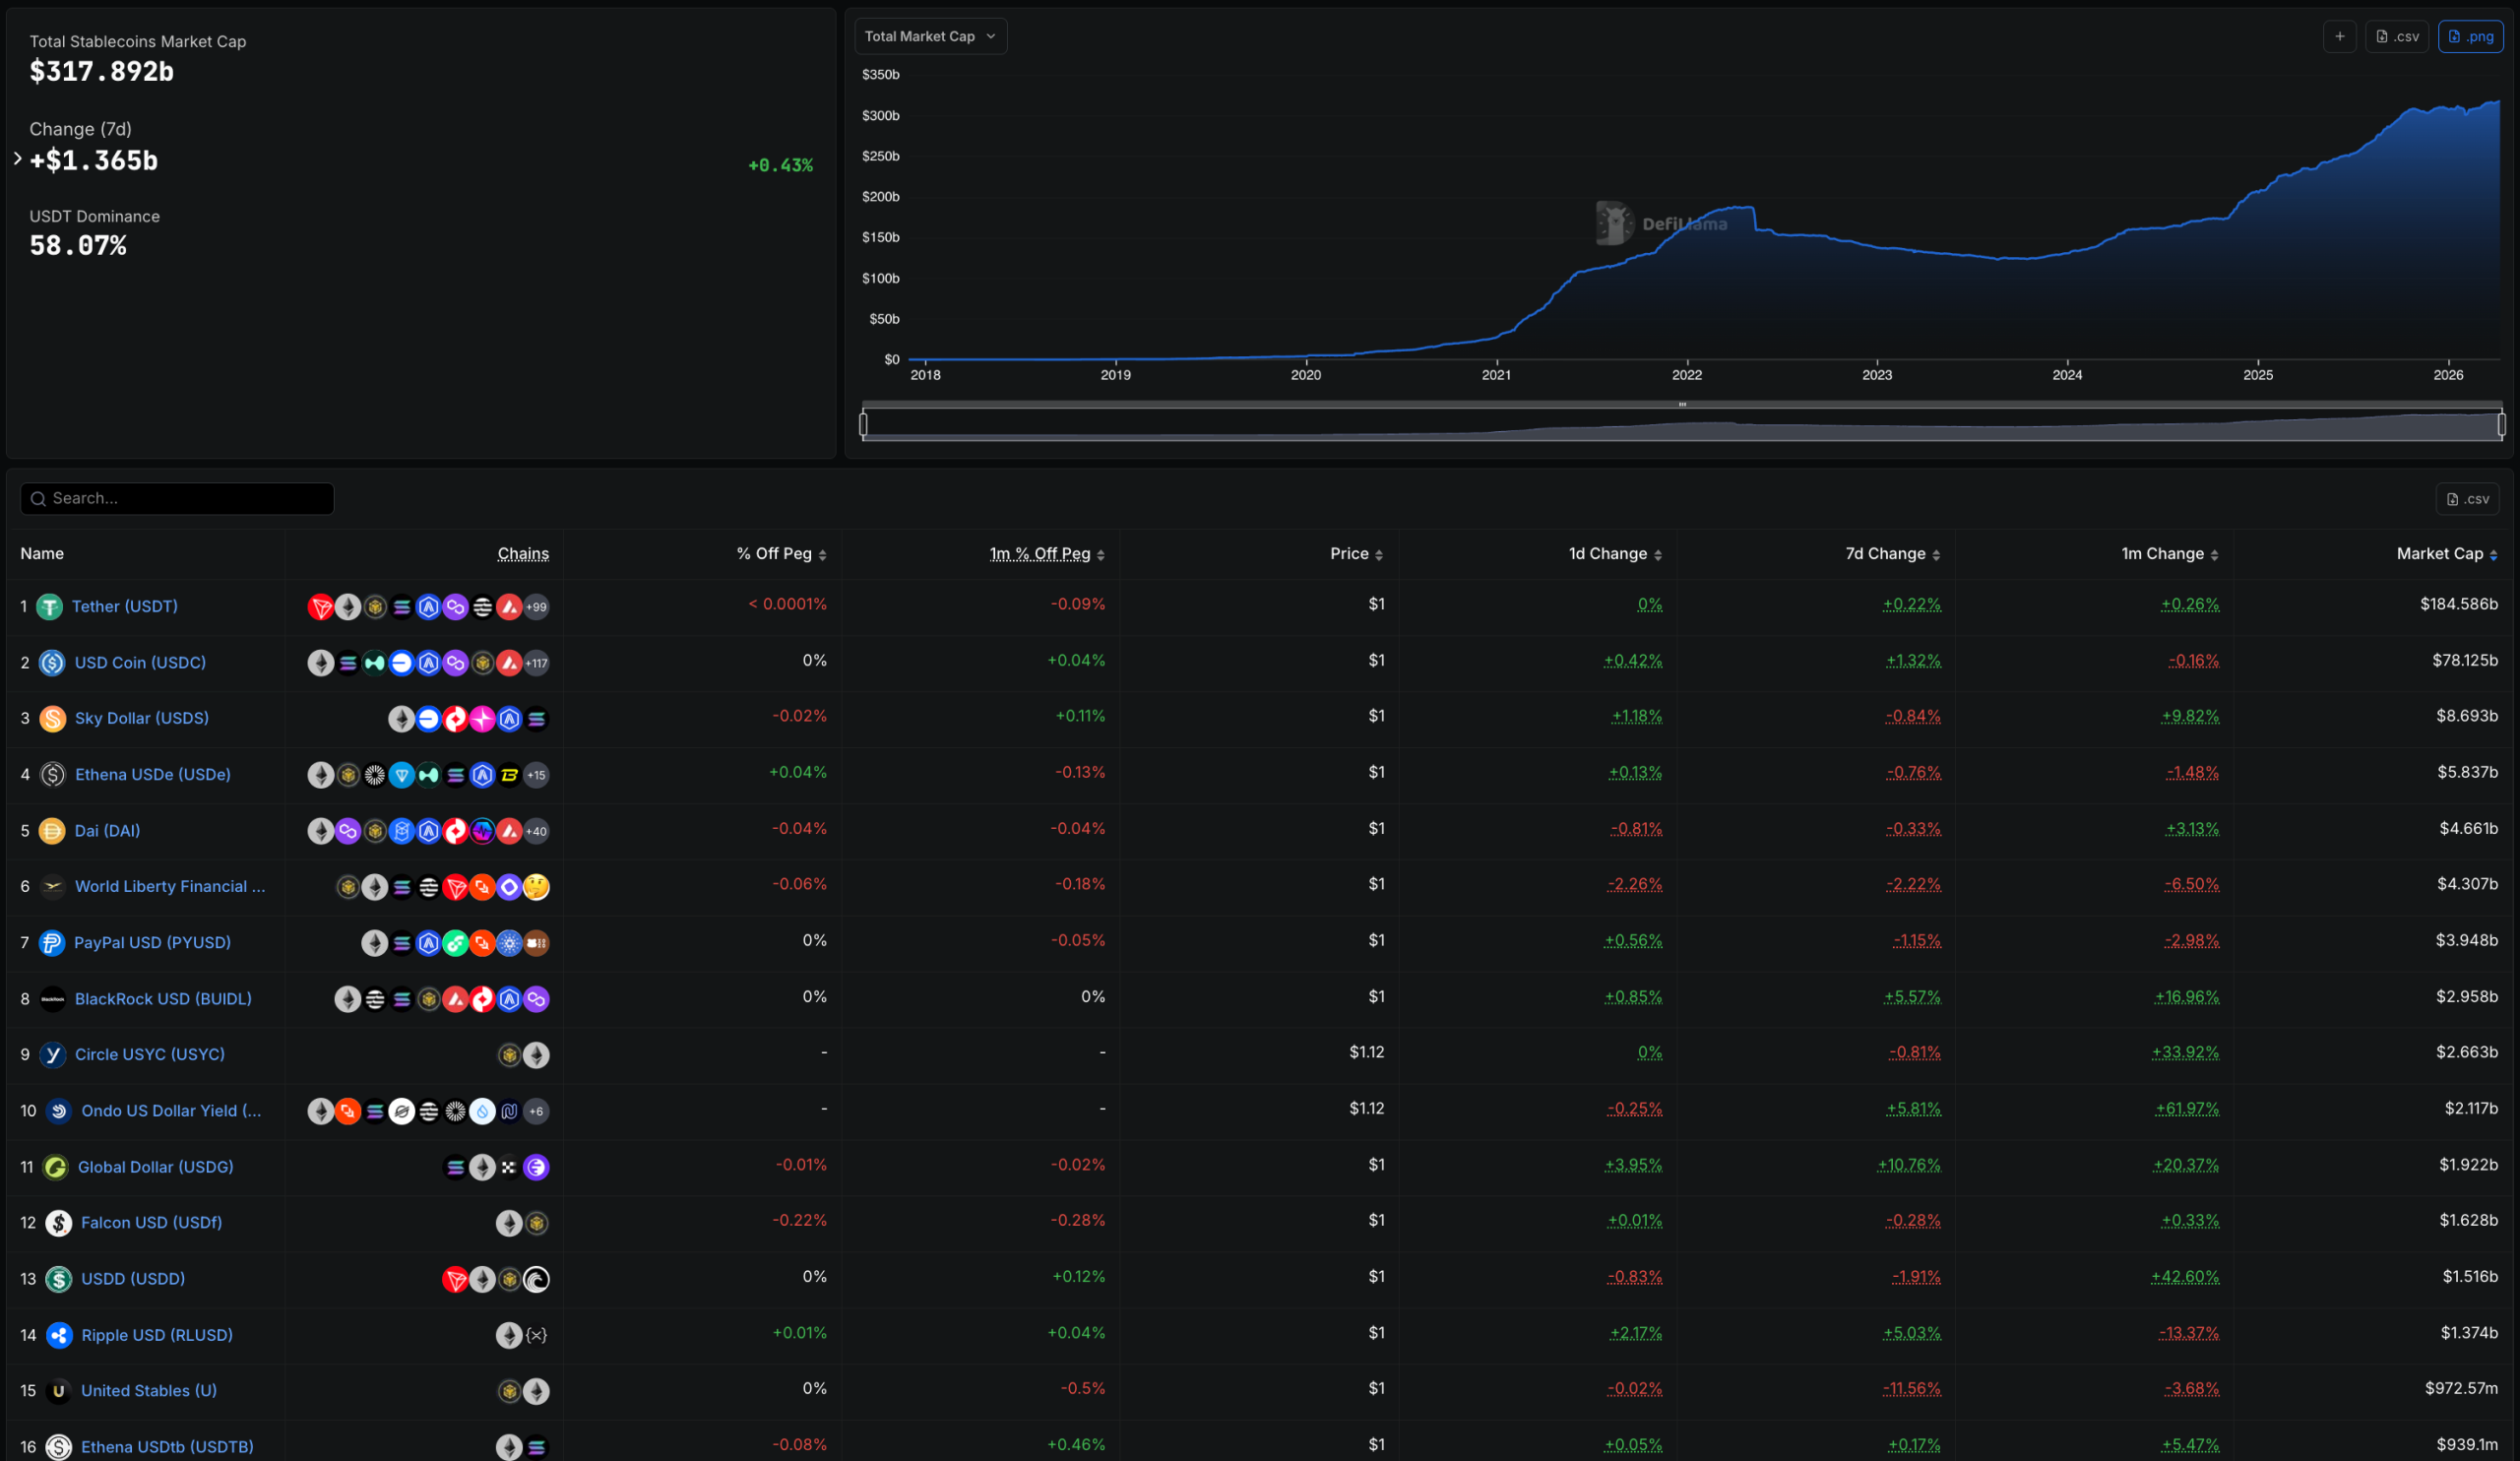
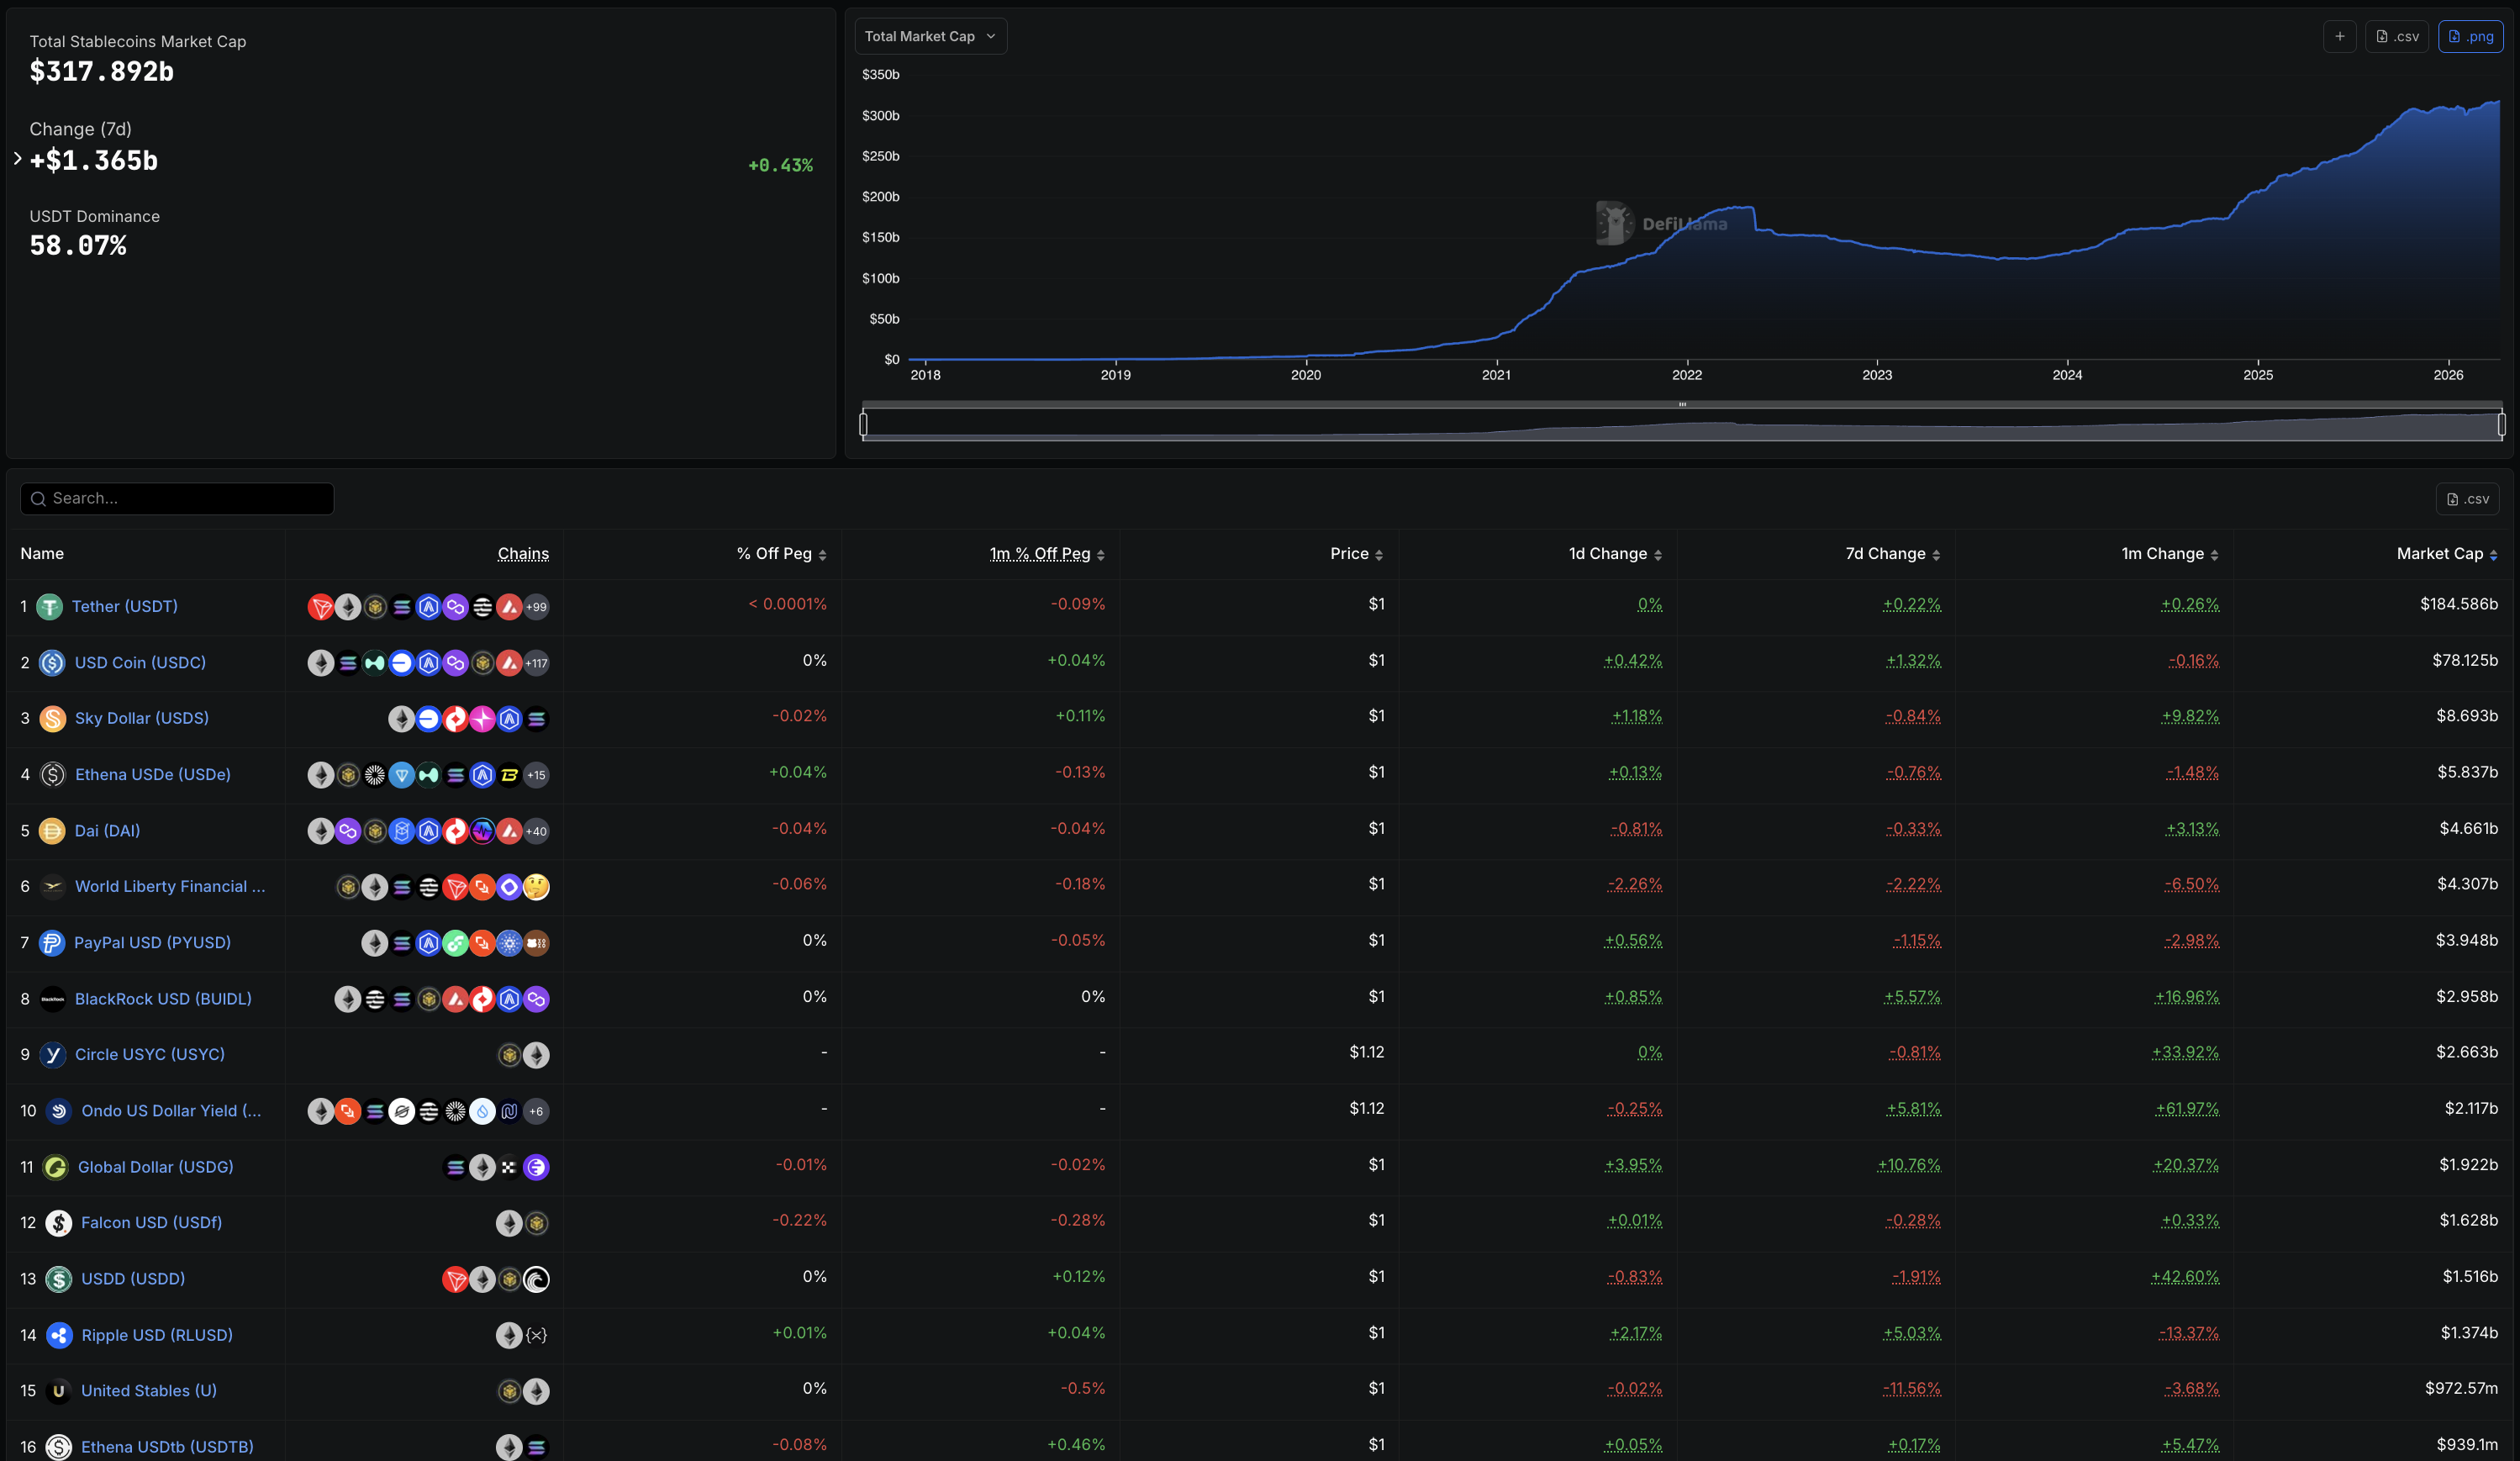
Total stablecoin market cap reached $317.89 billion as of April 2026, up from roughly $125 billion in early 2024.
The GENIUS Act, signed into law in mid-2025, created a federal framework for payment stablecoins, unlocking institutional adoption. The growth since has been vertical.
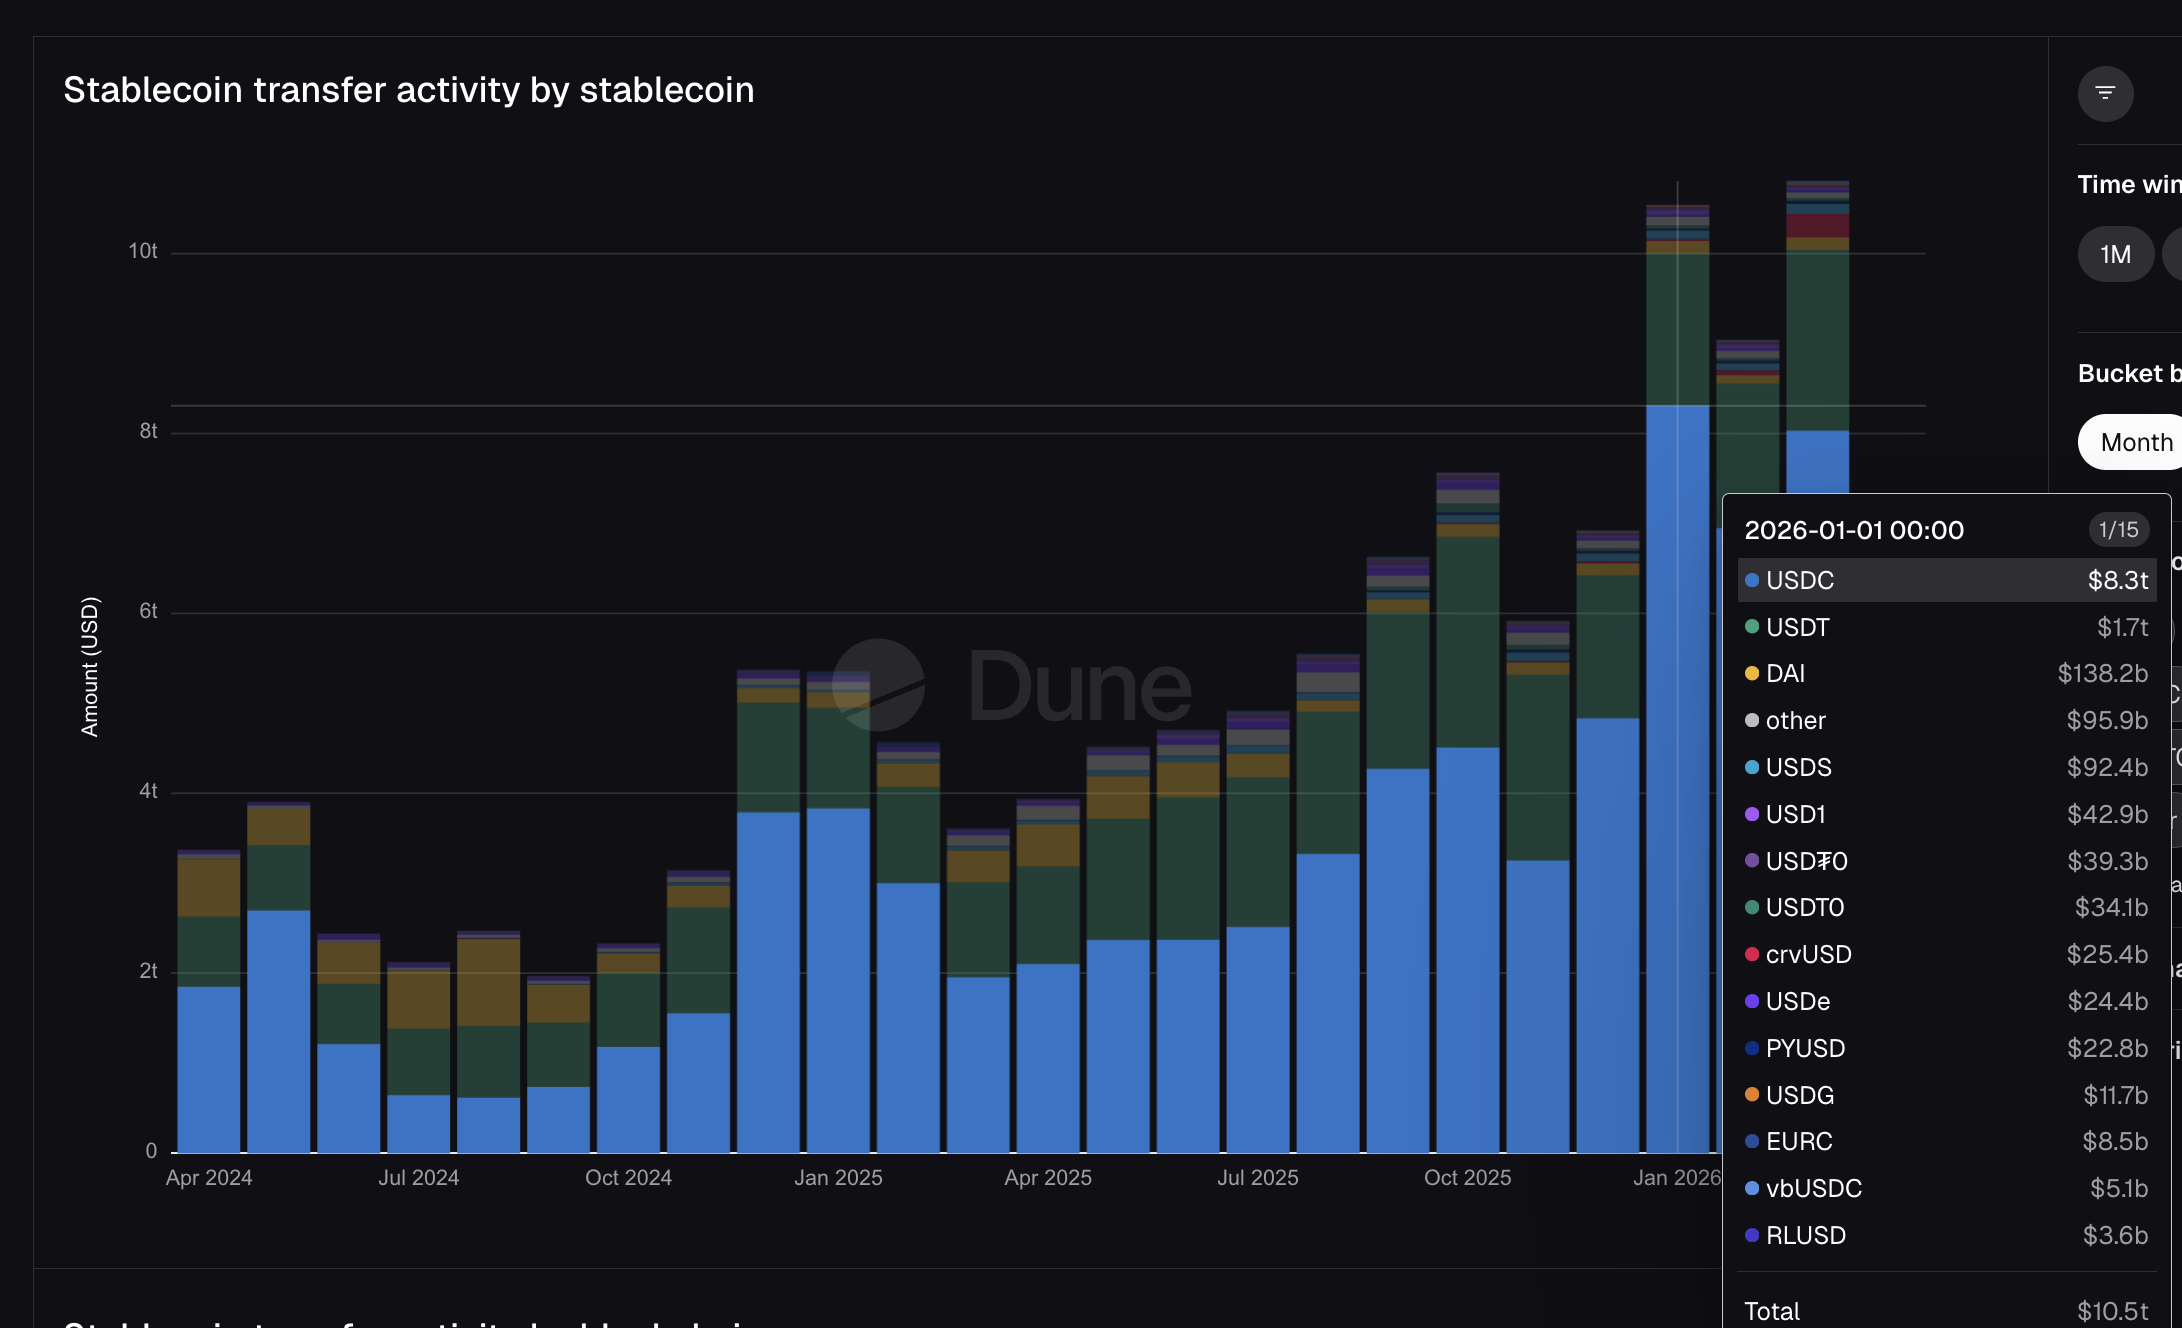
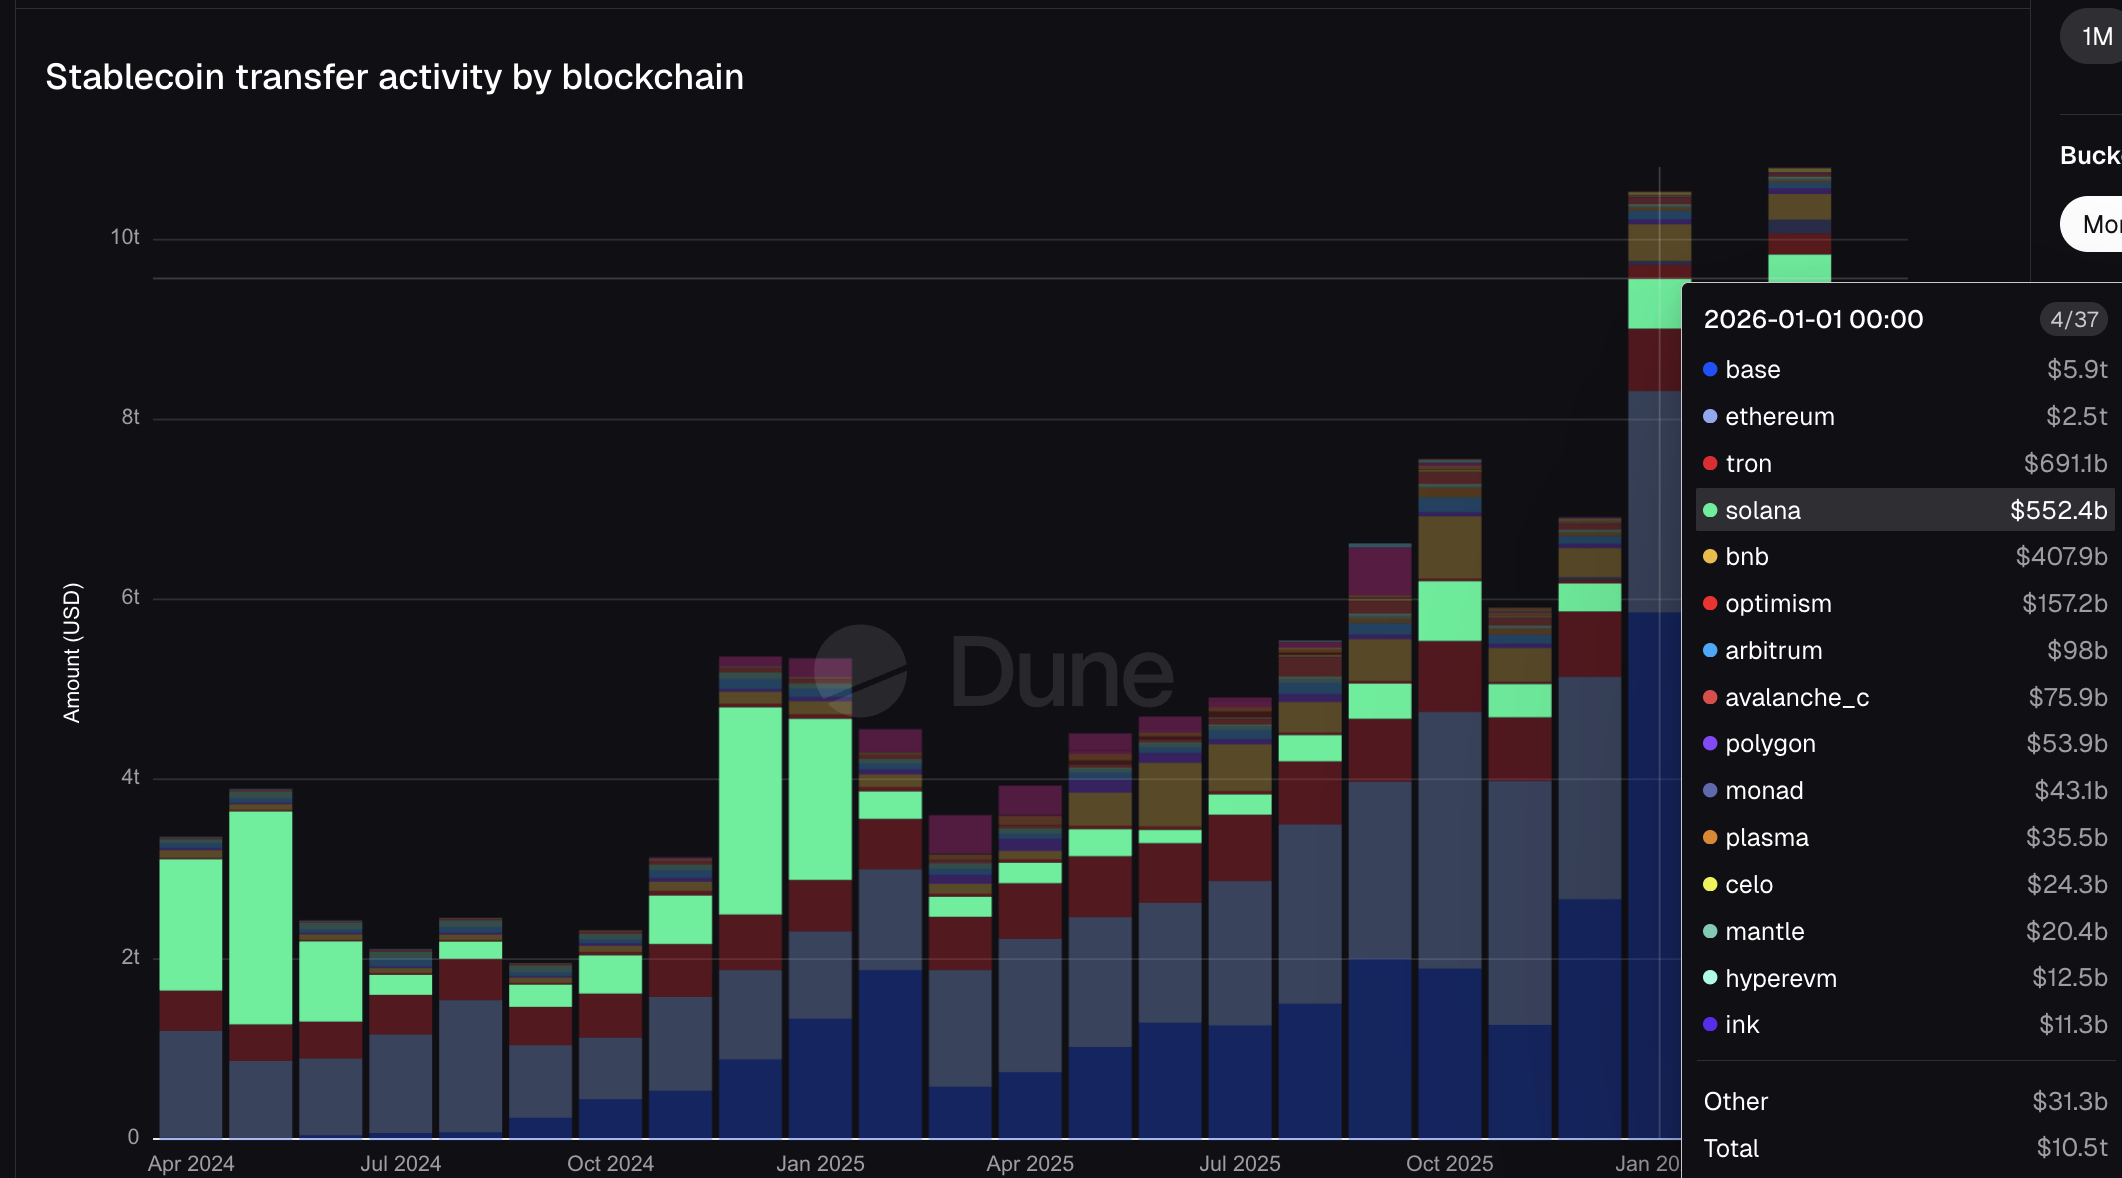
Dune Analytics data shows stablecoins transferred $10.5 trillion in January 2026 alone. For context, Visa processed $16.7 trillion in total fiat payment volume across its entire fiscal year 2025.
Mastercard processed $10.6 trillion in gross dollar volume over the same period. One month of stablecoin transfers on public blockchains approached what Mastercard’s fiat network moved in an entire year.
The DefiLlama leaderboard from earlier clearly tells the institutional story. PayPal’s PYUSD ranks #7, with a supply of $3.95 billion. BlackRock’s BUIDL is #8 at $2.96 billion.
The Mastercard-partnered USDG is #11 at $1.92 billion. These are not crypto-native tokens. These are stablecoins issued by or connected to the largest names in traditional finance, now ranked alongside USDT and USDC.
USDC moved $8.3 trillion of the January total, nearly five times USDT’s $1.7 trillion despite being 2.7 times smaller in supply. USDT dominates holdings. USDC dominates movement.
That distinction matters because USDC is the stablecoin Visa chose for settlement, JP Morgan used for the Galaxy debt deal, and Stripe’s infrastructure runs on. The institutional settlement layer runs primarily on a single token, minted by Circle.
Meanwhile, PayPal’s PYUSD moved $22.8 billion. Mastercard’s USDG moved $11.7 billion. The TradFi stablecoins are now visible on the volume charts, and every one of them traces back to just two minters.
Two Minter, One Rail, and It Bypasses Banks Entirely
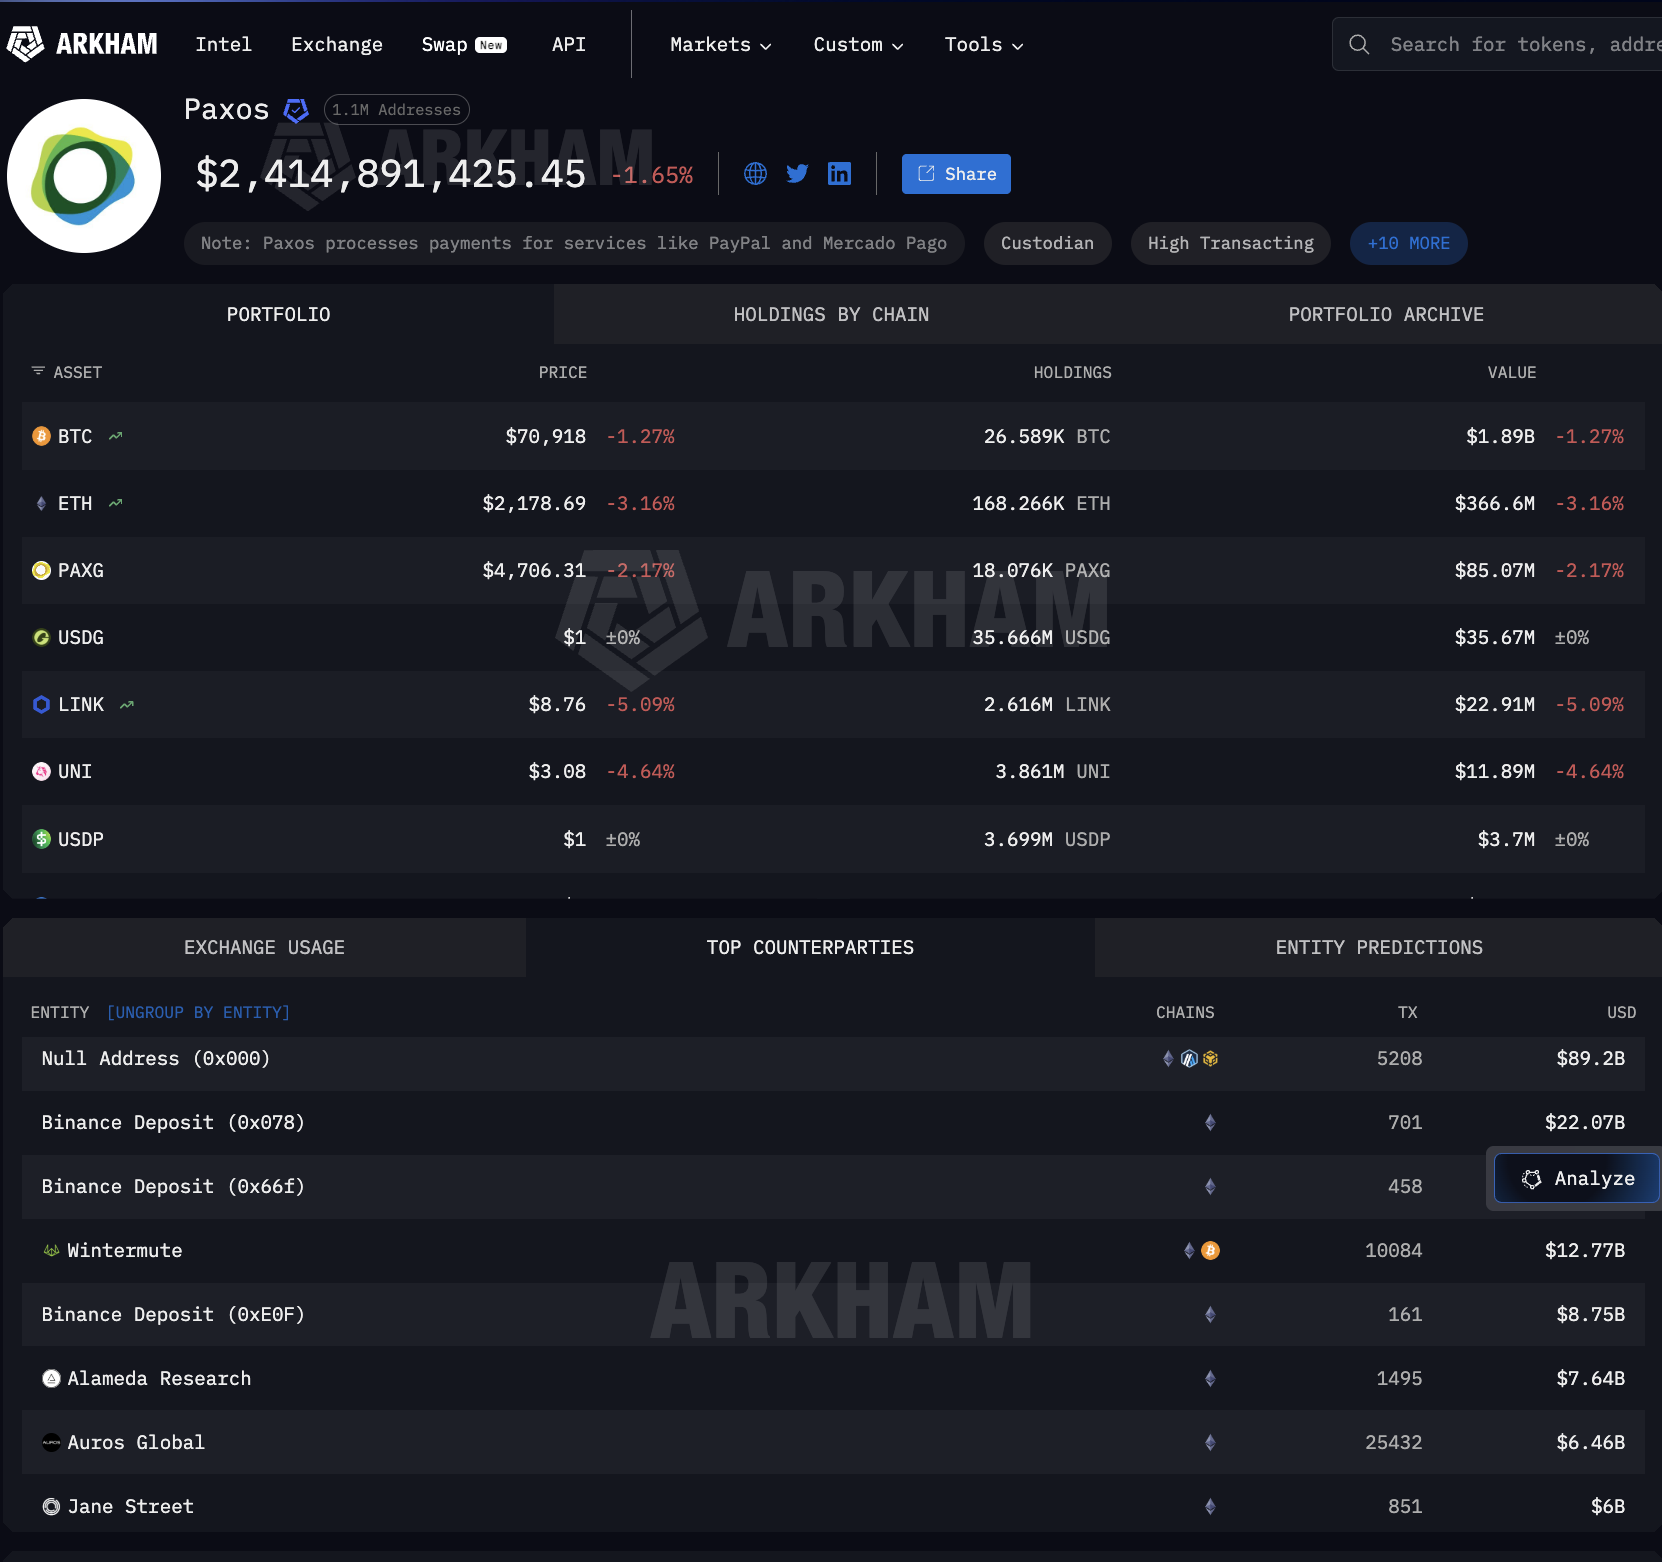
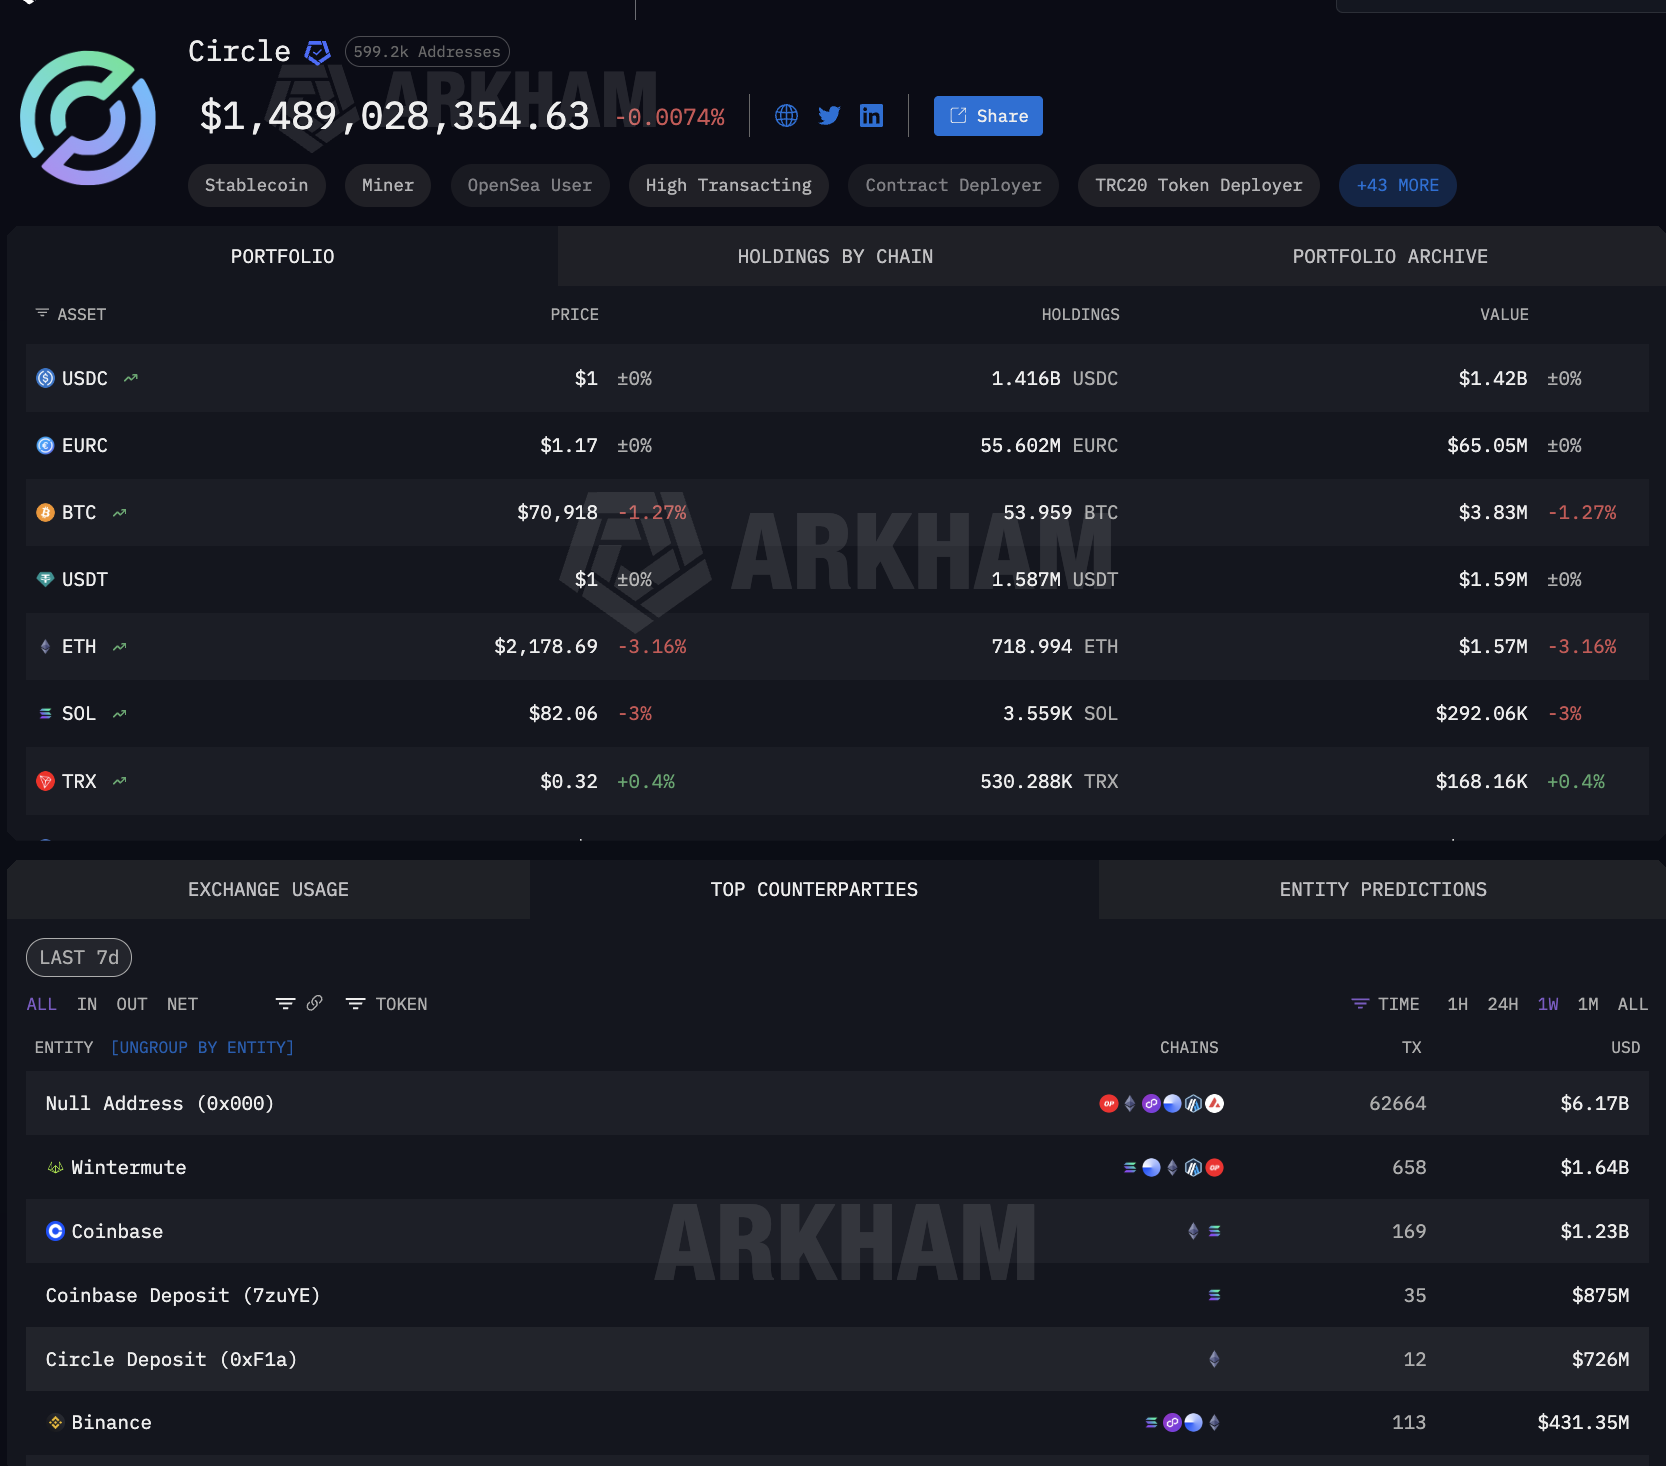
Circle and Paxos are the two minters. Circle mints USDC, the token that moved $8.3 trillion in January. Paxos mints PYUSD for PayPal and USDG for the Global Dollar Network that Mastercard anchors alongside Robinhood, Kraken, and DBS Bank. Between them, every major TradFi stablecoin integration traces back to one of these two entities.
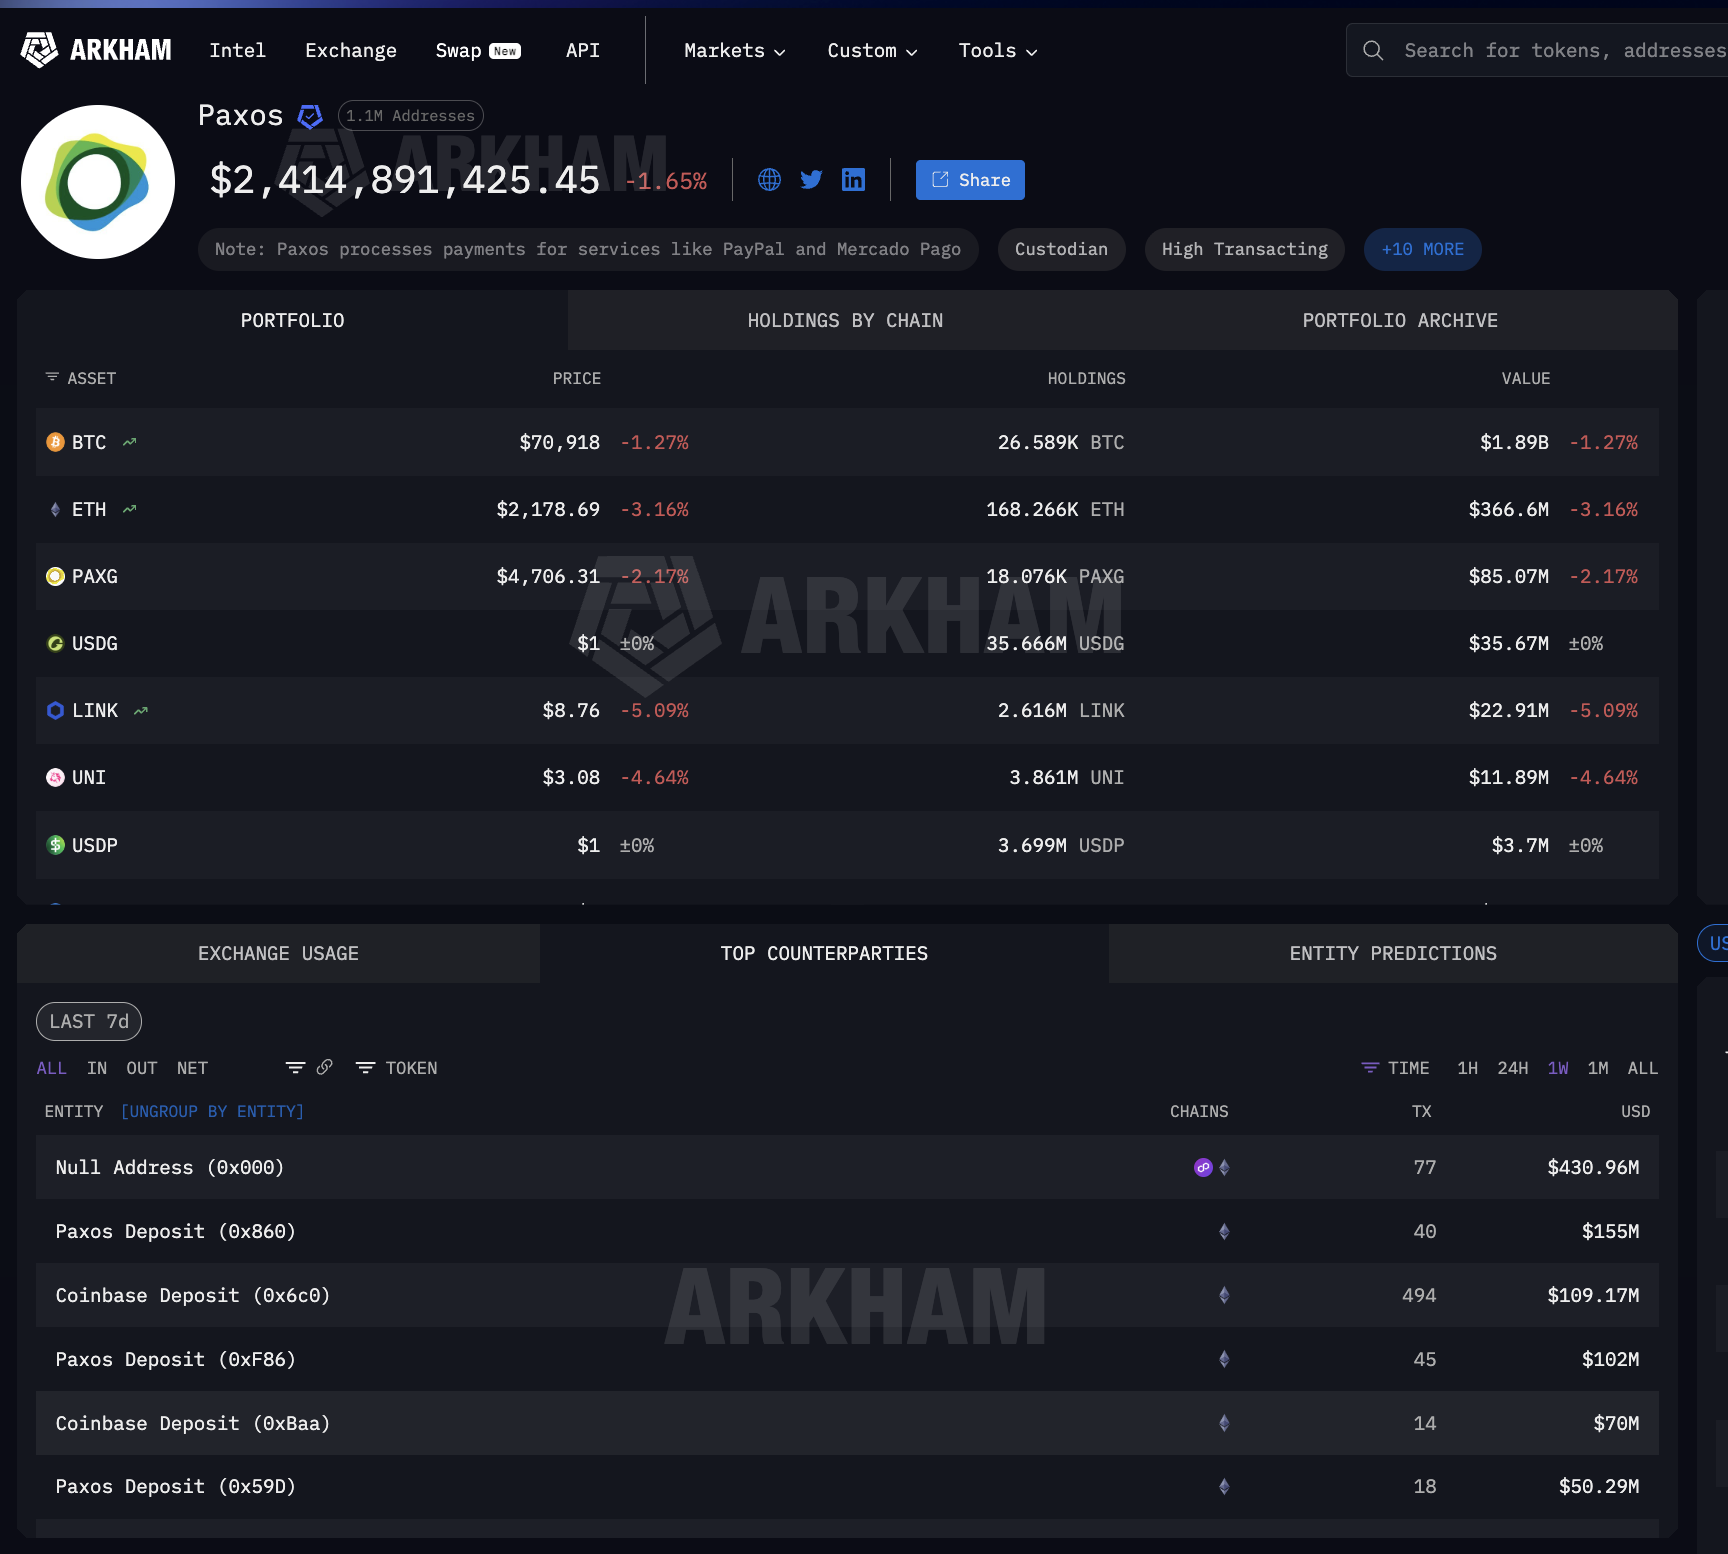
Arkham Intelligence data shows what happens after minting. Paxos has pushed $89.2 billion outward across 5,208 mint-and-burn transactions. The recipients are not banks.
They are Binance ($22 billion), Wintermute ($12.77 billion), Jane Street ($6 billion), Coinbase ($2 billion), and other big names.
These are Wall Street market makers and crypto-native trading desks, not correspondent banking chains.
Circle’s counterparty data shows the same pattern. $6.17 billion in mint and burn activity. Wintermute at $1.64 billion. Coinbase at $2.1 billion combined across multiple deposit addresses.
Coinbase appears as a top counterparty for both minters, the one distributor straddling both sides of the TradFi settlement market.
The Paxos and Circle outflows are dominated by mint and burn operations, the mechanism by which stablecoin issuers create new tokens when clients need them and destroy them on redemption. The scale of the counterparties reveals where institutional settlement sits.
When firms of that size receive billions from Paxos, those funds are freshly minted stablecoins for institutional use, whether to fill a PayPal merchant payout, settle a Mastercard acquirer obligation, or provide liquidity for a Visa banking partner. The stablecoin is created for settlement and redeemed afterward.
That on-demand cycle does not exist in correspondent banking. That is how stablecoin infrastructure became the settlement rail. But where do those stablecoins sit between minting and burning?
Between Minting and Burning, Stablecoin Infrastructure Relies on Crypto Custody
As a result, the stablecoin infrastructure serving institutional finance does not just depend on who mints the tokens. It also depends on where they sit between creation and redemption. USDC is used by millions, making it difficult to attribute specific holdings to institutional settlement.
USDG, however, is different. It exists for one purpose: the Global Dollar Network that Mastercard, Robinhood, Kraken, and DBS Bank anchor. Consequently, every large USDG holder is directly tied to that institutional network.
Arkham data on USDG reveals where institutional stablecoins actually sit. The largest single holder is Fireblocks Custody at $150 million, representing 8.97% of the total supply.
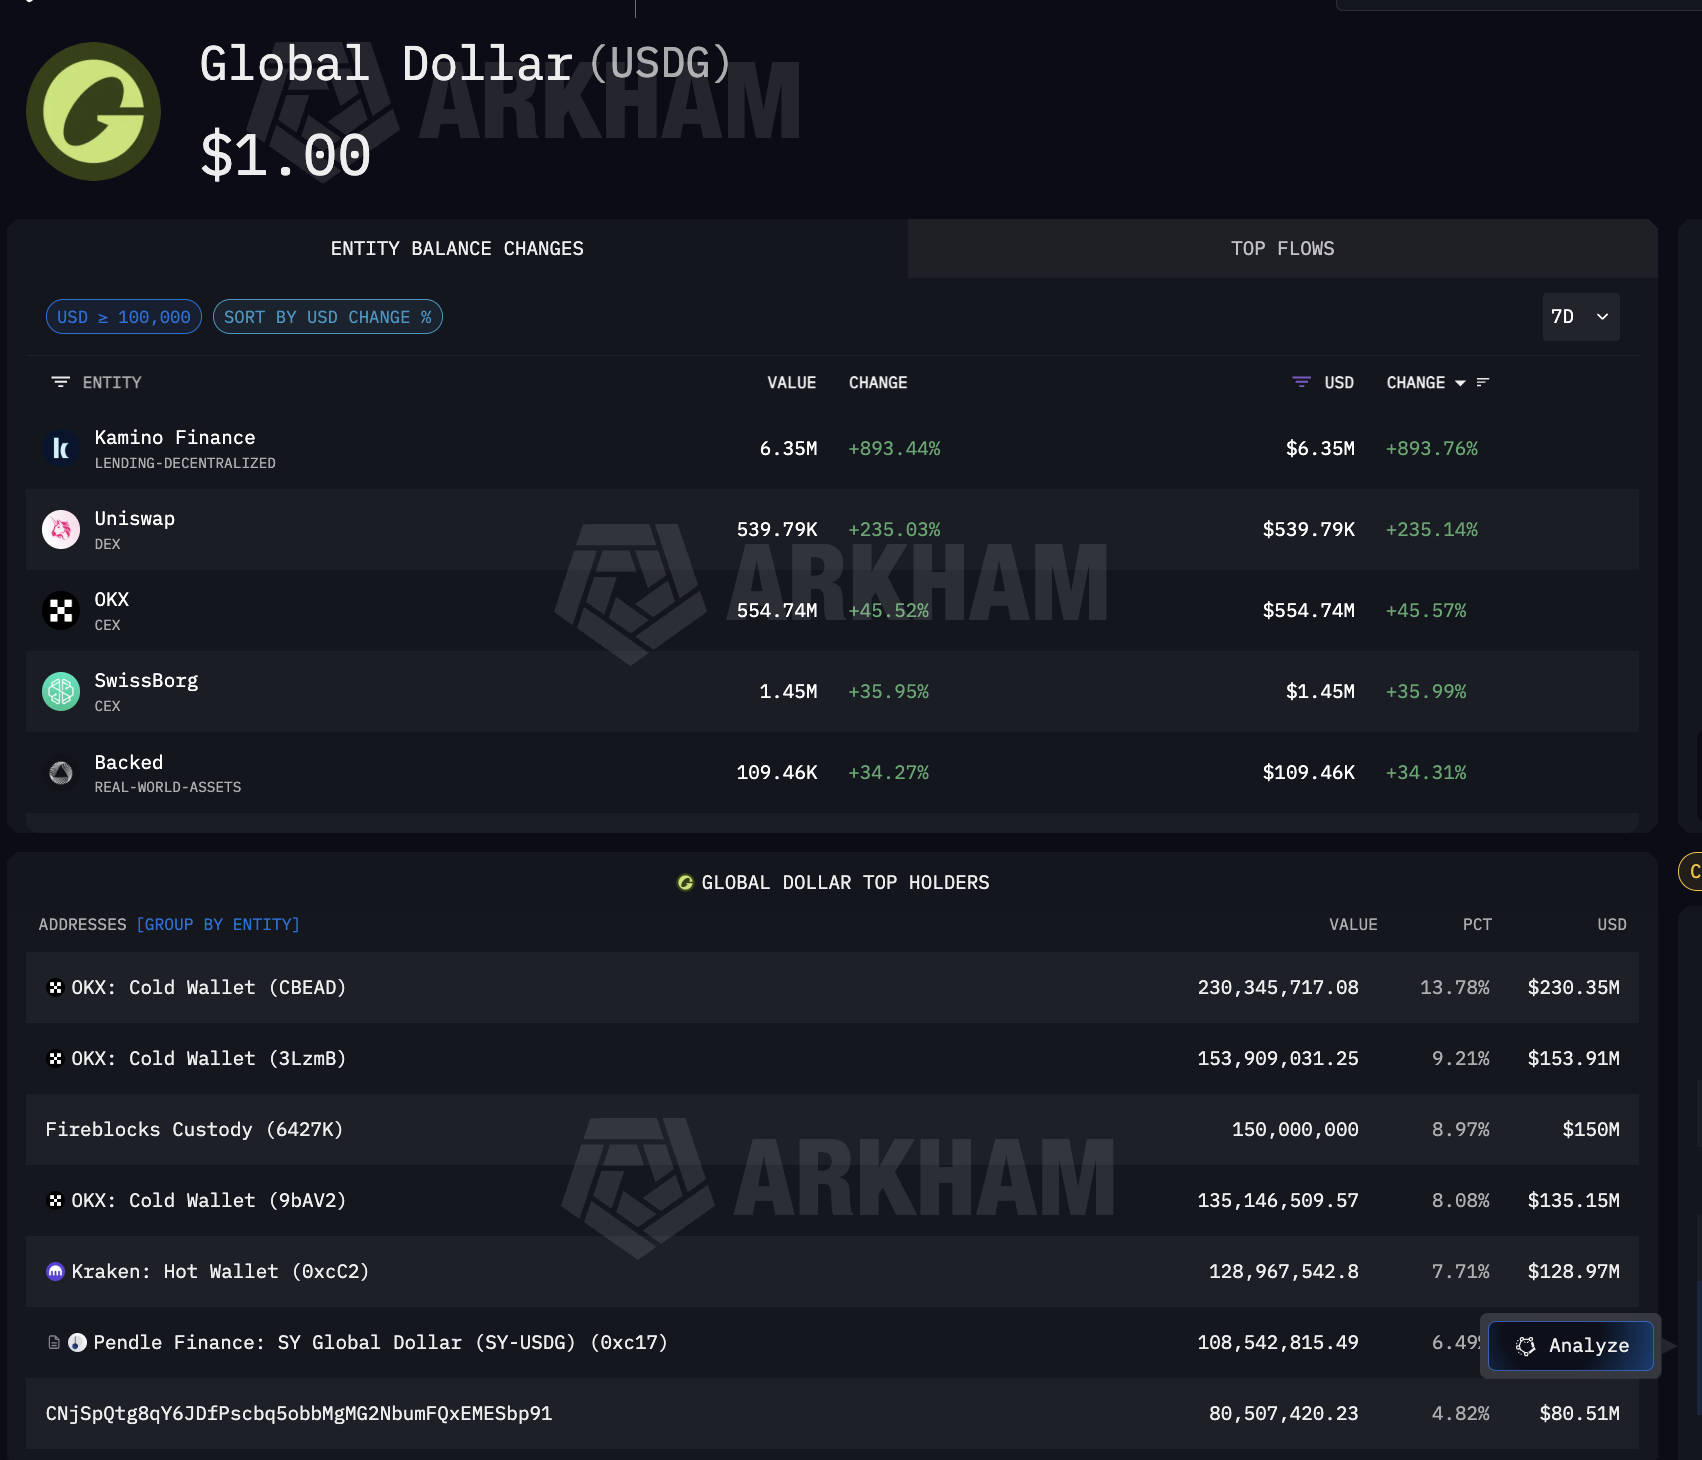
Alongside Fireblocks, OKX holds $519 million across three cold wallets, while Kraken, a named Global Dollar Network partner, holds $128.97 million. Pendle Finance also holds, indicating that USDG is flowing into DeFi yield strategies.
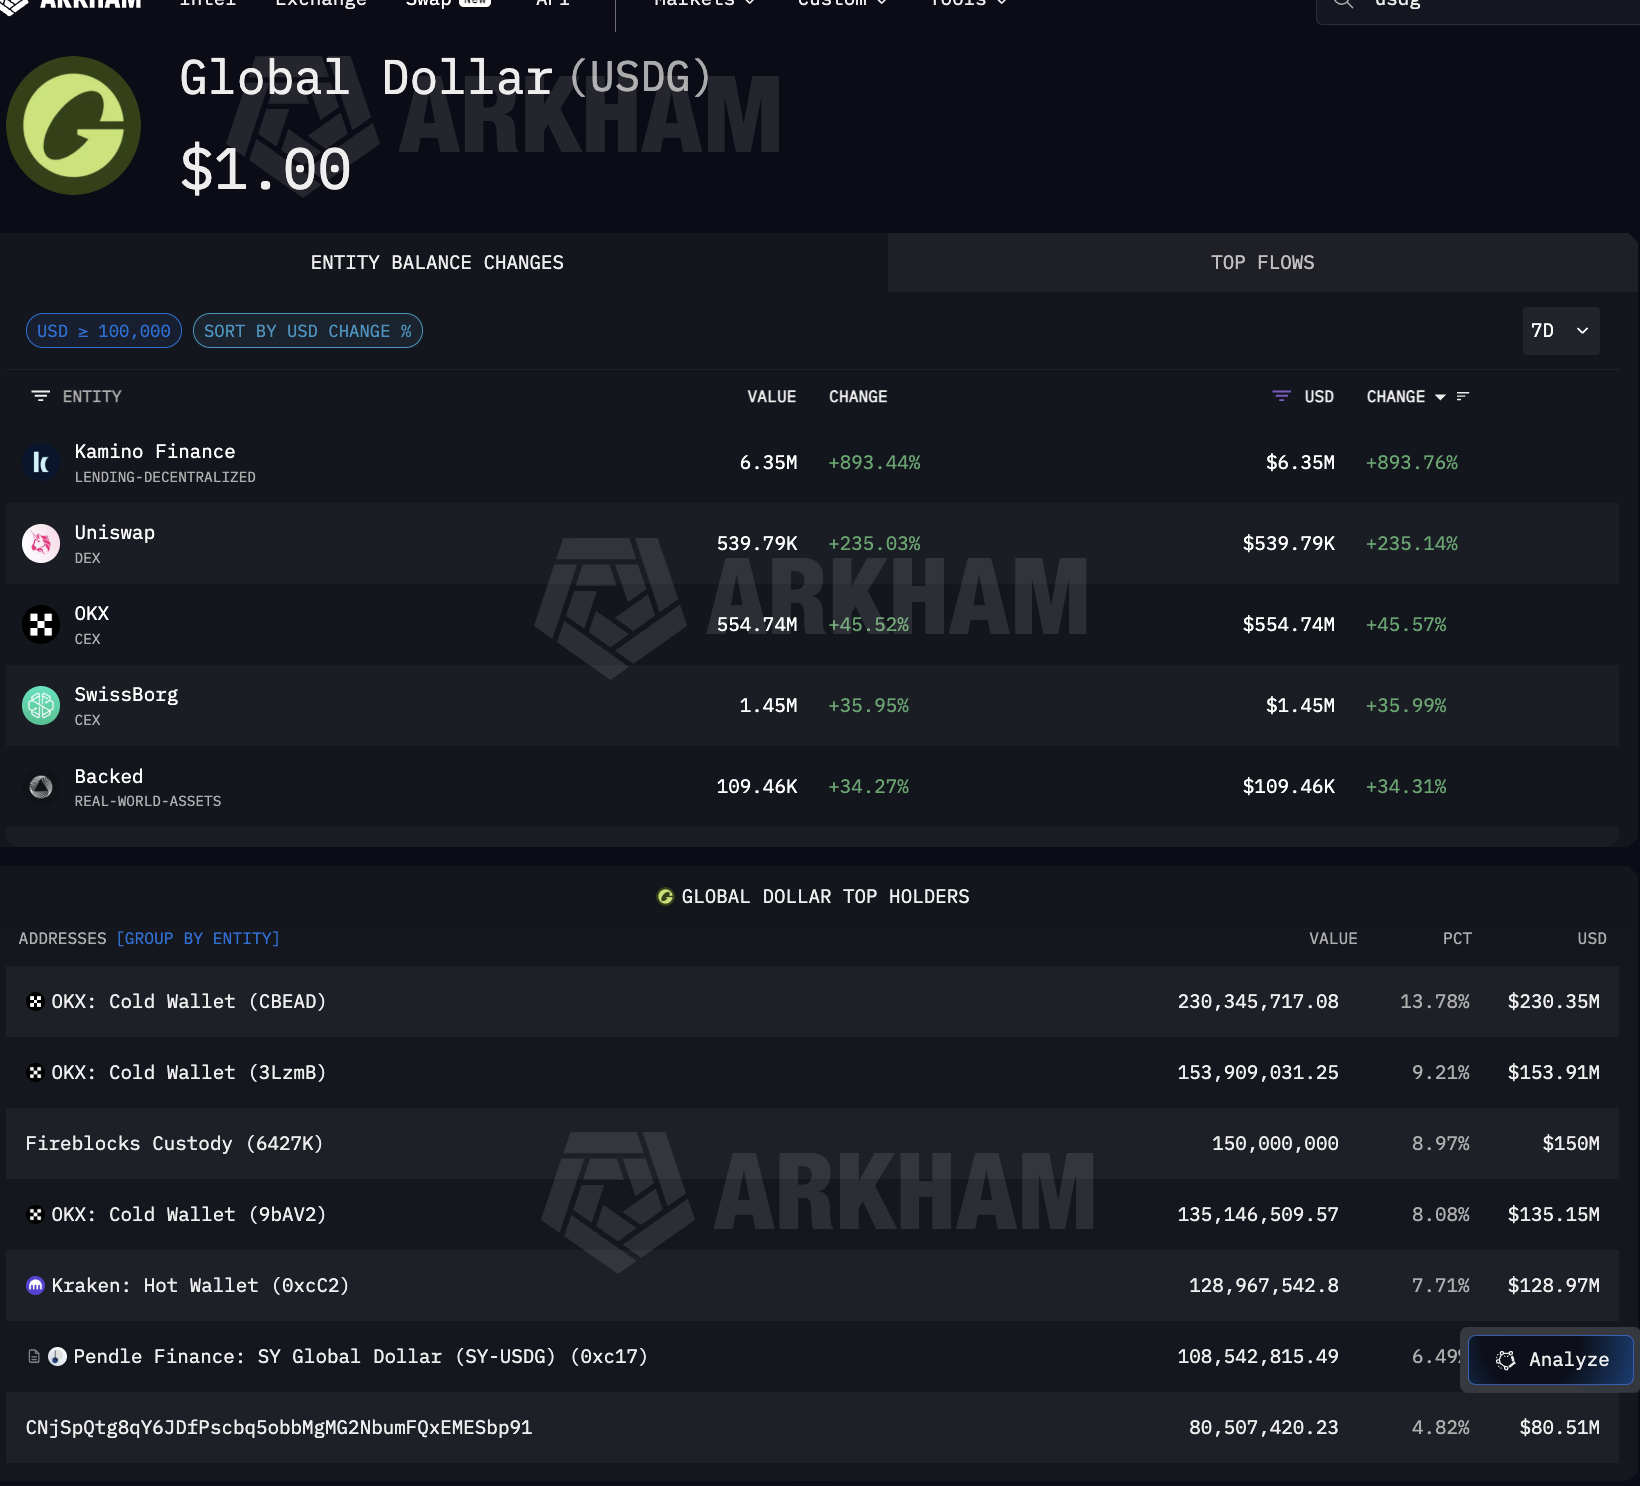
What makes Fireblocks significant is that it also serves as the custody layer banks use for USDC operations, including on Solana, where Visa settles. In other words, one custody provider sits at the intersection of both the Mastercard settlement rail through USDG and the Visa settlement rail through USDC.
The full stablecoin infrastructure path is now visible.
Circle and Paxos mint. Coinbase, Wintermute, and Jane Street distribute. Fireblocks and exchange cold wallets hold. The reach extends beyond card networks.
Arkham’s Paxos entity page confirms that Paxos also processes payments for Mercado Pago, the largest fintech platform in Latin America, meaning the same minting infrastructure serving Mastercard and PayPal also serves emerging market settlement.
At every step between minting and redemption, institutional finance depends on the same concentrated set of crypto stablecoin infrastructure providers.
Four TradFi Strategies, Same Stablecoin Infrastructure Underneath
With the settlement stack mapped, the question becomes how institutional finance is actually connected to it. Each major player chose a different strategy. All of them plugged into the same underlying stablecoin infrastructure.
Visa committed the hardest. As of December 2025, it settled $3.5 billion annualized in USDC on Solana through Cross River Bank and Lead Bank.
It expanded to four stablecoins across four chains: USDC, PYUSD, USDG, and EURC on Solana, Ethereum, Stellar, and Avalanche. Stablecoin-linked cards via Stripe’s Bridge are live in 18 countries, expanding to 100+.
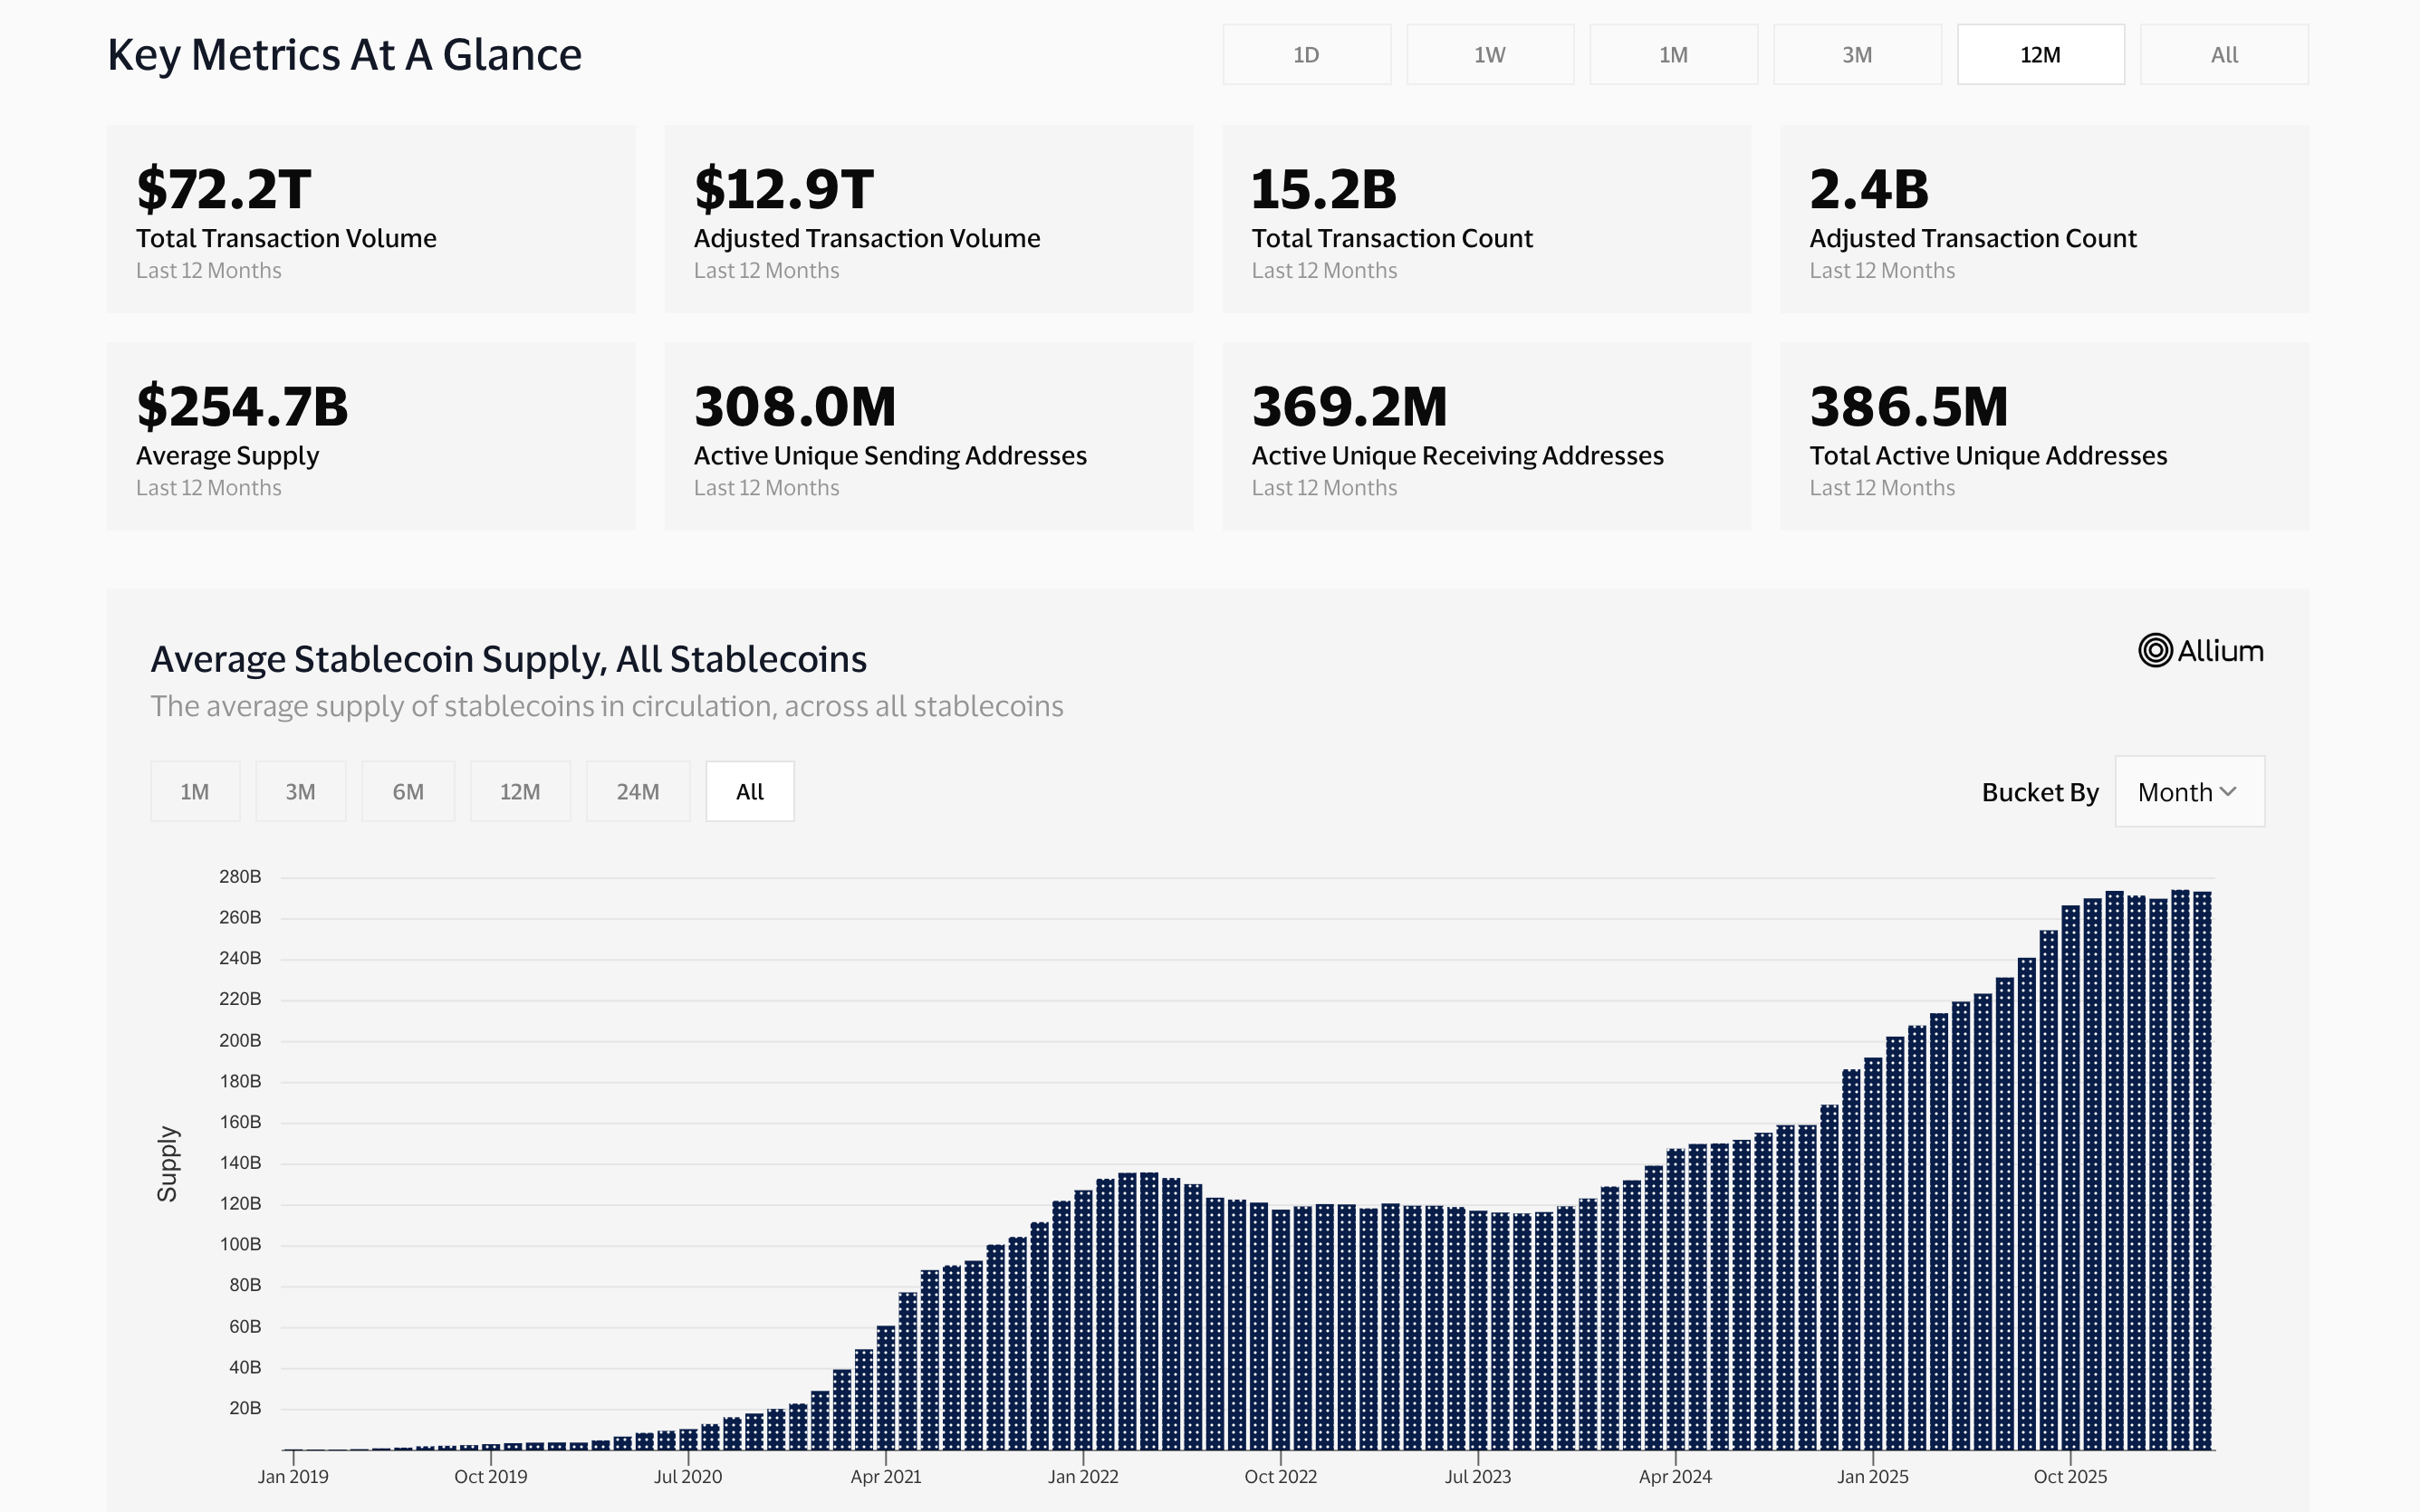
Visa also built its own on-chain analytics dashboard with Allium Labs, tracking $12.9 trillion in adjusted stablecoin volume and treating on-chain data as core business intelligence.
And Solana carried $552 billion in stablecoin transfers in January 2026 alone (top 4), the same chain on which both Visa and PayPal’s PYUSD settle.
Mastercard hedged instead, enabling four stablecoins across its network: USDC, PYUSD, USDG, and FIUSD. It joined the Paxos Global Dollar Network for USDG, the same stablecoin held by Fireblocks Custody at $150 million, as shown earlier.
Stripe acquired the infrastructure directly, buying Bridge for $1.1 billion. Bridge now powers both the Visa stablecoin-linked cards and Stripe’s own stablecoin financial accounts across 101 countries, running on the same USDC that Circle mints.
PayPal built its own stablecoin. PYUSD, minted by Paxos, reached $3.95 billion in supply across 70 markets (per DeFiLlama data).
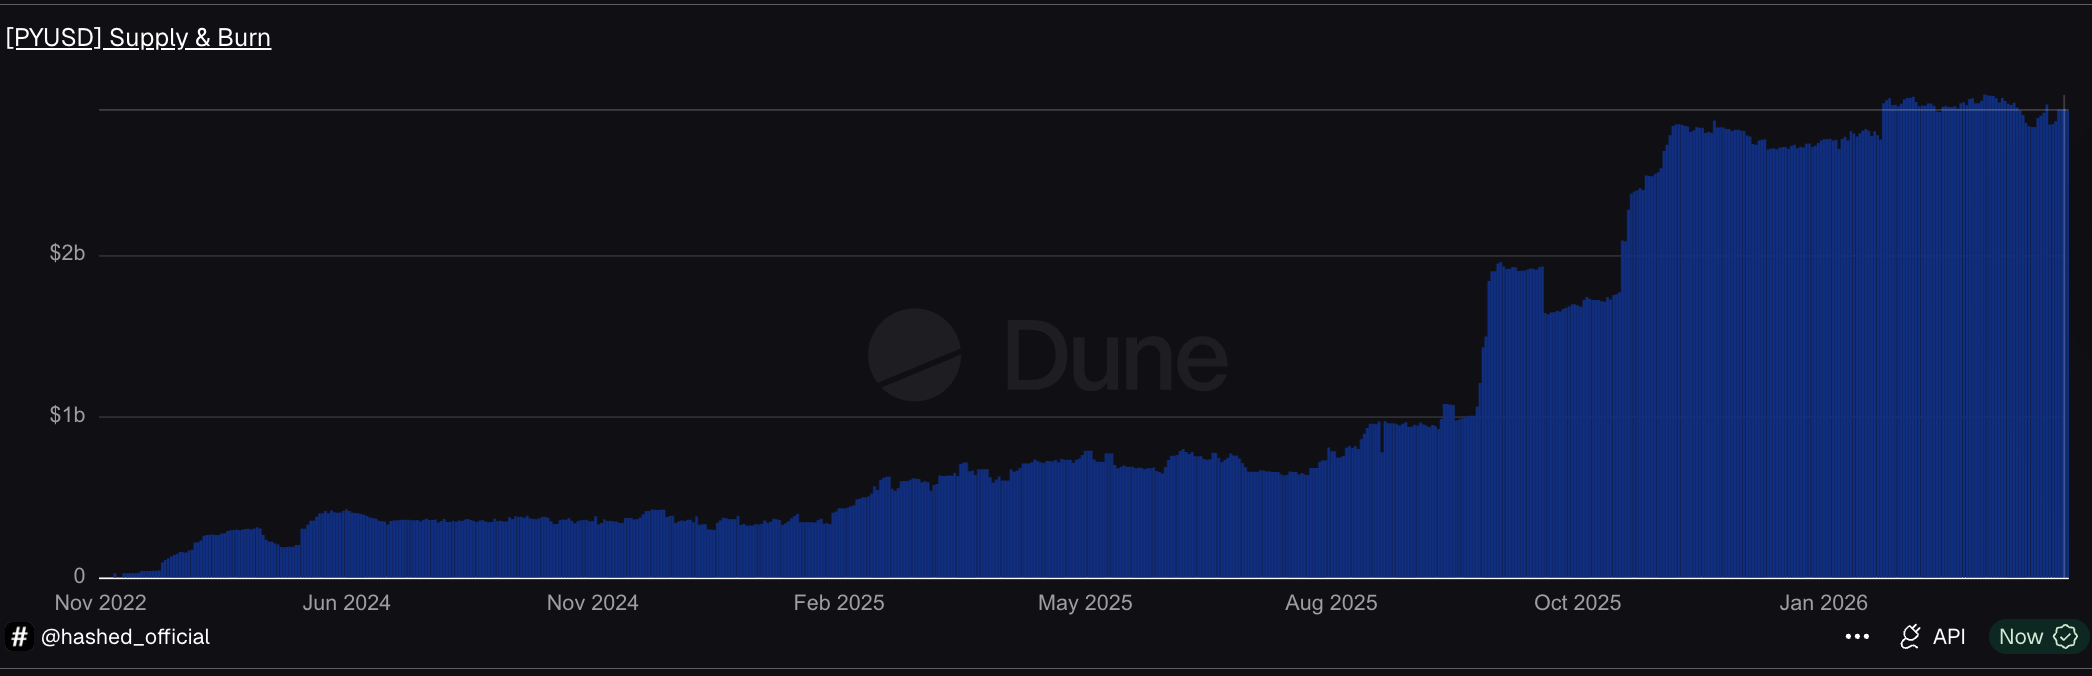
On Solana, PYUSD circulates at 0.6x daily velocity, four times its Ethereum rate, concentrating on the same chain that Visa chose.
Four strategies. Same stablecoin infrastructure underneath: Circle or Paxos minting, Coinbase distributing, and Fireblocks holding. But everything needs to be linked better.
The Stablecoin Infrastructure Stack That Now Settles Institutional Finance
The evidence across this piece converges into a clear answer. Stablecoin infrastructure became the settlement layer for institutional finance, not because institutions adopted crypto. It became one because a small number of providers built pipes that were faster, cheaper, and available 24/7, and every major institution plugged in rather than building its own.
The stack has four layers, each of which is concentrated.
At the supply layer, Circle and Paxos mint the stablecoins that institutional finance depends on. Circle’s USDC moved $8.3 trillion in a single month. Paxos mints for PayPal, Mastercard, and Mercado Pago through the same entity.
At the distribution layer, Arkham data shows both minters routing stablecoins through the same counterparties: Coinbase and Wintermute. The settlement rail bypasses correspondent banks entirely.
At the custody layer, Fireblocks holds $150 million in USDG as the largest single holder, while also receiving USDC on Solana, straddling both card network settlement rails through a single custody provider.
At the integration layer, Visa settles $3.5 billion annually and monitors stablecoin flows as core business intelligence. Mastercard enabled four stablecoins. Stripe bought Bridge for $1.1 billion. PayPal launched PYUSD across 70 markets. JP Morgan settled debt in USDC on Solana. None built new rails.
This mirrors the pattern from our previous analysis of institutional crypto custody, where seven entities across four layers control where crypto sits.
Here, a similar concentration controls how institutional money moves. Different function, same structural conclusion: institutional finance is scaling on stablecoin infrastructure built by a handful of providers. The rails exist. The question now is whether the next wave of adoption diversifies that dependency or deepens it.
The post Who Really Runs Stablecoin Settlement? A Structural Analysis appeared first on BeInCrypto.

5 Key Facts on Explosive Feud Over Iran War and Hormuz Blockade

See the HBO Show’s Stars Then and Now
Malachy O’Rourke issues Darragh Canavan and Brian Kennedy injury update and responses to Tyrone criticism


-

 Politics2 days ago
US brings back mandatory military draft registration
-

 Fashion2 days ago
Weekend Open Thread: Veronica Beard
-
 Sports2 days ago
Man United discover Nico Schlotterbeck transfer fee as defender reaches Dortmund agreement
-

 Tech5 days ago
How Long Can You Drive With Expired Registration? What Florida Law Says
-

 Politics14 hours ago
World Cup exit makes Italy enter crisis mode
-

 Crypto World4 days ago
Canary Capital Files SEC Registration for PEPE ETF
-

 Fashion7 days ago
Massimo Dutti Offers Inspiration for Your Summer Mood Board
-

 Business2 days ago
Tesla Model Y Tops China Auto Sales in March 2026 With 39,827 Registrations, Beating Cheaper EVs and Gas Cars
-

 Fashion5 days ago
Let’s Discuss: DEI in 2026
-

 Crypto World5 days ago
Bitcoin recovers as US and Iran Agree a Ceasefire Deal
-

 Politics3 days ago
Malcolm In The Middle OG Turned Down ‘Buckets Of Money’ To Appear In Reboot
-
 NewsBeat6 hours ago
Pep Guardiola and Gary Neville agree over Arsenal title problem that benefits Man City
-

 Business3 days ago
OpenAI Halts Stargate UK Data Centre Project Over Energy Costs and Copyright Row
-

 Business2 days ago
Ireland Fuel Protests Enter Day 5 as Blockades Spark Shortages and Government Prepares Support Package
-

 Tech7 days ago
Italian court says Netflix must refund customers up to $576 over price hikes
-

 Tech7 days ago
Haier is betting big that your next TV purchase will be one of these
-

 Tech7 days ago
Gamer Restores the Original PlayStation Portal From Two Decades Ago
-

 Tech7 days ago
The Xiaomi 17 Ultra has some impressive add-ons that make snapping photos really fun
-

 Tech7 days ago
Samsung just gave up on its own Messages app
-

 Tech7 days ago
Save $130 on the Samsung Galaxy Watch 8 Classic: rotating bezel, sleep coaching, and running coach for $369
You must be logged in to post a comment Login