
Crypto World
Solana and XRP price prediction ahead of U.S. employment report for February

Solana and XRP are holding key technical levels as traders prepare for the release of the February U.S. employment report, a major macro event that could influence risk sentiment across financial markets, including cryptocurrencies.
Summary
- Solana and XRP traders are watching the February U.S. employment report, a key indicator that could shape expectations for Federal Reserve policy and risk appetite.
- SOL is stabilizing near $91 with accumulation indicators improving, suggesting buyers are gradually returning after February’s sell-off.
- XRP is trading around $1.42, with momentum indicators pointing to weakening bearish pressure and a potential move toward resistance if macro conditions turn favorable.
Investors closely watch the U.S. nonfarm payrolls report because strong labor market data could reinforce expectations that the Federal Reserve will keep interest rates elevated for longer.
Conversely, weaker data may strengthen the case for rate cuts later this year, potentially boosting demand for risk assets such as cryptocurrencies.
Against this backdrop, several altcoins have entered consolidation phases following February’s market turbulence, when geopolitical tensions and broader risk-off sentiment weighed on crypto prices.
Solana price outlook
Solana is trading near $90.9 after recovering from a sharp early-February decline that briefly pushed the token toward the $70 region.
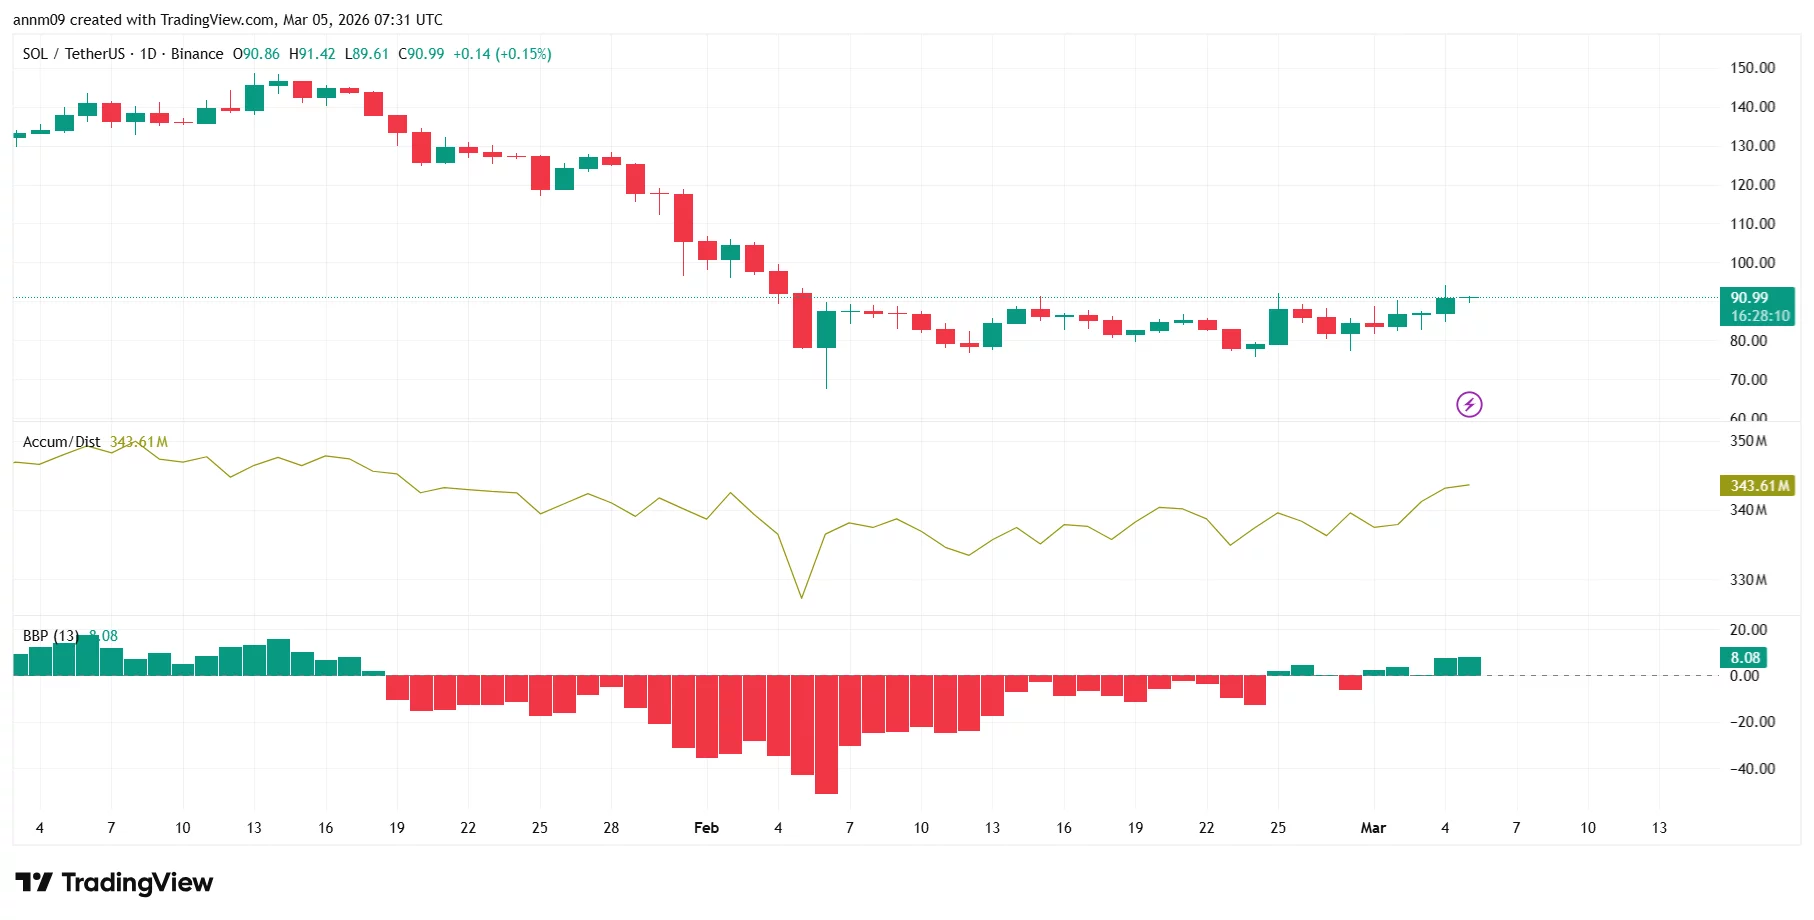
The daily chart shows SOL forming a gradual recovery structure as buyers step in near lower levels. The Accumulation/Distribution indicator is trending higher, signaling that investors may be steadily accumulating the token.
Meanwhile, the Bull Bear Power (BBP) indicator has turned positive, suggesting improving bullish momentum after weeks of persistent selling pressure.
If momentum continues, SOL could test resistance near $95, with a stronger breakout potentially opening the door toward the $100 psychological level.
However, downside risks remain. A break below $85 support could expose the token to renewed selling pressure and potentially send it back toward the $80–$78 region.
XRP price outlook
XRP is currently trading around $1.42, where it has been moving sideways after a prolonged decline from earlier highs near $2.
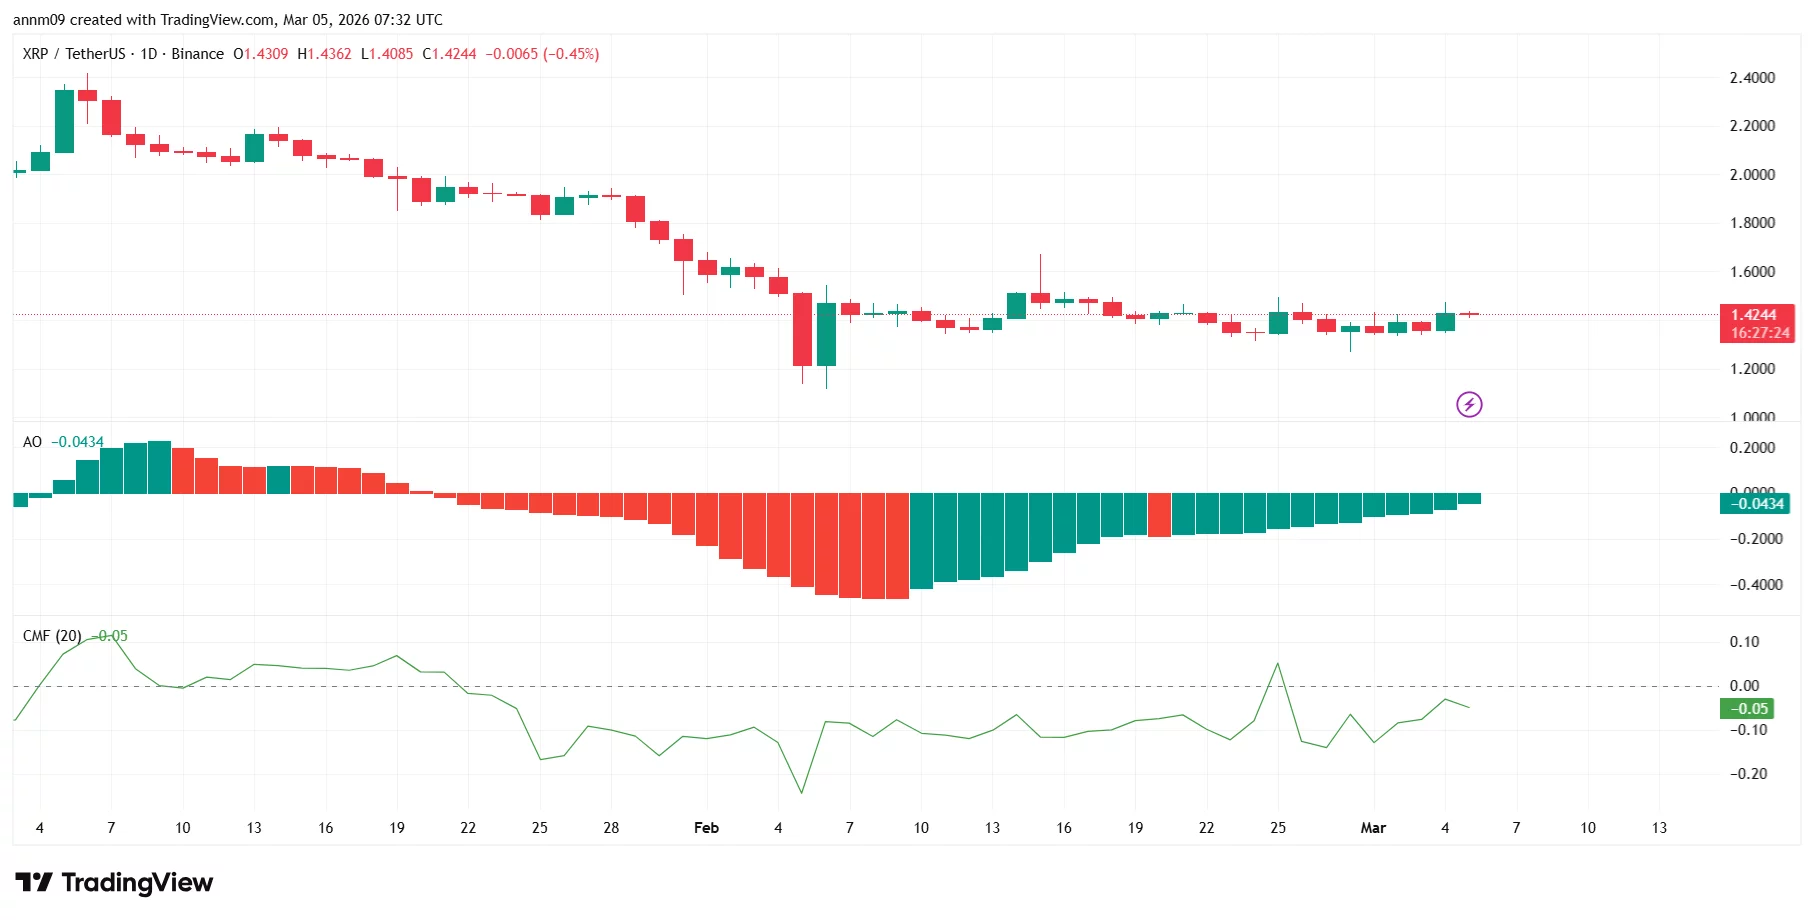
Technical indicators suggest bearish momentum may be fading. The Awesome Oscillator is gradually turning positive, while the Chaikin Money Flow indicator is stabilizing, signaling that capital outflows are slowing.
If buying pressure strengthens, XRP could attempt a move toward resistance near $1.50, followed by a potential test of the $1.60 zone.
On the downside, the key support level sits near $1.35, and a breakdown below that threshold could send XRP toward the $1.25 area.
With both tokens consolidating, the upcoming U.S. employment report may act as the next major catalyst determining whether Solana and XRP extend their recovery or face another round of volatility.


The Solana Foundation is positioning the network as core infrastructure for an emerging “agentic” internet, where AI systems—not humans—initiate and execute economic activity.
“AI is not really a vertical. It’s a platform shift… affecting everything across every industry, including crypto,” said Vibhu Norby, chief product officer of the Solana Foundation, during a panel at the Digital Asset Summit (DAS) in New York.
At the center of Solana’s strategy is payments. Norby said the network has already “processed 15 million payments onchain from agents,” largely tied to machine-to-machine commerce. “The programmatic aspect of crypto payments is what is making it interesting for agents,” he said, adding that “stablecoins are going to be the default thing that agents use to pay for any computational resource.”
This shift could fundamentally reshape internet business models, Norby believes. “Agentic payments are probably going to change the entire way that the internet is monetized,” he said, pointing to the ability to support sub-cent, pay-per-use transactions that traditional rails cannot handle.
The Solana Foundation argues that the network’s performance-focused design gives it an edge in this new paradigm. “Agents are cold, calculated machines… they don’t subscribe to crypto religiosity,” Norby said. “If you ask an agent what’s the best way to pay for something with crypto, most of the time, Solana is showing up at the top.”
At the same time, advances in AI are eroding long-standing developer barriers, noting that tools now allow developers and machines to build across ecosystems more easily.
In response, Solana developers are building directly for AI systems. “What agents like is APIs and documentation and skills,” Norby said, pointing to initiatives like machine-readable “skill” files and AI-first developer platforms.
Looking ahead, Norby expects a dramatic shift in user behavior: “The default way people will interact with crypto is going to be through their agent… 95 to 99% of all transactions… will be coming from LLMs.”
Read more: Solana Foundation taps Mastercard, Western Union, Worldpay for institutional developer platform


CoinMarketCap dropped a wordless rocket meme just as its own Fear & Greed Index bounced from extreme fear and Bitcoin ripped from $67k back toward $71k.
Summary
- CoinMarketCap (@CoinMarketCap) posted a single rocket emoji alongside a stylized AI-generated rocket-shaped lava lamp image on March 24.
- The post came exactly one day after CoinMarketCap’s own Crypto Fear & Greed Index hit 8 out of 100 — deep in “extreme fear” territory — as traders aggressively dumped XRP, Solana, and DeFi positions amid geopolitical anxiety and macro pressure.
- The broader market context was significant: Bitcoin (BTC) had just surged from a recent low of $67,000 back toward $71,000 on March 24.
CoinMarketCap (@CoinMarketCap), one of the world’s most widely cited cryptocurrency data platforms with over 70 million monthly users, posted a wordless bullish signal on March 24 at 4:00 PM UTC — a rocket emoji and an AI-generated image of a metallic, rocket-shaped lava lamp — at the precise moment sentiment across crypto markets was attempting to reverse from some of its deepest fear readings in years. The post accumulated 34,500 views, 598 likes, and 75 retweets, becoming one of the most-engaged posts in crypto’s trending feed that day.
The timing was pointed. Just 24 hours earlier, CoinMarketCap’s own Crypto Fear & Greed Index had printed at 8 out of 100, locking in one of the deepest “extreme fear” readings of the current cycle, as traders liquidated positions across major altcoins including Solana (SOL) and XRP (XRP). The broader total crypto market capitalization had held around $2.36 trillion even as investors rotated aggressively into cash and stablecoins.
The fear had been building for months. As crypto.news reported in February, the Fear & Greed Index plunged to a yearly low of 5 on Feb. 6 — a level not seen since the depths of 2022 — as the global crypto market cap shed roughly $2 trillion from its 2025 peak. By mid-March, sentiment had crept back toward neutral. But a fresh wave of geopolitical anxiety around Iran dragged it back toward single digits.
The catalyst for the reversal was geopolitical rather than on-chain. U.S. President Donald Trump signaled a pause in military escalations against Iran on March 24, opening the door to diplomatic talks. The announcement triggered an immediate “risk-on” rotation across financial markets. Bitcoin, which had dipped to approximately $67,000 in the preceding days, climbed nearly 4% to breach $71,000 — recovering its market capitalization toward $1.33 trillion, according to Fortune. The wider crypto market cap moved to approximately $2.44 trillion, per CoinMarketCap data, with BTC dominance still elevated at close to 58%.
It was into this precise inflection point that CoinMarketCap chose to post its rocket image. The platform, described in its own documentation as “the Home Of Crypto” and the operator of what it calls “the most trusted” sentiment gauge in mainstream financial media, offered no caption beyond a single emoji. The community read the signal clearly: @DogelonMars replied “Comfy in spot,” while @CaptainBNB_bsc wrote “It’s mesmerizing, I could watch it all day.”
CoinMarketCap’s Fear & Greed Index runs on a 0–100 scale and draws from five data pillars: price momentum across the top 10 non-stablecoin assets, volatility measures on Bitcoin and Ethereum, options put/call ratios, stablecoin supply ratios, and CMC’s proprietary social trend data. CoinMarketCap itself states that “extreme fear likely indicates undervalued asset prices” — and by its own measure, markets had been in that territory for weeks.
Whether the rocket post marks an inflection or a head-fake remains to be seen. But as a sentiment artifact, it captured something real: after months of fear, the data’s own publisher was finally reaching for the launch button.

A decentralized crowdfunding approach is being pitched as a lifeline for NFT artists when market conditions turn sour and traditional middlemen tighten their hold. An on-chain experiment led by longtime collector Batsoupyum and curator Lanett Bennett Grant makes a persuasive case: commit to 1 Ether each week to fund emerging Ethereum mainnet works, share the artists’ stories, and avoid profit-driven flips. The model emphasizes direct, transparent capital flows from collectors to creators, with no centralized gatekeepers dictating who deserves attention.
Originating in an opinion piece by Joshua Kim, CEO and founder of DonaFi, the concept argues that a self-sustaining, on-chain funding pipeline can bypass the friction and fees of conventional platforms. In a bear market, when liquidity is scarce and attention concentrates elsewhere, this approach tests whether a small, committed community can keep artists productive and visible.
Key takeaways
- On-chain, platform-agnostic crowdfunding can deliver predictable funding to artists without relying on gatekeeping or monthly platform fees.
- During downturns, direct from-collector funding can supplement shrinking primary sales and help artists stay active in the ecosystem.
- The approach pairs financial support with narrative context, ensuring supporters see exactly where funds go and artists’ stories travel with each transaction.
- Early supporters demonstrated a network effect—more participants pledged, matched funds, or offered exhibitions—without permission from a central authority.
Crowdfunding without platforms or promises
Everything happens on-chain and in public, one purchase at a time. Artists receive direct payment and gain immediate visibility, while collectors know precisely how funds are allocated. The social layer—stories, context, and curation—travels alongside the transaction rather than getting filtered through a platform’s user interface.
Monthly open calls create a repeatable pipeline for discovery and support. The point isn’t a single philanthropic gesture; it’s sustained visibility and cash flow that can keep artists producing during a downturn. The model strips crowdfunding down to essentials: capital, trust and consistency.
A bear market proving ground
NFT bear markets don’t just depress floor prices; they shrink income for aspiring artists who rely on primary sales to fund new work and cover living costs. In this experiment, the community’s response was swift and tangible. Punk6529 matched the weekly ETH pledge. Sam Spratt contributed $20,000. Bob Loukas added $100,000. Galleries opened exhibitions, and platforms like Foundation pledged to feature works. Crucially, none of these contributions required permission or centralized coordination—the momentum spread through the ecosystem organically.
That rapid, permissionless response illustrates the strength of decentralized crowdfunding in downturns. It prioritizes conviction over optimism and demonstrates a pathway for artists to receive steady support even when demand in the broader market falters.
A networked approach to crowdfunding
What distinguishes this model from traditional patronage is its networked nature. Each participant amplifies the others; collectors don’t replace markets, but help stabilize them. Artists aren’t pigeonholed into charity narratives; their work is valued on its own merits. Platforms and galleries don’t compete with the effort—they extend it, enabling broader visibility and ongoing dialogue between creators and supporters.
As the original proposal notes, decentralized crowdfunding works because it aligns incentives without coercion. No one is locked in or promised upside; yet the outcome—a steady stream of support and authentic storytelling—can arrive swiftly.
Related: AI agents will have growing pains before innovation can start links to broader conversations about technology-enabled creativity and the evolving role of automation in art markets.
Why this model matters in 2026
This isn’t merely about salvaging NFTs; it’s about proving that decentralized capital can function when speculation cools. In a market where hype wanes, what endures is community, transparency and conviction—foundations that artists need to thrive. If the next phase of NFTs is to matter beyond hype cycles, it will depend on collectors showing up consistently, moving funds on-chain to creators, and telling their stories alongside the art.
Decentralized crowdfunding won’t fix every problem artists face, but in a downturn it already accomplishes something far more important: it keeps artists alive in the ecosystem when other channels go quiet.
As this model evolves, observers will want to see whether more artists participate, whether funding can scale beyond a few high-profile contributors, and how broadly the storytelling and on-chain transparency can be sustained. The coming months will indicate whether this on-chain approach becomes a durable backbone for creator ecosystems or remains a powerful, yet niche, instrument in the NFT landscape.


An independent government review warned that crypto assets could channel foreign money into British politics.
The United Kingdom has imposed an immediate moratorium on all cryptocurrency donations to political parties, Prime Minister Keir Starmer announced on Wednesday.
The move follows the publication of the Rycroft Review, a 50-page independent assessment of foreign financial interference in UK politics led by former senior civil servant Philip Rycroft.
The government will legislate the moratorium through amendments to the Representation of the People Bill currently before Parliament, and the new rules will apply retrospectively to any crypto donations received from Wednesday onward, Communities Secretary Steve Reed confirmed in the House of Commons.
Why Crypto
The Rycroft Review cited a combination of concerns specific to crypto assets as the basis for its recommendation, including the incomplete regulatory framework for crypto — particularly at the international level — the difficulty of tracing ultimate ownership, the proliferation of different cryptoasset vehicles with varying degrees of traceability, and the emergence of AI-assisted technologies that can fragment crypto holdings into amounts small enough to fall below the £500 threshold at which political donations must be declared.
No crypto donations have reached the reporting threshold to date, according to the review, meaning the Electoral Commission has had no visibility into the scale of crypto flowing into party coffers.
The review framed the moratorium as a pause rather than a permanent prohibition. Rycroft wrote that the measure should be understood as an interval for the regulatory environment to catch up with the reality of cryptoassets, not a prelude to an outright ban. The legislation would include a mechanism to lift the moratorium once Parliament and the Electoral Commission are satisfied that adequate regulation is in place.
Rycroft also acknowledged that the ban is not a complete seal. Donors would still be able to convert crypto holdings to fiat and donate the proceeds, at which point traditional anti-money laundering checks would apply.
The UK Parliament’s Joint Committee on the National Security Strategy last month described crypto’s presence in UK politics as an unacceptably high risk to the integrity of the political finance system, and endorsed the review’s findings today.
Reform UK in the Crosshairs
The moratorium lands squarely on Nigel Farage’s Reform UK, the only major British party to actively court crypto donations. Reform became the first mainstream UK party to accept Bitcoin donations last year, and its largest donor — Thailand-based Christopher Harborne, a major Tether investor — has donated £12 million to the party over the past year, including a single £9 million contribution.
The Electoral Commission has said that Reform has not shared any crypto wallet addresses with the regulator, limiting the watchdog’s ability to independently verify the party’s crypto funding sources.
Reform UK MPs walked out of the House of Commons during Starmer’s announcement. The Prime Minister took a direct shot at Farage, telling MPs that there was only one party leader willing to say anything if paid to do so.
Broader Crackdown
The crypto moratorium is one of 17 recommendations in the Rycroft Review, which found that foreign interference in UK politics from Russia, China, and Iran is persistent and growing more acute. The review was triggered by the November 2025 conviction of Nathan Gill, Reform UK’s former leader in Wales, who was sentenced to more than 10 years for accepting Russian bribes.
Alongside the crypto ban, the government immediately adopted a £100,000 annual cap on political donations from British citizens living overseas. Rycroft also recommended limiting corporate donations to a party’s reported taxable profits — a measure aimed at closing a loophole that could allow foreign individuals to funnel money through UK-registered shell companies.
The Rycroft Review also warned of threats beyond direct political financing, noting that foreign-linked social media bots and disinformation campaigns represent a relatively cheap way for hostile states to interfere in democratic processes. Rycroft separately flagged what he called a potential new threat from allies like the United States, citing a willingness of foreign actors and private citizens to interfere in politics abroad in pursuit of their own agenda.
This article was written with the assistance of AI workflows. All our stories are curated, edited and fact-checked by a human.
South Korea’s political deadlock over virtual asset taxation has broken under the weight of market reality. Lawmakers from both major parties have agreed to delay the planned 20% Crypto Tax on gains until 2027 following data revealing $110 billion in annual capital flight. This bipartisan reversal is a strategic pivot driven by a retail exodus that has drained liquidity from domestic exchanges in favor of offshore derivatives platforms.
The Financial Services Commission (FSC) confirmed that outflows accelerated in the second half of 2025, with $60 billion leaving the country in just six months. Traders are not just cashing out; they are moving capital to jurisdictions that offer the leverage and hedging tools currently banned on local soil.
- Capital Flight: Annual outflows hit an estimated $110 billion in 2025, with 57% of volume moving to Binance to access futures and leverage.
- Political Response: Both the ruling People Power Party and opposition Democratic Party agreed to delay the 20% tax implementation to 2027.
- Market Impact: Operating profits for domestic exchanges plunged 38% in H2 2025 as traders bypassed local spot-only restrictions.
The Mechanics of the Exodus
The data paints a picture of a market structure failure. While the FSC noted a 14% increase in outflows to 90 trillion won ($60 billion) in the second half of the year, the drivers are structural, not sentimental.
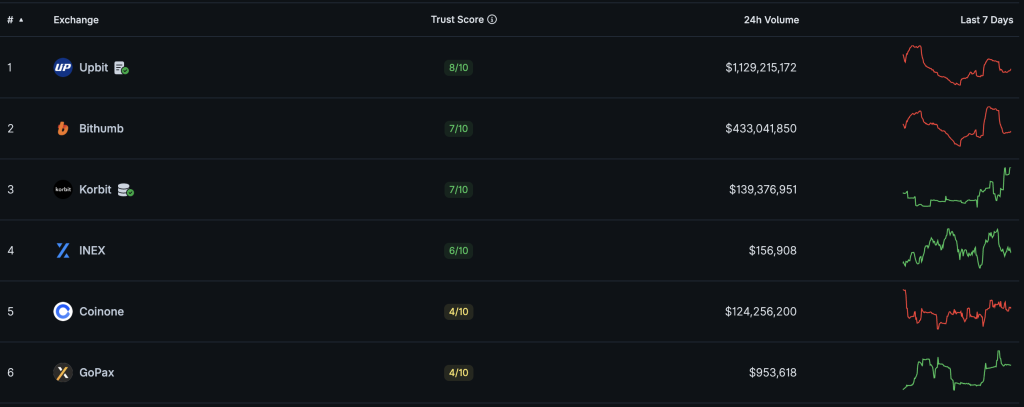
Domestic giants like Upbit and Bithumb are legally restricted to spot trading. In a volatile market, this restriction renders them obsolete for sophisticated traders looking to hedge downside risk or speculate with leverage.

This is not a sell-off. It is an arbitrage migration. A joint report by CoinGecko and Tiger Research estimates that 57% of the total outflows flowed directly to Binance.
South Korean traders now account for approximately 13% of Binance’s futures volume. The net result is a massive transfer of fees abroad; foreign exchanges earned an estimated 2.7 times more revenue from Korean users than domestic platforms did in 2025.
The disparity has crushed local profitability. Despite a 31% rise in deposits to 8.1 trillion won ($5.4 billion), operating profits for South Korea’s 18 exchanges collapsed by 38% to 380.7 billion won ($253.4 million). The volume is there, but the high-value transactional velocity has moved elsewhere. We are seeing similar liquidity demands globally; EDX Markets launching KRW perpetual futures suggests institutional players are already positioning to capture this volume offshore if domestic regulations don’t adapt.
The FSC report explicitly linked the outflows to “arbitrage and other similar activities,” a tacit admission that the current regulatory framework is bleeding value.
Regulatory News: The Policy Gap
The decision to delay the tax is an emergency brake, not a solution. The opposition Democratic Party, previously adamant about implementing the tax in 2025, capitulated after realizing the Capital Flight could permanently cripple the domestic fintech sector.
With 11.1 million crypto accounts in the country, representing over 20% of the population, the political cost of taxing a shrinking market became untenable.
The post Regulatory Backlash: $110B in Outflows Forces South Korea to Rethink Crypto Tax appeared first on Cryptonews.

Tom Lee’s firm is the largest public holder of ETH, and the second largest digital asset treasury company.
BitMine Immersion Technologies (NYSE: BMNR) has officially launched MAVAN — the Made in America Validator Network — its proprietary institutional-grade Ethereum staking platform, the company announced on Wednesday, March 25.
The move marks a major operational milestone in BitMine’s pivot from Bitcoin miner to what Chairman Tom Lee is calling “one of the leading staking and on-chain infrastructure platforms globally,” per the release.
MAVAN is designed to serve institutions and custodians requiring U.S.-based validation, with a globally distributed architecture for international clients. Per the release, via MAVAN, BitMine will eventually expand staking services for other proof-of-stake blockchains beyond Ethereum, as well as provide crypto infrastructure services.
BitMine currently has 3.14 million ETH staked, making it one of the largest entities staking the second largest cryptocurrency. As of the past week, the firm has staked about 101.7K ETH via MAVAN, and said it plans to eventually scale to staking “nearly all of Bitmine’s remaining unstaked ETH.”
Per BitMine’s latest report on Monday, the firm holds a total of over 4.6 million ETH. Once its remaining holdings are fully onboarded to MAVAN in the coming weeks, BitMine projects annual staking rewards approaching $300 million at a 2.83% yield, according to today’s press release.
As The Defiant previously reported, the company’s aggressive ETH accumulation has been backed by institutional heavyweights including ARK Invest’s Cathie Wood, Peter Thiel’s Founders Fund, Pantera, Galaxy Digital, and DCG, all aligned behind the firm’s goal of owning 5% of all ETH in circulation. BitMine’s current holdings represent 3.86% of the ETH supply.
The launch arrives as the broader Ethereum staking ecosystem continues to see record participation, with over 30% of ETH’s circulating supply now locked in staking contracts. ETH is trading around $2,160 today, well below its August 2025 peak of nearly $5,000.
As The Defiant has reported, Lido remains by far the dominant Ethereum staking entity, with approximately 8.9 million ETH staked across its liquid staking protocol, per data from Dune Analytics.
This article was written with the assistance of AI workflows. All our stories are curated, edited and fact-checked by a human.
Crypto World
Micron (MU) vs Western Digital (WDC): Which AI Infrastructure Stock Offers Better Value?

Key Highlights
- Micron achieved unprecedented quarterly revenue of $23.86 billion in its fiscal Q2 2026, delivering 74.4% gross margin and $13.79 billion in net income
- The memory chipmaker projected fiscal Q3 2026 revenue at $33.5 billion and increased its 2026 capital expenditure forecast above $25 billion
- Western Digital generated $2.82 billion in fiscal Q1 2026 revenue, marking a 27% year-over-year increase, with cloud segment revenue climbing 31%
- Wall Street assigns Micron a Buy rating with $453.55 average target; Western Digital receives Moderate Buy with $265.58 target
- The companies address AI infrastructure needs through complementary technologies: Micron via memory solutions, Western Digital through storage systems
The artificial intelligence revolution has created powerful tailwinds for technology hardware companies, with Micron and Western Digital emerging as notable beneficiaries. However, these firms occupy distinctly different positions within the AI infrastructure ecosystem—one dominates the memory chip segment while the other focuses on cloud storage solutions.
Micron has delivered extraordinary financial performance recently. During its fiscal second quarter of 2026, the semiconductor manufacturer generated unprecedented revenue of $23.86 billion. The company achieved remarkable profitability metrics, including a 74.4% gross margin, 67.6% operating margin, and net income of $13.79 billion. The quarter also produced $11.9 billion in operating cash flow.
Management’s outlook proved equally impressive, with fiscal third-quarter 2026 revenue guidance reaching $33.5 billion and projected gross margin of approximately 81%. These figures represent performance levels that would have seemed unattainable for memory chip manufacturers in the recent past.
The catalyst behind this exceptional growth is high-bandwidth memory technology, which has become indispensable in artificial intelligence computing systems. Micron belongs to a limited group of global suppliers capable of producing these specialized chips, creating significant pricing advantages and margin expansion during the current AI infrastructure expansion.
To maintain production capacity aligned with market requirements, Micron elevated its fiscal 2026 capital investment plan beyond $25 billion. This substantial commitment demonstrates management’s confidence in sustained demand, though it also represents considerable spending during a period when memory markets have historically experienced boom-and-bust cycles driven by supply-demand imbalances.
Western Digital’s Enterprise Storage Focus
Western Digital presents a contrasting narrative. Following the divestiture of its flash memory division, the company now concentrates exclusively on hard-disk drive technology and enterprise storage infrastructure.
Western Digital Corporation, WDC
During fiscal first-quarter 2026, the company posted $2.82 billion in revenue, representing 27% year-over-year growth. Cloud segment performance particularly impressed, with revenue increasing 31% to reach $2.51 billion. Management attributed this strength to elevated shipments of high-capacity enterprise drives and customer migration toward higher-density products.
For the full fiscal year 2025, Western Digital delivered $9.52 billion in revenue alongside a 38.8% gross margin. Leadership also unveiled a dividend program, authorized a $2 billion share repurchase plan, and emphasized debt reduction as a strategic priority.
These developments illustrate a company leveraging improved cash generation to reward shareholders while capitalizing on robust cloud demand for revenue expansion.
Wall Street Perspectives
According to MarketBeat data, Micron holds a Buy consensus rating from 38 Wall Street analysts. The distribution includes 34 buy recommendations and 4 hold ratings, with zero sell ratings. The consensus 12-month price target stands at $453.55.
Western Digital receives a Moderate Buy rating based on input from 24 analysts, comprising 21 buy recommendations and 3 hold ratings. The consensus price target of $265.58 notably trails recent trading levels.
This divergence between analyst targets and current market prices suggests Wall Street perceives limited near-term appreciation potential for Western Digital following its recent valuation expansion.
Micron’s investment thesis centers on constrained supply in the AI memory marketplace. The counterargument acknowledges that memory industry cycles can shift rapidly when production capacity aligns with or exceeds demand.
Western Digital’s bullish case emphasizes expanding cloud storage requirements and a streamlined business structure following its corporate separation. The bearish perspective notes that hard-disk drive technology lacks the pricing power inherent to high-bandwidth memory products.
Both enterprises benefit from identical AI infrastructure investments, though through different technological avenues.
Investment Considerations
Micron and Western Digital represent legitimate beneficiaries of artificial intelligence infrastructure expansion, operating at distinct layers of the hardware architecture. Micron demonstrates stronger financial metrics and more direct exposure to AI memory demand currently. Western Digital offers a more conservative, stable investment profile with enhanced capital return programs. Neither qualifies as speculative—both companies produce tangible earnings supporting current market attention.


Opinion by: Joshua Kim, CEO and founder of DonaFi.
Traditional crowdfunding has always been pitched as a lifeline for creators. For non-fungible token (NFT) artists, most centralized models feel out of sync with reality. Fees are high, visibility is inconsistent and platforms increasingly optimize for momentum rather than need. During a market downturn, when liquidity dries up dramatically, the deck is stacked even higher against artists.
Decentralized crowdfunding ensures a more direct, transparent capital flow onchain from collectors who care about art, as opposed to quick flips. The recent effort led by longtime collector Batsoupyum and curator Lanett Bennett Grant makes the case very well.
Rather than launch a flashy fund or token, they committed to spending 1 Ether (ETH) every week on Ethereum mainnet works from emerging artists, sharing the stories behind each piece and explicitly not flipping for profit. No middlemen or no platform deciding who “deserved” attention. Just consistent, visible support when artists need it most.
When markets crash, artists feel it first
NFT bear markets don’t just reduce floor prices; they erase income for aspiring artists. Many artists rely on primary sales to pay rent, fund new work or stay in the space at all. When speculation collapses, attention moves elsewhere, and artists are often left invisible.
What’s striking about this decentralized crowdfunding effort is how fast others stepped in, despite brutal conditions. Punk6529 matched the weekly ETH pledge. Sam Spratt added $20,000. Bob Loukas followed with another $100,000. Galleries offered exhibitions. Platforms like Foundation committed to features. None of it required permission, approvals or centralized coordination — it just spread.
That’s the strength of decentralized crowdfunding in downturns. It doesn’t depend on optimism; it depends on conviction.
Crowdfunding without platforms or promises
Everything happens onchain, in public, one purchase at a time. Artists receive direct payment and immediate visibility. Collectors know exactly where funds go. The social layer, stories, context and curation travel alongside the transaction instead of being abstracted away by a platform UI.
Monthly opens create a repeatable pipeline for discovery and support. That matters. One-off gestures help, but sustained visibility plus cash flow is what keeps artists producing through a downturn. This is crowdfunding stripped down to its essentials: capital, trust and consistency.
A network effect, not a charity
What makes this different from patronage is that it’s networked. Each participant amplifies the others. Collectors don’t replace markets; they stabilize them. Artists aren’t boxed into charity narratives; they’re valued for their work. Platforms and galleries don’t compete with the effort; they actually extend it.
Related: AI agents will have growing pains before innovation can start
Decentralized crowdfunding works here because it aligns incentives without forcing them. No one is locked in. No one is promised upside, yet the result is tangible support, fast.
The importance of this model in 2026
This isn’t about saving NFTs; it’s about proving that decentralized capital still functions when markets are cold. When speculation leaves, what remains is community, transparency and conviction. That’s exactly what artists need right now.
If the next phase of NFTs is going to mean anything, it won’t be built on hype cycles or centralized gatekeeping. It will be built on collectors showing up consistently, using onchain tools to move money directly to creators and telling their stories along the way.
Decentralized crowdfunding won’t fix every problem artists face. In a downturn, however, it’s already doing something far more important: keeping artists alive in the ecosystem when everything else goes quiet.
Opinion by: Joshua Kim, CEO and founder of DonaFi.
This opinion article presents the author’s expert view, and it may not reflect the views of Cointelegraph.com. This content has undergone editorial review to ensure clarity and relevance. Cointelegraph remains committed to transparent reporting and upholding the highest standards of journalism. Readers are encouraged to conduct their own research before taking any actions related to the company.
Crypto World
General Motors (GM) Stock Gets Bullish Upgrade as Analyst Sees Value After Recent Decline

Key Highlights
- GM receives Outperform rating from Wolfe Research, upgraded from Peer Perform, with price objective set at $96
- Auto sector stocks have declined approximately 8% in the last three-week period amid broader economic uncertainty
- Analyst identifies 2027 catalysts including full-size truck refresh projected to add ~$1.7B, warranty expense reduction, and tariff relief
- Earnings projections from Wolfe show GM reaching $12.37 per share in 2026, climbing to $16.03 in 2027
- Ford faces potential challenges with Wolfe warning of possible $1.5B EBIT pressure in 2027 from inventory concerns
On Wednesday, Wolfe Research elevated its rating on General Motors to Outperform, establishing a $96 price objective for the automaker’s shares. This marks an upgrade from the firm’s previous Peer Perform designation.
The rating adjustment arrives during a challenging period for automotive equities, which have experienced widespread selling pressure throughout the past three weeks. Sector stocks have retreated roughly 8% on average as macroeconomic headwinds sparked investor caution.
In his research note, analyst Emmanuel Rosner observed that automotive stocks typically rank “among the main targets when macro concerns escalate.” However, he emphasized that historical patterns demonstrate these downturns “can also present interesting buying opportunities.”
Following revisions to production forecasts and commodity price projections, Wolfe concluded that the “risk/reward profile now appears more attractive for select names.” General Motors emerged as the firm’s top pick in this reassessment.
The investment firm contends that market participants are overlooking the magnitude of GM’s prospective gains approaching 2027. A significant factor involves the forthcoming full-size pickup truck redesign, which Wolfe projects could contribute approximately $1.7 billion in value.
Additional positive factors include anticipated declines in warranty-related expenses. Beyond that, Wolfe anticipates a lighter net tariff impact and ongoing enhancements in electric vehicle profitability as supplementary growth drivers.
Wolfe’s financial models project GM will deliver earnings of $12.37 per share during 2026, before advancing to $16.03 in 2027. The firm believes the 2027 earnings potential represents where the market is significantly undervaluing the shares.
BorgWarner and Aptiv Receive Positive Commentary
Wolfe simultaneously elevated BorgWarner to Outperform status in the same research publication. The firm highlighted the manufacturer’s “Power Gen opportunity,” estimating it could contribute approximately $2 billion in sales once fully developed.
Rosner noted that the stock’s recent decline suggests this growth potential remains unrecognized in current valuations. From Wolfe’s perspective, this creates an appealing investment opportunity.
Regarding Aptiv, Rosner maintained his optimistic outlook in advance of the company’s upcoming corporate separation. He characterized the current environment as “a compelling entry point,” emphasizing robust operational fundamentals in both entities that will emerge from the division.
Ford Faces Cautionary Assessment
Not all automotive manufacturers received favorable commentary. Wolfe identified execution challenges at Ford, noting uncertainty surrounding the company’s 2026 production plans.
The research firm cautioned that elevated year-end inventory levels might generate a $1.5 billion EBIT headwind extending into 2027. Rosner opted not to upgrade Ford’s rating.
The Wolfe analysis demonstrates a discriminating sector strategy rather than widespread optimism. General Motors’ updated truck portfolio and expense management improvements formed the foundation of the upgrade thesis.
Wolfe’s 2027 earnings estimate of $16.03 per share for GM substantially exceeds current analyst consensus, indicating the firm perceives considerable appreciation potential should these favorable developments unfold as anticipated.


Virtuals Protocol is integrating its Agent Commerce Protocol with Arbitrum, aiming to make AI agents native DeFi users on a high-liquidity L2 just as its VIRTUAL token battles an 86% drawdown.
Summary
- Virtuals Protocol (@virtuals_io) announced on March 24 that it is building “the commerce layer for agents to transact natively on Arbitrum.”
- The original Virtuals Protocol post drew 41,400 views.
- Virtuals Protocol’s native token VIRTUAL is currently trading at approximately $0.724 with a market capitalization of roughly $475 million — down 86% from its all-time high.
Virtuals Protocol and Arbitrum announced a significant integration on March 24 that positions the AI agent platform as the commerce layer for autonomous agents transacting natively on the Arbitrum network, marking one of the most concrete deployments yet in the emerging “agentic economy” narrative that has gripped the crypto-AI crossover space in 2026. The announcement, posted at 2:30 PM UTC, stated plainly: “Virtuals is building the commerce layer for agents to transact natively on @arbitrum — one of the most liquid ecosystems in DeFi.”
Arbitrum amplified the news in a post at 3:11 PM UTC, framing the integration in expansive terms. “With @virtuals_io, AI agents can coordinate, transact, and operate as autonomous businesses powered by Arbitrum’s low costs, deep liquidity and reliable execution,” the official @arbitrum account wrote, before adding: “Let’s scale the agentic economy together.” The integration centers on Virtuals Protocol’s Agent Commerce Protocol (ACP), which is already live — one project, @octodamusai, confirmed it is “live on Virtuals ACP — oracle reports, on-chain, paid per job. Not a demo. Not a roadmap. Running now.”
The reaction from developers was cautiously optimistic. @ashcotXBT, a verified commentator, wrote: “Agentic commerce on Arbitrum via Virtuals is the real test. If agents can actually coordinate and pay, it’s validated.” Others raised harder questions. @WakeFramework, a smart contract security project, pointed to the accountability gap in autonomous agent systems: “The interesting question is who audits the agent’s logic when it starts making decisions no human reviewed.”
The choice of Arbitrum as the settlement layer is deliberate. According to the Arbitrum Foundation’s 2025 Transparency Report, the network processed more than 2.1 billion cumulative transactions last year, with total value locked hovering around $20 billion. Stablecoin supply grew 80% year-on-year to nearly $10 billion, making the chain one of the deepest liquidity pools in all of DeFi — a crucial attribute if AI agents are to transact at scale without slippage or bridge friction. Virtuals Protocol’s stated rationale for the partnership tracks directly: agents need deep liquidity and cheap execution, not speculative blockspace.
The integration arrives as Virtuals Protocol works to rebuild credibility around its VIRTUAL token, which has suffered one of the sharper declines in the AI crypto sector. After reaching an all-time high of $5.07 in early January 2025, the token now trades near $0.724 — an 86% decline — with a market cap of approximately $475 million. Platform revenue has also come under pressure, falling sharply from its 2024 peak as speculative interest in AI agent tokens faded. The Arbitrum integration represents a pivot toward practical utility: rather than trading VIRTUAL as a speculative bet on AI hype, the protocol is attempting to make itself an indispensable piece of DeFi’s operational stack.

US bans foreign-made consumer routers over cybersecurity concerns

Revolut Banking Licence Saga Exposes Painful Negativity of UK Regulators and Business Media – Guido Fawkes

Foundation says network is becoming core infrastructure for ‘agentic’ internet


-
 Crypto World5 days ago
NIO (NIO) Stock Plunges 6.5% as Shelf Registration Sparks Dilution Worries
-

 Fashion5 days ago
Weekend Open Thread: Adidas – Corporette.com
-

 Politics5 days ago
Jenni Murray, Long-Serving Woman’s Hour Presenter, Dies Aged 75
-
 NewsBeat7 hours ago
Manchester United reach agreement with Casemiro over contract clause amid transfer speculation
-

 Crypto World4 days ago
Best Crypto to Buy Now: Strategy Just Spent $1.57 Billion on Bitcoin During Fear While Early Investors Quietly Enter Pepeto for 150x Potential
-

 News Videos7 days ago
RBA board divided on rate cut, unusually buoyant share market | Finance Report | ABC NEWS
-

 Crypto World4 days ago
Bitcoin Price News: Bhutan Sells $72 Million in BTC Under Fiscal Pressure, but the Smart Money Entering Pepeto Sees What the Market Does Not
-

 Tech5 days ago
inKONBINI Lets You Spend Summer Days Behind the Register
-

 Crypto World7 days ago
Canada’s FINTRAC revokes registrations of 23 crypto MSBs in AML crackdown
-

 Sports2 days ago
Remo Stars and Kano Pillars Strengthen Survival Hopes in NPFL
-
 NewsBeat7 days ago
Residents in North Lanarkshire reminded to register to vote in Scottish Parliament Election
-

 Politics6 days ago
Gender equality discussions at UN face pushbacks and US resistance
-

 Business3 days ago
No Winner in March 21 Drawing as Prize Rolls to $133 Million for Next
-

 Business7 days ago
Who Was Alex Pretti? 5 Key Facts About the ICU Nurse Killed by Federal Agents in Minneapolis
-

 Sports2 days ago
Gary Kirsten Accuses Pakistan Cricket Board Of ‘Interference’, Mohsin Naqvi Responds
-

 Tech3 days ago
Give Your Phone a Huge (and Free) Upgrade by Switching to Another Keyboard
-

 Tech7 days ago
Inventec’s bizarre VeilBook laptop hides its touchpad under a sliding keyboard just to give cooling fans a little breathing room
-

 Sports5 days ago
2026 Kentucky Derby horses, odds, futures, preview, date: Expert who nailed 12 Derby-Oaks Doubles enters picks
-
Sports6 days ago
Vikings Free Agency Enters Phase 2 with Key Questions
-

 Tech3 days ago
AI enters the chat: New Seattle dating app relies on tech to facilitate meaningful human connections
You must be logged in to post a comment Login