

Crypto World
Solana price flashes a multi-year bearish pattern despite soaring network metrics
Solana price continued its strong downward trend and hit its lowest level since January 2024 as the crypto market crash intensified despite its strong fundamentals.
Summary
- Solana price crashed to the lowest level in years.
- Third-party data shows that it has solid fundamentals.
- It has formed a giant multi-year head and shoulders pattern on the weekly chart.
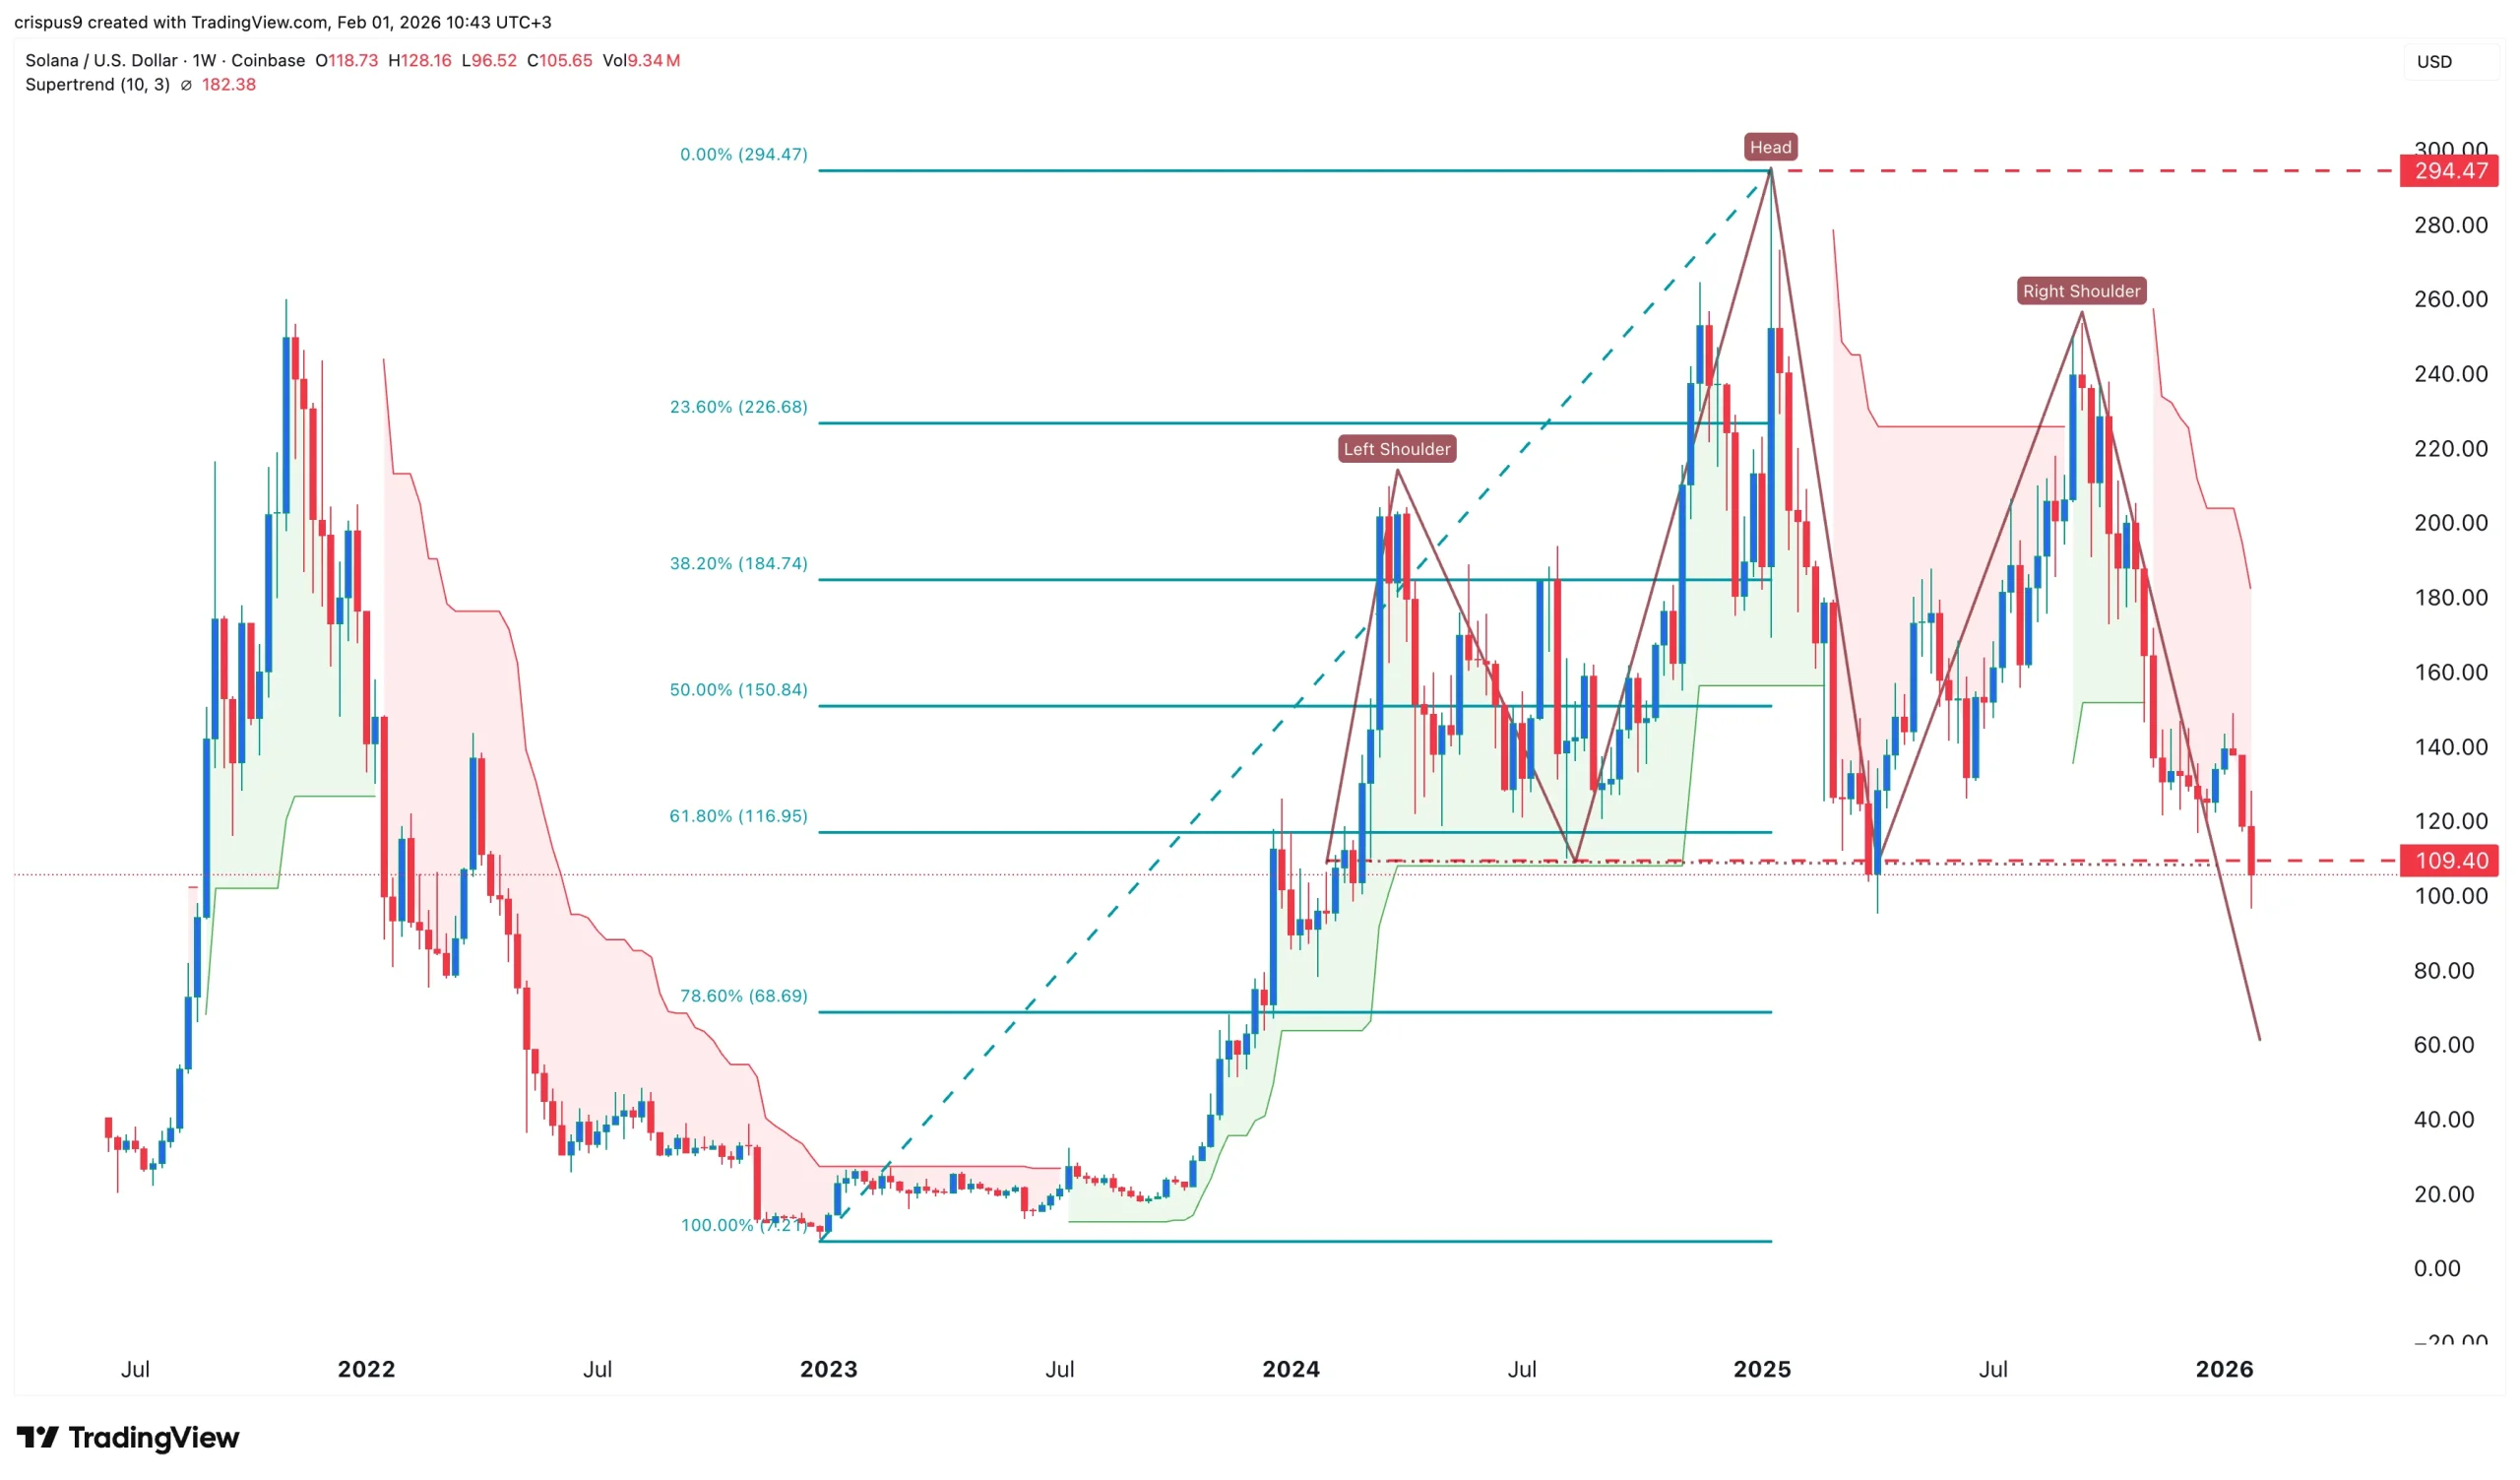
Solana (SOL) dropped to $104, down sharply from its all-time high of nearly $300. This crash has erased billions of dollars in value.
The drop is notable as it is happening at a time when Solana’s fundamentals are improving. For example, data compiled by Nansen shows that its network is the most popular among investors.
Solana handled over 2.34 billion transactions in the last 30 days, a 33% increase. Its transaction count was much higher than other networks like Ethereum, Base, and BNB Chain, combined
Solana’s active addresses jumped by 67% in January to over 98 million. This growth means that it will cross the 100 million milestone, which is higher than other chains combined. Its stablecoin inflow has also jumped.
Solana is also generating substantial sums of money in fees. It made over $26 million in the last 30 days, much higher than the $14 million that Ethereum made. BNB Chain made $19 million in the same period.
Most importantly, Solana ETFs are seeing more demand from American investors this year. Spot SOL ETFs added $104 million in inflows in January as Bitcoin, Ethereum, and Solana shed assets.
Therefore, the Solana price crash is mostly because of the ongoing performance of the broader sector. Bitcoin and most altcoins have all plunged in the past few days, with the trend accelerating during the weekend.
Market participants are still reflecting on the nomination of Kevin Warsh to become the next Federal Reserve Chair and the rising geopolitical tensions between the United States and Iran.
Solana price technical analysis
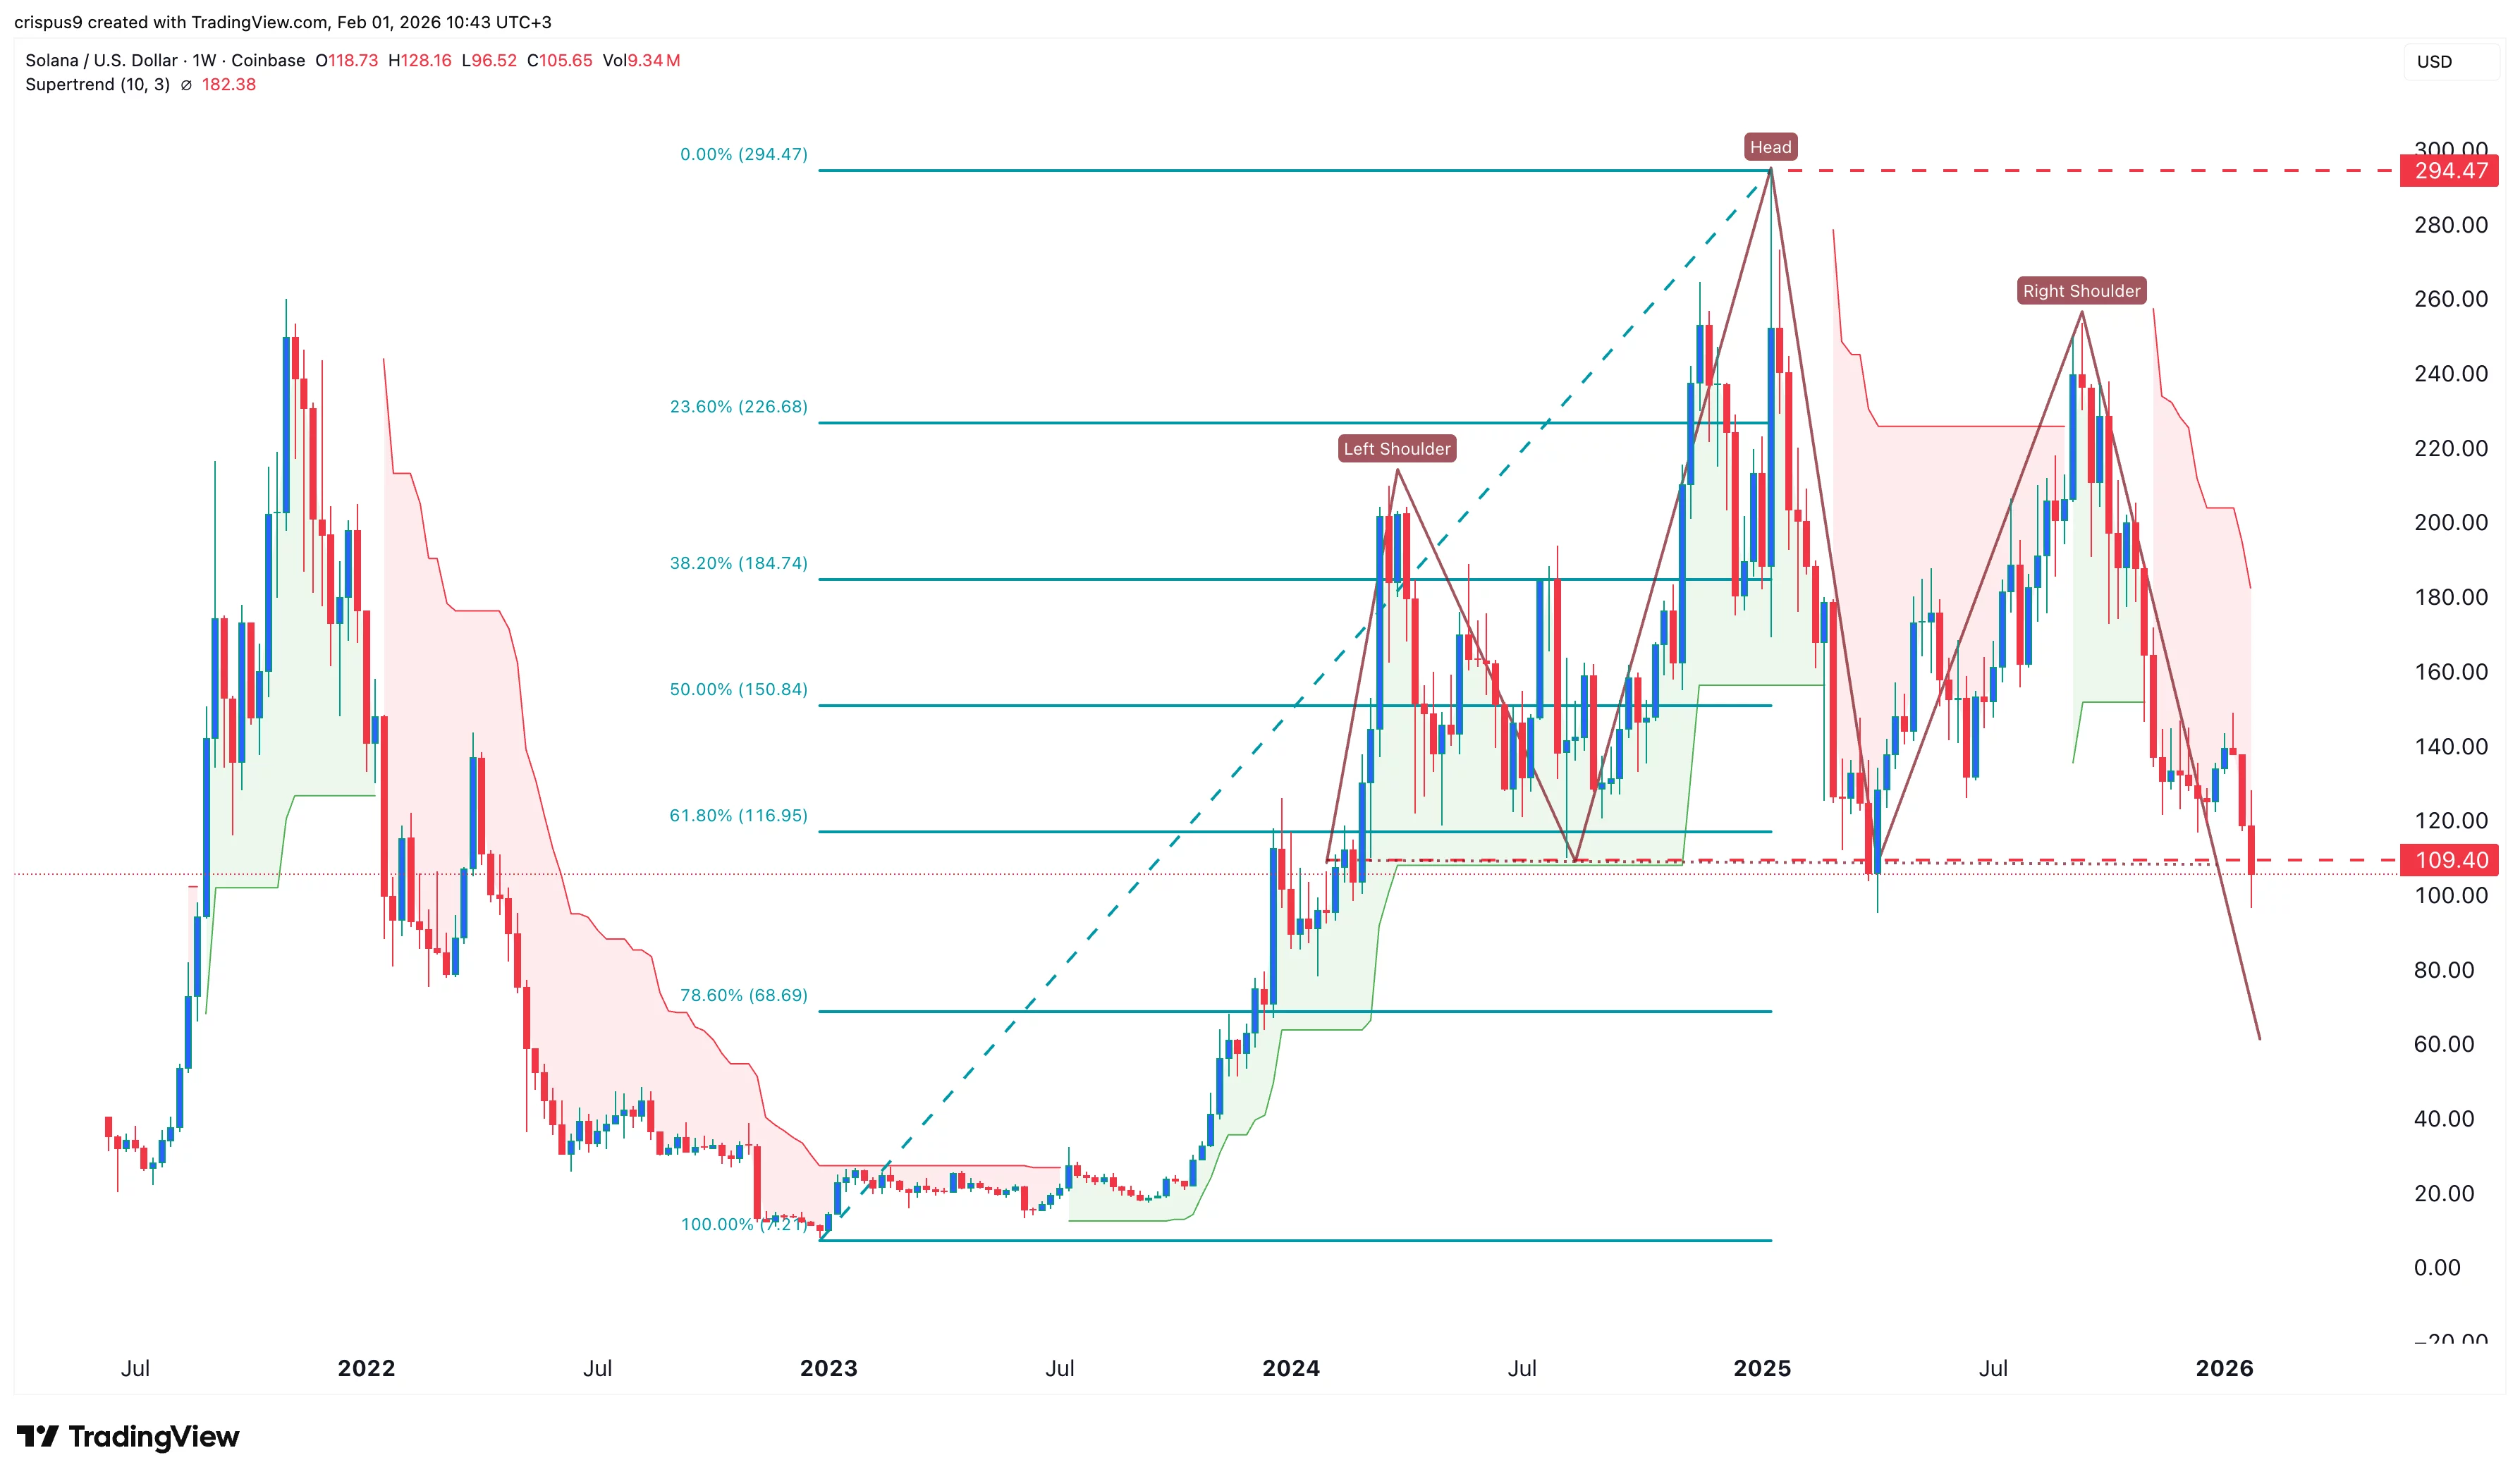
The weekly timeframe chart shows that the Solana price has crashed in the past few months. A closer look shows that it is in the process of forming the highly bearish head-and-shoulders pattern, whose neckline is at $109. It has now moved below the neckline, confirming the bearish outlook.
Solana price has moved below the 50-day and 100-day Exponential Moving Averages and the Supertrend indicator. It has also dropped below the 61.8% Fibonacci Retracement level, confirming the bearish outlook.
Therefore, the most likely scenario is where it continues falling as sellers target the next key target at $70, which is the 78.6% Fibonacci Retracement level.

Crypto World
Why the next phase of stablecoin payments is all about user relationships and distribution


You can’t have missed the stablecoin vibe. While bitcoin and the rest of the crypto market are in the doldrums after falling from record highs in October, everyone else is talking about issuing tokens whose value is fixed, pegged to a real-world asset. Mostly the dollar.
Not only the dollar, of course. This week alone, AllUnity, a German joint venture between DWS, Galaxy, and Flow Trader, issued a Swiss franc-based token (CHFAU) and SBI Holdings and Startale Group introduced a yen version (JPYSC). Earlier this month, Agant said it’s working on a pound stablecoin, and Hong Kong said it plans to start handing out stablecoin licenses in March.
Then there’s the revelation that Mark Zuckerberg-led Meta (META) is looking to add stablecoin-based payment capabilities early in the second half of the year. The company famously tried and failed to introduce the Libra stablecoin, renamed Diem in 2019, in the face of stiff opposition from lawmakers and regulators.
But Meta’s proposed return to stablecoin-based payments later this year bears little comparison with Libra/Diem, according to the co-creator of Libra, Christian Catalini, who is now a professor at MIT and the founder of the MIT Cryptoeconomics Lab.
What’s different now, says Catalini, is that stablecoins are fading into the background, offered by multiple providers and becoming part of the payments infrastructure. The once-hyped businesses of stablecoin issuance and orchestration, or the coordination of payments across different blockchains and conversion between token and fiat for payment purposes, are becoming a commodity, he said.
“Not just Meta, but also Google, Apple, all of them will be using multiple providers, as is the case when they do disbursements of payments,” Catalini said in an interview with CoinDesk. “So I would expect the market to be commodified in the future, rather than a branded stablecoin. In a sense, it’s a sign that the market has matured.”
This sentiment was also voiced by Meta’s VP of communications, Andy Stone, who said the move to bring stablecoin payments back was simply “about enabling people and businesses to make payments on our platforms using their preferred method.”
Billions of users
The real competitive advantage in stablecoins, the moat that holds competitors at bay, now lies in distribution, said Catalini. Whoever owns the direct relationship with the end user will capture the most value. And Meta has billions of users across Facebook, WhatsApp and Instagram, almost 3.6 billion according to its most recent earnings report.
The focus on contacts and reach is a marked change from accruing value by delivering stablecoins to a wallet, or going from fiat to crypto and then back to fiat — the so-called stablecoin sandwich required for regular payment transactions.
This change has started to play out recently, with news about companies walking away from acquiring stablecoin orchestration companies.
It’s also good news for incumbents such as the card networks, fintechs, neobanks and some wallet firms who have an advantage because they actually own the touch point with the end user, Catalini pointed out. Stablecoin payments threaten to cut the lucrative interchange fees payment networks like Visa and Mastercard claim, but the card networks have a significant advantage when it comes to distribution.
“If [the card networks] can commoditize the rails and commoditize the assets, they will be able to defend their business,” Catalini said. “The commoditization of the assets is inevitable — there’s going to be many stablecoins and many banks will want their own — so the rails are where things will get interesting.”
Also in the fray is Stripe, Meta’s long-time payment partner whose CEO Patrick Collison joined Meta’s board of directors a year ago and is a potential vendor that Meta might enlist for its stablecoin project.
The payments giant’s aggressive crypto power plays are not to be underestimated: Stripe bought stablecoin specialist Bridge for $1.1 billion last year, and has built its own blockchain called Tempo.
Still, Catalini questioned whether other firms will flock to a competitor’s blockchain, even if it’s purportedly a public network.
“If you are another big payment service provider, would you want to build on Stripe’s Tempo? Probably not,” Catalini said. “It goes back to the key challenge of making these networks truly open and neutral, which is the entire point of crypto. But of course, it’s a hard one to actually deliver on from a practical perspective, unless you’re building on something already established like Ethereum, Bitcoin, or Solana.”
A bipartisan group of 11 United States senators has pressed federal authorities to scrutinize Binance’s compliance with sanctions and anti-money-laundering rules, citing escalating public scrutiny and a string of contentious reports. In a letter addressed to Treasury Secretary Scott Bessent and Attorney General Pamela Bondi, the lawmakers urged an expedited and thorough assessment of the exchange’s controls and its handling of prior settlement commitments reached in 2023. The missive highlights claims that roughly $1.7 billion in digital assets potentially flowed to Iranian entities tied to terrorism, and points to investigations into Iranian-based accounts and possible evasion of Russian sanctions. The document also notes claims that Binance’s internal responders who flagged suspicious activity faced dismissal, and that law-enforcement agencies have observed a downturn in cooperation from the firm on customer information requests.
Key takeaways
- Eleven U.S. senators asked multiple federal agencies to conduct a prompt, comprehensive review of Binance’s sanctions-and-AML controls and adherence to 2023 settlement terms.
- The letter references allegations of about $1.7 billion in digital-asset flows linked to Iranian entities tied to terrorism, including groups connected to the Houthis and the Islamic Revolutionary Guard Corps.
- Investigators reportedly identified more than 1,500 accounts accessed by users in Iran and possible activity aimed at evading Russian sanctions.
- According to the letter, some Binance staff who flagged suspicious transactions were dismissed, and law-enforcement agencies indicated Binance had become less cooperative in providing customer information.
- Senators warned that newer Binance products, such as payment cards in parts of the former Soviet Union and partnerships tied to stablecoin initiatives, could enable sanctions evasion.
Sentiment: Neutral
Market context: The escalation comes amid growing regulatory focus on exchange compliance and wider scrutiny of sanctions enforcement in crypto markets, with policymakers seeking clearer accountability for cross-border transactions and the robustness of AML controls during periods of heightened geopolitical risk.
Why it matters
The episode underscores the central role of major exchanges in economic sanctions enforcement and the delicate balance between fostering innovation and ensuring lawful conduct. As policymakers scrutinize Binance’s checks and balances, questions about transparency, information sharing with authorities, and the efficacy of enforcement mechanisms come to the fore. The stakes extend beyond one platform: they touch on the credibility of sanctions regimes in the digital asset era and the capacity of regulators to monitor rapidly evolving products, such as payments-linked services and stablecoin-related ventures, that could potentially be exploited for evading sanctions.
The discussions also spotlight the tension between operational secrecy in risk controls and the public interest in accountability. Binance has repeatedly faced questions about how it flags suspicious activity and how it collaborates with law enforcement. The senators’ letter maintains that a rigorous review is warranted not only to evaluate past settlements but to assess how future models—especially card-based products and cross-border partnerships—fit within the existing regulatory framework. In parallel, congressional inquiries have sought documents and internal records related to the exchange’s sanctions controls, signaling a broader push to obtain a clearer image of internal governance at a high-profile crypto venue.
What to watch next
- By March 13, agencies are asked to report on steps taken to examine Binance’s conduct, including the effectiveness of its sanctions controls.
- A congressional inquiry into Binance’s sanctions practices, led by Senator Blumenthal, is expected to yield new documents and testimony from the firm’s leadership.
- Regulators and prosecutors may press Binance for deeper disclosures around past settlements and the handling of suspicious activity reports.
- The exchange’s cooperation with investigators and its stance on Iranian-user activity will be tested as media coverage continues to surface conflicting narratives.
- Market participants will watch for regulatory signals that could shape the adoption and design of crypto-sanctions regimes, especially concerning new products and stablecoins tied to cross-border payments.
Sources & verification
- The letter from 11 senators to Treasury Secretary Scott Bessent and Attorney General Pamela Bondi requesting review of Binance’s sanctions controls: https://www.vanhollen.senate.gov/imo/media/doc/cvh_bessent_bondi_ltr_binance.pdf
- Binance denial of Iran-linked transaction allegations and assertion of cooperation with authorities, as reported to Cointelegraph: https://cointelegraph.com/news/binance-denies-iran-sanctions-report-fortune
- Senator Richard Blumenthal’s congressional inquiry into Binance, including a request for documents related to sanctions controls: https://cointelegraph.com/news/us-senator-probes-binance-iran-russia-sanctions
- Binance CEO’s response to coverage of Iran-related activity and criticisms of a Wall Street Journal report: https://cointelegraph.com/news/binance-ceo-legal-action-report-iranian-entities
Market reaction and key details
Regulators and lawmakers appear intent on mapping Binance’s risk controls against a backdrop of continued scrutiny of the broader crypto ecosystem. While Binance has touted its compliance efforts and stated that it does not permit Iranian users, public narratives surrounding these allegations continue to prompt questions about due diligence, cooperation with law enforcement, and the ability of large exchanges to detect and deter sanctioned activity. The dynamic highlights the ongoing tension between enterprise-level risk management and regulatory expectations as the crypto market seeks clarity on governance and accountability in a landscape that remains highly scrutinized by policymakers worldwide.
Why it matters
The episode reinforces the critical importance of robust sanctions-compliance infrastructures within major crypto platforms. As policymakers seek to close perceived gaps in enforcement and as new product lines expand cross-border capabilities, exchanges face intensified demands for auditable controls and transparent reporting. For users and investors, the developments illustrate the evolving regulatory environment that shapes how digital assets are traded, settled, and monitored for illicit activity. For builders and auditors, there is a clear signal that governance frameworks, risk controls, and cooperative compliance partnerships will be central to sustaining trust in a market that remains under close regulatory watch.
What to watch next
- Potential disclosures from Binance about internal governance, risk controls, and staff retention practices related to compliance investigations.
- Follow-up statements from the agencies expected to participate in the review and any public briefing on sanctions enforcement in crypto across the sector.
- Regulatory guidance or formal actions that could reshape product launches, especially in regions where new payment-card-type offerings are being rolled out.


US Senator Chris Murphy has announced plans to introduce legislation banning prediction markets he described as “corrupt and destabilizing” platforms.
In a February 27 statement, the Connecticut Democrat lawmaker argued that insiders with advanced knowledge of geopolitical events exploit these markets for personal financial gain.
Lawmaker’s Push to Ban Prediction Markets Draws Industry Fire
His announcement builds on concerns he voiced earlier this year regarding the commodification of real-world tragedies.
To illustrate his point, Murphy shared a screenshot of Polymarket betting odds related to military strikes involving Israel and Gaza, noting that the odds shifted amid escalating real-world tensions.
Industry experts, however, say the senator’s proposal conflates heavily regulated domestic exchanges with offshore platforms that the United States has already barred from operating.
Tarek Mansour, co-founder of the federally regulated domestic prediction market Kalshi, directly challenged the senator’s premise.
“Senator, regulated prediction markets are not allowed to do war markets. The market you’re posting is unregulated and offshore,” Mansour stated.
The Commodity Futures Trading Commission (CFTC) strictly prohibits onshore prediction markets from listing derivatives contracts involving terrorism, assassination, or war. These rules also extend to any other activities deemed contrary to the public interest.
Industry advocates argue Murphy is using illegal offshore markets to justify a blanket ban on domestic exchanges that already follow strict regulations to prevent those scenarios.
Adam Cochran, a prominent finance and cryptocurrency analyst, echoed Mansour’s sentiments. Cochran emphasized that offshore platforms offering services to US customers already face aggressive CFTC enforcement actions.
Furthermore, he added that domestic prediction markets operate under rigorous federal oversight specifically designed to prevent the insider trading Murphy aims to stop.
Meanwhile, Murphy’s potential legislative efforts align with the broader regulatory efforts to curb insider trading within the fast-rising prediction market space.
In January, U.S. Rep. Ritchie Torres, D-N.Y., introduced a new bill. The legislation is a targeted ethics measure designed to prevent covered government officials and elected representatives from trading in prediction markets using nonpublic information.

TLDR:
- INJ is down roughly 95% from its macro high and now trades near the $2.70–$1.70 HTF accumulation zone.
- A high-timeframe fair value gap is active at current price levels, signaling a potential re-accumulation structure forming.
- The previous cycle saw INJ rally approximately 4,619% from a similar deep corrective and accumulation base phase.
- Analysts set bull market expansion targets at $80 and $200, with strict invalidation placed at a close below $1.10.
INJ is drawing renewed attention after declining approximately 95% from its macro cycle high. The token is currently trading near $2.96, placing it within a high-timeframe fair value gap.
Market participants are watching this zone closely as a critical accumulation area. The current price structure closely mirrors conditions that preceded a historic 4,619% rally.
Whether history repeats itself depends entirely on key technical levels holding firm on higher timeframes.
Technical Structure Suggests Re-Accumulation Phase Forming
INJ is presently trading inside a high-timeframe fair value gap following a prolonged corrective move. This imbalance zone is being monitored as a primary demand and absorption area by technical analysts.
The price range between $2.70 and $1.70 represents the active HTF accumulation zone for the asset. Continued demand within this range is drawing attention from traders tracking the longer-term structure.
A multi-year descending resistance trendline compression is also forming alongside current price action. Volatility has contracted noticeably, a condition that often comes before a strong expansion move.
Furthermore, a rounded base formation is developing within the imbalance zone at present levels. These combined technical conditions point toward a potential breakout setup building around current price.
Crypto analyst CryptoPatel shared a detailed breakdown of the setup on social media, stating that INJ is “trading inside a HTF FVG after a ~95% corrective move from its macro high.”
The structure is framed as an accumulation versus invalidation zone. The setup remains constructive as long as INJ holds above $1.10 on a high-timeframe close basis. A breach of that level would serve as strict invalidation for the entire thesis.
Historical Precedent and Macro Expansion Targets Under the Microscope
The 2023–2024 cycle for INJ delivered an impulsive rally of approximately 4,619% from its accumulation base. That advance followed a deep corrective phase before the asset moved into a parabolic expansion.
The current market structure bears a close resemblance to the conditions that preceded that historic move. As a result, analysts are drawing direct parallels between the two market cycles.
The 2024–2026 correction has since brought INJ down roughly 95% from its peak. This decline has repositioned the price back into what technicians describe as a re-accumulation phase.
The zone between $2.70 and $1.70 continues to serve as the primary area for order flow absorption. Meanwhile, the sub-$1.10 region is identified as a secondary demand zone if price invalidates the current setup.
Bull market expansion targets outlined in the analysis point to $80, followed by a macro projection of $200. These targets are contingent on INJ maintaining its technical structure above current support.
A high-timeframe close below $1.10 would fully negate the re-accumulation thesis. Until then, the setup remains one closely watched by technical traders and market observers alike.


Buterin proposes replacing consensus-layer BLS signatures with hash-based schemes, such as Winternitz variants.
Ethereum co-founder Vitalik Buterin has shared a quantum resistance roadmap for the ecosystem.
This follows the identification of post-quantum readiness as a critical consideration across several areas of development.
Quantum Security Upgrades
In a post shared on social media, Buterin outlined specific parts of the network that could face vulnerabilities from advances in quantum computing, including consensus-layer BLS signatures, data availability systems using KZG commitments and proofs, externally owned account signatures based on ECDSA, and application-layer zero-knowledge proofs such as KZG or Groth16.
He went on to propose technical approaches to address these risk areas as part of a quantum resistance roadmap. For example, he suggested strengthening consensus-layer security by swapping BLS signatures for hash-based options like Winternitz variants, while using STARK-based aggregation to enable quick verification.
Buterin explained that this is because the transition toward lean consensus and finality could reduce the number of required signatures per slot, potentially eliminating the need for aggregation in early stages.
As part of this process, the network would also need to choose a long-term hashing method, selecting from several available options to ensure strong, reliable security in the future.
The Ethereum developer also suggested changing how the protocol stores and shares data across the system by introducing a newer method that is designed to improve long-term security. However, he noted that this adjustment would require additional technical work to handle larger verification processes.
You may also like:
Protocol-Level Adjustments
For externally owned accounts, Buterin wants to introduce native account abstraction through EIP-8141, a change that would allow them to support multiple signature methods, including those designed to withstand quantum threats.
Current ECDSA signature verification costs about 3000 gas, while quantum-resistant alternatives are far more resource-intensive and could require around 200,000 gas. Despite being expensive, he believes that ongoing improvements are expected to make them more efficient.
Additionally, the protocol plans to use aggregation techniques that combine many signatures into a single verification step in the long term to reduce the overall network load.
The roadmap also discusses proof systems, which play a role in validating transactions and applications on Ethereum. Similarly, while existing ZK-SNARK verifications are relatively efficient, quantum-resistant STARK proofs come with much higher costs.
To address this, he outlined a solution under EIP-8141 that would allow multiple transaction checks to be bundled and verified through a single proof before reaching the blockchain, reducing on-chain computation and improving scalability.
Last month, the Ethereum Foundation announced that the ecosystem’s next phase will prioritize expanding network capacity while maintaining long-term security and resilience.
Binance Free $600 (CryptoPotato Exclusive): Use this link to register a new account and receive $600 exclusive welcome offer on Binance (full details).
LIMITED OFFER for CryptoPotato readers at Bybit: Use this link to register and open a $500 FREE position on any coin!
TLDR:
- Bitcoin dropped 48% from ~$126K in Oct 2025, now trading near $66K amid heavy negative sentiment.
- U.S. holds 328,372 BTC in its Strategic Reserve; states like Texas, Arizona, New Hampshire joined in.
- Institutions absorbed ~697K BTC in 2025, over 4x the ~164K BTC produced post-halving that year.
- Only ~3.02M BTC remain on exchanges; ETFs and Strategy alone control ~1.97M of that supply.
Bitcoin is trading near $66,000, down roughly 48% from its October 2025 peak of approximately $126,000. Sentiment across crypto markets has turned sharply negative.
Headlines suggest the rally is finished and the momentum has faded. But a closer look at who owns Bitcoin tells a very different story.
Sovereign Governments and Institutions Are Buying Bitcoin at Record Levels
The United States now holds 328,372 BTC in its Strategic Bitcoin Reserve. Texas has gained exposure through a Bitcoin ETF. New Hampshire and Arizona have both passed reserve legislation. More states are moving toward similar positions.
Internationally, Abu Dhabi’s sovereign wealth fund Mubadala disclosed a significant Bitcoin ETF position. That marks a notable shift. Sovereign capital is no longer observing from the outside.
Corporate treasuries have accelerated alongside government buying. Strategy alone holds approximately 713,000 BTC. Institutions absorbed roughly 697,000 BTC throughout 2025, according to available data.
Post-halving, Bitcoin produces only about 164,000 new coins per year. That means institutional demand in 2025 ran at more than four times the rate of new supply.
Bitcoin’s Tradeable Supply Is Shrinking as Strong Hands Absorb the Float
Approximately 20 million BTC have been mined to date. Only about 3.02 million currently sit on exchanges. That is the pool available for active trading.
ETFs hold roughly 1.26 million BTC. Strategy holds around 713,000 BTC. Combined, those two categories control approximately 1.97 million BTC. That figure represents close to two-thirds of current exchange supply.
Bitcoin is not priced on total coins in existence. It clears on the small fraction still available to buy. That available fraction keeps contracting.
Price reflects fear. Supply structure reflects absorption. The divergence between those two signals is growing wider, not narrower.
Post shared by analyst David on X, framing it as an ownership shift story rather than a price story. The data support that framing. Buyers are not retail traders chasing momentum. They are governments and institutions with long holding horizons.
When scarce assets migrate to holders who do not face selling pressure, price dynamics change. The margin where Bitcoin actually trades keeps getting thinner.
Crypto World
Ethereum Price Hits Critical 5Y Volume Support Zone: Is a Multi-Month Reversal Setting Up?

TLDR:
- Ethereum is testing a major five-year high-volume node between $1,850 and $2,000 on the monthly chart.
- The latest monthly candle prints a long lower wick, signaling active defense by larger market participants.
- ETH structure remains heavy with lower highs from $4,000, keeping resistance firm between $2,700 and $3,600.
- On-chain transaction data mirrors the 2017 cycle pattern, which preceded a sustained one-year bull market run.
Ethereum is at a critical inflection point after tapping a major five-year volume node on the monthly chart. The asset was trading at $1,901.69 as of writing, down 2.09% in the last 24 hours.
The seven-day decline stands at 4.33%, with trading volume at $20.23 billion. Market participants are closely watching this zone. The monthly reaction here is expected to define the next multi-month directional move for ETH.
Ethereum Price Taps Key Demand Zone With Long Lower Wick on Monthly Chart
Ethereum at a critical inflection point means price is now testing the $1,850–$2,000 high-volume node on the monthly timeframe.
This zone has drawn heavy market participation over the past five years. Large positions were historically built here, giving it structural demand characteristics rather than acting as a random support level.
Analyst Bitcoinsensus noted that the latest monthly candle prints a long lower wick within this region. That pattern reflects aggressive buying activity below the support area. It suggests that larger participants are actively absorbing sell pressure and defending the zone.
However, a wick alone reflects reaction, not a confirmed reversal. The broader structure still carries weight from above, showing a pattern of lower highs from the $4,000+ region. ETH continues to trade beneath prior range resistance between $2,700 and $3,600.
Until momentum shifts and price reclaims the mid-range area, downside risk cannot be ruled out. A confirmed hold above $1,850 on a monthly close would support a move toward $2,700. From there, an expansion toward $3,300–$3,600 becomes the next area of interest.
On-Chain Transaction Data Draws Parallel to Ethereum’s 2017 Market Cycle
On-chain analyst CW8900 observed that Ethereum transaction activity is mirroring patterns seen during the 2017 cycle.
That period saw an explosive rise in ETH transactions, followed by a sharp decline. The correction eventually gave way to a roughly one-year bull market run.
The current setup shows a similar sequence. After a surge in transaction activity, ETH has experienced a notable price pullback. This parallel is drawing attention from analysts who monitor long-term cycle behavior on-chain.
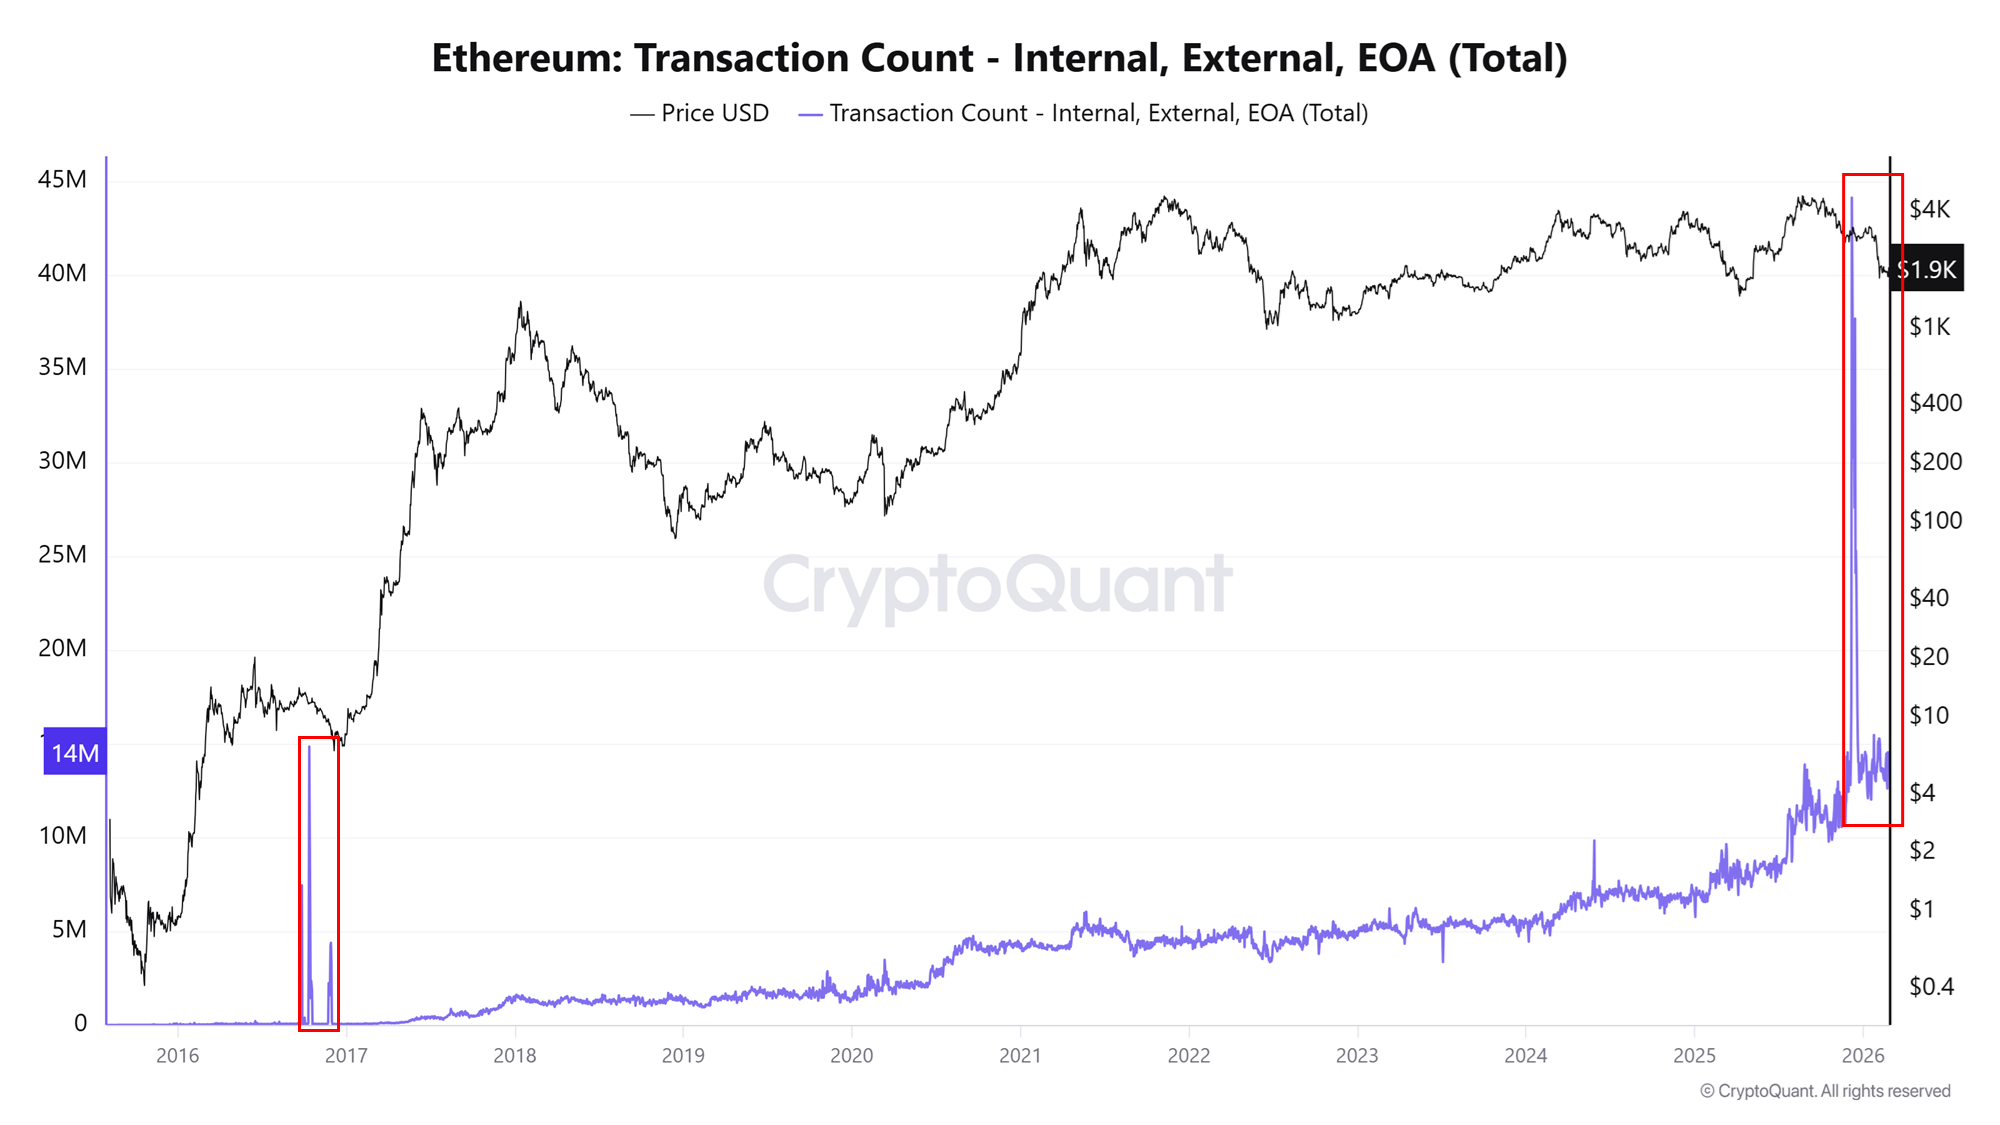
Source: Cryptoquant
If history follows a similar path, the next phase could bring renewed bullish momentum for Ethereum. That said, historical patterns serve only as reference points.
Market structure and macro conditions today differ from those in 2017 in meaningful ways.
For now, Ethereum remains at a macro decision point. Acceptance below $1,850 on a monthly close would open the path toward the $1,500 level relatively quickly.
The price action over the coming weeks will be essential in confirming which direction the market commits to from this key zone.
TLDR:
- PYUSDx allows developers to launch application-specific stablecoins backed by PayPal USD without building full issuance systems.
- The platform combines MoonPay distribution tools with M0’s token framework for faster stablecoin deployment.
- PYUSDx tokens remain separate from PayPal and Paxos products and cannot be used inside PayPal or Venmo apps.
- USD.ai is the first project using PYUSDx to power a stablecoin designed for AI infrastructure payments.
Thestablecoin market is shifting toward tokens built for specific apps and ecosystems. MoonPay, M0, and PayPal have introduced PYUSDx as new infrastructure for issuing application-focused stablecoins.
The platform connects PayPal USD with developer tools designed for faster deployment. The move reflects rising demand for branded stablecoins that avoid complex back-end setup.
PYUSDx platform targets application-specific stablecoin growth
PYUSDx allows developers to create their own stablecoins backed by PayPal USD without building full issuance systems. The platform combines M0’s token framework with MoonPay’s distribution infrastructure.
According to a joint announcement from MoonPay and M0, the goal is to shorten launch timelines from months to days. Developers can issue branded tokens tied directly to PYUSD reserves.
The companies pointed to data showing a sharp increase in new stablecoins exceeding $10 million in supply during 2025. That trend signals growing interest in application-level monetary systems.
PayPal described the initiative as part of a broader shift toward building financial tools directly inside apps. PYUSDx supports this approach by offering a standardized base layer for developers.
The framework also aims to reduce regulatory and operational complexity. PYUSD itself is issued by Paxos Trust Company, giving the backing asset a regulated foundation.
How PYUSDx connects developers to PayPal USD liquidity
PYUSDx functions as a tokenization and issuance framework operated by MoonPay Digital Assets Limited. It enables third parties to create new stablecoins that remain fully backed by PayPal USD.
The platform supports cross-chain compatibility through M0’s ecosystem. Developers can deploy tokens across multiple blockchain networks using the same underlying reserve asset.
Reserve transparency forms another core feature. PYUSDx includes on-chain reporting tools and validation processes designed to show backing assets clearly.
The first project building on PYUSDx is USD.ai. The company is developing a stablecoin for payments tied to AI infrastructure services.
Regulatory distinctions remain central to the rollout. PYUSDx tokens are not issued by PayPal or Paxos and do not function inside PayPal or Venmo accounts.
MoonPay stated that licensing and compliance depend on the jurisdiction where each token launches. Responsibility remains with each issuer using the framework.
The companies framed PYUSDx as infrastructure rather than a consumer product. Its purpose is to let developers focus on product design while relying on existing stablecoin rails.
By connecting branded tokens to PayPal USD liquidity, the platform seeks to streamline how applications integrate stablecoin payments and settlements.
XRP price has remained under pressure since the beginning of 2026, extending a steady downtrend that started in early January. The altcoin has repeatedly failed to reclaim major resistance levels.
Weak macro sentiment and geopolitical tensions have limited upside momentum across the broader crypto market. Despite the ongoing decline, several historical and on-chain indicators suggest XRP may be approaching a turning point.
XRP Holders’ Losses Near End
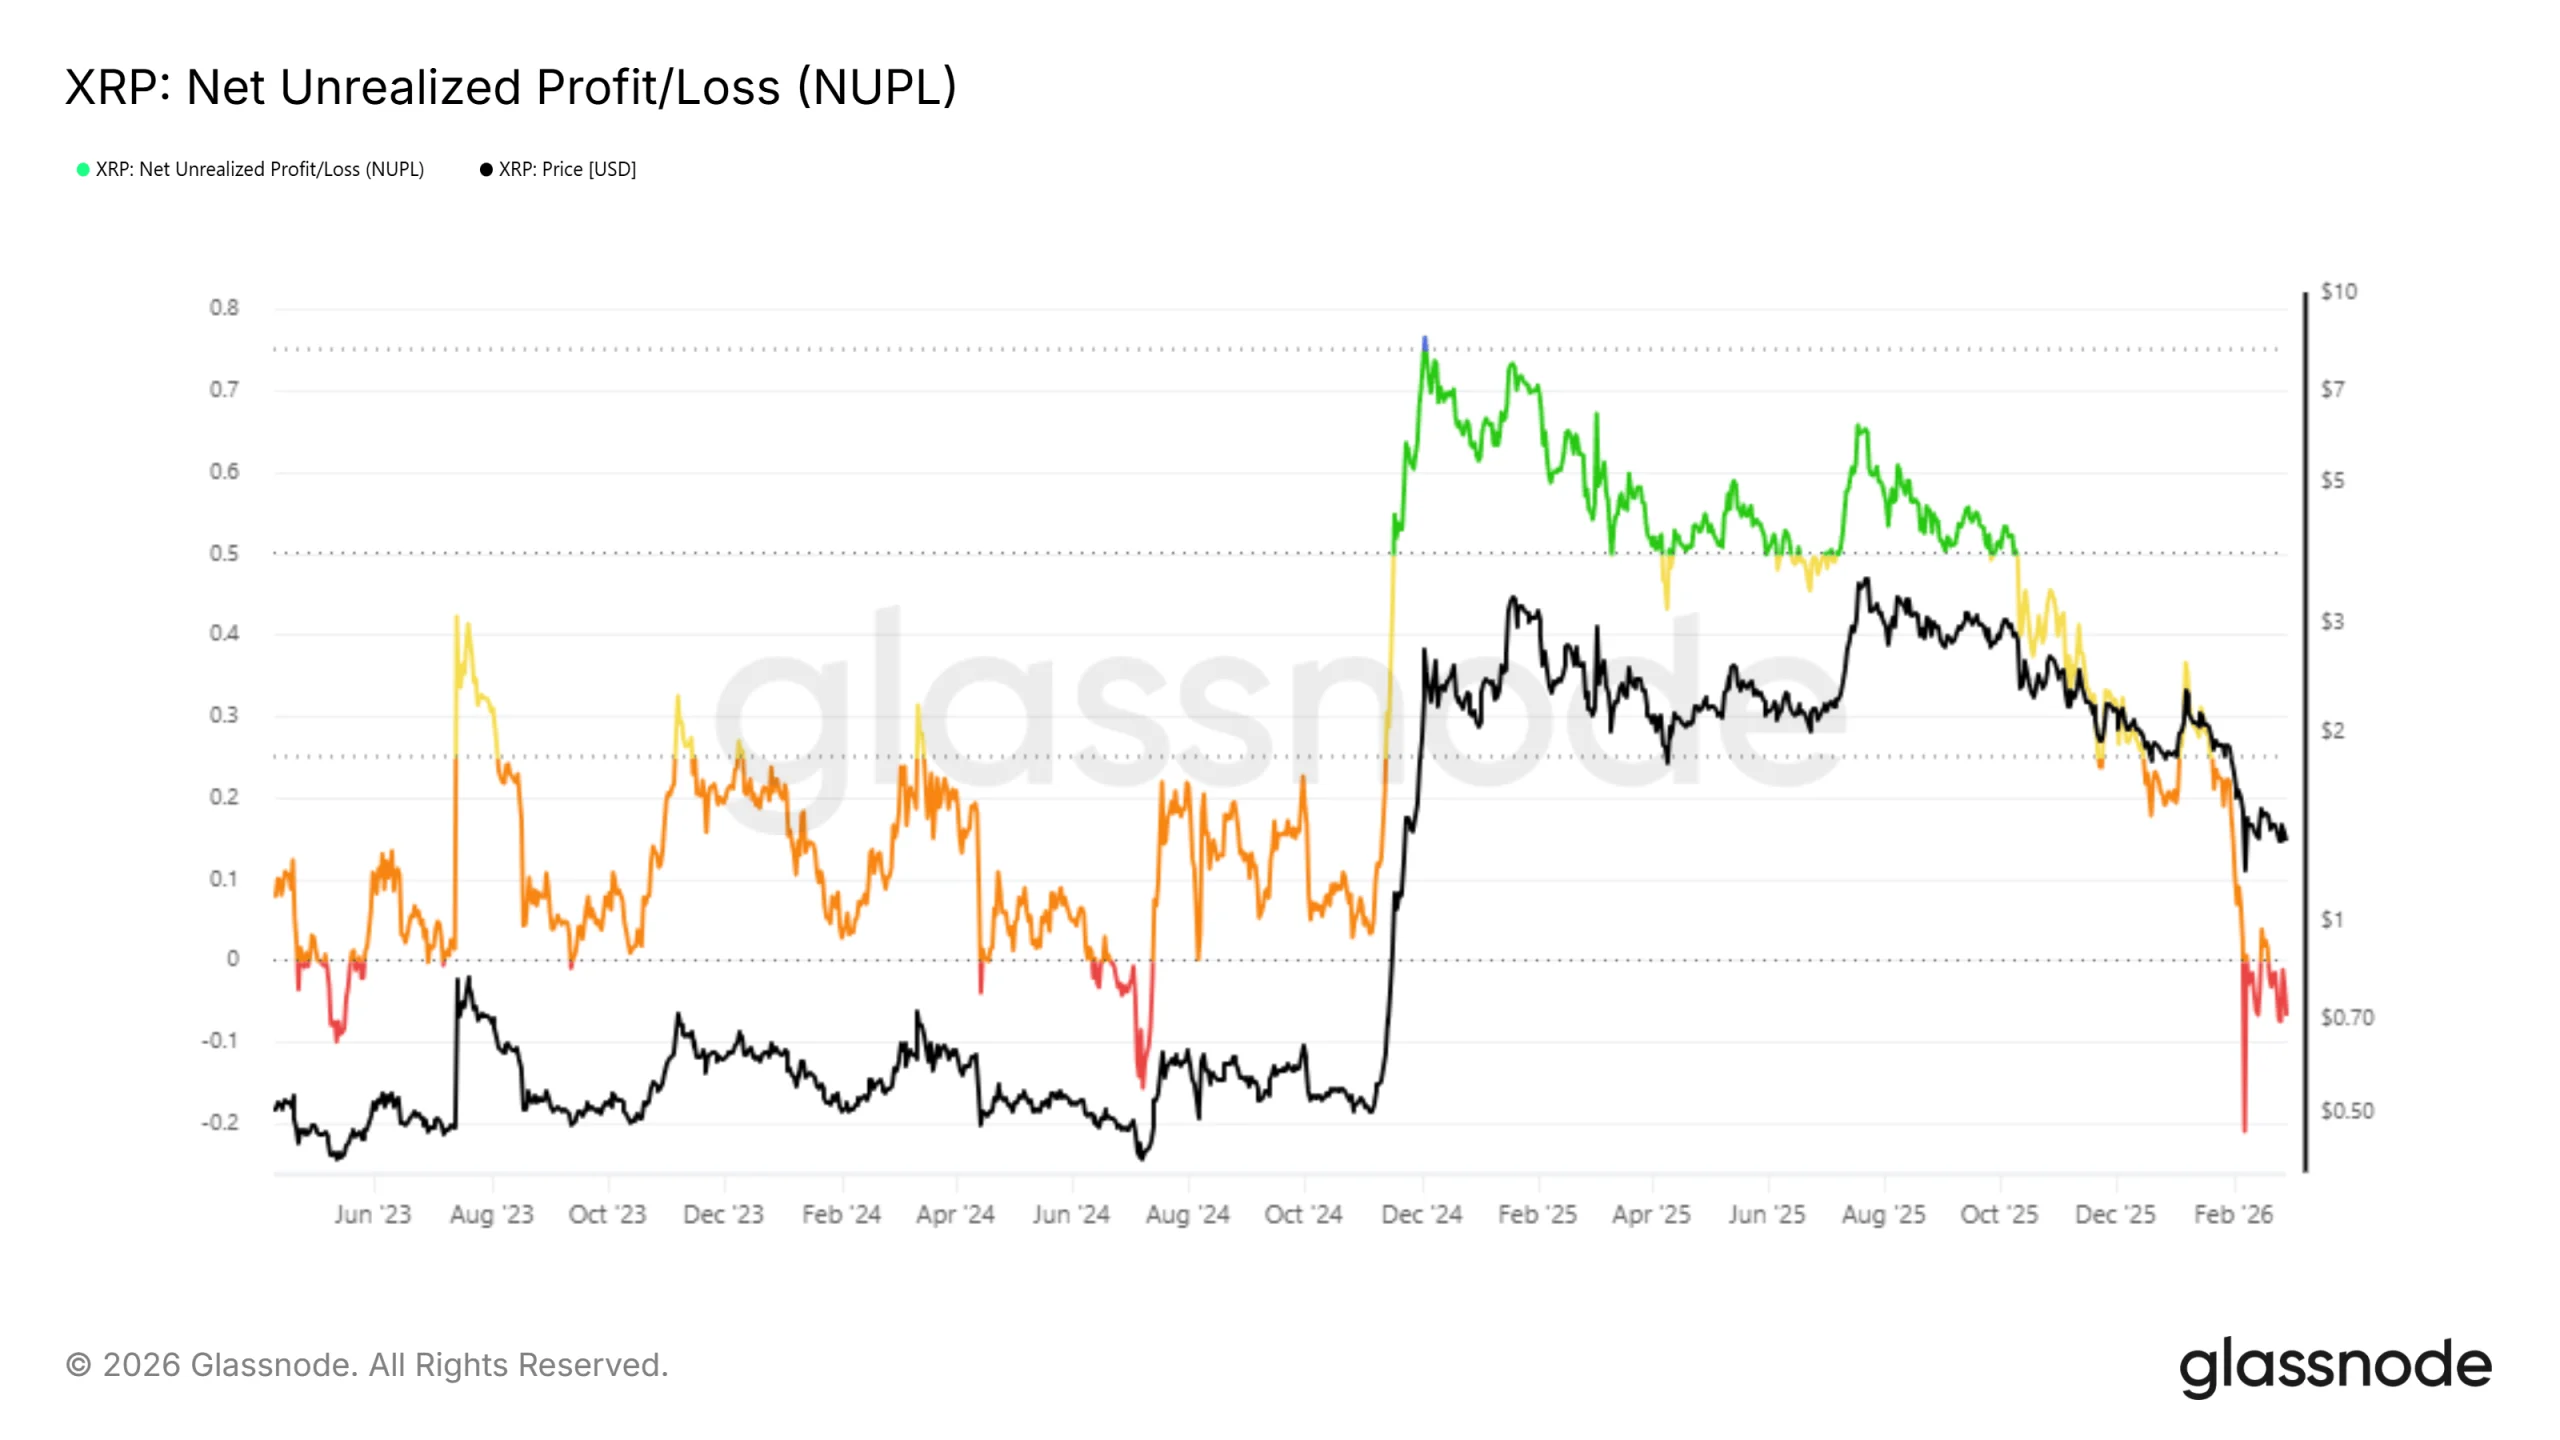
The Net Unrealized Profit and Loss indicator shows XRP remains in capitulation territory. This phase reflects that a majority of holders are sitting on unrealized losses. Capitulation typically marks the late stage of a downtrend rather than the beginning.
Historically, XRP’s capitulation phases have lasted close to one month before reversing. The current stretch began at the start of February. If prior patterns repeat, this period could end for the XRP price in the first week of March. A reduction in panic-driven selling would allow price stabilization and open the door to recovery.
Want more token insights like this? Sign up for Editor Harsh Notariya’s Daily Crypto Newsletter here.

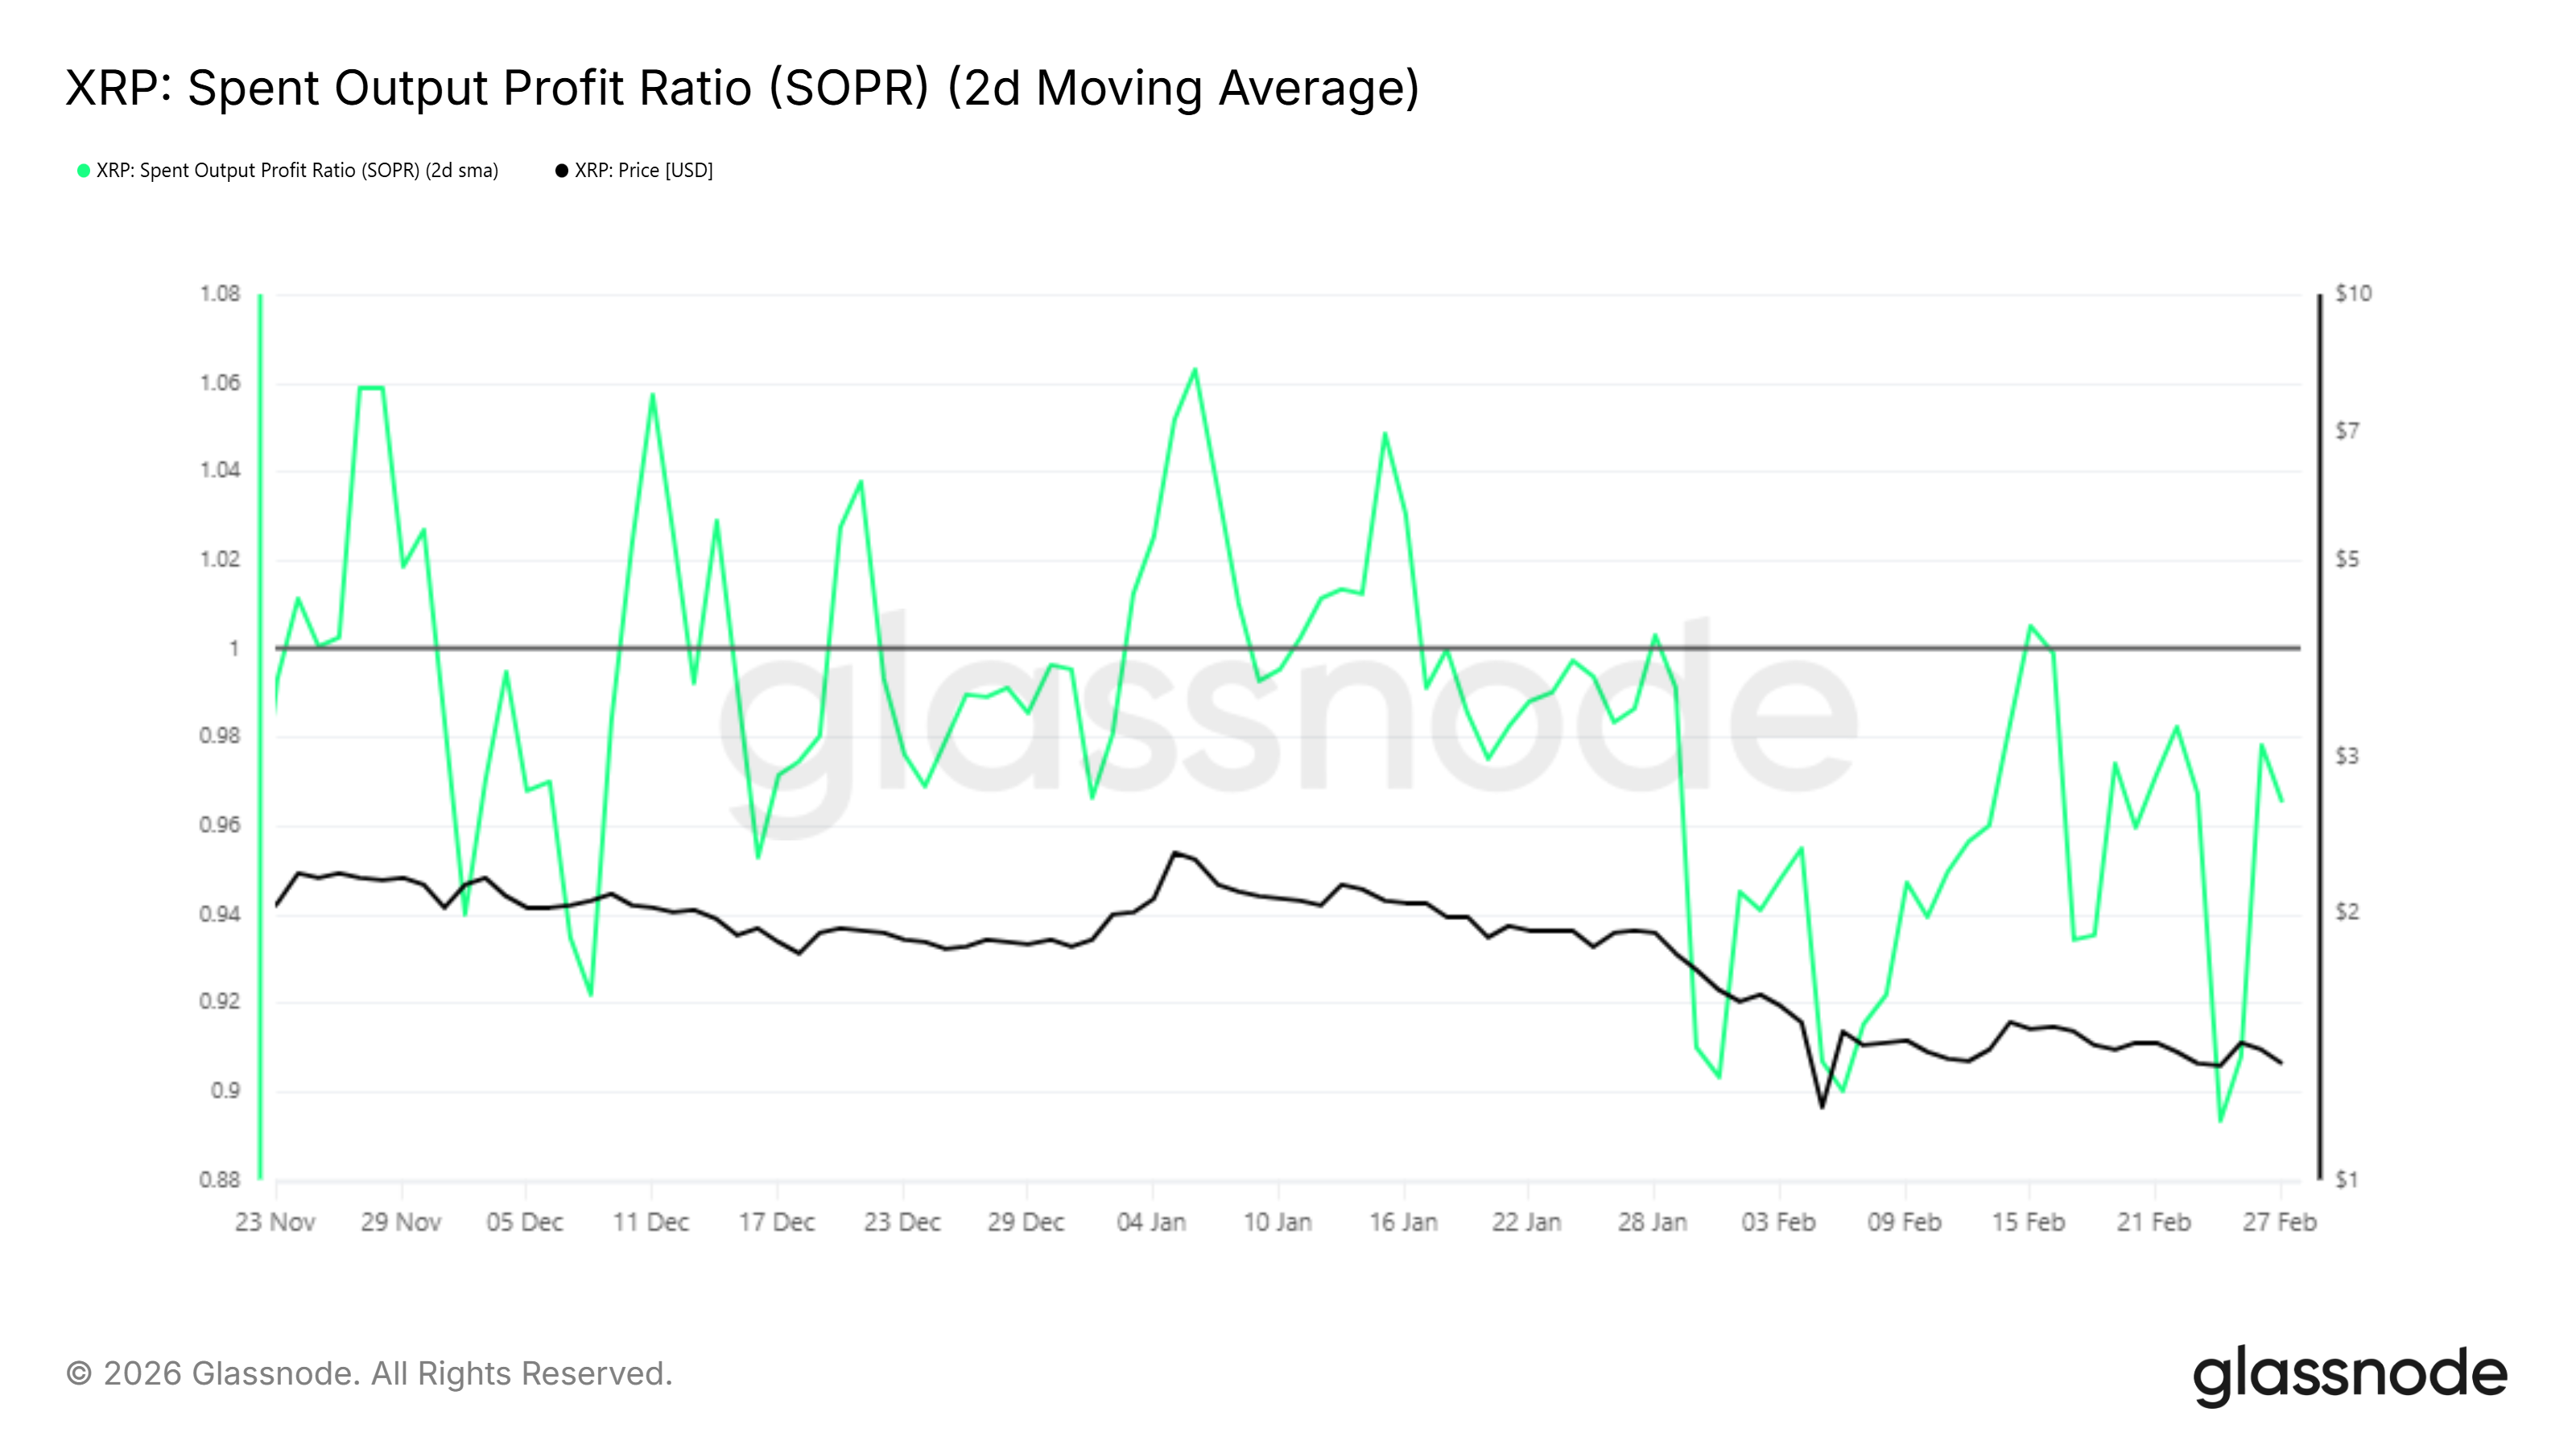
The Spent Output Profit Ratio, or SOPR, confirms that many XRP holders are still selling at a loss. A brief move above 1 occurred in mid-February, signaling temporary profitability. However, the metric quickly fell back below 1, showing renewed selling pressure.
SOPR approaching the 1 level again is significant. A sustained move above this threshold would indicate that coins are being sold at a profit. Historically, this shift often coincides with early recovery phases. If selling continues to saturate, the XRP price may gain room to rebound.
What Does XRP’s Past Say?
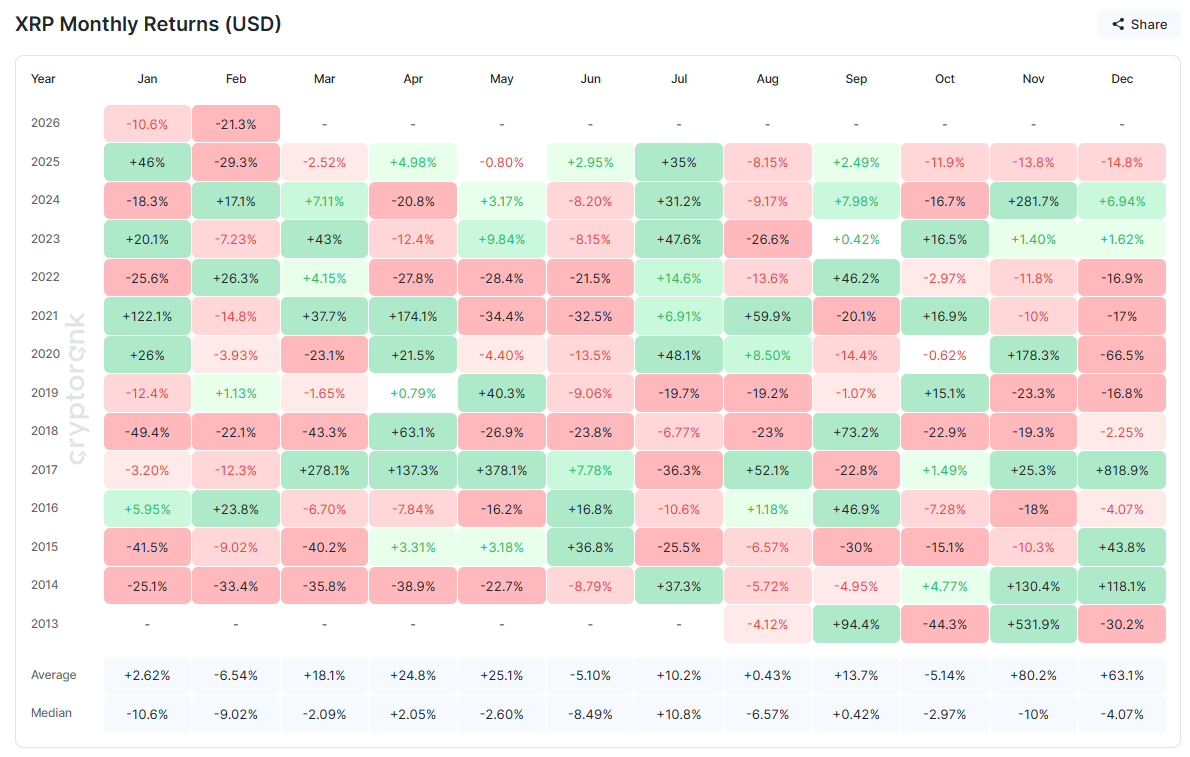
Seasonality data shows that over the past 12 years, March has delivered an average 18% return for XRP. This makes it statistically the strongest month in the first quarter.
While past performance does not guarantee future gains, historical trends matter. However, external risks remain. Escalating geopolitical tensions involving the US and Israel could affect risk appetite. Broader financial instability may delay seasonal bullish tendencies.
XRP Price Levels To Watch
XRP is trading at $1.29 at the time of writing, holding above the critical $1.27 support level. This level aligns with the 23.6% Fibonacci retracement, often referred to as the bear market support floor. Maintaining this threshold is essential to prevent a deeper correction.
If capitulation ends and macro conditions stabilize, XRP could bounce from $1.27 and challenge the descending trendline active since January. A move above $1.51 would confirm a structural shift. This level also coincides with the 61.8% Fibonacci retracement, a key recovery benchmark.
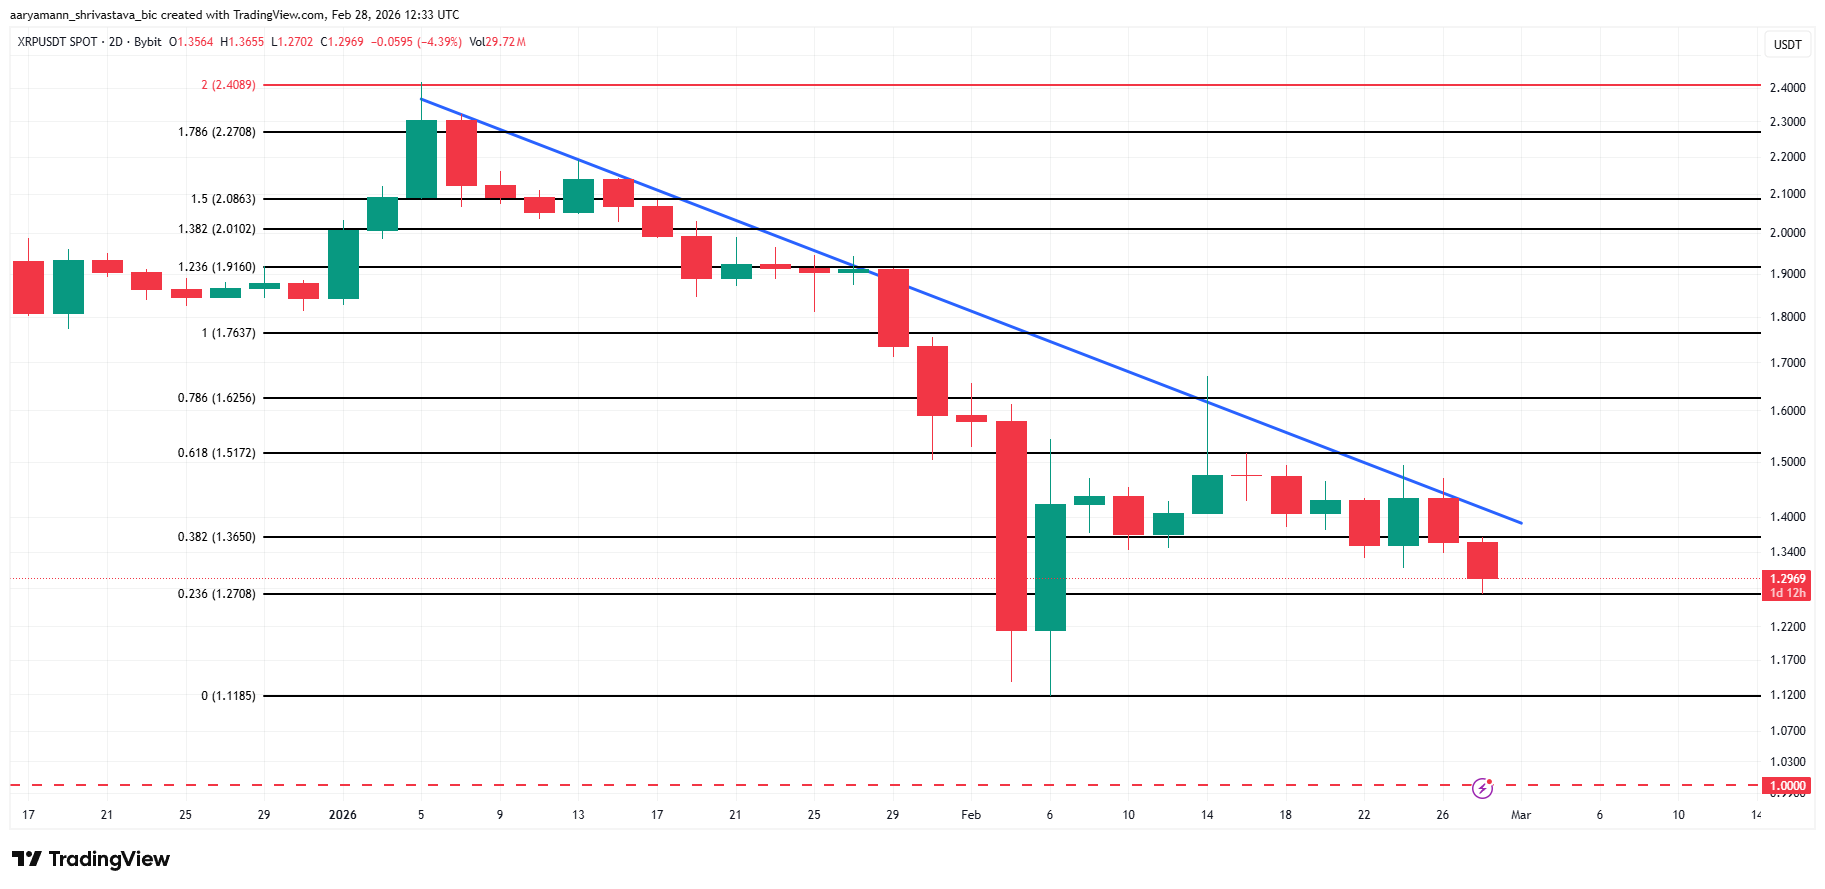
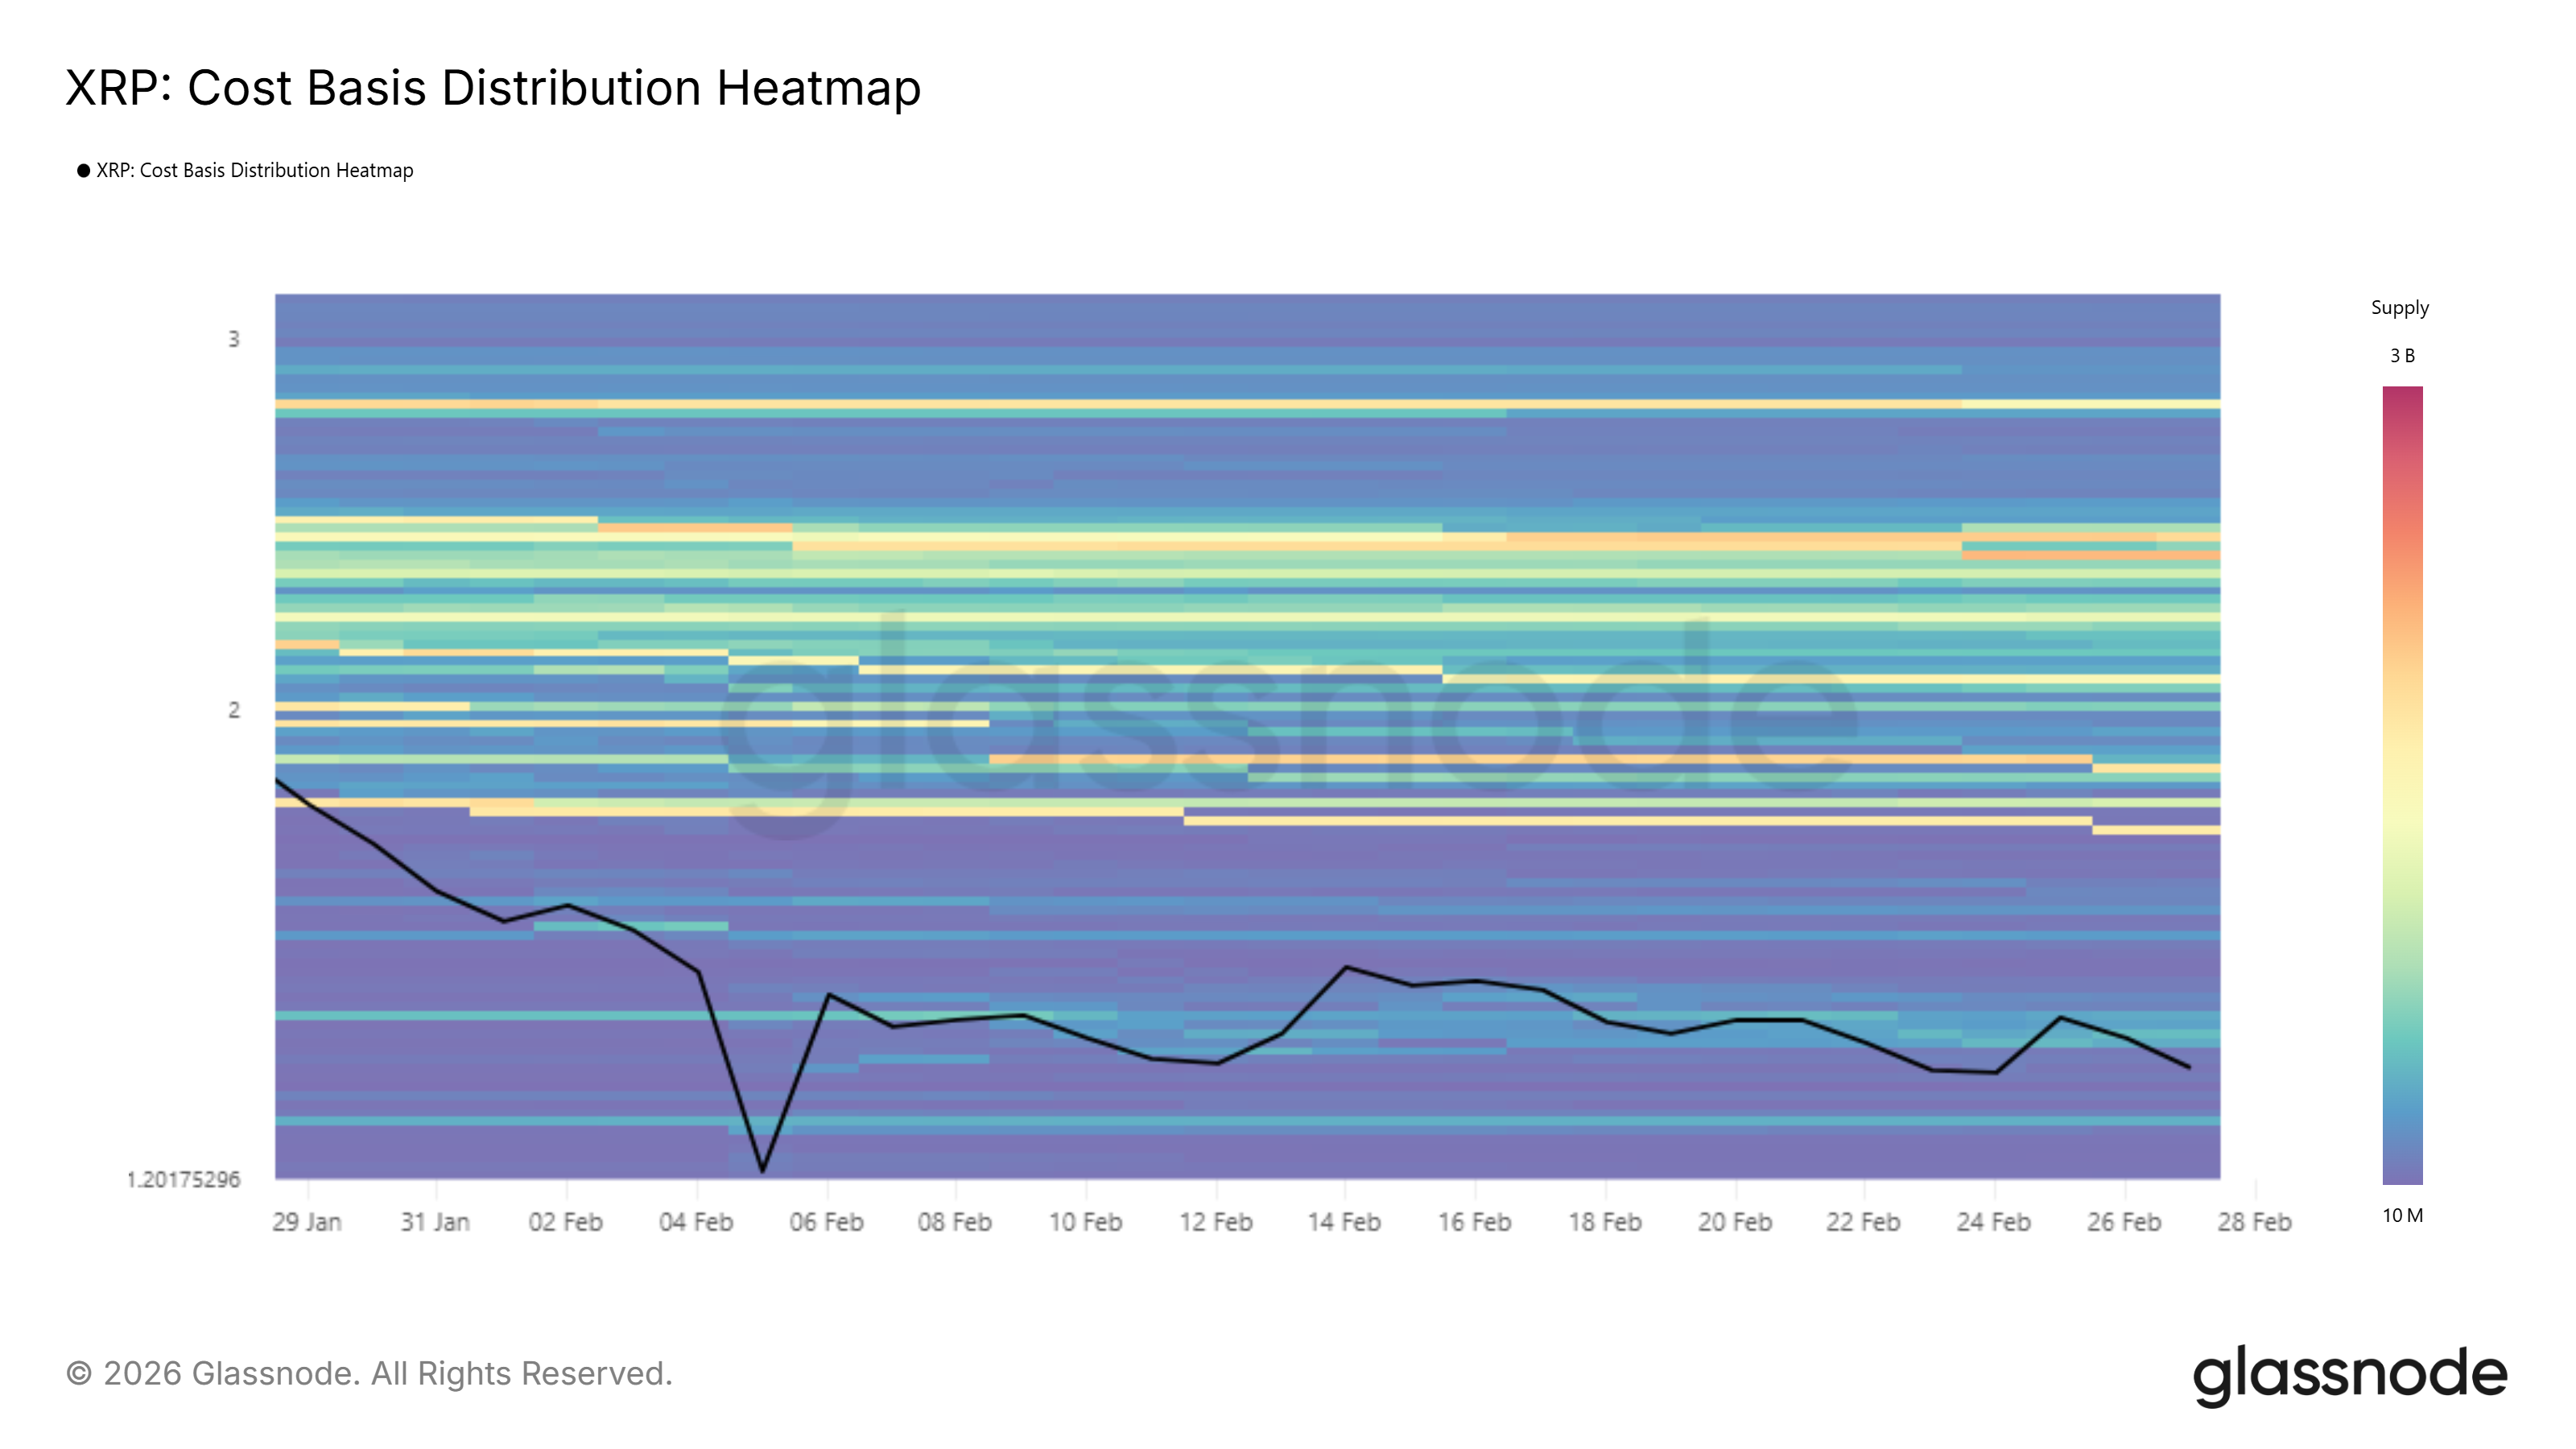
On-chain data suggests limited resistance until the $1.76 to $1.80 range. Approximately 1.85 billion XRP were accumulated within this zone, valued at nearly $2.83 billion. Holders who bought there may sell to break even, creating temporary resistance.
However, failure to hold $1.27 would invalidate the bullish outlook. A breakdown below the bear market support floor could send XRP toward $1.11. Continued sideways consolidation remains possible if global uncertainty persists. For now, March presents both risk and opportunity for XRP price recovery.

Bitcoin (CRYPTO: BTC) has repeatedly tested patient investors, and a long-hold thesis appears increasingly robust when examined through multi-year price histories. A Bitwise Europe study looking at BTC’s price data from mid-2010 through early 2026 finds that the odds of ending a multi-year position in the red shrink dramatically as the holding window extends. In particular, three-year holders show a loss probability of just 0.70%, with even smaller risk over longer horizons. The findings map onto a broader narrative: while near-term volatility and macro headwinds persist, the longest-dated exposure has historically delivered favorable outcomes for those who ride out cycles. The debate around price targets for 2026–2027 remains lively among analysts and researchers, with forecasts ranging widely.
Key takeaways
- A three-year BTC holding has a 0.70% chance of ending in loss; five-year horizons drop to 0.2%, and ten-year horizons sit at 0% based on the Bitwise Europe dataset covering July 2010–Feb. 11, 2026.
- Shorter horizons carry higher risk: intraday BTC positions were 47.1% underwater, with the probability staying elevated at 44.7% over one week, 43.2% over one month, and 24.3% over a one-year window.
- As of a recent Saturday, BTC traded near $65,000 after a roughly 50% decline from the October 2025 peak; the three-to-five year realized price sits around $34,780, meaning long-hold investors in that window remain roughly 90% in profit.
- Cost-basis insights show the depth of drawdowns varied by holding period: those in the 6–12 month band carried a cost basis near $101,250, while the 1–2 year cohort hovered around $78,150, illustrating how longer horizons dampen drawdowns during corrections.
- Forecasts for 2026–2027 remain divergent. Bernstein has kept a bullish target of $150,000 for 2026, while Standard Chartered warns of potential downside toward $50,000 amid weak ETF flows before a recovery toward $100,000 by year-end. Timothy Peterson’s framework points to around $122,000 by early 2027, with odds skewing toward a level above that mark. Some analysts even flag a scenario where a drop toward $30,000 could intensify, should negative forces persist.
Tickers mentioned: $BTC
Market context: The analysis arrives as the macro backdrop and spot-Bitcoin ETF dynamics shape liquidity and sentiment. While near-term moves remain volatile, the data emphasize a structural resilience for long-duration exposure, complicating calls that rely solely on short- or medium-term price actions.
Why it matters
The central takeaway for investors weighing risk and time horizons is that holding Bitcoin for longer stretches has historically reduced downside risk. The Bitwise Europe analysis synthesizes decades of price history to illustrate a simple trade-off: time in the market tends to smooth out volatility and limit losses, even as drawdowns occur along the way. For market participants who favor patient exposure over quick wins, the results reinforce the strategic value of a multi-year horizon when assessing BTC’s risk profile.
But the narrative is nuanced. While long-hold cohorts show impressive downside resistance, shorter-term traders faced meaningful drawdowns during correction cycles. The intraday and weekly metrics underscore that market timing remains a challenging game. Investors who entered positions within the last year or two found themselves under considerable pressure during bear-market rallies and capitulation phases. The realized-price framework adds another layer: even as Bitcoin’s price dips, the difference between current levels and multi-year realized prices can offer a proxy for whether a given entry remains profitable on a longer horizon.
What to watch next
- Track ETF flows and price action around key levels: Bernstein notes modest net outflows from spot Bitcoin ETFs (around 7%), a dynamic that could influence near-term price action.
- Watch for potential downside catalysts: some scenarios point to BTC testing the $30,000 region if macro and ETF dynamics worsen further, which would compress the cushion for long-term holders.
- Observe longer-horizon projections evolving: Peterson’s model suggests roughly $122,000 by early 2027, while other analysts maintain targets near six figures or higher depending on liquidity conditions and risk sentiment.
- Monitor realized-price indicators as a gauge of profitability across aging cohorts: data from Glassnode’s realized-price-by-age charts help contextualize whether current prices justify holding or adding to positions over time.
Sources & verification
- Bitwise Europe research lead Andre Dragosch’s data referencing BTC price history from July 17, 2010, to February 11, 2026, showing loss probabilities by holding period. Link: X post.
- Glassnode data on BTC realized price by age, used to illustrate realized-profit dynamics across holding windows: Realized price by age.
- Bernstein’s price target for Bitcoin at $150,000 in 2026: Bernstein analysis.
- Standard Chartered commentary on ETF flows and BTC price implications, including a potential move toward $50,000 and a recovery toward $100,000 by end-2026: Standard Chartered note.
- Timothy Peterson’s historical price-metric projection of around $122,000 by early 2027: Peterson model.
- Analyses discussing a potential price bottom around $30,000: BTC to $30k discussion.
Market reaction and key details
Bitcoin’s long-hold resilience narrative sits at the intersection of empirical price histories and forward-looking forecasts. The Bitwise Europe findings underscore a fundamental principle of risk management in crypto: time can be a mitigating factor against pronounced drawdowns, particularly for assets with long and volatile price trajectories like BTC. As of the latest data points, the price remains well above the 3–5 year realized-price band, suggesting investors who carried positions across that horizon stayed financially advantaged despite recent declines. Yet, with near-term price action vulnerable to ETF flow shifts and macro surprises, the timing of new entries or additions warrants careful consideration.
What this means for investors and the market
For builders and institutions, the message is clear: a multi-year exposure approach continues to be a meaningful risk management lever, provided entrants understand that near-term volatility can erase short-term gains. For traders and retail participants, the findings reinforce the importance of horizon management—knowing when to trim, when to accumulate, and how to interpret realized-price signals that contextualize profitability over time. As the debate over BTC’s fair value stretches into 2027, the balance between outflows from ETF products, macro momentum, and the technical price regime will increasingly shape the space. The data do not guarantee outcomes, but they do illuminate how holding patterns have historically influenced risk and reward in one of crypto’s most scrutinized markets.
What to watch next
- ETF flow dynamics and their impact on spot BTC liquidity (watch for updates on net inflows/outflows and price correlation).
- Key downside risk scenarios, including any approach toward the $30,000 level and the subsequent implications for longer-term holders.
- Updated price targets for 2026–2027 from major analysts, including revisions to mid- or high-five-figure forecasts.
- New data from realized-price analyses that track aging cohorts, offering updated insight into profitability by holding window.
Rewritten article: Understanding the enduring appeal of patience in BTC
Bitcoin (CRYPTO: BTC) has long been framed as a volatile asset class that tests the nerves of investors seeking quick profits. Yet, a synthesis of long-run price history and contemporary market dynamics suggests that the most durable gains may accrue to those who commit to time rather than timing. The Bitwise Europe analysis, which combs through BTC’s price journey from 2010 to early 2026, indicates a striking pattern: the longer you ride the cycle, the less likely you are to sit on losses. Specifically, a three-year holding period yields a loss probability of just 0.70%, while five-year and ten-year windows reduce the risk even further to 0.2% and 0%, respectively.
To put those figures into perspective, the risk calculus for traders who enter BTC positions with shorter horizons is markedly more precarious. Intraday entries show nearly half the time ending underwater, with 47.1% of positions in negative territory. The risk persists, albeit at different magnitudes, over one week (44.7%), one month (43.2%), and even a year (24.3%). These numbers illuminate a pattern: the shorter the time frame, the greater the exposure to abrupt price moves and regime shifts. It helps explain why many seasoned crypto investors emphasize patience and disciplined risk management as essential components of a successful strategy in this space.
The price action context is equally important. As of a recent Saturday, BTC traded around $65,000, roughly half its October 2025 high. Yet the longer-term perspective remains constructive when contrasted with realized-prices: the 3–5 year realized price sits near $34,780, implying that participants who bought around that window and held through the recent drawdown were still sitting on about a 90% profit. This contrast between current market price and multi-year realization offers a tangible signal for investors evaluating whether to add to positions or hold steady through volatility. The historical frame invites readers to consider not just where Bitcoin is today, but where it has been over the last decade and how those cycles tested the resilience of long-term holders.
Forecasts for the 2026–2027 horizon remain divergent, reflecting the many moving parts that drive crypto markets. Bernstein has maintained a bold target of $150,000 for Bitcoin in 2026, arguing that relatively modest outflows from spot-Bitcoin ETFs could sustain a price trajectory higher, even as the asset retrenched by roughly 50% from its prior peak. The analysts characterized the current price action as a “crisis of confidence,” suggesting that sentiment rather than fundamentals is a primary swing factor in the near term. On the other side of the ledger, Standard Chartered has warned of a possible “final capitulation” phase that could pull BTC toward $50,000, driven by weak ETF flows and a softer macro backdrop, before restoring momentum toward the $100,000 mark by year-end 2026. Timothy Peterson’s framework, which leverages a historical average-return approach, points to around $122,000 by early 2027, with a substantial likelihood of trading above that level.
Beyond these headlines, a broader data story centers on the aging of holders and the corresponding realized-price dynamics. Glassnode’s charts of realized price by age underscore a recurring pattern: the cost basis and drawdown profiles depend heavily on how long investors have held their BTC. The 6–12 month cohort, for instance, shows a cost basis near $101,250, translating to about a 35% unrealized loss at a given snapshot, while the 1–2 year cohort sits closer to $78,150, implying roughly a 15% unrealized loss. The practical takeaway is that longer holding horizons tend to dampen the severity of corrections, a trend that aligns with the three-year risk reductions highlighted in the Bitwise analysis. For readers tracking the macro picture, the conversation about ETF flows, risk sentiment, and regulatory signals remains essential, as these factors are likely to influence whether the market shakes off or sustains the next leg higher.
Looking ahead, the path for Bitcoin remains as much about risk management as about price discovery. The consensus between long-hold data and bearish risk scenarios suggests a bifurcated market: patient investors could ride out volatility and exit with meaningful gains, while shorter-term traders might face amplified drawdowns if macro or policy dynamics tilt unfavorably. As with prior cycles, the market’s future hinges on how liquidity, sentiment, and structural demand—whether via ETFs or institutional participation—interact with the entrenched volatility that has defined BTC since its inception. In that context, the discipline of holding—paired with vigilant risk assessment—appears to be the most durable approach for navigating Bitcoin’s evolving landscape.
Video shows fire raging at luxury Dubai hotel after alleged ‘missile strike’

Why the next phase of stablecoin payments is all about user relationships and distribution

Cher’s Son Elijah Blue Allman Arrested on Assault, Trespassing Charges


-

 Politics6 days ago
Baftas 2026: Awards Nominations, Presenters And Performers
-

 Sports5 days ago
Women’s college basketball rankings: Iowa reenters top 10, Auriemma makes history
-

 Fashion23 hours ago
Weekend Open Thread: Iris Top
-

 Business4 days ago
True Citrus debuts functional drink mix collection
-

 Politics5 days ago
Nick Reiner Enters Plea In Deaths Of Parents Rob And Michele
-

 Politics2 days ago
ITV enters Gaza with IDF amid ongoing genocide
-

 Crypto World4 days ago
XRP price enters “dead zone” as Binance leverage hits lows
-
Sports13 hours ago
The Vikings Need a Duck
-

 Business6 days ago
Mattel’s American Girl brand turns 40, dolls enter a new era
-

 Tech4 days ago
Unsurprisingly, Apple's board gets what it wants in 2026 shareholder meeting
-

 Business6 days ago
Law enforcement kills armed man seeking to enter Trump’s Mar-a-Lago resort, officials say
-
 NewsBeat6 hours ago
The empty pub on busy Cambridge road that has been boarded up for years
-
 NewsBeat3 days ago
Manchester Central Mosque issues statement as it imposes new measures ‘with immediate effect’ after armed men enter
-

 NewsBeat3 days ago
Cuba says its forces have killed four on US-registered speedboat | World News
-
 NewsBeat5 days ago
‘Hourly’ method from gastroenterologist ‘helps reduce air travel bloating’
-

 Tech6 days ago
Anthropic-Backed Group Enters NY-12 AI PAC Fight
-

 NewsBeat6 days ago
Armed man killed after entering secure perimeter of Mar-a-Lago, Secret Service says
-

 Politics6 days ago
Maine has a long track record of electing moderates. Enter Graham Platner.
-
 NewsBeat4 days ago
Police latest as search for missing woman enters day nine
-

 Business3 days ago
Discord Pushes Implementation of Global Age Checks to Second Half of 2026