
Crypto World
Spotting Market Momentum: 5 Popular Momentum Indicators
Momentum indicators are important tools for traders seeking to evaluate the strength and speed of price movements. These technical analysis instruments are used by traders to identify potential entry and exit points, confirm market signals, and filter market noise. In this article, we review five momentum indicators that remain widely used by traders to support them in their decision-making in volatile markets.
What Is a Momentum Indicator?
Momentum in technical analysis refers to the rate at which an asset’s price accelerates or decelerates. Understanding momentum may assist traders in identifying potential trend continuations or reversals.
A momentum indicator is a technical analysis tool that measures how quickly and strongly an asset’s price is moving. Instead of showing the direction of the trend, it highlights the strength behind price movements. By comparing price changes over a set period, momentum indicators can help traders see if a market is gaining or losing strength. This information is often used to spot potential overbought or oversold conditions and to identify possible entry or exit points.
A stock momentum indicator like the Relative Strength Index (RSI), for instance, may indicate that stocks are currently bought or sold too heavily and their price is due for a reversal.
The Significance of Momentum Technical Indicators
Momentum indicators do not focus on the direction of the price movement, but rather on the strength behind it. They’re able to quantify and represent hidden clues about the future market direction. By learning to read momentum indicators, traders can develop trading strategies and identify conditions for new trades.
Momentum tools produce a range of signals that offer traders an edge over the markets. Let’s take a look at some of the most common momentum signals, including overbought/oversold conditions, divergences, and crossovers.
Overbought and Oversold Conditions

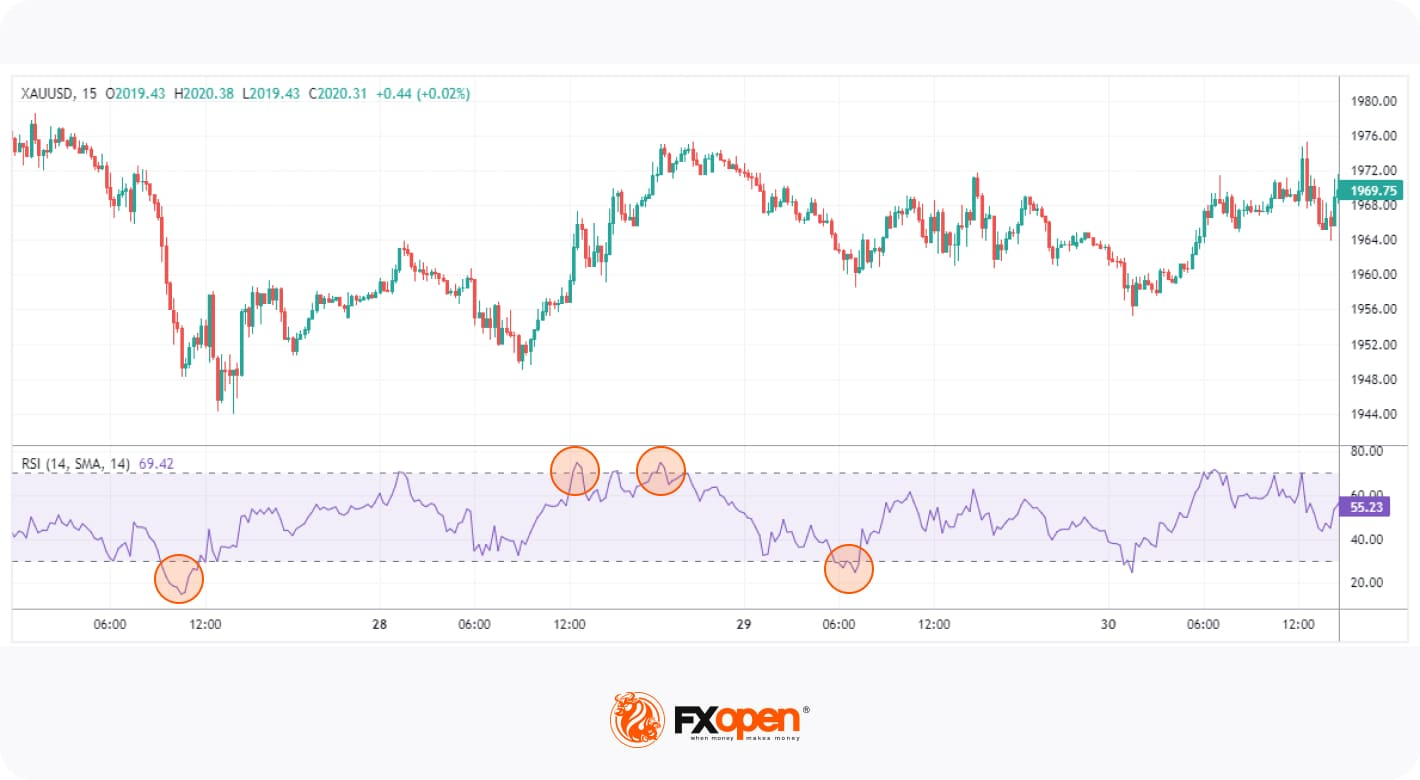
These signals indicate when an asset’s price has moved too far in one direction without sufficient support from fundamental or technical factors and is likely to reverse. For example, RSI generates overbought signals when the reading rises above 70 and signals oversold conditions when the reading falls below 30.
Divergence
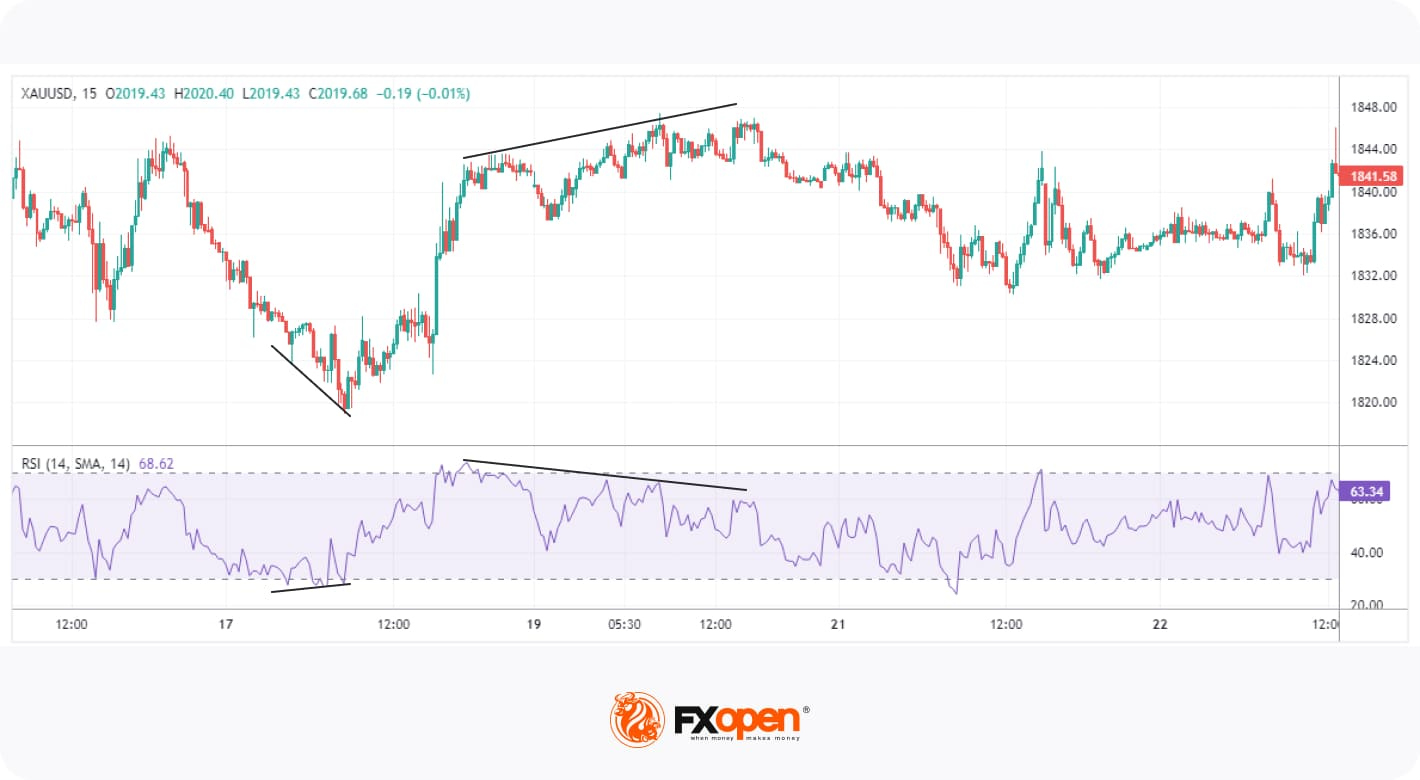
Divergence occurs when the price of an asset moves in the opposite direction of the indicator, suggesting an upcoming reversal. For instance, when the price is making higher highs, but RSI is making lower highs, this indicates a bearish divergence that increases the likelihood of a downward move.
Crossover

These signals are generated when the indicator’s lines cross each other or a certain threshold. A common example is the MACD, where traders look for crossovers between the fast MACD line and the slower signal line to spot potential entry and exit points.
List of Five Momentum Indicators for Technical Analysis
Now that we understand the types of signals that momentum tools produce, let’s break down five of the most popular with a momentum indicators list. If you’d like to experiment with them yourself, you’ll find each tool in the TickTrader trading platform.
1. Relative Strength Index (RSI)
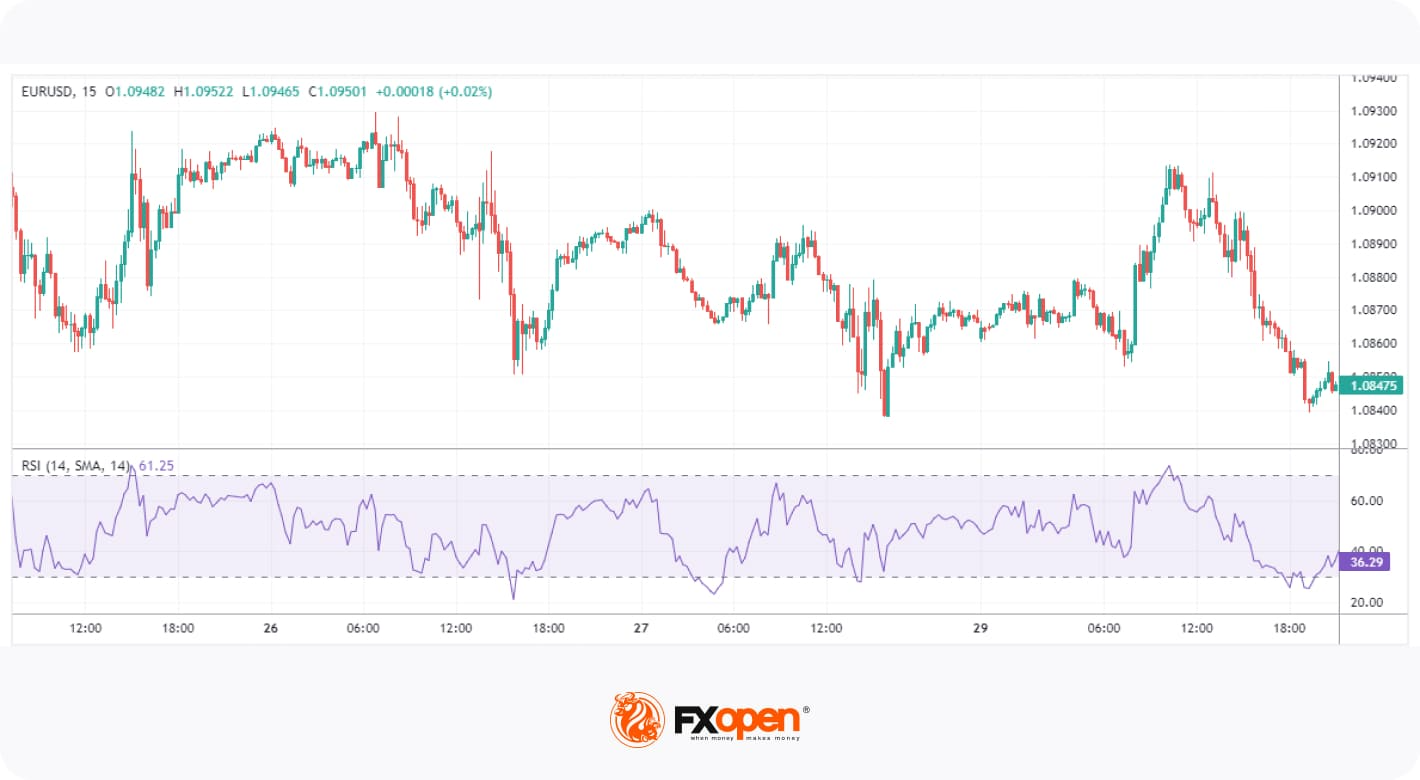
The RSI is one of the most popular and well-documented momentum indicators. It measures the speed and change of price movements by comparing the average gain to the average loss over a specified period, usually 14.
RSI is an oscillator, moving between 0 and 100. Values above 70 reflect overbought conditions, while values below 30 indicate oversold conditions. When the RSI moves out of overbought or oversold territory, many traders interpret this as a reversal confirmation. Sustained movements above or below the midpoint (50) can also be used to confirm a bullish or bearish trend, respectively. Moreover, traders look for divergence between the RSI and price to identify weakening trends and possible reversals.
2. Average Directional Index (ADX)
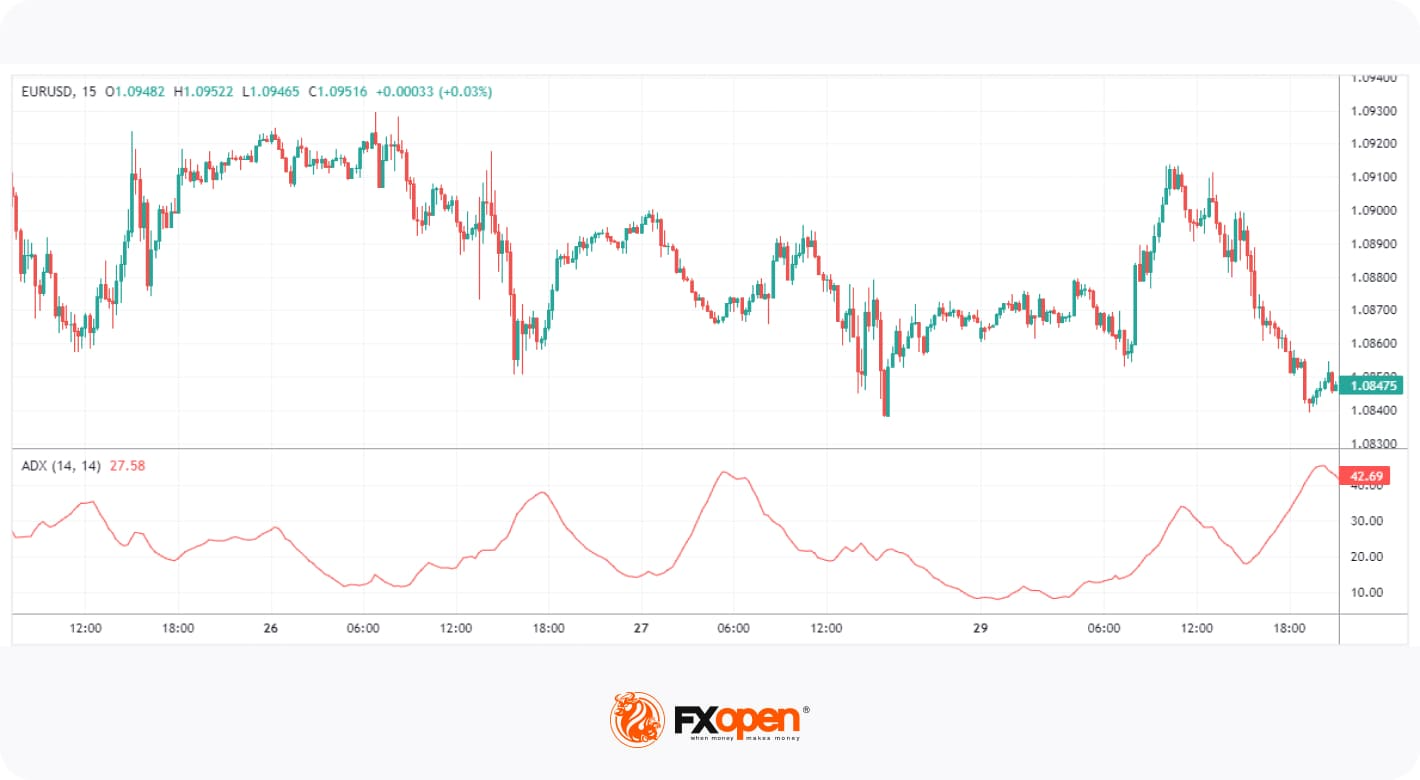
The ADX is a momentum indicator used to determine a trend’s strength. Unlike most other tools, its reading doesn’t move according to the direction of price action, i.e. it doesn’t move up if bullish or down when bearish. Instead, it ranges from 0 to 100, with values above 25 indicating a strong trend and below 25 suggesting a weak or non-trending market.
ADX is commonly used in combination with other tools, as it simply confirms the trendiness of a market. For example, traders might use a leading indicator like RSI to anticipate bullishness and confirm the trend when ADX crosses over 25.
3. Commodity Channel Index (CCI)
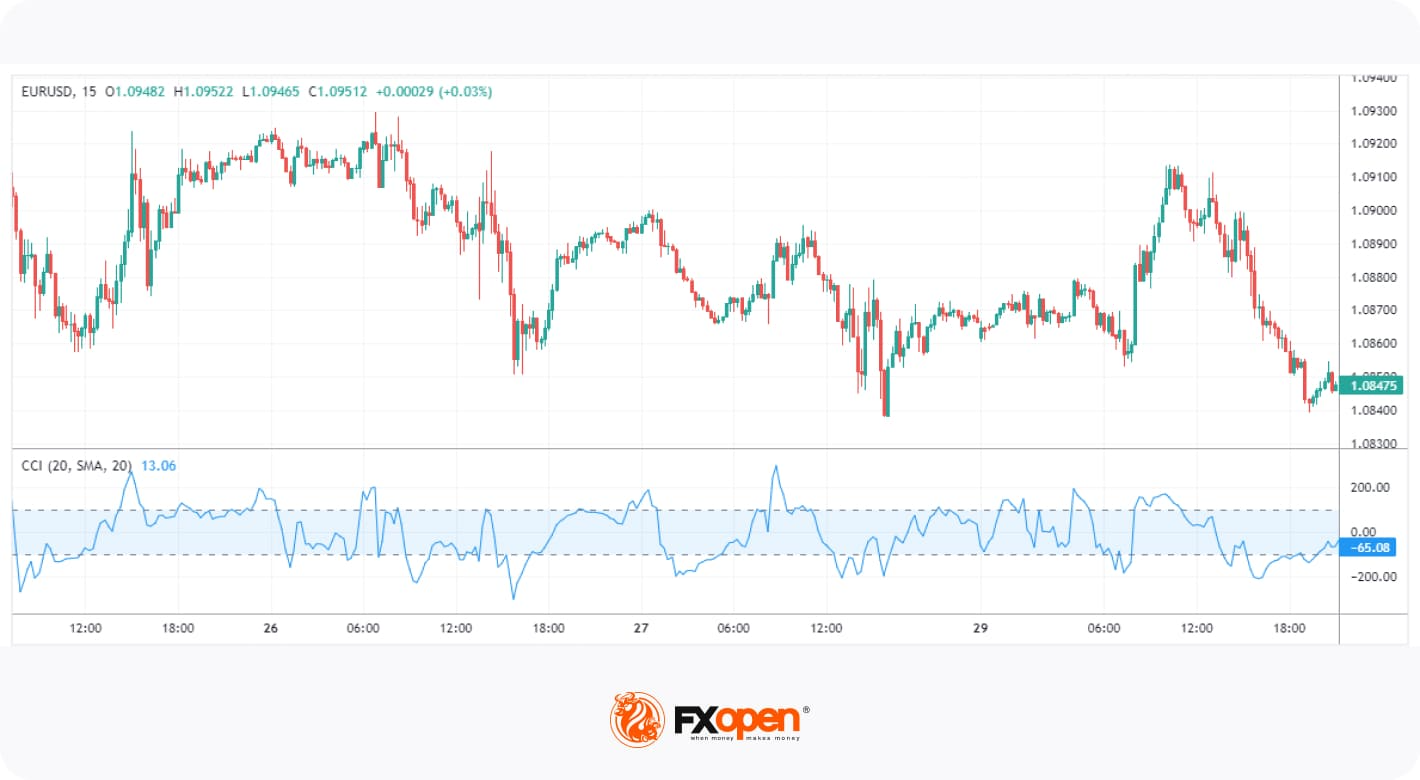
The CCI is a versatile momentum indicator. It uses a constant in its calculation to ensure that 75% of values fall between +/- 100, with moves outside of the range generally indicating a trend breakout or continuation. It can also show extreme overbought or oversold conditions when its value exceeds +/- 200.
The CCI requires a more nuanced approach than other tools and is typically used to confirm a trader’s directional bias. For instance, a visually identifiable bullish trend can be confirmed by looking at the CCI. If its value is skewed toward 100+, traders can be confident in their observation. When the market cools off, CCI will fall below 100. Traders can then confirm a pullback entry with a move back into the +/- 100 range.
4. Moving Average Convergence Divergence (MACD)
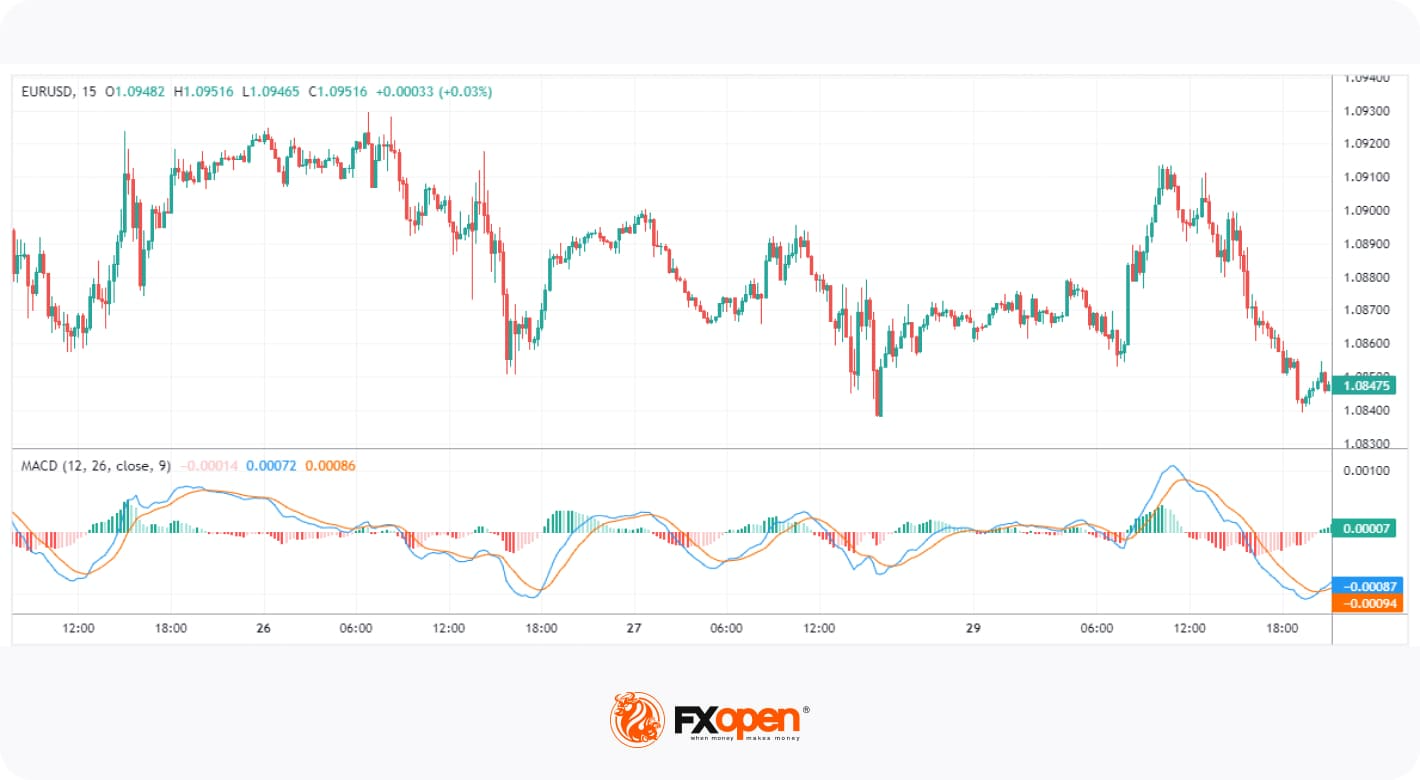
The MACD is a highly regarded trend-following momentum indicator that shows the relationship between two moving averages of an asset’s price. It’s used in technical analysis to identify the relationship between two moving averages of a security’s price. The MACD reflects the trend’s strength, direction, and duration, as well as possible reversal points.
Traders use crossovers between the MACD and signal lines as potential entry and exit signals. Additionally, when the MACD histogram crosses above or below the zero line, it can indicate bullish or bearish momentum in the market. Lastly, it’s also possible to spot divergences between price and the indicator’s peaks and troughs, similar to how divergences are identified with RSI.
5. Momentum (Mom)
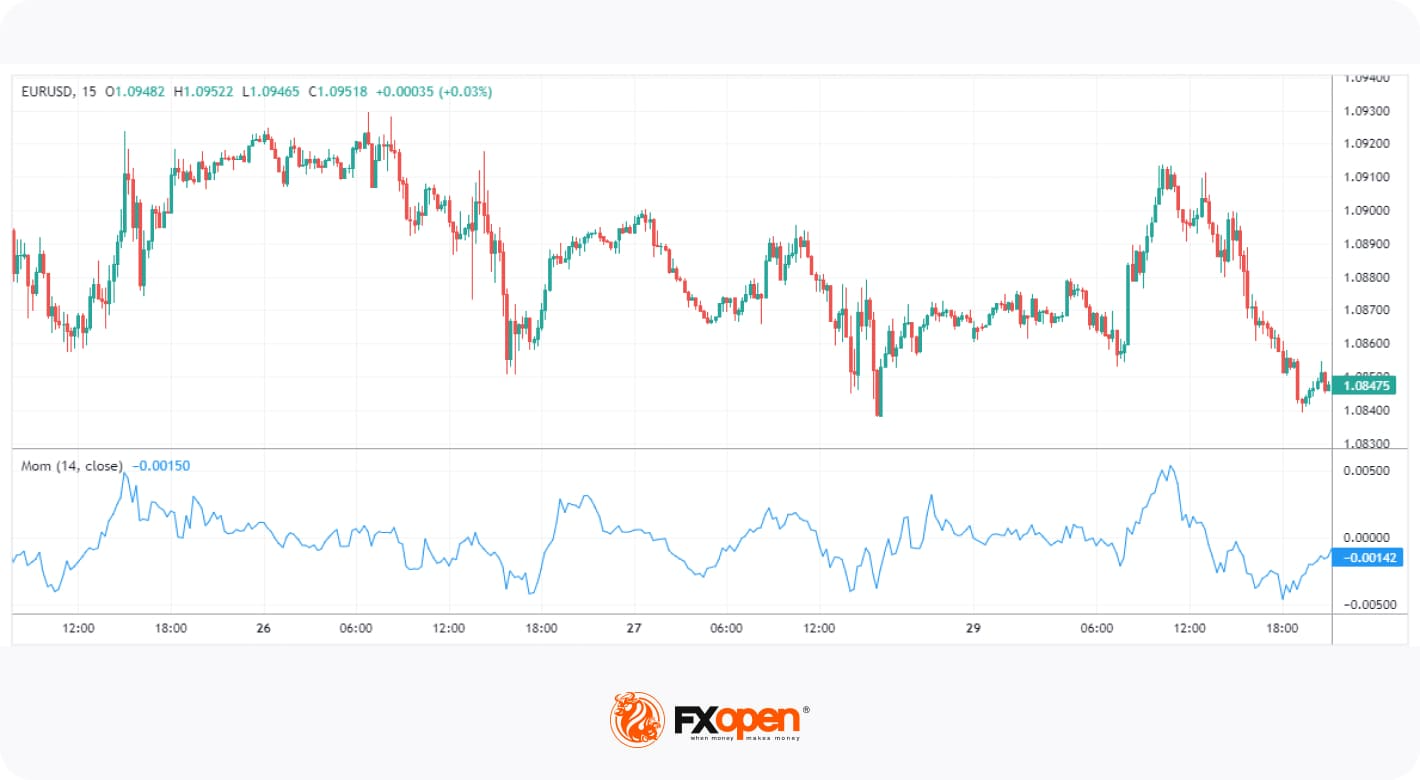
The Momentum indicator is considered a simple tool that measures the rate of change in an asset’s price over a specific period. The value of the Momentum depends on the market it’s applied to. For example, using the Momentum indicator in stocks will result in a fluctuating value typically between +/- 20, depending on the stock’s price. For forex pairs, its range may look more like +/- 0.02.
The common feature across all markets, however, is the zero line. Generally speaking, positive Momentum values indicate upward price movement, while negative values suggest downward movement. It can also show overbought and oversold conditions, but its lack of defined boundaries means this can be tricky. However, Momentum is especially useful for identifying divergences.
Advantages of Momentum Indicators
Momentum indicators are valuable tools in technical analysis, reflecting the strength and speed of price movements. They offer several advantages that may improve trading strategies:
- Identify Trends Early: Market momentum indicators can reveal potential shifts in trend direction, providing traders with additional context for evaluating entry and exit points.
- Objective Analysis: They provide quantifiable data, reducing reliance on subjective analysis and emotional decision-making.
- Spot Overbought and Oversold Conditions: Momentum tools show when an asset is overbought or oversold, signalling potential reversals and exit points.
- Confirm Trade Signals: Combining momentum indicators with other technical tools may improve trade signals, providing stronger confirmation for trading decisions.
- Adaptable Across Markets: They can be applied to various assets, including stocks, forex, and commodities, making them versatile tools for traders.
Things to Consider When Trading Momentum Indicators
While momentum indicators may be a helpful addition to any trader’s arsenal, there are a few things to be aware of:
- Trade with the Trend: Trends often last longer than you may think, and constantly looking for trend reversals will only end in frustration. Look for bullish signals during an uptrend and bearish signals in a downtrend.
- Use Multiple Indicators: Relying on a single tool can lead to false signals. Many traders combine a lagging indicator, like MACD, with a leading indicator, like RSI. Combining two or three tools may help confirm signals and improve trade accuracy.
- Beware of False Signals: Momentum indicators can sometimes generate false signals, especially in sideways or choppy markets. Being patient and waiting for confirmation before entering a trade is vital.
- Don’t Rely Too Heavily on Indicators: While momentum indicators may be helpful, relying solely on them without considering price action, market structure, or fundamental aspects can lead to poor trading decisions. Use these indicators alongside other tools for a momentum indicator strategy.
Final Thoughts
Momentum indicators play a critical role in technical analysis, offering traders valuable insights into the strength and direction of market movements. Tools such as RSI, MACD, CCI, ADX, and the Momentum Indicator are widely used to confirm trends, highlight overbought or oversold conditions, and improve entry and exit timing. While no single indicator should be used in isolation, combining these tools with solid risk management and broader market analysis can support traders in their trading decision-making.
If you want to test your strategy with the above-mentioned indicators, you may consider opening an FXOpen account, where you can trade over 700 markets with low costs. Good luck!
FAQ
How May Momentum Indicators Be Used?
Momentum indicators may be used to assess the speed and strength of price movements in a financial market. They can help traders identify potential overbought or oversold conditions, confirm trends, or signal possible reversals. By comparing the current price to previous price levels, momentum indicators provide insights into whether a market move is gaining or losing strength.
What Period is Set for a Momentum Indicator?
If we are talking about the Momentum indicator, the period depends on your trading style. For short-term traders, 7 and 10 periods are common, while long-term traders may prefer 14 and 21 periods. Testing various periods based on asset volatility can improve results.
What Is the Most Popular Momentum Indicator for Scalping?
There is no single most popular momentum indicator for scalping but the Relative Strength Index (RSI) is often favoured by scalpers due to its ability to quickly identify overbought or oversold conditions. Its responsiveness is used by scalpers to make rapid decisions in fast-moving markets.
What Is the Difference Between Momentum and Trend Indicators?
Momentum trading indicators measure the speed of price changes, while trend indicators assess the direction and persistence of price movements. To put it simply, momentum focuses on strength, while trend indicators focus on the overall direction.
Is MACD a Momentum Indicator?
Yes, the Moving Average Convergence Divergence (MACD) is one of the most popular momentum indicators, especially in forex and stock trading. It may reveal changes in momentum and help identify potential trend reversals.
This article represents the opinion of the Companies operating under the FXOpen brand only. It is not to be construed as an offer, solicitation, or recommendation with respect to products and services provided by the Companies operating under the FXOpen brand, nor is it to be considered financial advice.


Bitcoin is hovering near the $67,000 level as weekend liquidity thins and traders weigh the risk of renewed downside. A Bollinger Bands squeeze on shorter timeframes points to a potential burst of volatility, but direction remains uncertain as sellers re-enter into a quiet end of the week.
In a market snapshot on Sunday, a prominent market observer highlighted how the current cycle differs from past Bitcoin bear markets. Pseudonymous trader LP_NXT noted that bottoms in earlier cycles typically formed after several sweeps of the downside, triggering capitulation before a revival. This time, the pattern has tended to sweep the highs, leaving the lows exposed and liquidity building below price action, complicating entries for bears and bulls alike.
“In contrast, this cycle has been sweeping the highs, making it difficult to enter short positions while leaving the lows exposed and building liquidity below.”
Meanwhile, traders are watching for a potential breakdown below key thresholds. LP_NXT suggested that a sweep of sub-$60,000 levels could be a likely signal once selling pressure intensifies, but the eventual breakdown and the way price behaves around consecutive lows will be crucial for identifying a real bottom.
Key takeaways
- Four-hour Bollinger Bands have contracted, signaling a classic volatility squeeze that could precede a sharp move up or down.
- Bottom formation remains uncertain; historical patterns favored repeated low sweeps to trigger capitulation, but this cycle has shown different dynamics by sweeping highs instead.
- Binance order-book data reveals unusual selling activity by a small investor class using a TWAP bot, with a single hour showing about $18 million in sell pressure—far above their typical daily volume.
- Market participants describe a dichotomy in whale behavior: “buying dips and selling rips” even as BTC remains range-bound, amid macro headwinds from stronger dollar pressures.
- Past coverage flagged added risk to bulls from a recovering U.S. dollar; investors should monitor whether price action can sustain above or below critical thresholds as liquidity shifts.
Technical setup: volatility compression and looming decisions
Price action around Sunday kept Bitcoin mired in a relatively tight band near $67k, with intraday volatility showing signs of re-emerging pressure rather than a firm directional breakout. The Bollinger Bands on the four-hour chart narrowed, a familiar prelude to a burst of activity once buyers or sellers step in decisively. Traders often interpret this as a fork in the road: a break above resistance could rekindle upside momentum, while a breakdown might expose the market to fresh liquidity-driven moves.
Among market observers, this has been a focal point because the prior cycles’ patterns around low-volume weekends can set the stage for the next move. The contrast with recent behavior—where repeated sweeps of local highs have dominated—adds an extra layer of complexity to positioning ahead of any potential move.
Whale dynamics and order-book signals
Beyond the price chart, on-chain and order-book activity has drawn attention. Keith Alan, cofounder of trading analytics firm Material Indicators, highlighted unusual selling density in the Binance BTC/USDT book despite muted price action. A time-weighted average price (TWAP) bot was observed distributing BTC, with the smallest order class executing a roughly $18 million sell program in an hour—significantly larger and more rapid than the class’s typical $3 million to $5 million daily volume.
“That’s exponentially more than their normal $3M-$5M daily volume in 1 hr. That ain’t retail!”
A broader portrait emerges of a market where whales are not uniformly aligned with a single directional narrative. Alan summarized the dynamic as “buying dips and selling rips” within a price range that continues to confound shorter-term traders. This pattern aligns with a market waiting for clearer macro cues and a more definitive breakout or breakdown signal.
Earlier reporting noted additional bulls’ headwinds from a recovering U.S. dollar, which can dampen enthusiasm for risk assets like Bitcoin when fiat strength escalates. The current activity in the order book underscores how much of the near-term price action may be driven by large players rather than retail flow, particularly as weekend liquidity dries up and position risks accumulate.
Macro backdrop and what it could mean next
The interplay between Bitcoin’s price trajectory and dollar strength remains a critical backdrop for traders. If the dollar cools or if liquidity shifts back into risk assets, BTC could attempt a sustained push higher. Conversely, renewed dollar strength or renewed selling pressure from large token holders could push the market toward test levels below the February low near $60,000. As with many chart-based narratives, the outcome will likely hinge on whether price can sustain a breakout beyond key resistance and whether further high-low sweeps occur, testing traders’ willingness to commit to new positions.
With Bitcoin hovering near critical junctures, investors are watching for concrete signals: a decisive break above the recent range, a compassionate test of sub-$60,000 lows, or a different pattern of liquidity formation that could indicate a new phase in the market cycle. The next couple of sessions should offer clearer directional clues as macro catalysts and order-book dynamics converge.
Cointelegraph’s prior coverage of dollar strength and its implications for crypto markets remains a useful context for readers assessing risk and potential routes for Bitcoin in the near term.
As the market enters a decision point, traders should monitor both price action and the evolving composition of order-book activity to gauge whether a bottom is forming or if a fresh leg down could materialize.
What remains uncertain is how quickly order-flow dynamics will normalize once weekends end and institutions re-enter the scene. Investors should stay alert to any break of sub-$60k liquidity traps or indicators that reinforce a shift in the prevailing liquidity regime.


Crypto markets faced a mix of structural, market, and policy-related developments on the day.
Summary
- Michael Ippolito said rising token supply diluted returns as average coin values lagged market cap.
- Michael Saylor said Bitcoin price now follows capital flows, not the old four-year halving cycle.
- Polymarket removed a market on a missing US service member after backlash over integrity standards.
New comments from industry figures focused on token oversupply, Bitcoin’s changing market cycle, and a backlash that led Polymarket to remove a sensitive prediction market.
Michael Ippolito, co-founder of Blockworks, said the crypto sector faces an “existential” problem as token supply grows faster than value creation. In posts on X, he said total crypto market capitalization has stayed relatively firm, but the average value per token has remained weak.
He wrote that “the average coin is only slightly higher than where it was in 2020” and also down about 50% since 2021. He added that median token returns have fallen sharply, with many tokens down about 80% from their peak levels.
Ippolito said this pattern shows gains have stayed concentrated in a small group of large-cap assets. At the same time, much of the wider market has failed to keep pace. His comments pointed to a growing gap between the number of new tokens and the value generated across the sector.
He also said, “We created a TON of new assets and STILL total market cap is flat.” That view framed token issuance as a dilution problem, where capital spreads across more assets without lifting average returns.
Saylor says capital flows now drive Bitcoin
Michael Saylor said Bitcoin no longer follows the traditional four-year cycle linked to halving events. He stated that the old cycle is “dead” and said price action now depends more on capital flows, credit conditions, and institutional demand.
For years, many traders used halvings as a core part of Bitcoin market analysis. Those events reduced miner rewards and often shaped expectations for future rallies. Saylor now argues that Bitcoin has entered a different stage.
He wrote that “price is now driven by capital flows” and said bank credit and digital credit will play a larger role in Bitcoin’s future path. His comments shifted attention away from supply shocks alone and toward access through funds, banks, and large firms.
That position came as more traditional financial platforms continued to expand Bitcoin-related services. The change has led some market participants to track treasury strategies, regulated products, and large-scale adoption more closely than past cycle models.
Polymarket removes market after criticism
Polymarket removed a market tied to the fate of a missing US service member after public criticism. The listing asked whether US authorities would confirm the rescue of a pilot reportedly shot down over Iran, and it drew sharp backlash online.
US Representative Seth Moulton criticized the market and called it “disgusting.” He said people were betting on the fate of a service member who could be injured, missing, or in danger.
Polymarket said the listing violated its “integrity standards” and removed it. The platform also said the market should not have gone live and that it is reviewing how it passed internal checks.
The company did not give more detail on the exact rule involved. Still, the removal added to the wider debate over what types of real-world events prediction markets should allow, especially when the subject involves war, injury, or loss of life.
Crypto World
ASST Stock Price Forecast: Analyst Projects 53x Surge to $515 by 2034 Using Bitcoin Power Law

TLDR:
- ASST stock price is projected to rise from $9.75 today to $515 by 2034, marking a 53x potential gain.
- Strive’s Bitcoin holdings may grow from 13,628 BTC to 83,299 BTC by 2034 through continuous SATA issuance.
- CEBE per share is forecast to grow 3.2x from 13,193 to 42,028 sats, even after 91% total share dilution.
- Strive currently trades at 73% of NAV with only $10M in debt, offering discounted Bitcoin-amplified exposure.
ASST stock price has drawn growing attention from crypto-focused investors. A financial analyst recently published a detailed multi-year projection for Strive Asset Management’s shares.
The model suggests the stock could climb from $9.75 today to $515 by 2034. The forecast relies on Bitcoin’s historical power law trajectory and a balance sheet leverage model. The analysis has gained traction among those tracking Bitcoin-linked equity vehicles in public markets.
Bitcoin Power Law Forms the Backbone of ASST Stock Price Forecast
Analyst Adam Livingston published the projection via social media. He applied two analytical tools: the Bitcoin Power Law and the CEBE Framework. Bitcoin’s 15-year price trend follows the expression P(t) ~ t⁵·⁶⁹, carrying an R² of 0.961.
The model assumes Strive maintains a 48% amplification ratio throughout the forecast period. This ratio is sustained through continuous SATA preferred share issuance. All proceeds from those issuances are directed toward Bitcoin purchases.
Throughout the model, the enterprise value mNAV remains constant at 1.06×. That figure reflects Strive’s current market valuation. Bitcoin’s price path follows the power law curve across all projected years.
According to the model, Strive’s Bitcoin holdings grow from 13,628 BTC today to 83,299 BTC by 2034. That marks a 6.1× increase in holdings over eight years. The growth stems entirely from maintaining the current amplification strategy.
CEBE Framework Tracks Common Equity Gains Despite Share Dilution
The CEBE framework measures what common shareholders actually own on the balance sheet. It strips out all senior claims before arriving at common equity value. This approach offers a more precise view of shareholder exposure to Bitcoin.
Livingston stated in his post: “CEBE per share grows from 13,193 to 42,028 sats… a 3.2× increase in what common equity actually owns, AFTER subtracting all senior claims, DESPITE 91% total share dilution over 8 years.”
Preferred dividends are set at 12.75% and are paid through common share issuance. This creates roughly 8.4% annual dilution for existing shareholders. Yet Bitcoin’s projected appreciation rate near 35% per year more than offsets that drag.
The spread between Bitcoin’s power law CAGR and the preferred cost sits at approximately 22 percentage points. That gap consistently favors common shareholders over the projection horizon. As Bitcoin’s price rises, dollar-denominated preferred claims become less burdensome in Bitcoin terms.
Strive currently trades at 73% of its net asset value. Its outstanding debt stands at just $10 million, reflecting a 1.1% leverage ratio.
Livingston observed that the market currently assigns no premium to the Bitcoin accumulation engine. He described ASST stock price as a discounted entry point into amplified Bitcoin exposure, with limited debt risk attached.

Crypto World
Ripple (XRP) Aims to Revolutionise Finance, Yet Analysts Say Taurox (TAUX) Might Make it Sooner After Opening Pre-KYA

Ripple trades near $1.32 right now. On April , the International Monetary Fund released a major new note on “Tokenized Finance,” calling tokenization a fundamental shift in how global finance works, not just a small tech upgrade. The IMF highlighted faster settlement, better transparency, and huge potential for real-world assets and cross-border payments. This directly aligns with what Ripple and XRP were built for.
Taurox, an AI-driven trading protocol, is designed to help regular stakers benefit from these big-picture shifts through smart autonomous agents that focus on steady, risk-managed returns.
Even with the IMF validating the exact type of tokenized future Ripple has been pushing, XRP holders often see sharp 20-30% swings due to escrow releases, market sentiment, and short-term noise. It can feel frustrating when the long-term story is strong but the price doesn’t always reflect it. Taurox was created to solve that. It pools deposits of USDT, BTC, or XRP into one shared trading pool and lets a global team of developers, quants, and AI engineers run multiple diversified strategies at once.
Each strategy is strictly limited to 2% of the total pool to keep risk controlled, and smart built-in rules automatically maintain balance. The result is smoother performance, without the constant stress of trying to time every headline or paying high management fees like traditional funds charge.

Taurox has opened the Pre-KYA Registration Table ahead of schedule. This early window lets developers, quants, and AI builders submit their trading agents before the full system launches. The first ones in get priority testing in the Proving Ground, faster access to pool capital, and extra rewards from the Agent Creator Fund (10% of total TAUX supply). If you already have a working trading strategy, this is your opportunity to position yourself early in the Taurox ecosystem.
When you stake, your funds go into one shared trading pool and you receive txTokens that represent your share of the pool’s value, starting at $1.00 each. The protocol keeps 15% in stablecoins as a safety buffer and puts the rest to work through autonomous agents.
These agents only run real strategies after passing strict tests in the Proving Ground. Daily loss limits of 2%, single-trade caps of 5%, and an automatic pause if the pool drops 5% all help protect your capital. Everything is on-chain and fully transparent.

TAUX has a hard-capped supply of 2 billion tokens that can never be increased after launch. Taurox charges zero upfront fees, it only takes 5% of the profits the agents make, buys TAUX on the open market, and permanently burns 30% of it. The rest is shared between stakers, the DAO, and the strategy creators. This design creates real scarcity: the bigger and more successful the pool becomes, the more valuable TAUX can get over time.
The Taurox Presale has entered Phase 4 and has already raised over $950K. TAUX is currently priced at $0.018. Investors joining in this phase are positioned for nearly 4.5x returns when the token lists at $0.08. If Taurox reaches its $1 billion pool target, these early participants could see up to 103x gains as TAUX potentially climbs to $1.85. For example, a $500 investment today would grow to roughly $2,220 at listing and approach $28,000 if TAUX hits the $1 level.
The presale includes a 1-month cliff and 20% monthly unlocks from month 2 to 5, so you can start staking quickly while limiting early selling. Combined with 30% burns and strong reserves, it offers real potential for both short-term and long-term upside.
The IMF just put a global spotlight on tokenized finance, exactly the space Ripple has been building toward for years. While the broader market sorts out the short-term noise, Taurox gives you a practical way to stay exposed without the usual volatility and guesswork. It combines intelligent AI agents with clear risk controls and a token that actually becomes scarcer as the protocol grows. If you believe in Ripple’s long-term role in the tokenized future, Taurox is built for exactly this moment.
Buy TAUX: https://taurox.io
Whitepaper: https://docs.taurox.io/
Official Telegram: https://t.me/tauroxlabs
Official X/Twitter: https://x.com/TauroxProtocol
Disclaimer: This is a Press Release provided by a third party who is responsible for the content. Please conduct your own research before taking any action based on the content.
Bitcoin may no longer move in step with Federal Reserve policy, according to a new report from Binance Research, which points to a structural shift driven by spot exchange-traded funds.
For years, crypto markets reacted sharply to interest rate signals, with bitcoin falling when central banks tightened monetary policy.
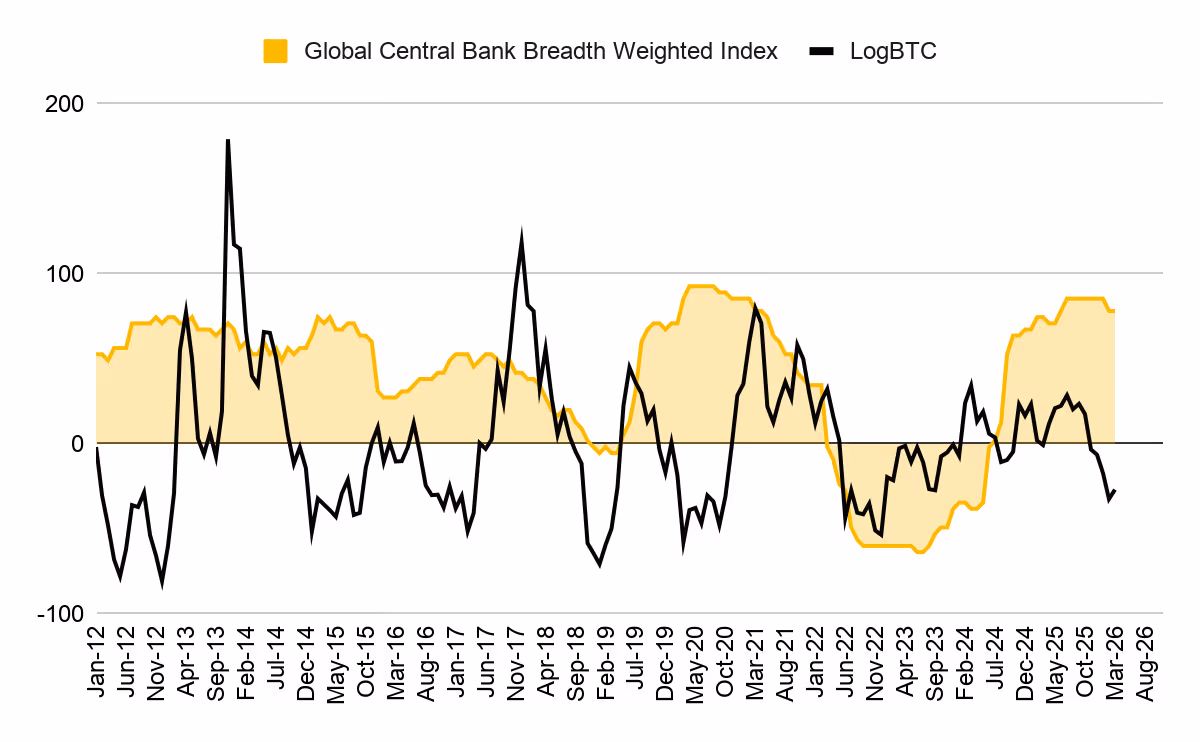
That pattern now appears to be breaking as Binance data shows bitcoin’s correlation with its Global Easing Breadth Index, which tracks 41 central banks, has turned strongly negative since 2024. Spot bitcoin ETFs were approved by the U.S. Securities and Exchange Commission (SEC) in January 2024.

Before ETFs, the relationship was mildly positive, with BTC tending to follow global easing cycles by several months. Now, the report finds the opposite effect is nearly three times stronger, suggesting the old link has reversed.
The change reflects a shift in who drives prices. Retail investors once dominated crypto trading and reacted to macro news. ETFs allowed institutions to play a bigger role, and these firms often positioned months ahead of policy changes, treating BTC as a forward-looking asset.
“As a result, BTC may have evolved from a macro ‘lagging receiver’ to a ‘leading pricer,” Binance Research wrote. “A peak in easing may already be old news for BTC, and crypto-native drivers—such as policy progress and institutional flows—could matter more than the direction of monetary easing itself.”
The findings come as markets grapple with renewed stagflation fears tied to rising oil prices and growing geopolitical tensions over the war in the Middle East.
Rate expectations have swung from projected cuts to possible hikes, a backdrop that historically pressured risk assets.
Binance argues that the reaction may be overstated. In past cycles, central banks often pivoted to support growth despite inflation spikes. If history repeats itself, central banks are to eventually prioritize growth over inflation, and bitcoin will likely price that pivot earlier than expected.


Bitcoin drew mixed public views after new comments from market observers focused on long-term performance and price structure.
Summary
- Adam Livingston said Bitcoin trades 0.94 sigma below center as price structure tightens around power law.
- Livingston said Bitcoin’s historical trading range compressed sharply, with crashes and blowoff tops becoming less extreme.
- Peter Schiff said Bitcoin gained 12% in five years, trailing stocks, gold, and silver.
Adam Livingston said Bitcoin’s recent price action shows a more stable pattern. In a post on X, he wrote that the asset’s oscillations are “dampening” and that the “funnel is closing.” He said this pattern shows Bitcoin moving closer to equilibrium around its long-term power law center.
He added that Bitcoin now sits about “−0.94σ below center,” which he described as below trend and below fair value. Livingston said the narrowing range suggests blowoff tops are fading and that large crashes are also becoming less severe.
Livingston said Bitcoin’s trading range has tightened over time. He wrote that the 5.3σ range seen in 2011 to 2013 has compressed to 1.4σ in the 2021 to 2025 period. He argued that this shift shows Bitcoin trading in a narrower channel as the market matures.
He also pointed to the model’s reported strength during major market events. According to his post, the power law model absorbed the 2022 market crash, the FTX collapse, the 2024 recovery, the 2025 top, and the current drawdown, while its R² value rose to 0.961.
Schiff questions Bitcoin’s long-term edge
As we recently reported, Peter Schiff took a different view by focusing on Bitcoin’s five-year return. He said Bitcoin gained 12% over that period. He also said the Nasdaq rose 57.4%, the S&P 500 gained 59.4%, gold climbed 163%, and silver advanced 181%.
Using those figures, Schiff asked,
“If the appeal of Bitcoin is its superior long-term performance, why should anyone keep HODLing it?”
His remarks placed Bitcoin’s recent record next to more traditional markets and metals.
TLDR:
- Silver has surged over 140% in 2026, drawing direct comparisons to the dramatic 2011 price collapse pattern
- Strong industrial demand from EVs and solar panels is attracting more leverage, raising crash risk further
- Silver’s $30B annual market size makes it highly vulnerable to violent swings driven by capital flow shifts
- Forced selling through futures, ETFs, and thin liquidity could trigger a rapid cascade once the turn begins
Silver’s sharp rally in 2026 is drawing comparisons to the dramatic 2011 price collapse, with analysts warning that crowded positioning and thin market liquidity could trigger a violent reversal.
The metal has climbed over 140% recently, fueling widespread optimism. However, some market observers believe the current setup mirrors past cycles where strong narratives masked serious structural risks beneath the surface.
2011 Pattern Resurfaces as Silver Climbs Past Key Levels
The 2011 silver rally remains one of the most studied price events in commodity markets. Silver ran from $18 to $49 within months before collapsing sharply. The driving forces then included quantitative easing, inflation fears, and a retail rush into hard assets.
Narratives during that period sounded strikingly similar to today. Talk of shortages, undervaluation against gold, and early-stage positioning dominated market commentary. Yet the fundamentals never supported those price levels, and supply remained adequate throughout.
Crypto analyst BLADE recently noted on X that the 2011 collapse was never about silver itself. “It was about liquidity,” the post read, adding that high prices killed demand as manufacturers began reducing silver usage.
The breakdown came fast once positioning unwound. Silver dropped from $49 to $30 within days, eventually falling to $15 over time. The move was driven entirely by leverage and positioning shifts rather than any change in the underlying asset.
Strong Fundamentals May Be Attracting More Leverage, Not Less Risk
Today’s silver market does carry stronger fundamentals than 2011. Industrial demand from electric vehicles, solar panels, and electronics is real. Supply deficits exist, and inventory levels are tighter than in prior cycles.
However, BLADE warned that stronger fundamentals can make situations more dangerous. “Strong fundamentals don’t prevent crashes — they attract more leverage,” the post stated directly.
Silver remains a structurally thin market, valued at roughly $30 billion annually. Most trading activity runs through derivatives rather than physical markets. That structure means price action is driven by capital flows, not fundamental value.
Silver does not peak when the story falls apart. It peaks when positioning becomes crowded, margin reaches its limit, and exit liquidity disappears.
At that point, forced selling starts, and the cascade effect moves quickly through futures markets, ETFs, and market makers simultaneously.
The pattern BLADE described shows how silver can still push higher before any reversal. Parabolic moves tend to stretch beyond expectations.
The concern is not about direction but about what happens when the turn comes. In thin, leveraged markets, that turn rarely offers time to react before significant losses accumulate.


Peter Schiff has renewed his criticism of Bitcoin by questioning its long-term value as an investment.
Summary
- Peter Schiff: Bitcoin gained 12% in five years, trailing gold, silver, Nasdaq, and S&P 500.
- Michael Saylor said Bitcoin has outperformed assets since August 2020, arguing time frame changes comparisons.
- Santiment data showed Bitcoin bearish sentiment reached late-February highs, with ratio at 0.81 in comments.
In a post on X, he compared Bitcoin’s five-year return with gains in the Nasdaq, S&P 500, gold, and silver. His remarks framed the debate around whether Bitcoin still offers a stronger long-term case than traditional assets.
Peter Schiff said Bitcoin rose only 12% over the past five years. He also pointed to stronger gains in other markets during the same period. According to the figures shared in his post, the Nasdaq rose 57.4%, the S&P 500 gained 59.4%, gold climbed 163%, and silver advanced 181%.
Schiff used those numbers to raise doubts about Bitcoin’s long-term edge.
“If the appeal of Bitcoin is its superior long-term performance, why should anyone keep HODLing it?,” he asked.
His statement focused attention on Bitcoin’s recent record against both equities and precious metals.
Michael Saylor responded by arguing that the comparison depends on the starting point. He said, “Timeframes matter,” and added that Bitcoin has led major assets since August 2020. His reply shifted the discussion from a fixed five-year window to a broader performance view.
Saylor also said that a longer chart would favor Bitcoin even more. He wrote that Bitcoin is the top-performing major asset since August 2020 and said the gap “only widens” when the time span increases. His response reflected a common view among Bitcoin supporters who prefer longer-term comparisons.
Kiyosaki links pressure to older policy shifts
Robert Kiyosaki added another angle to the discussion by linking current financial stress to changes that began in 1974. In his post, he said “the future created in 1974 has arrived” and tied today’s debt and inflation concerns to that period. He also connected those changes to the petrodollar system and retirement planning.
Kiyosaki said baby boomers now face growing pressure as pensions gave way to market-based retirement accounts. His comments widened the discussion beyond Bitcoin price alone and placed it inside a broader debate about money, savings, and household finances.
In addition, market sentiment data also showed a cautious tone around Bitcoin. Santiment said bearish discussion on social platforms reached its highest level since late February. The platform reported that the bullish-to-bearish comment ratio dropped to 0.81.
That reading showed weaker trader confidence during the latest market discussion. Santiment also noted that extreme fear can sometimes work as a contrarian signal, as markets often move against the crowd when negative sentiment becomes too strong.

The online gambling industry has seen a noticeable trend in recent months. More players are searching for alternatives to Stake.com, one of the biggest names in crypto gambling. While Stake remains a major player, a growing number of users appear to be looking for something new. One platform that keeps showing up in those conversations is ZunaBet, a crypto-focused casino and sportsbook that launched in 2026.
So what is driving these searches, and does ZunaBet actually offer something different? This article breaks down both platforms and looks at why players are exploring new options.
The Rise of Stake.com
Stake.com has been one of the most recognized names in crypto gambling for several years. It built its reputation on a clean interface, fast crypto transactions, and a strong presence in the sports sponsorship space. The platform offers thousands of casino games, a full sportsbook, and its own original games that have attracted a loyal user base.
Stake also gained significant visibility through partnerships with high-profile figures and sports teams. That marketing push helped it become a household name in the crypto gambling world.
However, no platform stays on top without facing competition. As the crypto casino market has matured, players have started looking for platforms that offer better rewards, bigger game libraries, or a fresh experience. Search data suggests that terms like “Stake alternative” and “sites like Stake” have been climbing steadily. This is not unusual in a fast-moving industry where players are always looking for the next best option.
What Is ZunaBet?
ZunaBet is a crypto-first online casino and sportsbook that launched in 2026. It is owned by Strathvale Group Ltd and operates under an Anjouan gaming license (ALSI-202510047-FI2). The team behind it has over 20 years of combined experience in the online gambling industry.
The platform offers 11,294 games from 63 providers, making it one of the larger crypto-focused game libraries currently available. Providers include well-known names like Pragmatic Play, Hacksaw Gaming, Evolution, Yggdrasil, and BGaming. The game selection covers slots, RNG table games, and live dealer titles.

Beyond the casino, ZunaBet runs a full sportsbook covering major sports like football, basketball, tennis, and NHL, along with esports titles including CS2, Dota 2, League of Legends, and Valorant. Virtual sports and combat sports are also available, making it a genuine hybrid platform.
ZunaBet supports over 20 cryptocurrencies including BTC, ETH, USDT across multiple chains, SOL, DOGE, ADA, and XRP. The platform does not charge processing fees and emphasizes fast withdrawals, which is a selling point for crypto users who are used to waiting at traditional casinos.
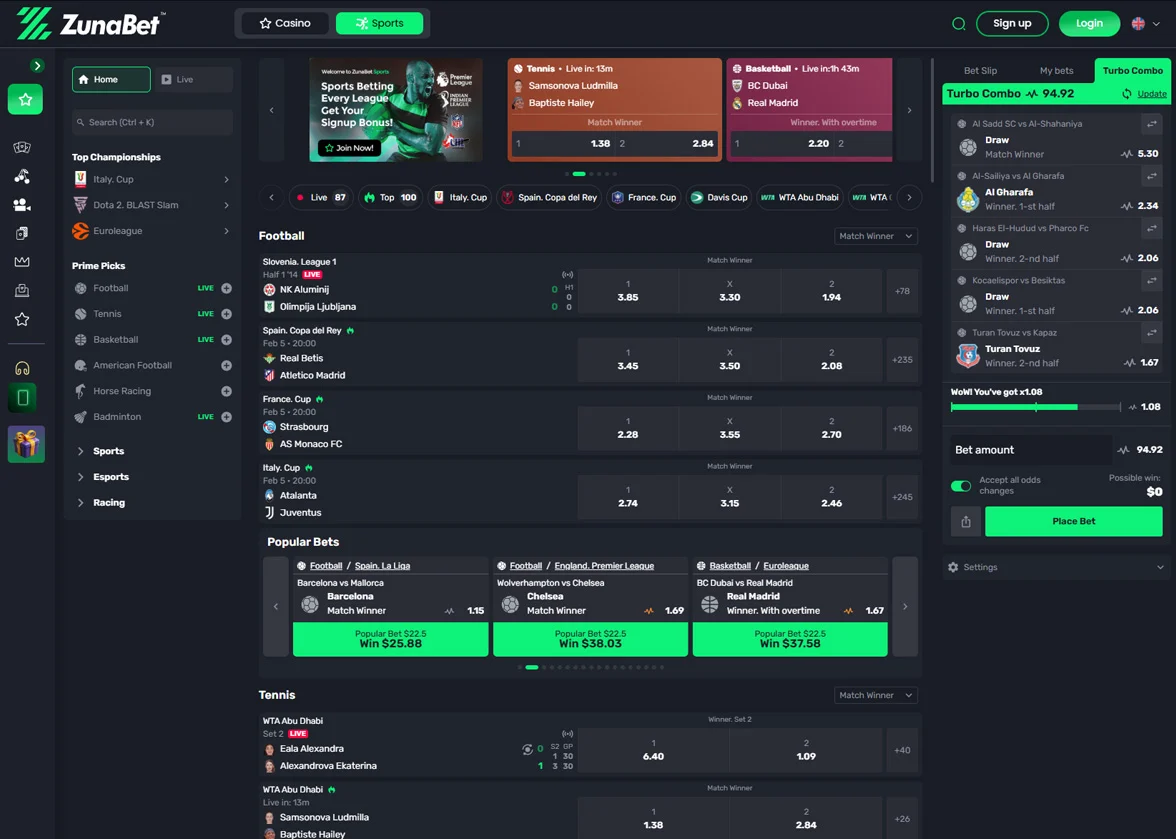
The platform also offers dedicated apps for iOS, Android, Windows, and MacOS, along with 24/7 live chat support.
The Welcome Bonus Comparison
One area where ZunaBet stands out is its welcome offer. New players can access up to $5,000 in bonuses plus 75 free spins spread across their first three deposits. The breakdown is straightforward: 100% up to $2,000 plus 25 spins on the first deposit, 50% up to $1,500 plus 25 spins on the second, and 100% up to $1,500 plus 25 spins on the third.
This structure encourages players to stick around beyond their first session, which benefits both the platform and the player. Compared to many crypto casinos that offer a single deposit bonus, the multi-deposit approach gives players more value over time.
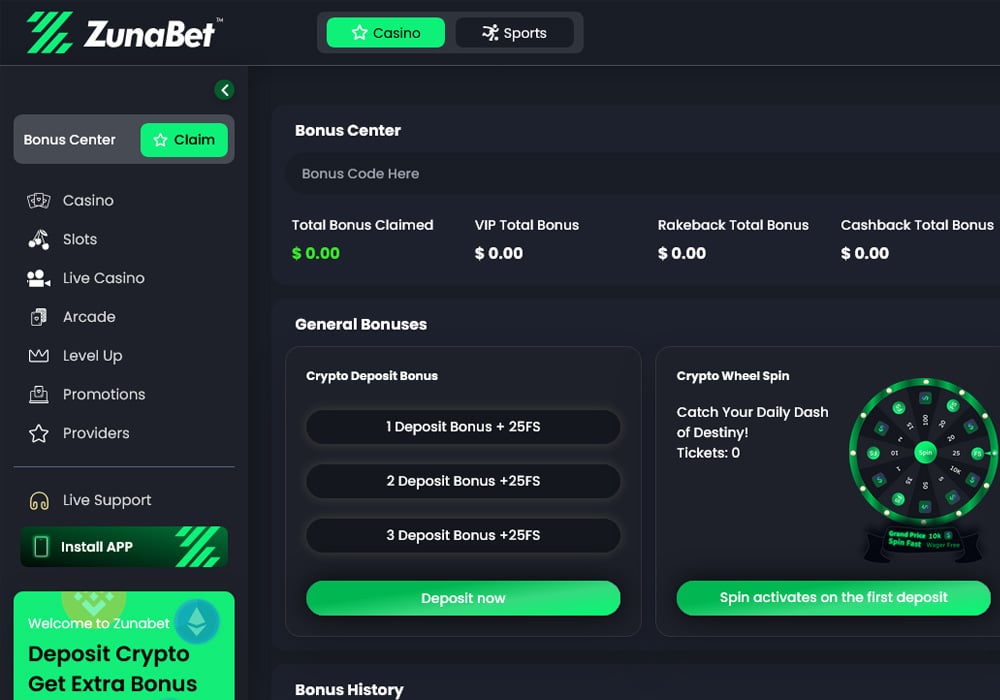
Stake.com, by contrast, has historically taken a different approach to bonuses, often relying on its VIP program and reload offers rather than large upfront welcome packages. For players who want immediate bonus value from day one, ZunaBet’s offer is hard to ignore.
Loyalty Programs: Dragons vs. Traditional VIP
This is where things get interesting. Most online casinos use a fairly standard VIP system with generic tier names and incremental perks. ZunaBet has gone a different route with what it calls a dragon evolution system.
The program has six tiers: Squire, Warden, Champion, Divine, Knight, and Ultimate. Each tier comes with increasing rakeback percentages, starting at 1% for Squire and going up to 20% for Ultimate. Other benefits include tier-based free spins (up to 1,000), VIP club access, and double wheel spins. The program is built around a mascot called Zuno, giving it a gamified feel that sets it apart from the typical loyalty experience.

For players who grind regularly, the difference between 1% and 20% rakeback is significant. It directly impacts how much value they get back from their play over time. This kind of structured, transparent reward system appeals to a generation of players who grew up with progression systems in video games and want that same sense of advancement in their gambling experience.
Stake.com has its own VIP program, which is well-regarded in the industry. But it operates on a more invite-based, less transparent model. Some players prefer knowing exactly where they stand and what they need to do to reach the next level, which is where ZunaBet’s approach has an edge.
Crypto-First vs. Traditional Platforms
The broader trend behind all of this is the ongoing shift from traditional fiat-based gambling platforms to crypto-first operators. Major brands like DraftKings, BetMGM, Caesars, and FanDuel still dominate in regulated markets, but they are built around traditional payment methods. Deposits and withdrawals often take days, come with fees, and require extensive verification processes.
Crypto casinos like ZunaBet and Stake flip that model. Transactions are faster, fees are lower or nonexistent, and players have more control over their funds. For a growing segment of players who already hold and use cryptocurrency, this is simply a better experience.
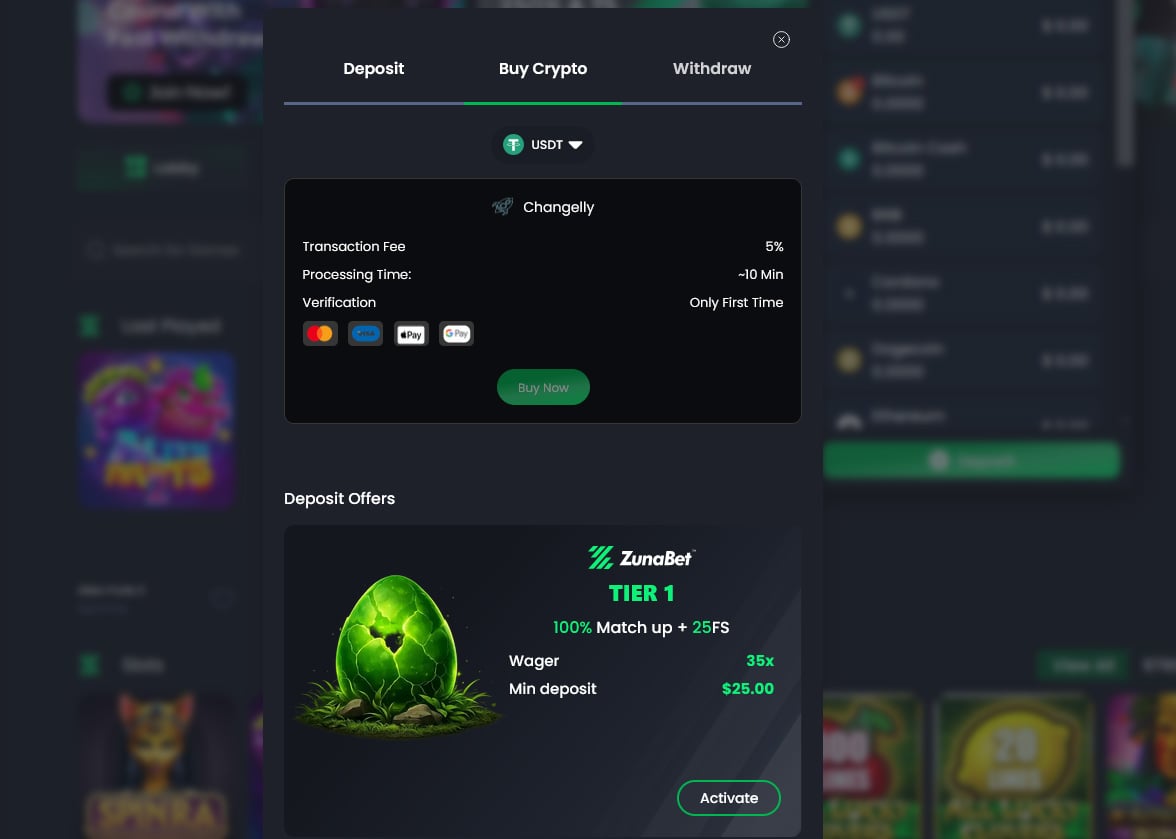
ZunaBet leans into this fully. With support for 20+ coins and no platform processing fees, it is built from the ground up for crypto users rather than being a traditional casino that added crypto as an afterthought.
Is ZunaBet the Future for a New Generation of Players?
There is a reasonable case to be made that platforms like ZunaBet represent where online gambling is heading. The combination of a massive game library, integrated sportsbook and esports betting, crypto-native payments, and a gamified loyalty system checks a lot of boxes for younger, digitally native players.
This is a generation that expects fast transactions, transparent rewards, mobile-first design, and variety. They are not interested in waiting three to five business days for a withdrawal or navigating clunky interfaces built a decade ago.
ZunaBet is still new, and it will need to prove itself over time in areas like customer service consistency, game fairness, and long-term reliability. But the early signs suggest it is a platform worth watching. The fact that it is already appearing in conversations about Stake alternatives says something about the demand for fresh options in the crypto gambling space.
The Bottom Line
The rise in searches for Stake.com alternatives reflects a healthy, competitive market where players are not locked into one platform. Stake remains a strong option with a proven track record, but ZunaBet is making a compelling case as the more exciting new entry in the space.
With 11,000+ games, 20+ supported cryptocurrencies, a $5,000 welcome bonus, a unique dragon-themed loyalty program, and a full sportsbook, ZunaBet offers a package that is hard to overlook. For players looking for something fresh in the crypto casino world, it is quickly becoming the platform to watch in 2026.
Disclaimer: This is a Press Release provided by a third party who is responsible for the content. Please conduct your own research before taking any action based on the content.
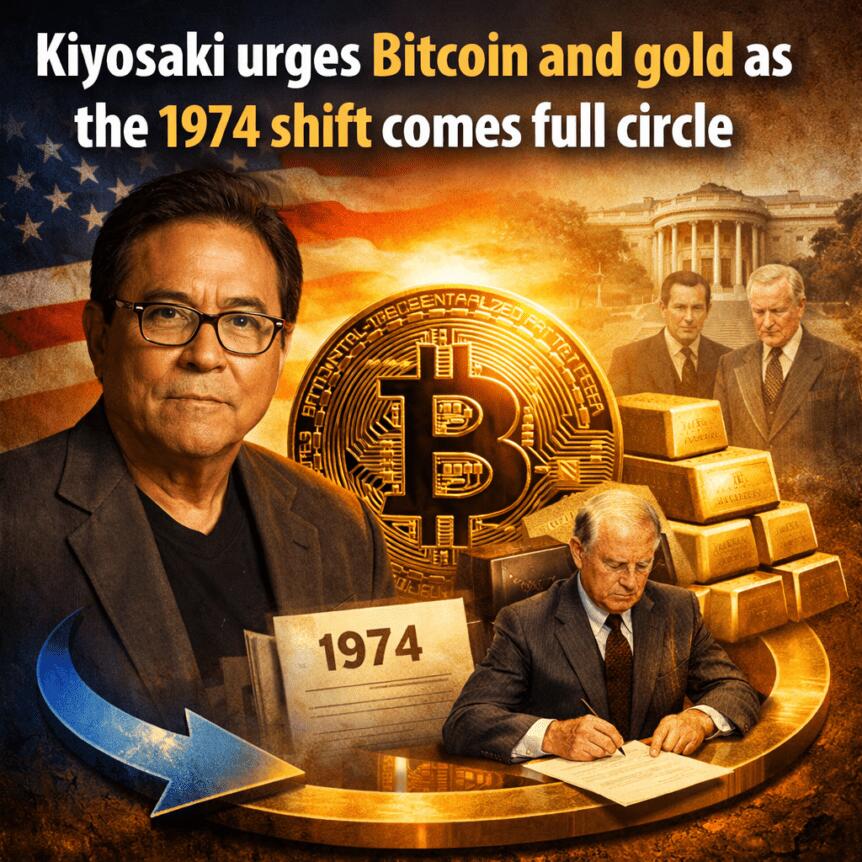
Robert Kiyosaki, the author of Rich Dad Poor Dad, argues that the long-running economic shifts set in motion more than five decades ago are now unfolding in full force. He has repeatedly urged readers to consider Bitcoin and gold as hedges against rising debt, inflation and retirement risk, framing them as “real money.”
In a recent post on X, Kiyosaki pointed to 1974 as a turning point that reshaped money and retirement in the United States, linking the move toward a petrodollar framework with policy changes affecting pensions. “The future created in 1974 has arrived,” he wrote, tying the dollar’s evolution after the end of the gold standard to today’s inflationary pressures and energy tensions. He also highlighted the Employee Retirement Income Security Act, known as ERISA, which introduced new rules for pension plans and reflected a broader shift toward market-based retirement savings.
According to Kiyosaki, that transition replaced guaranteed lifetime income for many workers with vehicles such as 401(k)s, placing more risk on individuals. “Millions of baby-boomers will soon find out they have no income once they stop working,” he warned.
Kiyosaki’s stance: Bitcoin and gold as anchors in a shifting era
Kiyosaki reiterated his call for financial education and diversification into non-traditional stores of value. He continues to advocate assets like gold, silver and Bitcoin, which he describes as “real money.”
Last month, he warned that a major financial bubble could be approaching and suggested that a crisis might trigger a sharp rally in scarce assets like Bitcoin. He has previously floated a scenario in which Bitcoin could reach about $750,000 within a year of such a crash.
Bearish sentiment climbs, but contrarian signals linger
In the broader market, Bitcoin sentiment on social media has tilted toward caution. Data from crypto analytics firm Santiment shows the bullish-to-bearish comment ratio has dropped to 0.81—the lowest level in weeks and the strongest bearish tilt since late February. While such mood can reflect near-term pressure, Santiment notes it can also serve as a contrarian indicator, with markets often moving opposite to crowded sentiment.
Cointelegraph has previously highlighted how macro risk and liquidity cycles influence Bitcoin’s price, and recent coverage underscored the dynamics of investor behavior during periods of inflation and tightening financial conditions. For example, Cointelegraph reported that rich Bitcoin traders faced significant daily losses in Q1 2026, underscoring the tension between risk appetite and market fragility. Rich Bitcoin traders lost $337M daily in Q1 2026.
Macro backdrop and what investors should watch next
The thread tying Kiyosaki’s argument is a macro narrative: a decades-long drift from the gold standard toward a petrodollar paradigm, alongside reforms that shifted retirement risk to individuals. Investors are watching how debt levels, inflation, energy geopolitics and retirement policy interact with demand for scarce assets like Bitcoin and gold. The market context remains nuanced, with both optimistic and cautionary viewpoints coexisting as policy signals and macro data evolve.
What matters going forward is not only the timing of any potential price moves but how the broader environment—rising debt, policy shifts, and energy dynamics—shapes demand for hedges and stores of value. The conversation around Bitcoin as a hedge and as a potential growth asset continues to be framed by longer-term macro developments as much as by short-term price action.
Looking ahead, readers should monitor inflation readings, policy guidance, and any shifts in retirement reform or energy supply that could influence demand for Bitcoin and gold as alternative anchors in a changing financial system.

All Services Fully Operational After Brief Mail Outage

The Religious Meaning Behind Hot Cross Buns

“3 Times” — Sinner opens up on life, failures and his biggest moments

Smart energy pays enters the US market, targeting scalable financial infrastructure

Why Israel is blocking foreign journalists from entering

Bitcoin: We’re Entering The Most Dangerous Phase

When your financial level is abt to change #finace #wealthbuilding #wealthmindset ##thethinkinmind

DTCC JUST CONFIRMED WHAT’S COMING FOR XRP HBAR CC & MORE!

How to Make Money with Credit Card Rewards & Cashback | 5 Practical Tips | Abhishek
-

 NewsBeat3 days ago
Steven Gerrard disagrees with Gary Neville over ‘shock’ Chelsea and Arsenal claim | Football
-

 Business3 days ago
No Jackpot Winner and $194 Million Prize Rolls Over
-

 Fashion2 days ago
Weekend Open Thread: Spanx – Corporette.com
-
Entertainment6 days ago
Fans slam 'heartbreaking' Barbie Dream Fest convention debacle with 'cardboard cutout' experience
-

 Crypto World4 days ago
Gold Price Prediction: Worst Month in 17 Years fo Save Haven Rock
-

 Tech7 days ago
The Pixel 10a doesn’t have a camera bump, and it’s great
-
Crypto World5 days ago
Dems press CFTC, ethics board on prediction-market insider trades
-

 Tech7 days ago
Avatar Legends: The Fighting Game comes out in July and it looks pretty slick
-

 Sports21 hours ago
India men’s 4x400m and mixed 4x100m relay teams register big progress | Other Sports News
-

 Business4 days ago
Login and Checkout Issues Spark Merchant Frustration
-

 Tech6 days ago
Apple will hide your email address from apps and websites, but not cops
-

 Tech5 days ago
EE TV is using AI to help you find something to watch
-

 Sports5 days ago
Tallest college basketball player ever, standing at 7-foot-9, entering transfer portal
-

 Politics6 days ago
Should Trump Be Scared Strait?
-

 Tech6 days ago
Flipsnack and the shift toward motion-first business content with living visuals
-

 Fashion6 days ago
The Best Spring Trends of 2026
-

 Sports6 days ago
Women’s hockey camp eyes fitness boost, tactics ahead of WC 2026 campaign | Other Sports News
-

 Tech5 days ago
How to back up your iPhone & iPad to your Mac before something goes wrong
-
Crypto World7 days ago
Bitcoin’s Six-Month Losing Streak: What On-Chain Data Says About the Market’s Next Move
-

 Politics6 days ago
BBC slammed for ignoring author of The Fraud
You must be logged in to post a comment Login