

Crypto World
Strange New Chinese AI ‘KIMI’ Predicts the Price of Bitcoin by the End of 2026
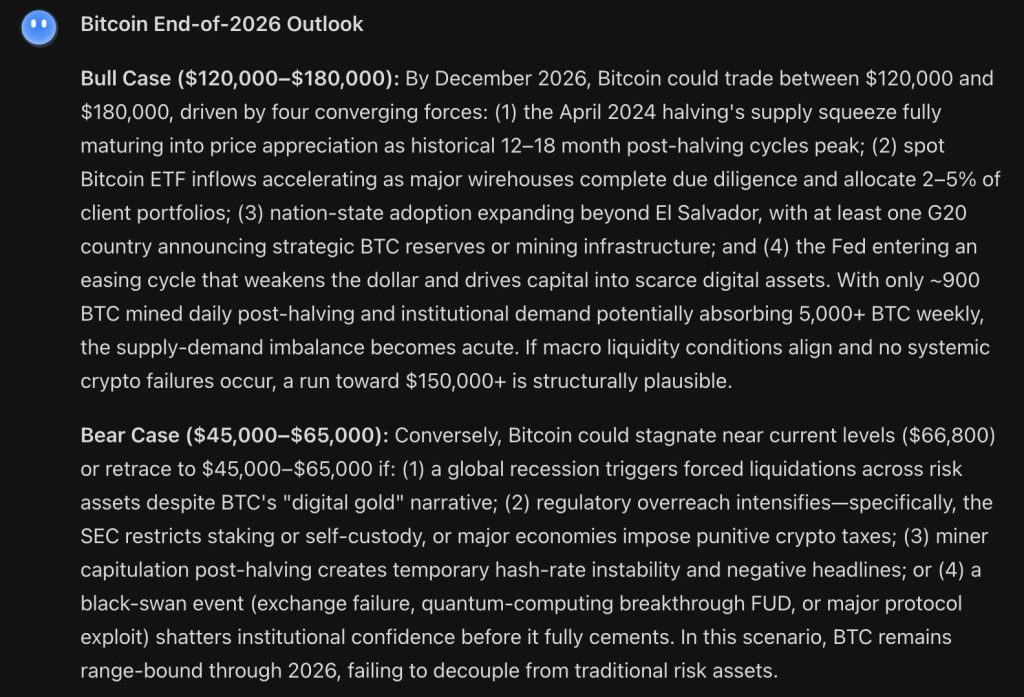
Kimi, the AI developed by Chinese startup Moonshot AI, is swinging for the fences on Bitcoin’s end-of-2026 price prediction, predicts for $120,000 to $180,000 in the bull case while acknowledging a bear scenario that brings BTC all the way back to $45,000 to $65,000.
From a current price of $66,690, the distance between those 2 outcomes is one of the widest ranges in this entire series.
The bull case Kimi is constructing is built on 4 converging forces rather than a single catalyst, and the arithmetic behind it is hard to argue with when all 4 are working simultaneously.
The April 2024 halving reduced daily new supply to roughly 900 BTC while institutional demand from ETF products alone is potentially absorbing 5,000 or more BTC weekly.

That supply-demand imbalance becomes increasingly acute as the halving effect matures through the historical 12 to 18 month post-halving cycle window, which places the peak pressure point squarely in the second half of 2026.
Major wirehouses completing due diligence and allocating 2% to 5% of client portfolios to Bitcoin ETFs is not a hypothetical, it is a process already underway at several of the largest wealth management firms globally.
Nation-state adoption expanding beyond El Salvador with at least 1 G20 country announcing strategic BTC reserves would be the kind of geopolitical legitimacy event that no amount of ETF demand can replicate in terms of narrative impact.
And a Fed easing cycle weakening the dollar is the macro backdrop that historically turbocharges hard-asset appreciation. All 4 of those firing together is what gets Kimi to $150,000 and above.
The bear case is where Kimi AI is being more thorough than most AI predictions in this series. A global recession triggering forced liquidations is the most likely bear scenario given current macro conditions, but Kimi goes further and flags 3 additional tail risks that most predictions ignore entirely.
Regulatory overreach, specifically the SEC restricting self-custody or major economies imposing punitive crypto taxes, could drain institutional participation just as it was cementing.

Miner capitulation creating hash-rate instability would generate the kind of negative headlines that spook retail and institutional participants simultaneously.
And a black swan event, whether an exchange failure, quantum computing FUD, or a major protocol exploit, could shatter the institutional confidence that has been building for 2 years before it fully cements.
In that scenario Bitcoin stays range-bound through 2026 and fails to decouple from traditional risk assets.
Bitcoin Price Prediction: BTC Just Had a 9.35% Weekly Loss and Is Now Approaching the Bear Case Range Kimi Described
BTC price is closing the week at $66,690, down 9.35%, and the weekly chart going back to 2024 is now showing something that requires serious attention.
This week’s candle is one of the largest red weekly candles since the November 2025 selloff, and the close at $66,690 puts Bitcoin directly inside the upper boundary of Kimi’s bear case range of $45,000 to $65,000.
That is not a coincidence, it is the market testing exactly the zone where the bull case and bear case diverge.
The 2024 all-time high zone around $68,000 to $73,000 was the breakout level that launched the run to $124,000. Bitcoin is now sitting below that breakout zone for the first time since the original breakout in late 2024, and whether it reclaims it quickly or continues lower is the most consequential near-term question on this weekly chart.
The $62,000 to $65,000 zone below current price is the last meaningful support before the structure gets genuinely concerning for the bull case.
The February 2026 low near $62,000 was the deepest the cycle correction went, and a retest of that level would be the 2nd visit to cycle lows, which historically carries more downside risk than the first visit.
On the upside reclaiming $70,000 and then $75,000 are the 2 levels that need to flip back to support before the $88,000 to $95,000 near-term targets from other predictions in this series become realistic, let alone Kimi’s end-of-year $120,000 to $180,000 scenario.
When Big Names Stop Moving, Something Else Always Does: Meta AI Predicts LiquidChain – The Next 1000x?
Every cycle has a graveyard of traders who kept waiting for the obvious plays to start working again.
Bitcoin is grinding sideways. Ethereum has been range-bound long enough that calling it a consolidation feels generous.
They are sitting in problems that have not yet been solved.
Cross-chain development is one of the most expensive realities in DeFi. Every team building across Bitcoin, Ethereum, and Solana is effectively maintaining 3 separate products. Every user moving value between those networks absorbs a cost that should not exist.
LiquidChain is building the layer that makes all of that irrelevant. One unified execution environment where all 3 networks operate as a single system. Deploy once, reach everywhere, with no cross-chain overhead extracted from every interaction.
The presale is at $0.01454. Just over $700,000 raised. That number is not a weakness. It is a description of exactly where this sits in its lifecycle. The market has not found it yet.
Execution is unproven. Adoption post-launch is unknown. Liquidity is a question mark. The early stage always looks like this, and anyone telling you otherwise is not being honest. The window where something is genuinely undiscovered closes eventually.
LiquidChain is still in it.
Explore the LiquidChain Presale
The post Strange New Chinese AI ‘KIMI’ Predicts the Price of Bitcoin by the End of 2026 appeared first on Cryptonews.


Kendrick compared Aave to an automated, blockchain-based bank that operates without employees or discretionary decision-making. At its peak in October 2025, the protocol held roughly $75 billion in deposits, a level the analyst said would have ranked it among the 30 largest banks in the U.S.
Looking ahead, Kendrick expects the value of tokenized assets actively used within DeFi applications to increase 37-fold by the end of the decade. Because Aave’s revenue model is tied closely to lending activity and deposits, the bank anticipates the protocol’s growth to translate relatively directly into gains for the AAVE token.
The report also pointed to the potential restart of Aave’s token buyback program as a further catalyst. The protocol’s Horizon initiative, which is designed to support lending against tokenized real-world assets in a permissioned environment, could help attract traditional financial institutions and accelerate adoption.
Despite recent market weakness across digital assets, the broader backdrop for crypto prices is improving and Aave is expected to be among the beneficiaries as capital returns to DeFi, the report added.
Aave was 5.6% higher over the last 24 hours, trading around $76.
Read more: DeFi shaken by $292 million hack, but showing resilience, Standard Chartered says
Michael Saylor’s Strategy (MSTR) is drawing renewed attention from both technical traders and investors as two pressures converge: a bearish chart setup on the company’s stock and a widening strain on its cash position tied to preferred-share dividends.
According to CryptoQuant analyst Julio Moreno, Strategy’s U.S. dollar cash reserve has been shrinking while its preferred-stock dividend obligations have risen sharply, raising the likelihood of continued funding through additional share issuance—an outcome that can dilute common shareholders.
Key takeaways
- MSTR’s monthly chart is showing a potential head-and-shoulders pattern, with a breakdown risk cited around the $100–$105 neckline area.
- CryptoQuant data cited by Julio Moreno points to a faster decline in preferred-dividend coverage, now estimated at roughly 14 months.
- Strategy’s preferred shares (Stretch/STRC) have traded below their $100 par value, with an effective yield reported above the stated dividend rate.
- Funding preferred dividends and maintaining Bitcoin purchases may force Strategy into choices that could weigh on MSTR through dilution or reduced buying.
MSTR’s monthly head-and-shoulders setup revives downside debate
Late June market readings indicated that MSTR’s monthly price action was aligning with a head-and-shoulders (H&S) configuration. In classic technical analysis, an H&S pattern forms when price builds three peaks—two “shoulders” and a taller “head”—with a neckline connecting the key pullback lows between them.
The bearish case strengthens if the stock breaks down below the neckline, since the pattern often resolves by falling roughly the maximum vertical distance between the head and the neckline. In this instance, the potential line in the sand is described around $100–$105. A decisive monthly move below that zone would be consistent with the breakdown scenario.
The article’s technical framing also highlights a measured move that could extend the downside substantially. The cited target around $20 implies a decline on the order of 80% from current levels, contingent on how the pattern completes.
That magnitude is part of why the comparison is being made to Strategy’s dot-com-era comparison. The source notes that the company’s earlier stock collapse during the dot-com bubble burst followed a similar neckline break, eventually driving a decline exceeding 99% from a prior peak over roughly two years.
Cash reserve shrink and rising dividends raise dilution risk
Beyond the chart, Strategy’s capital structure is under scrutiny. CryptoQuant analyst Julio Moreno argued that MSTR faces increasing dilution risk as Strategy’s cash reserves compress and dividend commitments grow.
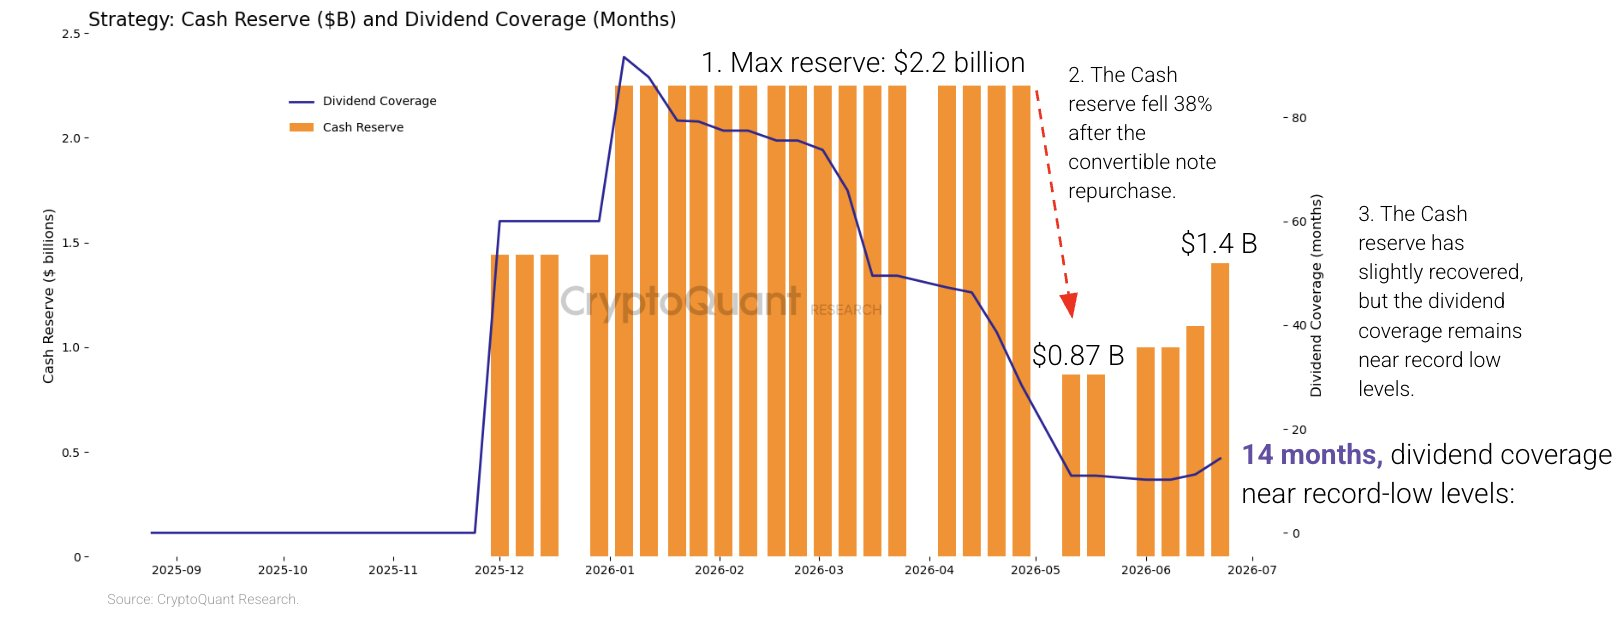
Moreno’s figures, cited as of June, indicate that Strategy’s U.S. dollar cash reserve had fallen 38% since the start of 2026. Over the same period, its yearly dividend obligations were described as having nearly quadrupled to about $1.2 billion.
The core mechanism involves Strategy using cash to service preferred-stock dividends, primarily tied to Stretch (STRC). Moreno further stated that STRC preferred-dividend coverage has slipped to roughly 14 months, down from more than seven years. In practical terms, that implies Strategy has cash to cover just over a year’s worth of those dividend payments, assuming no additional major changes.
This coverage pressure appears in STRC’s market pricing. The source reports STRC traded down to a record low of $82.50 last week and has since largely remained in the $82–$89 range, well below its $100 par value.
As STRC trades beneath par while investors anticipate dividend-related risk, the effective yield has widened. The article states STRC’s effective yield moved above 13%, versus a stated dividend rate of about 11.5%. That spread reflects compensation demanded by the market for holding a security now perceived as more likely to require future adjustments in funding.
“At current dividend obligations of $1.2 billion per year, restoring 24 months of coverage would require a cash reserve of approximately $2.8 billion, roughly twice what Strategy holds today,” Moreno said. “A higher cash reserve is the most direct signal the market needs to regain confidence in STRC.”
How Strategy’s funding choices could affect MSTR common shareholders
Strategy’s broader Bitcoin thesis remains central to how investors interpret these developments, because the firm holds a large BTC balance acquired at much higher reported averages than the spot price level referenced in the source. The article states Strategy holds 847,363 BTC, with an average acquisition cost around $75,650 per coin, compared with a BTC price of roughly $62,600 at the time of writing.
In downturns, selling Bitcoin to generate cash can conflict with a long-running accumulation narrative—especially if sales “lock in” losses. Instead of liquidating BTC, the source argues that Strategy has been leaning into alternative levers: raising STRC’s dividend rate and issuing additional MSTR common shares to raise cash.
To illustrate that approach, the article points to an SEC filing. It states Strategy sold 2.71 million MSTR common shares for about $335.5 million in June, while using only about $34.9 million of those proceeds to buy 520 BTC. The remaining cash would therefore be available to support dividend and other obligations rather than increasing the Bitcoin position.
That funding structure helps explain the dilution concern: raising equity to preserve Bitcoin holdings may keep BTC exposure largely intact, but it can increase the number of shares outstanding. For existing MSTR common shareholders, that means the path to maintaining the Bitcoin strategy may come with a built-in equity dilution tradeoff.
What to watch next for the stock and preferred dividends
As long as STRC stays below $100 and coverage remains tight, the market may continue to treat dividend funding as an active risk rather than a settled commitment. The article suggests that Strategy could respond by continuing common-share issuance, slowing Bitcoin purchases, or seeking ways to rebuild cash reserves—each of which could amplify pressure on MSTR if the market interprets it as weakening the common equity’s risk profile.
Traders and long-term investors will likely focus on whether MSTR confirms a monthly breakdown beneath the $100–$105 neckline zone, and whether CryptoQuant’s coverage metrics stabilize—particularly if STRC trading begins to reflect improved confidence in dividend durability.
Crypto World
ENS DAO Opens Temp Check on Handing Treasury and Day-to-Day Authority to ENS Foundation


The ENS DAO opened a temp-check proposal Friday that would shift treasury control, grants administration and long-term capital strategy to an expanded ENS Foundation. Tokenholders would keep protocol-layer authority and the power to remove directors. Katherine Wu, an ENS Foundation board member… Read the full story at The Defiant

Cboe Global Markets is stepping further into prediction markets with the launch of a new platform, Cboe Predicts, offering binary options linked to the S&P 500. The product debuts with contracts based on whether the index will finish its trading day above or below predefined price levels.
According to a Tuesday press release, the contracts are now available via Interactive Brokers. Cboe expects additional retail distribution through Charles Schwab and other brokerage platforms in the coming months. The move underscores how quickly outcome-based trading has become a competitive battleground between traditional exchanges and crypto-native prediction venues.
Key takeaways
- Cboe Predicts launches with binary “yes” or “no” contracts tied to the S&P 500’s daily closing level.
- The contracts are initially available through Interactive Brokers, with plans to expand to Charles Schwab and other retail brokers later.
- Cboe says the offerings are built to trade under the existing US options regulatory framework, aiming for “institutional-grade liquidity.”
- The launch comes amid heightened US legal and regulatory attention on prediction markets, particularly around sports and political contracts.
- Competition already exists: S&P 500-related contracts are reportedly available on platforms such as Polymarket and Kalshi.
A traditional exchange enters outcome-based trading
Binary contracts are simple in concept: traders place a position on the likelihood of a specific outcome. In this case, Cboe Predicts centers on whether the S&P 500 will close above or below a predetermined price threshold. These “yes” or “no” structures are designed to let participants express a view on short-term market direction without trading the index itself.
What makes the release notable isn’t just that Cboe is launching a new product—it’s that it’s entering a segment that has increasingly drawn retail attention. By packaging the contracts as security options within the established US options framework, Cboe is attempting to offer a pathway that traders already recognize from conventional derivatives markets.
In remarks tied to the launch, Cboe pointed to growing customer demand for shorter-dated, outcome-based trading opportunities. The implication for traders is straightforward: more vehicles are emerging that may allow faster turnover and more frequent “event-style” positioning based on market closes and other measurable triggers.
How Cboe’s structure differs from crypto-native venues
Cboe said its new contracts will trade within the same regulatory framework as other US-listed options, characterizing the platform as providing “institutional-grade liquidity” and transparency. While the underlying mechanics—binary outcomes and time-bounded events—will feel familiar to users of prediction markets, Cboe’s approach attempts to reduce friction for participants accustomed to conventional brokerage and exchange operations.
This matters because distribution and compliance are often decisive factors in whether prediction market activity scales beyond niche audiences. By integrating with mainstream brokerage channels—starting with Interactive Brokers and expanding to Charles Schwab—Cboe is aiming at a broader retail base that may prefer regulated access over more experimental venues.
At the same time, the product faces a wider industry backdrop: earlier reports indicated Charles Schwab was seeking to enter prediction markets through a partnership with Cboe, with similar S&P 500-linked contracts. The current launch suggests that those discussions are translating into real customer access rather than remaining a concept.
Regulatory pressure continues to shape what prediction markets can offer
Cboe’s entry comes as prediction markets face mounting scrutiny in the United States, particularly around contracts that resemble political betting or event wagering tied to sports. In recent coverage, multiple developments have highlighted how uneven the regulatory landscape can be.
For instance, Kentucky was reported as the latest state to sue five prediction market platforms, including Kalshi and Polymarket, alleging they were operating “unlicensed and illegal sports betting and gambling platforms.” The dispute reflects a broader pattern: regulators and states have pursued cases that treat certain outcome contracts as gambling rather than market infrastructure.
There has also been pressure at the federal level. Earlier, US lawmakers proposed legislation aimed at restricting political prediction market trading by government officials following a widely cited example involving a Polymarket user who reportedly profited over $400,000 on a contract related to the removal of former Venezuelan President Nicolás Maduro—an episode that fueled insider-trading concerns.
For investors and builders watching this space, the key takeaway is that prediction markets are not operating under a uniform set of rules. Even as platforms compete on product design—shorter deadlines, clearer settlement, and more popular event categories—the permissible boundaries continue to shift based on jurisdiction, contract type, and perceived intent.
Why S&P 500 binary contracts may be the “safe” wedge
One reason S&P 500-linked markets are strategically attractive is that they can be framed as finance-based forecasting rather than pure wagering on entertainment or political outcomes. The contracts reference a widely followed benchmark and settle based on a transparent, widely observed data point: the index’s daily close.
The source also notes that S&P 500 contracts are already available on prediction market platforms such as Polymarket and Kalshi. Cboe’s launch, then, looks less like a brand-new category and more like a push to capture a segment of demand that already exists—while doing so through distribution that may feel more familiar to mainstream market participants.
Investors should also watch how Cboe positions liquidity, settlement clarity, and accessibility as the product rolls out to additional brokers. While the binary concept is straightforward, user retention often hinges on execution quality: spreads, depth, the frequency of contract opportunities, and how smoothly users can move between traditional brokerage accounts and these “event-style” derivatives.
Next, market participants will likely focus on how quickly Cboe expands Cboe Predicts beyond Interactive Brokers to Charles Schwab and whether the platform can maintain strong trading depth as competition from existing prediction venues continues. At the same time, the broader regulatory question—how US authorities draw the line between finance-linked forecasting and prohibited gambling—will remain a central factor shaping what other “event” contracts may follow.
BlackRock now formally recommends a 1-2% Bitcoin position to improve portfolio returns. The world’s largest asset manager believes the allocation works less like a bet on price and more like a precision tool for managing risk.
The shift carries weight because BlackRock manages more capital than any rival, giving the framework immediate gravity across institutional finance.
The Logic Behind a 1 to 2% Bitcoin Allocation
A Bitcoin position is a defined slice of a broader portfolio designed to introduce an uncorrelated asset alongside stocks and bonds. BlackRock is treating that slice as a structural improvement tool, not as a wager on Bitcoin reaching any particular price target across the next cycle.
The case rests on math rather than conviction. Bitcoin’s daily moves rarely align with those of equities or fixed income. As a result, even a modest exposure can lift the risk-adjusted return of a portfolio without meaningfully expanding overall volatility on a day-to-day basis.
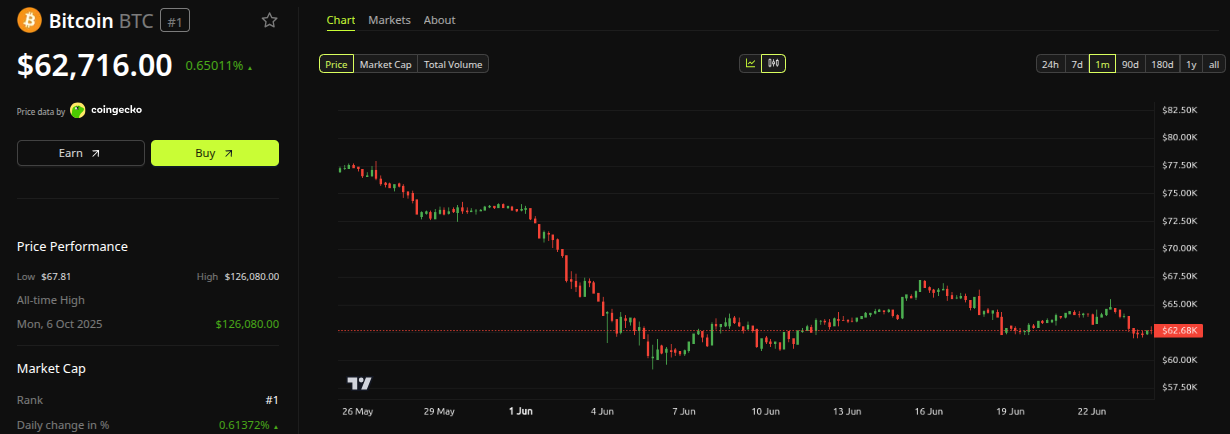
Bitcoin currently trades around $62,716 after slipping 4.30% over the past seven days, according to CoinGecko data. The drop illustrates exactly why the firm caps the recommendation at 2%. Sharp moves are normal for the asset, but a small sleeve absorbs the swings rather than letting them dominate.
Follow us on X to get the latest news as it happens.

The 1-2% range was chosen for surgical care. A wipeout of the entire Bitcoin sleeve would dent the portfolio by one or two percent. Conversely, a strong Bitcoin year still flows through the bottom line. Both outcomes stay within tolerable boundaries for serious allocators.
Michael Gates, who leads model portfolio strategy at BlackRock, made the philosophy explicit. He said a modest allocation could potentially impact portfolio returns without dominating day-to-day risk. Furthermore, the comment reframes Bitcoin from a speculative chip into a structural diversifier.
“BlackRock suggests a 1 to 2% Bitcoin position for better portfolio returns and diversification benefits. #BlackRock just put it in writing. A 1%–2% allocation recommendation hits different when it comes from the world’s largest asset manager. The question is no longer ‘whether’ to allocate – it’s ‘how much.’ #BTC is evolving from speculation to institutional asset class. ‘Complementary diversification tool’ – precise wording. Not hype, not rejection. Just a cold risk-reward calculation. When the giants start talking allocation percentages, the game has already changed,” one analyst said on X.
What IBIT Adds to the BlackRock Bitcoin Position
The recommendation does not float in the abstract. BlackRock also runs IBIT, the iShares Bitcoin Trust, which manages more than $47 billion in assets as of March 2026. The fund is officially. The fund is officially the world’s largest and most actively traded Bitcoin ETF.
IBIT launched in January 2024, just before United States regulators approved the first wave of spot Bitcoin ETFs. The product holds actual Bitcoin in regulated custody, giving traditional investors clean exposure through familiar brokerage rails rather than crypto-native infrastructure or self-custody.

That combination is unusually powerful. A pension fund or family office can now adopt BlackRock’s 1 to 2% framework and allocate funds directly to IBIT shares. As a result, the operational friction that historically blocked institutions from exposure to Bitcoin has effectively collapsed across the entire market.
The framework also carries cultural weight, given Larry Fink’s history. The BlackRock CEO called Bitcoin an “index for money laundering” back in 2017. He has since publicly reversed course, saying he was wrong about the asset and treating the comment as a clear lesson in re-evaluating shifting markets.
The deeper point sits in language. BlackRock is supplying smaller institutions with the vocabulary they need to defend Bitcoin exposure before investment committees. That, more than any single price prediction, is how a once-fringe asset migrates into the mainstream playbook of professional portfolio construction.
Subscribe to our YouTube channel to watch leaders and journalists provide expert insights.
The post BlackRock Told Institutions Exactly How Much Bitcoin to Hold appeared first on BeInCrypto.
Crypto World
1,200 Tech Companies Tell Senate to Pass CLARITY Act as Lummis Calls Code-as-Crime Risk an 'Absurdity'


The Consumer Technology Association, the industry group that represents more than 1,200 technology companies including Amazon, Apple and Google, urged the Senate to bring the CLARITY Act to the floor without delay. Senator Cynthia Lummis followed the next morning with an on-record statement that… Read the full story at The Defiant


Tokenomics is the study of how a crypto token’s supply, distribution, and incentives are designed, and it is the single most useful lens for telling a serious project from a trap. Once you can read a token’s supply schedule and unlock calendar, a lot of crypto stops being mysterious.
Summary
- Tokenomics determines how a crypto token’s supply, distribution, utility, and release schedule are structured, making it a key factor in assessing long term risk and value.
- Large gaps between circulating supply and fully diluted valuation can signal significant future dilution as locked tokens enter the market through vesting and unlock schedules.
- Insider allocations, token emissions, burn mechanisms, and real world utility often reveal whether a project’s token economy is built for sustainability or faces ongoing selling pressure.
Tokenomics is the design and study of a cryptocurrency token’s economy: how many tokens exist, how new ones are created or destroyed, who holds them, how they are released over time, and what they are actually used for. The word is a blend of “token” and “economics,” and it matters because a token’s price is driven not only by demand but by the supply mechanics baked into its design, mechanics that are written into code and published in advance. Two projects with identical hype can perform very differently because one releases its tokens slowly to aligned long-term holders while the other dumps a flood of unlocked tokens onto the market every month. Learning to read tokenomics is how you tell those two apart before you buy, not after.
This guide breaks tokenomics into the pieces that actually move prices, with no finance background assumed. It covers the different kinds of token supply and why the distinction matters, the difference between market capitalization and fully diluted valuation, how token distribution reveals who really controls a project, the vesting and unlock schedules that quietly determine future selling pressure, the supply mechanics like burning and emissions that expand or shrink a token over time, what gives a token actual utility, and a worked example that ties it all together. By the end you will be able to look at a token’s supply page and unlock calendar and form a grounded view of its risks, which is a skill that protects you from a large share of crypto’s most common traps.
The three kinds of supply
The first thing to understand is that “how many tokens are there” has three different answers, and confusing them is one of the most common and costly mistakes new buyers make. Circulating supply is the number of tokens actually available and trading on the market right now. Total supply is the number that exists today, including tokens that are locked, reserved, or otherwise not yet circulating. Maximum supply is the absolute ceiling, the most tokens that will ever exist. Bitcoin, famously, has a maximum supply of twenty-one million coins, a hard cap that can never change. Many tokens have no maximum at all, meaning new units can keep being created indefinitely.
The gap between these numbers is where danger and opportunity hide. A token might have a small, healthy-looking circulating supply that makes its price seem reasonable, while a vast reserve of locked tokens waits in the background, scheduled to flood the market over the coming years. When those locked tokens release, they add selling pressure that can crush the price even if nothing about the project has changed, simply because supply expanded. So the question is never just “what is the price.” It is “what is the price, how many tokens circulate now, how many will exist eventually, and how fast does the gap close.” A token where circulating supply is close to total supply has most of its dilution behind it. A token where circulating supply is a small fraction of the total has most of its dilution still to come, and that pending supply is a headwind every future buyer inherits.
Market cap versus fully diluted valuation
This brings us to two numbers that beginners constantly mix up, with expensive consequences: market capitalization and fully diluted valuation. Market capitalization, or market cap, is the token’s price multiplied by its circulating supply. It tells you what the market currently values the actively trading tokens at, and it is the right number for comparing the present size of two projects. A token priced at one dollar with one hundred million tokens circulating has a market cap of one hundred million dollars.
Fully diluted valuation, or FDV, is the token’s price multiplied by its total or maximum supply; in other words, what the project would be worth if every token that will ever exist were already trading at today’s price. The gap between market cap and FDV is the single most revealing ratio in tokenomics. Imagine that same one-dollar token has a market cap of one hundred million dollars but a maximum supply of one billion tokens, giving it an FDV of one billion dollars. That means ninety percent of the eventual supply is not yet circulating, and as it unlocks, either the price must fall to keep the valuation steady or new demand must absorb every one of those tokens just to hold the price flat. A low ratio of market cap to FDV is a flashing warning that enormous future supply is coming, and many tokens that look cheap by market cap are quietly expensive once you account for the dilution baked into their FDV. Always check both numbers, never just the one the project prefers to show you.
Distribution: who actually holds the tokens
Numbers about supply mean little without knowing who controls it, which is why token distribution, the breakdown of who received the tokens at launch, is so important. A typical allocation divides the supply among several groups: the team and founders, early investors such as venture funds, a treasury or foundation reserve, rewards for the community, and the portion sold or distributed to the public. The percentages and the conditions attached to each tell you how fairly a project is structured and where future selling pressure will come from.
The warning signs are recognizable once you know to look. If insiders, meaning the team and early investors, hold a very large share of the supply, they have the power to overwhelm the market when their tokens unlock, and their interests may not align with ordinary buyers who paid far higher prices. A project where eighty percent of the supply sits in a single wallet, or where private investors bought in at a fraction of the public price, is structurally tilted against late buyers. The opposite end is a fair launch, where no insiders get a privileged early allocation, and the tokens are distributed broadly from the start, an approach common among community-driven tokens. Most projects sit somewhere in between, and the goal is not to demand perfection but to understand the structure: a heavy insider allocation is not automatically fatal, but it is a risk you should price in, especially when combined with the unlock schedule that decides when those insiders can sell.
Vesting and unlocks: the calendar that moves prices
If there is one section of this guide to internalize, it is this one, because vesting and unlock schedules quietly determine a token’s future supply pressure more than almost anything else. Vesting is the practice of locking up tokens allocated to insiders and releasing them gradually over time, rather than all at once, so that the team and early investors cannot dump their entire allocation the moment trading begins. A vesting schedule typically has two features: a cliff, an initial period during which nothing unlocks at all, and a release schedule, the rate at which tokens drip out afterward. A common structure might be a one-year cliff followed by tokens releasing monthly over the next two or three years.
The reason this matters so much is that every unlock is a scheduled, predictable increase in circulating supply, and large unlocks often coincide with price weakness as newly freed tokens hit the market. A project might trade calmly for months and then face a “cliff unlock,” a single date when a huge tranche of team or investor tokens becomes sellable all at once, which can swamp demand and drive the price down regardless of how the project is doing. Because these schedules are published in advance, often tracked on dedicated unlock-calendar tools, you can see the supply waves coming. Before buying a token, checking its unlock calendar is as important as checking its price: you want to know whether a large unlock is days away, who it benefits, and how big it is relative to the circulating supply. A ten percent supply unlock landing next week is a very different proposition from a token whose insiders are already fully vested with no major unlocks left. Smart buyers treat the unlock calendar as a core part of the decision, not an afterthought.
Supply mechanics: burning, emissions, and inflation
Beyond the initial design, tokens have ongoing mechanics that expand or shrink the supply over time, and these determine whether a token is inflationary or deflationary. Emissions are newly created tokens released as rewards, for instance to stakers, liquidity providers, or miners. Emissions are how many networks pay for their own security and growth, but they are also a form of inflation: if a protocol mints lots of new tokens to hand out as rewards, the supply grows, and unless demand keeps pace, each token is worth proportionally less. A high-yield farm paying out in a freely inflating token is often quietly diluting the very holders it is paying.
The counterweight is burning, the permanent removal of tokens from circulation by sending them to an address no one can access. Projects burn tokens for several reasons: to offset emissions, to return value to holders, or as a built-in feature of the network. Ethereum, for example, burns a portion of the fees paid on every transaction, which means heavy network usage can shrink supply and partly or fully offset the new ether created for validators. When you assess a token’s long-term supply trajectory, the question is the net balance: are tokens being created faster than they are destroyed, or the reverse. A token with high emissions and little burning faces persistent inflationary pressure, while one with modest emissions and meaningful burning can hold or even reduce its supply. Neither is automatically good or bad, but the direction matters: inflation that outruns demand erodes price, while a credibly shrinking supply supports it.
Utility: what the token is actually for
All the supply analysis in the world cannot save a token that has no reason to exist, which is why utility, what the token actually does, sits at the foundation of sound tokenomics. A token’s utility is the set of real uses that create demand for holding or spending it. Strong forms of utility include paying for transaction fees on a network, staking to secure a blockchain and earn rewards, granting governance rights to vote on a protocol’s decisions, or serving as the required medium of exchange within a particular application. The more essential a token is to using something people genuinely want to use, the more durable the demand for it.
The weak case is a token with little purpose beyond speculation, where the only reason to buy it is the hope that someone else will pay more later. Many tokens are designed so that their utility is thin or circular, for example, a governance token for a protocol no one uses, or a reward token whose only function is to be farmed and sold. This does not mean such tokens never rise; plenty do, driven by narrative and momentum, and memecoins openly embrace having culture rather than utility as their value. But for a project presenting itself as serious infrastructure, the honest question is whether removing the token would break the system or merely remove a speculative chip. Real utility ties the token’s demand to the success of the product, aligning holders with usage. Thin utility leaves the price floating on sentiment alone, which is a far more fragile foundation, especially when the unlock schedule starts adding supply.
Red flags: tokenomics warning signs to watch
Once you can read the individual pieces, certain combinations should make you pause, and learning to spot them quickly is what turns tokenomics from theory into protection. The clearest warning sign is a very low ratio of market cap to fully diluted valuation paired with heavy insider ownership. A token where only a small fraction of the supply circulates and most of the rest sits with the team and early investors is a structure where enormous future supply is coming and the people who control it bought in cheaply. That does not doom the token, but it stacks the deck against anyone buying at the current price, because the insiders can profit handsomely while late buyers absorb the dilution.
A second red flag is a large unlock arriving soon. A token that has traded calmly can face a “cliff” date when a big tranche of insider or investor tokens becomes sellable all at once, and that wave of new supply can overwhelm demand regardless of how the project is doing. Because unlock schedules are public, a buyer who fails to check the calendar is choosing not to see a risk that is sitting in plain view. Pair a looming unlock with insiders sitting on large paper gains, and the incentive to sell into that unlock is obvious. A third sign is high emissions with little or no burning, which means the supply is inflating steadily; a juicy advertised yield paid in a freely inflating token can quietly dilute you faster than the yield enriches you.
The subtlest red flag is thin or circular utility. If you cannot answer the simple question “why would anyone need to hold or use this token,” the price is floating on sentiment alone, which is a fragile foundation, especially when the supply schedule is adding tokens. Watch for governance tokens attached to protocols nobody uses, reward tokens whose only purpose is to be farmed and sold, and projects whose pitch is all narrative with no mechanism that ties demand to real activity. None of these signs is automatically fatal on its own, and plenty of tokens with imperfect structures still rise on momentum. The point is not to find a flawless project but to see the structure clearly and price the risk, so that a token’s design informs your decision instead of ambushing you after you have bought.
A worked example: reading a token at a glance
Put the pieces together with a hypothetical token, and you will see how quickly the picture forms. Suppose a new project’s token trades at two dollars. Its circulating supply is fifty million tokens, giving a market cap of one hundred million dollars, which sounds like a modest, mid-sized project. But its maximum supply is five hundred million tokens, so its fully diluted valuation is one billion dollars, and right away you know that ninety percent of the eventual supply is not yet circulating. That single ratio reframes everything: the token is far more expensive than its market cap suggests once dilution is accounted for.
Now look deeper. The distribution shows that forty percent of the supply went to the team and early investors, who bought in at twenty cents, a tenth of the current price, so they are sitting on large paper gains and have strong incentive to sell. The vesting schedule reveals a one-year cliff that ends in two months, after which those insider tokens begin unlocking at five percent of total supply per month. Putting it together: a token trading at a rich fully diluted valuation, with most of its supply still locked, held heavily by insiders who are about to start unlocking large monthly tranches at a tenth of their cost basis. None of that guarantees the price will fall, but it tells you exactly where the pressure will come from and when, and it lets you weigh that against the token’s actual utility and demand. A buyer who checked only the one-hundred-million-dollar market cap would have missed all of it. A buyer who read the tokenomics sees the whole board. That is the entire value of this skill: it turns a token from a price on a screen into a structure you can actually evaluate.
Frequently Asked Questions
What does tokenomics mean?
Tokenomics is the design and study of a crypto token’s economy: how many tokens exist, how they are created or destroyed, who holds them, how and when they are released, and what the token is used for. It blends “token” and “economics.” Tokenomics matters because price depends not just on demand but on supply mechanics written into a project’s code, so reading them helps you judge a token’s risk before buying rather than after.
What is the difference between market cap and FDV?
Market capitalization is the token’s price multiplied by its circulating supply, the value of the tokens trading right now. Fully diluted valuation, or FDV, is the price multiplied by the total or maximum supply, the value if every token that will ever exist were already trading. A large gap between them means much of the supply is not yet circulating and will dilute holders as it unlocks. A token can look cheap by market cap yet be expensive once FDV reveals the pending supply.
Why do token unlocks affect price?
An unlock releases previously locked tokens, usually held by the team or early investors, into the circulating supply. That increases the number of tokens available to sell, and large unlocks often coincide with price weakness because the new supply can overwhelm demand. Because unlock schedules are published in advance, you can see these supply waves coming. Checking a token’s unlock calendar before buying tells you whether a big release is imminent and how large it is relative to the circulating supply.
What is vesting in crypto?
Vesting is the gradual release of tokens allocated to insiders such as the team and early investors, instead of giving them everything at launch. A typical schedule has a cliff, an initial period when nothing unlocks, followed by a steady release over months or years. Vesting is meant to align insiders with the project’s long-term success and to prevent them from dumping their entire allocation immediately. The schedule also tells future buyers when supply pressure from insider selling is likely to arrive.
What makes tokenomics good or bad?
Healthier tokenomics generally feature a circulating supply close to the total, a reasonable gap between market cap and FDV, broad distribution without excessive insider concentration, gradual vesting without enormous looming cliffs, a sustainable balance between emissions and burning, and genuine utility that ties demand to real usage. Riskier tokenomics show the opposite: heavy insider holdings, a tiny circulating fraction with huge pending unlocks, high inflation, and thin or speculative utility. The goal is to understand and price these traits, not to demand perfection.
What is the difference between inflationary and deflationary tokens?
An inflationary token has a supply that grows over time, usually through emissions that reward stakers, miners, or liquidity providers; unless demand keeps pace, each token’s share of value falls. A deflationary token has a supply that shrinks, typically through burning, the permanent removal of tokens from circulation. Many tokens combine both, creating and destroying units at the same time, so what matters is the net balance. Bitcoin is disinflationary with a hard cap, while some tokens burn enough to offset or exceed their emissions.
This guide is educational information, not financial advice. Tokenomics helps you assess risk but does not predict price, and supply figures, schedules, and valuations vary by project and change over time, as of June 24, 2026. Always verify a token’s current supply and unlock data from primary sources before relying on it.
Crypto World
Forgotten coin litecoin (LTC) could surprise everyone before its next halving: Crypto Daily


Traders may want to keep an eye on in the coming weeks and months. One of the earliest altcoins, LTC may see bullish price action, potentially outperforming the broader market, including bitcoin .
Here’s why.
Litecoin’s fourth reward halving is due around July 27, 2027 when the payment will drop by 50% to 3.125 LTC. Litecoin has a peculiar tendency to bottom out anywhere between six to 12 months before the event.
The evidence is there.
LTC bottomed in late June 2022 at around $40, just over a year before the third halving on Aug. 2, 2023. In the intervening period, it rallied to as high as $114 by July 2023, only to pull back to $80 in the lead-up to the event. In November 2022, the month that crypto exchange FTX collapsed and pulled down the wider market, litecoin actually rose more than 40%.
A similar pattern played out before the first two halvings. In each case, LTC bottomed out months beforehand, rallied and then dropped back a bit into the event. (Check the Daily Signal)
If history holds true, that means litecoin could find a bottom any time now.
After Strategy’s dividend coverage fell to 14 months from seven years, CryptoQuant thinks the company led by Michael Saylor should pause Bitcoin purchases and focus on replenishing its cash reserve that’s down 38% year-to-date.
Strategy’s dividend obligations have nearly quadrupled to $1.2 billion, as the company issued substantial new STRC preferred stock, which carries an 11.5% yield.
“They should pause Bitcoin purchases, rebuild cash reserves, and adopt a systematic framework for purchase timing,” wrote the market data analytics provider’s CEO Ki Young Ju in a Wednesday X post, adding that the biggest public Bitcoin treasury holder should also create a “disciplined selling framework” for the next bull market.
Strategy’s cash reserve fell 38% after the company repurchased $1.5 billion of its 2029 senior notes at a discount, Cointelegraph reported on May 26. Those coffers have since recovered to $1.4 billion after it sold $335.5 million in MSTR shares, which added $300 million to its US dollar reserve on Monday, although it is near a record-low of 14 months’ of funds available to pay dividends.
STRC preferred shares hit by BTC correction
Strategy’s income-generating preferred stock, STRC, fell to $82.50 last week, a record 17.5% below its $100 par value. CryptoQuant’s report attributed it to the Bitcoin bear market correction and the “simultaneous depletion” of its cash reserve.
STRC is one of Strategy’s main mechanisms to fund its Bitcoin accumulation. Trading below par limits Strategy’s ability to raise funds through STRC sales. It may also force the company to increase its nominal dividend rate to attract buyers and protect STRC’s price.
The company said it plans to “continue replenishing” its USD reserve to “support the credit quality of its Digital Credit securities,” according to a Monday X post.
Cointelegraph’s request for comment on Strategy’s plans to replenish the cash reserve and whether this could help STRC’s price recover was not immediately replied to by the company.

Strategy cash reserve and dividend coverage in months. Source: CryptoQuant
No obligation to sell Bitcoin to support STRC price
CryptoQuant said Strategy is not “obligated” to sell Bitcoin to maintain STRC’s price, as the company can also deploy other tools to defend the stock, such as raising the current 11.5% dividend yield or issuing MSTR stock to “signal its ability to continue paying dividends,” adding:
“However, the path back to $100 is not straightforward.[…] Rebuilding the cash reserve to ~$2.8 billion (24 months of coverage) is a necessary condition for STRC to recover.”
Strategy’s Bitcoin holdings only provide a “limited emergency cushion,” as the company is sitting on about $10.6 billion in unrealized losses, meaning that a forced BTC sale at current rates would “crystallize large losses and destroy shareholder value,” CryptoQuant said.
Related: Capital B shareholders approve up to $120B in financing capacity for Bitcoin strategy
Ahead of Wednesday’s Nasdaq market open, STRC shares were little changed after closing at $87.31 on Tuesday. That extended the preferred stock’s 12% decline in the past month, according to Yahoo Finance data.
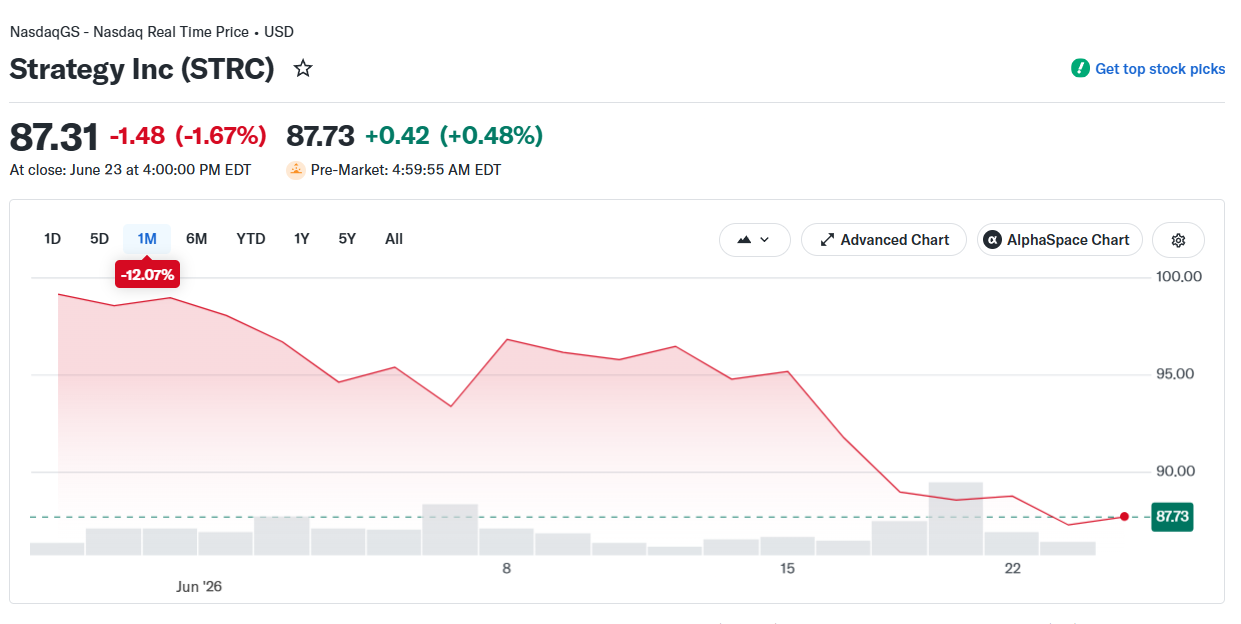
STRC/USD, 1-month chart. Source: Yahoo Finance
CryptoQuant’s head of research, Julio Moreno, attributed STRC’s decline to a “deterioration in Strategy’s fundamentals,” including its falling dividend cash coverage caused by the depletion of its cash reserve and a fourfold increase in STRC’s annualized dividend obligations so far in 2026.
Magazine: Bitcoin, the ‘canary in the coal mine,’ XRP transaction demand falls 91.5%: Market Moves
London, United Kingdom, June 24th, 2026, Chainwire
OpenPayd, a leading provider of financial infrastructure, has secured authorisation under the EU’s Markets in Crypto-Assets (MiCA) framework, strengthening its ability to deliver regulated stablecoin infrastructure across Europe.
The milestone comes one year after OpenPayd launched its stablecoin infrastructure, enabling businesses to move and manage fiat and digital assets through a single platform. Since launch, adoption has expanded across treasury, settlement and cross-border payment use cases as businesses increasingly seek regulated pathways into the digital asset economy. Today, OpenPayd processes more than $240 billion in annualised volume for over 1,100 businesses globally, including Kraken, eToro, OKX and B2C2.
The MiCA authorisation enables OpenPayd to operate as a regulated crypto-asset service provider (CASP) under a unified European regulatory framework, allowing the company to provide regulated crypto-asset services to clients across the EEA through a single licence.
Through the authorisation, OpenPayd can offer regulated digital asset services including fiat-to-stablecoin on and off-ramping, custody, wallet infrastructure and global stablecoin transfers across major blockchain networks. Through a single API, businesses can seamlessly move and manage money across both traditional financial rails and digital assets.
Iana Dimitrova, CEO of OpenPayd, said, “Stablecoins are rapidly becoming part of mainstream financial infrastructure. MiCA is a major step forward for Europe because it gives businesses the assurance to leverage digital asset technology to improve their payments and treasury and to grow.
At OpenPayd, we are building the universal financial infrastructure for the digital economy. This authorisation strengthens our ability to help businesses move and manage money globally through a single platform that seamlessly connects traditional finance and digital assets.”
The MiCA approval forms part of OpenPayd’s broader investment in regulatory infrastructure and global connectivity across both fiat and digital asset services. Together with its existing regulatory permissions and banking network, OpenPayd is building one of the industry’s most comprehensive regulated infrastructures for global money movement.
About OpenPayd
OpenPayd is building the universal financial infrastructure for the digital economy. Founded in 2018 by Dr. Ozan Ozerk, its rails-agnostic platform enables businesses to move and manage money globally – across fiat and digital assets – through a single, powerful API. OpenPayd provides embedded accounts, FX, domestic and international payments, Open Banking, and stablecoin on/off ramps – delivering interoperability between traditional finance and digital assets. With one of the most comprehensive banking networks in the market, OpenPayd enables real-time money movement, everywhere.
Trusted by global brands including eToro, Kraken, OKX, and B2C2, OpenPayd processes more than $240 billion in annual volumes for over 1100 businesses. It is the infrastructure layer powering the next generation of financial services.
Contact
OpenPayd
press@openpayd.com

Samsung HW-QS90H Soundbar Review: Samsung’s Loaded New Standalone Atmos Bar Takes on Sonos
Marcus Rashford vindicated as Spanish media reach agreement on England star

10 Things to Know About Meta’s Smart Glasses as New $299 Models Launch


-

 Fashion5 days ago
Weekend Open Thread: Miami – Corporette.com
-

 Entertainment4 days ago
Renter of Home in Anne Heche Crash Denies Settlement With Son
-

 Tech2 days ago
Microsoft accidentally kills epic Outlook email threads
-
 Sports18 hours ago
Two goals and an assist by sheer aura: Cristiano Ronaldo just entered the World Cup chat
-

 Business4 days ago
Soccer-U.S. defends Iran World Cup travel restrictions, says discussions ongoing
-
Crypto World9 hours ago
Bitcoin (BTC) Dips Below $62K, Ethereum (ETH) Plunges 6% Daily: Market Watch
-

 Crypto World6 hours ago
Securitize Wraps Roubini's SEC-Registered ETF as Dubai VARA Digital Security
-

 Politics6 days ago
BBC Reporter Discusses Cross Party Criticism Of Trumps Iran Deal
-
Business12 hours ago
Entergy settles forward sale agreements, raises $672 million in cash proceeds
-
 Business4 days ago
Wall Street Week Ahead: Investors see Micron earnings as pulse check of AI rally momentum
-

 Politics4 days ago
Andy Burnham and the meaning of Makerfield
-

 Tech6 days ago
AWS enters the context layer race with a graph that learns from agents, not manual curation
-
 Crypto World4 days ago
Can Charles Hoskinson Really Rescue Cardano?
-

 Crypto World4 days ago
HIVE shares jump as $220M AI deal speeds Bitcoin mining pivot
-

 NewsBeat5 days ago
Keir Starmer Allies Question His Chances For No 10
-

 Crypto World4 days ago
Jake Chervinsky accuses CME of protecting derivatives monopoly
-

 Tech2 days ago
Nearly 7,000 fake Amazon domains registered ahead of Prime Day 2026, researchers warn
-
 Tech3 days ago
Signal’s Meredith Whittaker says AI chatbots ‘are not your friends’ and calls Copilot agents a backdoor
-

 Business6 days ago
Brexit cost 6% of UK economy, Bank of England company data suggests
-

 Sports6 days ago
FIFA World Cup 2026: Canada beat 9-men Qatar 6-0 to register first ever win | FIFA World Cup 2026
You must be logged in to post a comment Login