

Crypto World
Strategy CEO Phong Le Buys 11,000 STRC Shares Through Revocable Trust


Strategy President and CEO Phong Le acquired 11,000 shares of the company's Series A Perpetual Stretch Preferred Stock, known by its ticker STRC, on June 22, according to a Form 4 filed with the Securities and Exchange Commission. The purchase was made through the Phong Le Revocable Trust, of which… Read the full story at The Defiant


TradingView has expanded its market coverage by adding real-time data for Hyperliquid and Trade[XYZ], giving users access to onchain perpetual and spot markets directly through its charting platform.
Summary
- TradingView has added real-time Hyperliquid and Trade[XYZ] market data to its charting platform.
- Users can now track crypto, equities, commodities, forex, and pre-IPO perpetual markets around the clock.
- The integration comes days after Singapore’s MAS placed Hyperliquid on its Investor Alert List.
According to TradingView, the new integration brings live pricing for Hyperliquid’s crypto perpetual and spot markets alongside Trade[XYZ] markets covering equities, commodities, foreign exchange, and pre-IPO companies.
The data is available through TradingView’s Supercharts, allowing traders to follow price movements throughout the day, including when traditional financial markets are closed.
The addition extends the range of assets available on TradingView without requiring users to leave the platform for onchain market data. Hyperliquid markets appear under the HYPERLIQUID symbol prefix, while Trade[XYZ] listings can be accessed using the HIP3XYZ prefix through the platform’s symbol search.
Hyperliquid expands beyond its core exchange
Built on its own layer-1 blockchain, Hyperliquid operates an onchain perpetual futures exchange that currently supports more than 300 perpetual and spot markets across cryptocurrencies, commodities, and indices.
The ecosystem has also grown through HIP-3, a protocol upgrade that allows third-party developers to launch perpetual markets using Hyperliquid’s infrastructure. Under that framework, Trade[XYZ] has become the first major deployment, offering perpetual markets tied to multiple asset classes, including cryptocurrencies, equities, as well as crypto spot trading.
By adding both Hyperliquid and Trade[XYZ] feeds, TradingView has made those markets available alongside its existing charting tools, enabling traders to monitor perpetual contracts and spot assets from a single interface.
Regulatory attention has continued alongside platform growth
The TradingView integration comes days after the Monetary Authority of Singapore added Hyperliquid to its Investor Alert List, as previously reported by crypto.news.
According to the regulator, the listing covers both the Hyper Foundation website and the Hyperliquid trading application. MAS said the Investor Alert List is intended as a consumer protection measure identifying entities that could be mistakenly viewed as licensed or regulated by the authority. The regulator also stated that inclusion on the list does not constitute a ban or an enforcement action.
Following the listing, Hyperliquid said it had never claimed to be licensed or authorized by MAS.
Despite the regulatory attention, the decentralized exchange has remained one of the largest trading platforms in the sector. According to CoinGecko, Hyperliquid ranks as the sixth-largest decentralized exchange by trading volume. Separately, DefiLlama estimates that the protocol currently secures about $5.76 billion in total value locked.
The latest TradingView integration gives market participants another way to follow activity across Hyperliquid’s expanding ecosystem, combining live data from crypto perpetuals, spot assets, and Trade[XYZ]’s cross-asset markets within a single charting environment.
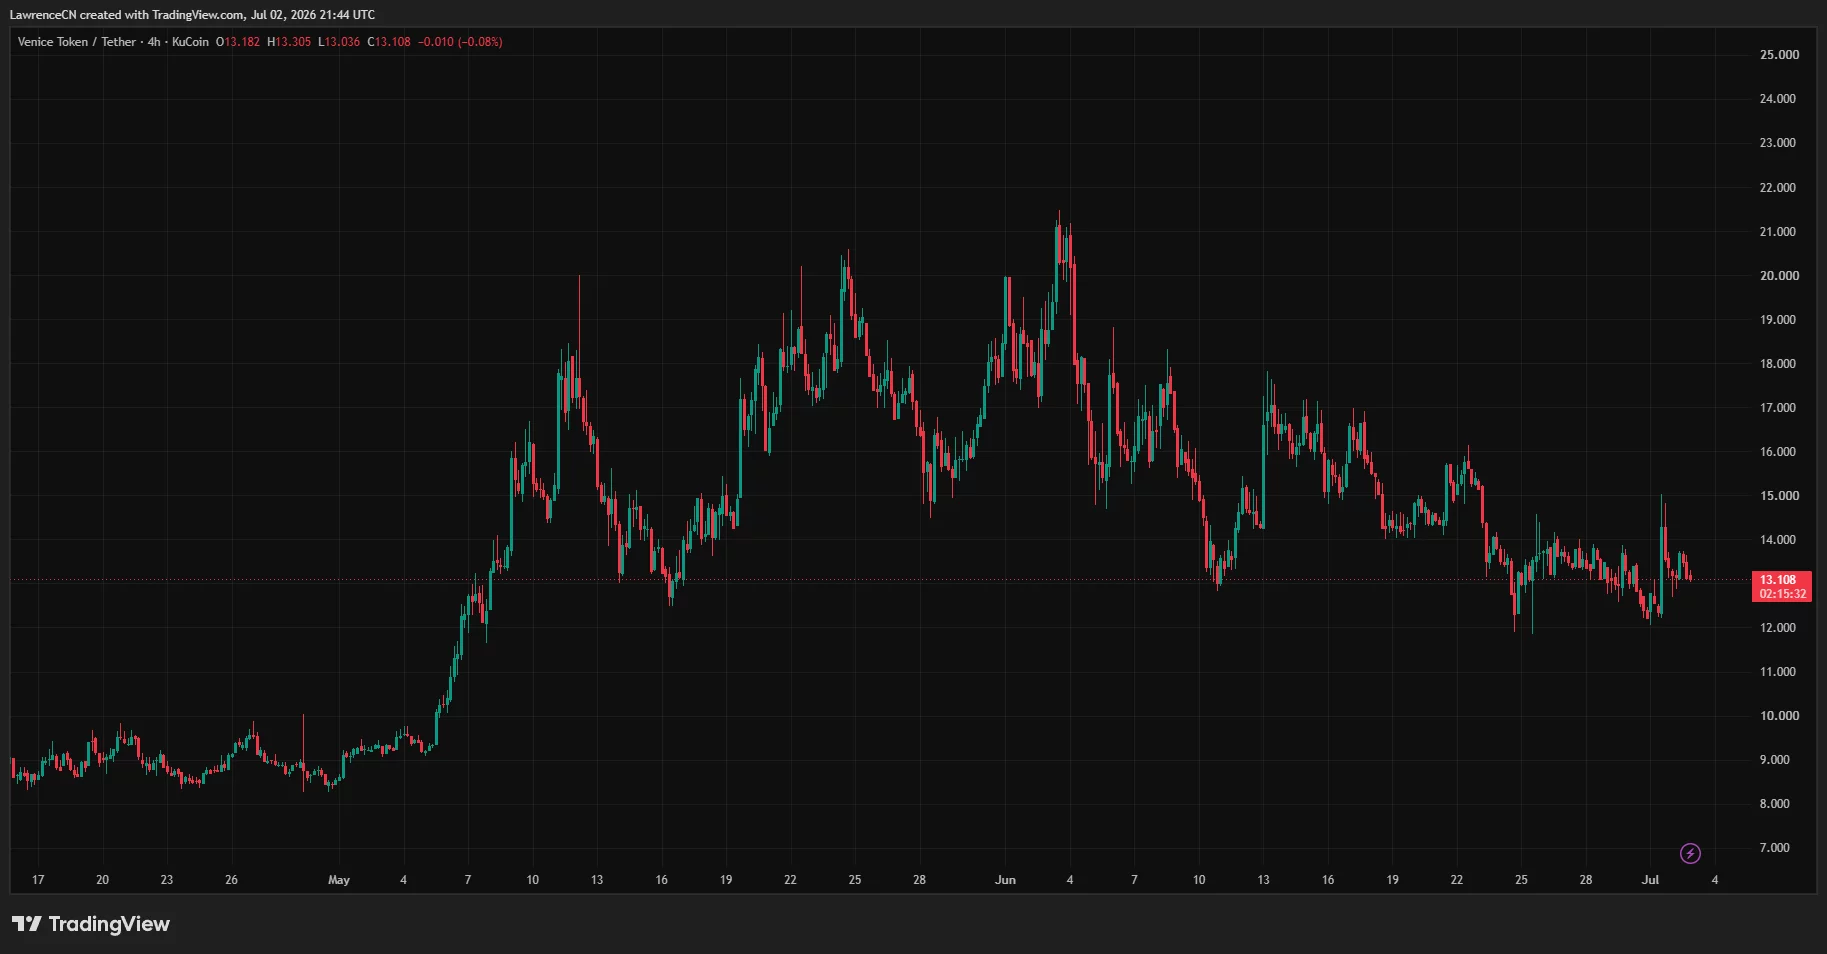
Venice pairs a real product, private, uncensored AI used by millions, with a buy-and-burn token and shrinking emissions. VVV touched $21 in June, then pulled back. Here is the bull case, the bear case, and where VVV could head next.
Summary
- Venice is a private, uncensored generative-AI platform, and VVV is its utility token, used to stake for access to the platform’s AI capacity instead of paying per request.
- VVV stands out among AI tokens for real product traction, with more than 2 million users and millions of monthly visits, plus a buy-and-burn model and staged emissions cuts that add deflationary pressure.
- The token reached an all-time high above $21 in early June 2026 before pulling back into the mid-teens, leaving it below that peak but well above its late-2025 lows.
- The bull case rests on genuine usage, deflationary tokenomics, and the private-AI narrative, while the bear case centers on a weak AI token sector, a history of sharp post-rally retracements, and ongoing token emissions.
- A reclaim of the $21 high is plausible if the AI narrative and burn mechanics align, while a break of support near $14.50 would point back toward the low teens.
Venice and its VVV token occupy an unusual spot in the crypto market: an artificial-intelligence project with an actual product that millions of people use, instead of a token attached to a promise.
VVV climbed to an all-time high above $21 in early June 2026, outperforming Bitcoin over the surrounding month, before retracing into the mid-teens as the AI trade cooled. The combination of real traction, deflationary tokenomics, and a volatile AI narrative makes VVV both compelling and difficult to forecast.
This price prediction covers what Venice is, why VVV is trending, the strongest arguments on each side, the technical picture, and bull, base, and bear scenarios. It is not financial advice, and VVV is a volatile token, so the ranges here are wide.
What is Venice, and why is VVV trending?
Venice is a private, permissionless generative-AI application that lets users produce text, images, and code without accounts, data storage, or surveillance. It emphasizes privacy by keeping conversations on the user’s device and encrypting data in transit, and it positions itself as an uncensored alternative to mainstream AI services that filter outputs and log activity.
VVV is the utility token that powers access to the platform. Instead of paying per request, users, agents, bots, and third-party apps stake VVV to unlock a proportional share of the platform’s inference capacity, and staking can also earn income. In effect, holding and staking VVV is how you buy ongoing access to private AI compute.
What makes VVV unusual among AI tokens is that the product genuinely has users. Venice reports more than 2 million registered users and millions of monthly visits, a level of real traction that most tokens riding the AI narrative simply do not have. That usage matters because it connects the token to an actual service with demand, instead of a roadmap.
When an AI token is backed by a product people use every day, the investment case rests on something more durable than sentiment, even if sentiment still drives the short-term price.
The trend in VVV comes from the intersection of that traction with a strong tokenomic design and a hot narrative. The token surged to an all-time high above $21 in early June 2026, part of a broader wave of interest in AI and privacy-focused crypto, and it has remained one of the more actively searched and discussed tokens since.

The pullback that followed is typical of parabolic moves, but the underlying story, a real private-AI platform with a deflationary token, is why VVV keeps drawing attention instead of fading into the long tail of AI launches.
The bull case for VVV
The bull case begins with product traction that is rare in its category. More than 2 million users and millions of monthly visits give Venice a genuine, revenue-relevant user base, which is exactly what most AI tokens lack. That usage creates real demand for the token, because access to the platform’s AI capacity runs through staking VVV. As more agents, bots, and third-party applications need private, uncensored inference, they have a functional reason to acquire and stake the token, which ties token demand to actual platform adoption rather than to speculation alone.
The second pillar is the tokenomics. Venice uses a buy-and-burn model, where platform revenue is used to buy VVV and remove it from supply, and it has been reducing token emissions in stages, targeting a sharply lower issuance rate, with a further cut scheduled.
Buy-and-burn plus declining emissions is a deflationary combination: it shrinks or slows the growth of supply while usage-driven demand rises. Compared with AI tokens that rely purely on narrative, VVV’s burn mechanics offer structural support that can cushion downturns and amplify upturns, because the supply side is actively working in holders’ favor.
The third pillar is the narrative and the niche. Private, uncensored AI is a distinct and defensible position in a world increasingly worried about surveillance, censorship, and data control. When the AI narrative runs hot, VVV has shown it can move fast, and its differentiated positioning gives it a story that resonates beyond generic AI exposure.
Sitting within an active ecosystem and maintaining strong trading volume adds liquidity to that story. The bull case is that Venice is one of the few AI tokens with real usage, deflationary tokenomics, and a defensible niche, and that a return of the AI trade could carry VVV back to and beyond its highs.
The bear case for VVV
The bear case starts with the sector. Artificial-intelligence tokens have been among the weaker performers in 2026, and a token is not immune to its category: when the AI trade cools, even fundamentally stronger names like VVV get pulled down. If capital continues rotating out of AI tokens, VVV faces a headwind that its product traction cannot fully offset in the short term, because sentiment and sector flows dominate price action over weeks and months even when fundamentals are sound.
The second problem is VVV’s own volatility and history of sharp retracements. The token has a documented pattern of retracing meaningfully after parabolic moves, and its price history is a series of dramatic swings, including an earlier all-time high, a deep decline to near $1, and then a fresh high many months later. That kind of boom-and-bust behavior means buying after a rally carries real risk of a large drawdown, and the move to $21 was itself parabolic. Entry timing relative to the trend matters enormously for a token that can shed a third or more of its value in a normal correction.
The third pressure is on the supply side, which is a double-edged sword. While buy-and-burn and emissions cuts are deflationary forces, VVV still has ongoing token emissions and does not have a hard-capped supply in the way some assets do, so new tokens continue to enter circulation even as the rate slows.
If usage-driven burns fail to keep pace with emissions, or if platform revenue softens, the deflationary thesis weakens. Add competition from the many other AI and privacy tokens vying for the same narrative and capital, and the bear case is that VVV is a strong project whose token remains hostage to a weak sector, its own volatility, and the need for burns to outrun emissions.
The technical picture
VVV’s chart is defined by its June 2026 peak and the pullback that followed. The token set an all-time high above $21 in early June, then retraced into the mid-teens, a decline of roughly a quarter to a third from the top that fits its familiar pattern of post-rally corrections. Despite that pullback, VVV has held well above its late-2025 lows near $1, and over the surrounding month it outperformed Bitcoin, so the medium-term structure has been constructive even as the short-term move cooled.
The levels traders are watching are clear. On the downside, support sits around $14.50, with a deeper level near $12; losing $14.50 would suggest the correction has further to run toward the low teens. On the upside, resistance stands near $18.30, then around $20.40, and finally the all-time high above $21; reclaiming those in sequence would signal renewed momentum. Momentum readings have been broadly neutral, with the token holding above its longer-term moving average, which points to an intact broader uptrend even during the consolidation. That mix, a neutral short-term posture inside a constructive longer-term structure, describes a token digesting a big move instead of breaking down.
The honest technical read is that VVV is consolidating beneath its all-time high, bounded by support near $14.50 and resistance running up to the $21 peak. As with any volatile token, these levels are guides rather than certainties, and a shift in the AI narrative or the broader market can override the chart quickly.
For a price prediction, the technicals frame a wide band: a hold of support keeps a run back toward the highs on the table, while a break of $14.50 tilts the odds toward a deeper retracement into the low teens.
What could move VVV next
The clearest token-specific catalyst is the emissions schedule and burn rate. Venice has been cutting emissions in stages, with a further reduction planned, and each cut tightens supply. If those cuts land while platform usage and revenue keep the buy-and-burn engine running, the deflationary pressure builds, which is supportive for price.
The metric to watch is whether burns are outpacing emissions on a net basis, because that balance determines whether the token’s supply is actually shrinking or merely growing more slowly.
The second driver is user and usage growth. Because token demand is tied to staking for platform access, continued growth in Venice’s user base, and in the agents and applications that need private inference, translates into structural demand for VVV. Evidence that the more than 2 million user base is expanding, and that more third-party demand is flowing through staking, would strengthen the fundamental case. Stagnating usage would do the opposite, leaving the token more dependent on narrative.
The third set of catalysts is external: the AI narrative and the broader market. VVV is sensitive to how the AI token sector trades, so a rotation of capital back into AI would lift it, while continued weakness in the sector would weigh on it regardless of fundamentals. The ecosystem VVV sits within, and its overall liquidity also matter, as does the macro backdrop that sets risk appetite across all of crypto.
The interplay of tightening supply, growing usage, and a recovering AI narrative is the combination that could push VVV back toward its highs, while the absence of any of them keeps it consolidating or sends it lower.
How VVV compares to other AI tokens
To judge VVV fairly, it helps to place it against the wider field of artificial-intelligence tokens, because that comparison is where its case is strongest and its risks are clearest. The defining feature of most AI tokens is that they are narrative first and product second: they attach a token to the idea of AI, often with little real usage, revenue, or working software behind it.
In a strong AI market, these tokens can run hard on story alone, but they have little to fall back on when sentiment turns, which is part of why the AI token sector as a whole has been weak in 2026. Against that backdrop, the single most important thing about VVV is that Venice is a real, used product, not just a narrative.
That product traction is VVV’s main differentiator. A platform with more than 2 million users and millions of monthly visits generates the kind of genuine demand that most AI tokens cannot claim, and because access to the platform runs through staking VVV, that usage connects directly to token demand.
Where a typical AI token asks buyers to believe a future will arrive, VVV points to a service people already use for private, uncensored inference today. That does not make it immune to the sector’s swings, but it gives it a floor of real utility that narrative-only tokens lack, and it is the reason VVV tends to be discussed as one of the more fundamentally grounded names in the category.
The tokenomics deepen the contrast. Many AI tokens have inflationary or loosely defined supply schedules that work against holders, whereas VVV pairs a buy-and-burn mechanism with staged emissions cuts, actively tightening supply as usage grows. That combination of real demand and shrinking or slowing supply is uncommon among AI tokens and is the structural reason bulls argue VVV can outperform its peers over a full cycle. The catch, as always, is that the burns have to keep pace with ongoing emissions for the deflationary story to hold, so the comparison is favorable but conditional.
The honest conclusion is that VVV screens as one of the stronger AI tokens on fundamentals, but it still lives inside a weak and volatile sector. Being the best house on a bad street helps on a relative basis and offers some downside cushion, but it does not fully protect a token when capital rotates out of AI entirely.
For anyone weighing VVV, the comparison cuts both ways: its real product and deflationary design set it apart from the narrative-only crowd, while its membership in a struggling sector means it can still fall with its peers regardless of how it stacks up against them.
Venice price prediction scenarios
Because VVV is a volatile token whose price depends heavily on the AI narrative and its own supply dynamics, the most honest forecast is a set of scenarios rather than a single figure. The levels below are illustrative reasoning based on the drivers and technicals above, not guarantees, and VVV can move outside these ranges quickly.
Bull case
In the bull scenario, the AI narrative reignites, capital rotates back into AI tokens, and Venice’s user growth continues while its emissions cuts and buy-and-burn tighten supply on a net basis. Demand for staking rises as more agents and applications need private inference, and the deflationary tokenomics amplify the move. In this case, VVV reclaims resistance near $18.30 and $20.40 and pushes back to and potentially beyond its all-time high above $21, with further upside if the supply keeps shrinking against rising usage. This is the reward side of owning an AI token with real traction and deflationary mechanics.
Base case
In the base scenario, Venice remains a strong product in a mixed market, with steady but not explosive user growth and an AI sector that trades sideways. Burns roughly offset emissions, and the token consolidates beneath its all-time high, ranging between support near $14.50 and resistance around $18 to $20 without a decisive breakout. This is a digestion outcome, where VVV holds its medium-term gains and waits for a clearer catalyst from either the AI narrative or its own supply dynamics. Given the current environment, this range-bound path is a realistic central expectation.
Bear case
In the bear scenario, the AI token sector stays weak, capital keeps rotating away from AI, and VVV follows its category lower despite its fundamentals. Usage growth stalls, burns fail to outpace emissions, and the token’s history of sharp post-rally retracements plays out again. Support near $14.50 breaks, and VVV slides toward the low teens or lower, giving back much of its June rally. For a volatile AI token in a hostile sector, this downside is real, which is why timing and risk management weigh heavily on any position instead of any single target.
Frequently Asked Questions
What is Venice (VVV)?
Venice is a private, uncensored generative-AI platform that lets users create text, images, and code without accounts, data storage, or surveillance, keeping conversations local and encrypting data in transit. VVV is its utility token: instead of paying per request, users, agents, and applications stake VVV to access a share of the platform’s AI capacity, and staking can earn income. Holding and staking VVV is effectively how you buy ongoing private AI access.
Why is VVV trending?
VVV is trending because it combines rare product traction with strong tokenomics and a hot narrative. Venice has more than 2 million users and millions of monthly visits, unusual for an AI token, and VVV uses a buy-and-burn model with staged emissions cuts. The token surged to an all-time high above $21 in early June 2026 during a wave of AI and privacy interest, and it has remained heavily searched and discussed since.
Can VVV reach $21 again?
It is plausible but not guaranteed. Reclaiming the $21 all-time high would likely require
the AI narrative to reignite, Venice’s usage to keep growing, and its emissions cuts and
burns to tighten supply on a net basis. VVV would need to clear resistance near $18.30
and $20.40 first. Because the token is volatile and sensitive to the AI sector, it could
return to that level in a strong phase or fall further in a weak one.
How do Venice’s tokenomics work?
Venice uses a buy-and-burn model, where platform revenue buys VVV and removes it from supply, combined with staged reductions in token emissions. Together, these create deflationary pressure by shrinking or slowing supply growth. On the demand side, access to the platform’s AI capacity requires staking VVV, so usage translates into token demand. The key question is whether burns outpace ongoing emissions on a net basis.
What are the biggest risks for VVV?
The main risks are a weak AI token sector that can drag VVV down regardless of fundamentals, the token’s history of sharp retracements after parabolic moves, and ongoing emissions that require burns to keep pace to preserve the deflationary thesis. Competition from other AI and privacy tokens and the token’s general volatility add to the risk, so entry timing and position sizing matter a great deal.
Is VVV a good investment?
That depends on your risk tolerance and research, and this is not financial advice. VVV offers exposure to a rare AI token with real product traction and deflationary tokenomics, but it is volatile, sensitive to a weak AI sector, and prone to large drawdowns after rallies. Anyone considering it should weigh the strong fundamentals against the sector and volatility risks and size any position accordingly.
What levels should I watch for VVV?
On the downside, support sits around $14.50, with a deeper level near $12; a break of $14.50 would suggest a further slide toward the low teens. On the upside, resistance runs near $18.30, then around $20.40, and finally the all-time high above $21. Reclaiming those levels in sequence would signal renewed momentum. The token holding above its longer-term moving average points to an intact broader uptrend.
What could push VVV higher from here?
The main catalysts are the emissions cuts and burn rate tightening supply on a net basis, continued growth in Venice’s user base and in third-party demand that flows through staking, and a rotation of capital back into the AI token sector. A recovering broader market that lifts risk appetite would help too. The combination of shrinking supply, rising usage, and a warmer AI narrative is what could carry VVV back toward its highs.
Disclaimer: This article is for information and educational purposes only and does not constitute financial, investment, or trading advice. Price predictions are speculative scenarios, not guarantees, and VVV is a volatile asset that can lose value rapidly. Nothing here is a recommendation to buy or sell any asset. Always do your own research and consider consulting a qualified financial professional before making investment decisions. Information is accurate as of July 2, 2026, and will change.

SLX exploded onto Korean exchanges, spiked to $0.47, then gave most of it back. Behind the volatility sits a Solana yield protocol with real total value locked. Here is the bull case, the bear case, and where SLX could go next.
Summary
- Solstice is a Solana-native yield protocol built around institutional-style strategies and its own USX stablecoin, and SLX is its governance and utility token, launched in early 2026.
- SLX drew heavy attention through rapid listings on major exchanges including Upbit and Bithumb, spiking to an all-time high near $0.47 before pulling back sharply into the high-teens to low-thirties cents.
- The bull case rests on genuine total value locked, deep exchange liquidity, Solana ecosystem momentum, and a fixed token supply, which set Solstice apart from purely speculative launches.
- The bear case centers on vesting-driven sell pressure, the token’s short and unproven history, extreme volatility, and its exposure to Solana and the broader risk-off market.
- The realistic path for SLX is wide: a reclaim toward $0.47 is possible if total value locked keeps growing, while a break of key support near $0.20 would open the door to launch-era lows.
Solstice and its SLX token became one of the few things moving in a bruised crypto market, spiking more than 50% in a single day at one point and drawing intense trading volume across Korean and global exchanges.
Behind the price action is a Solana-based yield protocol that, unlike many recent launches, arrived with a working product and real capital already flowing through it. That combination of genuine fundamentals and violent volatility is exactly what makes SLX interesting and hard to forecast.
This price prediction walks through what Solstice is, why SLX is trending, the strongest arguments on both sides, the technical picture, and a set of bull, base, and bear scenarios. None of it is financial advice, and SLX is a small, volatile asset, so the ranges here are wide by necessity.
What is Solstice, and why is SLX trending?
Solstice is a decentralized finance protocol built on Solana that positions itself as a yield layer, bringing institutional-style strategies on-chain instead of chasing meme-driven hype. Its approach centers on strategies such as delta-neutral funding trades and tokenized credit exposure, the kind of yield generation that has traditionally lived outside public blockchains.
At the center sits USX, the protocol’s native stablecoin, which supports lending, yield, and capital-efficient strategies across the Solana ecosystem. SLX is the governance and utility token that powers all of this, and a staked version, stSLX, is already live through integrations such as Exponent Finance.
What separates Solstice from the long tail of small-cap launches is that it came to market with a real product and real capital. The protocol reported total value locked in the hundreds of millions of dollars around its 2026 launch, with staking infrastructure securing over $1 billion in validator operations. That is a genuine fundamental backdrop, not a promise, and it is the main reason serious traders have paid attention instead of dismissing SLX as another listing pump. The token also has a fixed supply, which matters for any long-term valuation argument.
The trending began with distribution. SLX listed rapidly across major venues, with Upbit adding a Korean won pair and Bithumb, OKX, Bybit, Kraken, Gate, and others following within days, plus futures markets on several large exchanges. That breadth of liquidity, combined with strong Korean retail demand, produced enormous volume and sharp moves, including a spike to an all-time high near $0.47 and a later single-day surge of more than 50% on hundreds of millions of dollars in volume.
The token has since pulled back well off that high, which sets up the central question: was the spike a first taste of price discovery for a real protocol, or a listing-driven pump that is now fading?
The bull case for SLX
The bull case starts with the product being real. Solstice is not a whitepaper promise; it is a protocol with meaningful total value locked and a functioning stablecoin in USX, generating the kind of on-chain activity that can support a token’s value beyond speculation. In a market crowded with launches that have no users and no revenue, a Solana yield protocol with hundreds of millions of dollars locked and over $1 billion in secured validator operations stands out. If that total value locked keeps growing, it provides a fundamental floor under SLX that pure momentum tokens lack.
The second pillar is liquidity and reach. SLX is not stranded on one exchange; it trades across Upbit, Bithumb, OKX, Bybit, Kraken, and more, with active futures markets. That multi-exchange presence, and the strong Korean demand that has driven much of the volume, means SLX can attract capital from many directions and can move fast when sentiment turns positive. Deep, distributed liquidity is a real asset for a young token, because it lowers the friction for new buyers and supports larger positions without extreme slippage.
The third pillar is the Solana ecosystem itself. Solstice is a bet on Solana, and Solana has its own momentum, with major protocol upgrades in progress and spot Solana exchange-traded funds already drawing inflows even during the downturn. If Solana strengthens, its native yield protocols benefit from rising activity and capital, and SLX is positioned squarely in that flow as an institutional-yield and stablecoin play. Add a fixed token supply and a live staking mechanism through stSLX, and the bull case is that SLX is an early-stage bet on real Solana yield infrastructure, with room to reprice higher if adoption compounds and the market rotates back toward risk.
The bear case for SLX
The bear case is equally concrete, and it starts with sell pressure baked into the token’s design. Solstice used vesting mechanics tied to its early reward programs, and those mechanics have created real, forced selling. Users who chose vesting options faced deadlines and requirements to maintain total value locked or risk losing unclaimed tokens, which forces decisions that ripple through the market in short, sharp bursts. When early participants are pushed to claim, sell, or restructure positions on a schedule, that overhang weighs on price regardless of how good the underlying protocol is.
The second problem is that SLX is new and unproven over any meaningful time horizon. It launched in 2026, so it has no track record across a full market cycle, no history of how its yield strategies perform under stress, and no evidence yet that its total value locked is sticky rather than mercenary capital chasing incentives. Delta-neutral and tokenized-credit strategies carry their own risks, and a young protocol has not been tested by a genuine crisis. Small market capitalization compounds this: a token this size can move violently in both directions, and the same volatility that produced a 50% up-day can produce equally brutal declines.
The third pressure is external. As a small-cap token, SLX is highly sensitive to the broader market, and small caps are typically hit first and hardest when risk appetite fades. The wider crypto market entered the second half of 2026 off its worst month on record, with macro headwinds from a hawkish Federal Reserve and tight liquidity, and in that environment speculative Solana tokens are vulnerable. SLX also depends heavily on Solana; any weakness in the ecosystem, or a rotation away from it, pulls SLX down with it. The bear case is that the listing-driven spike was the peak of attention, and that vesting overhang plus a hostile macro backdrop grinds the token back toward its launch-era lows.
The technical picture
The chart tells a story of a sharp discovery phase followed by a deep retracement. SLX reached an all-time high near $0.47 in its early weeks, driven by listing momentum and Korean demand, then fell hard as that initial euphoria faded and vesting pressure kicked in.
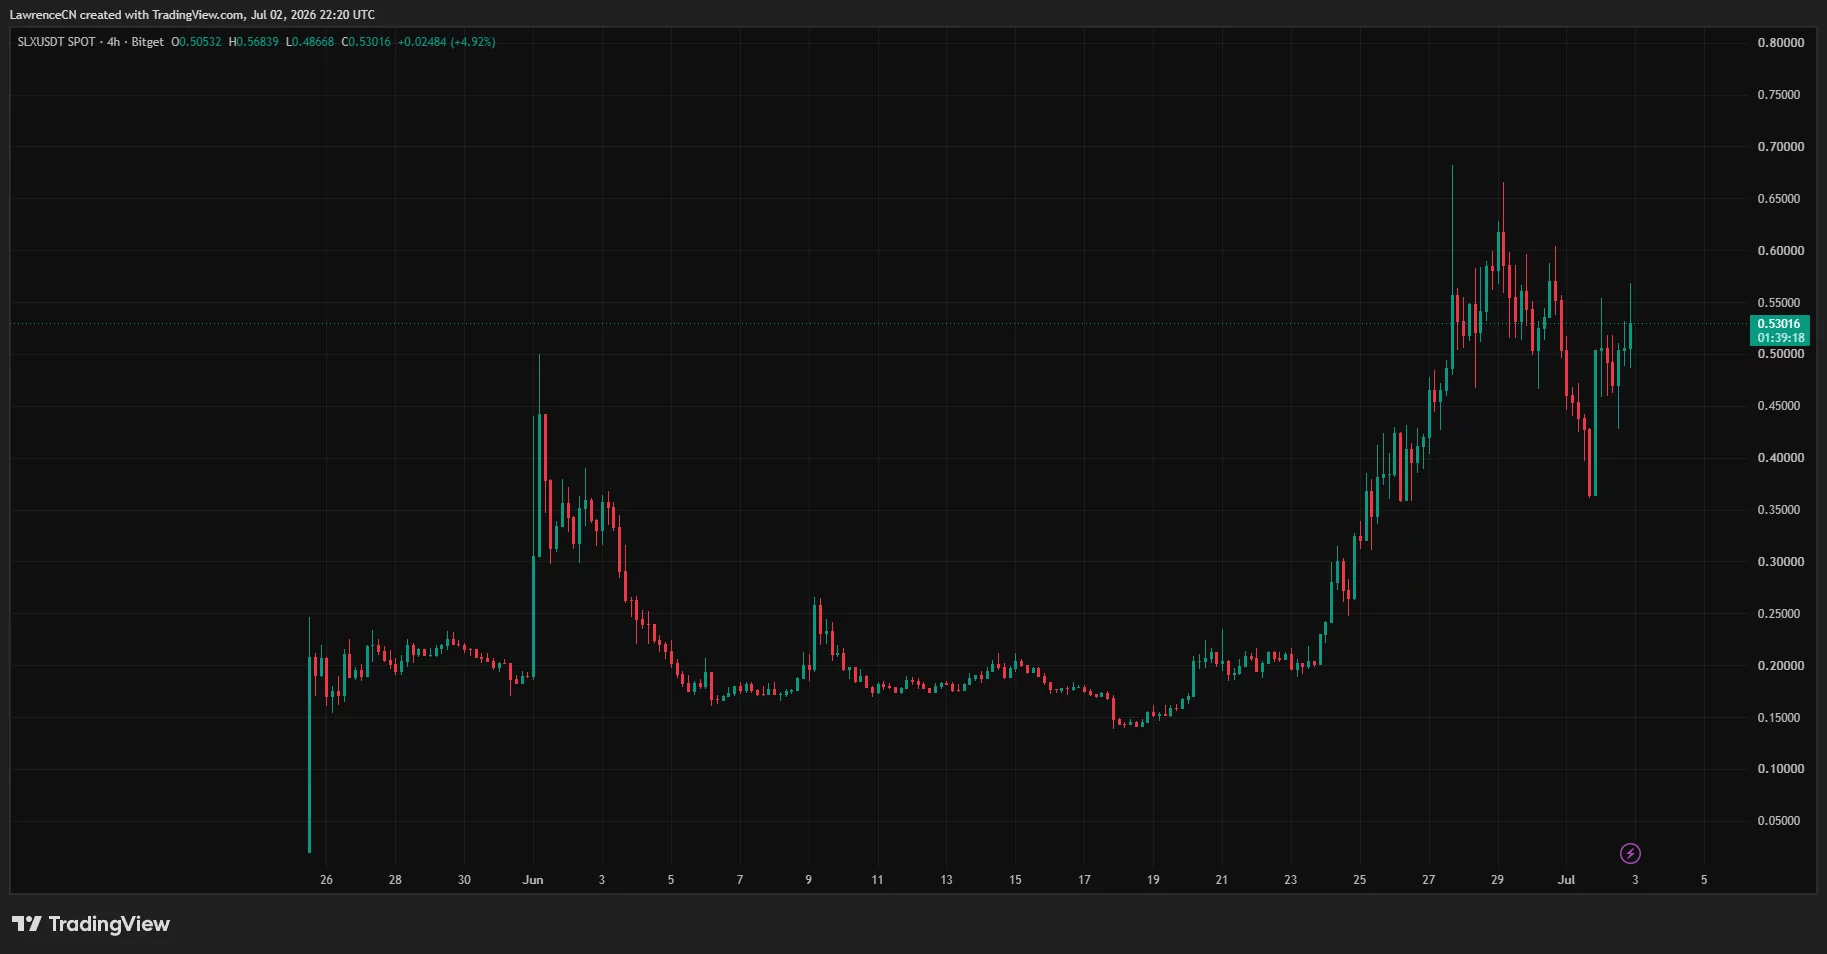
Along the way, it printed dramatic moves, including a single-day surge of more than 50% to around $0.26 on roughly $253 million in volume, the kind of volatility that defines a young, thinly seasoned token in active price discovery. Since the high, the token has traded well below it, at times slipping into the high teens in cents.
The key level bulls and bears are watching is support around $0.20. That zone has acted as a line in the sand: holding it keeps a recovery structure intact, while a decisive break below it signals that the earlier bounce was just a bounce and opens the path toward launch-era lows. On the upside, the token has to reclaim and hold higher ranges before the $0.47 all-time high comes back into view, and doing so would require sustained volume and improving sentiment rather than a single spike. Momentum indicators have swung with the price, reflecting a token that has not yet settled into a stable trend.
The honest read of the technicals is that SLX is in an unresolved range beneath its all-time high, with $0.20 as the pivotal support and the high near $0.47 as the reference resistance. Because the token is young and volatile, technical levels are less reliable than they are for seasoned assets, and a single macro or protocol catalyst can override the chart.
For a price prediction, the technicals mostly define the boundaries: a wide zone between the low-twenties cents on the downside and the high-forties on the upside, with the resolution depending on fundamentals and market conditions more than on any pattern.
What could move SLX next
Several specific catalysts will likely decide which way SLX breaks. The most important is total value locked. Because Solstice’s entire investment thesis rests on being a real yield protocol, the trajectory of its total value locked is the single best signal to watch.
Growing total value locked, especially if it proves sticky after incentive programs wind down, would validate the fundamental case and support a higher token price. Shrinking total value locked, or evidence that the capital was purely mercenary, would undercut the whole argument. Adoption of the USX stablecoin is part of the same story, since real usage of USX in lending and yield is what turns Solstice from a launch into a lasting protocol.
The second driver is the vesting and unlock schedule. Because forced selling from vesting has already pressured the token, the timing and size of upcoming unlocks matter directly. Periods of heavy unlocking are headwinds; periods where supply pressure eases give the token room to recover. Traders watching SLX should track the schedule closely, because unlocks are among the most predictable sources of selling for a young token.
The third set of catalysts is external: Solana and the macro backdrop. Strength in Solana, whether from protocol upgrades, exchange-traded-fund inflows, or a broad rotation back into the ecosystem, would lift SLX, while Solana weakness would drag it down. Above that sits the overall market, where macro signals like inflation data and Federal Reserve policy set the risk appetite that small caps live and die on.
Continued Korean exchange demand is a further wildcard, since that flow has driven much of SLX’s volume and could reignite momentum or fade. The interplay of protocol growth, unlock pressure, Solana health, and macro risk appetite is what will move SLX from here.
Is SLX a trade or a long-term hold?
One of the most useful ways to think about SLX is to separate the short-term trade from the long-term thesis, because they are governed by very different forces. As a short-term trade, SLX is a momentum and liquidity story. Its price has been driven by listing events, Korean exchange demand, volume spikes, and vesting-related selling, and those forces produce sharp, fast moves in both directions.
A trader focused on this timeframe cares about volume, the $0.20 support, unlock dates, and shifts in market risk appetite, and treats the token as a high-volatility instrument to be sized small and managed tightly. On this horizon, fundamentals matter less than flows, and the biggest risk is being caught on the wrong side of an unlock or a broad risk-off move.
As a long-term hold, SLX is a bet on Solstice becoming durable Solana infrastructure. That thesis rests on whether the protocol’s total value locked proves sticky after incentives fade, whether USX earns real adoption as a stablecoin, and whether Solstice’s institutional-yield strategies keep working across market conditions.
A long-term holder is effectively wagering that a real yield protocol with genuine capital will grow into and beyond its current valuation as Solana matures, and is willing to sit through severe volatility to get there. On this horizon, the daily chart matters far less than the trajectory of the fundamentals.
The two views can point in opposite directions at the same moment. A token can look dangerous as a short-term trade, with unlocks looming and momentum fading, while looking attractive as a long-term accumulation if you believe in the protocol, or the reverse, with strong short-term momentum masking a fragile long-term case.
This is why a single price target is misleading for an asset like SLX: the right answer depends on whether you are trading the flows or investing in the protocol. Being honest with yourself about which one you are doing is the most important risk decision, more important than any level on the chart.
For most people, the practical takeaway is to match position size and time horizon to conviction. If the interest is the trade, keep positions small, respect the levels, and watch the unlock schedule and macro closely. If the interest is the long-term protocol thesis, the questions that matter are about total value locked, USX adoption, and Solana’s health over quarters and years, not about this week’s candle. Blurring the two, holding a trade that went wrong as if it were a long-term investment, or trading in and out of a position meant to be a multi-quarter thesis, is how small-cap tokens do the most damage to a portfolio.
Solstice price prediction scenarios
Because SLX is a young token with limited price history, the most honest approach is to frame scenarios instead of pretending precision. The ranges below are illustrative and built from the drivers discussed above, not guarantees. SLX can move well outside them if the market or Solana shifts suddenly.
Bull case
In the bull scenario, Solstice proves that its total value locked is durable rather than incentive-driven, USX adoption keeps expanding, and Solana remains one of the strongest ecosystems in crypto. Vesting-related sell pressure fades, Korean demand stays healthy, and broader market sentiment improves as liquidity returns to crypto. Under those conditions, SLX reclaims the higher trading ranges, breaks back through resistance, and retests the all-time high near $0.47. If protocol growth continues beyond expectations, price discovery above that level becomes possible, supported by a fixed token supply and expanding usage instead of listing hype alone.
Base case
In the base scenario, the protocol continues growing but at a slower pace than the market hoped. Total value locked remains stable, USX adoption gradually improves, and vesting pressure offsets much of the organic demand. Solana performs reasonably well without entering another major bull phase, leaving SLX trading inside a broad range between roughly $0.20 support and the low-$0.30s. This is the “working protocol, patient market” outcome where fundamentals improve faster than price.
Bear case
In the bear scenario, total value locked begins falling as incentive capital leaves, unlock-related selling continues weighing on the token, and Solana weakens alongside the broader crypto market. The $0.20 support fails, sending SLX back toward launch-era lows as speculative interest fades. Because the token is still early in its life cycle, confidence could deteriorate quickly if growth slows or the macro backdrop remains hostile. This outcome does not require the protocol to fail; it only requires demand to remain weaker than the ongoing supply pressure.
Frequently Asked Questions
What is Solstice (SLX)?
Solstice is a decentralized finance protocol built on Solana that focuses on institutional-style yield strategies. It combines products such as delta-neutral strategies, tokenized credit exposure, and its USX stablecoin to create capital-efficient yield opportunities. SLX is the protocol’s governance and utility token, while stSLX represents the staked version used within the ecosystem.
Why is SLX trending?
SLX gained attention after listing on major exchanges including Upbit, Bithumb, OKX, Bybit, Kraken, and others in quick succession. Strong Korean trading activity, high volume, and a rapid move toward an all-time high near $0.47 pushed the token into the spotlight. Unlike many new launches, Solstice also arrived with meaningful total value locked, giving traders a real protocol to evaluate instead of only speculation.
Can SLX return to $0.47?
A move back to the all-time high is possible but depends on several conditions. Solstice would need to continue growing its total value locked, expand USX adoption, reduce the impact of vesting-related selling, and benefit from a stronger Solana ecosystem and broader crypto recovery. Without those factors aligning, the token could remain below its previous peak for an extended period.
What are the biggest risks for SLX?
The largest risks include vesting-related sell pressure, the protocol’s limited operating history, heavy dependence on Solana, and overall crypto market weakness. Because SLX is a relatively small-cap asset, it can experience much larger swings than established cryptocurrencies, making volatility an important consideration.
Why does total value locked matter?
Total value locked measures how much capital users have committed to the protocol. Rising total value locked suggests growing adoption and confidence, while falling total value locked can indicate users are withdrawing funds or incentives are no longer attracting capital. For Solstice, it is one of the most important indicators of whether the protocol is building lasting value.
Is SLX a long-term investment or a short-term trade?
It can be either, depending on the strategy. Short-term traders generally focus on exchange flows, unlock schedules, volume, and technical levels such as the $0.20 support. Longer-term investors are betting on Solstice becoming important infrastructure within the Solana ecosystem through sustained growth in total value locked, USX adoption, and institutional-style yield products.
What levels should traders watch?
Support around $0.20 remains the key downside level. Holding above it keeps the recovery structure alive, while losing it could send the token back toward launch-era prices. On the upside, reclaiming the low-$0.30 range would improve momentum, with the all-time high near $0.47 remaining the major resistance level.
What could drive SLX higher?
The strongest catalysts would be continued growth in total value locked, broader adoption of the USX stablecoin, easing vesting pressure, stronger activity across the Solana ecosystem, and improving macro conditions that bring capital back into higher-risk crypto assets.
Disclaimer: This article is for informational and educational purposes only and does not constitute financial, investment, or trading advice. Cryptocurrency prices are highly volatile, and forecasts are speculative rather than guaranteed. Nothing in this article should be considered a recommendation to buy or sell any asset. Always conduct your own research and consult a qualified financial professional before making investment decisions. Information is accurate as of July 2, 2026, and may change.
Bitcoin rises amid Fed inflation talks: Bull trap or $65K next?
Bitcoin (BTC) reacted positively to US Federal Reserve Chair Kevin Warsh’s remarks on stubborn inflation. Despite the gains on Wednesday, traders fear that incentives for fixed-income investments and strong earnings momentum in tech stocks will continue to pressure non-yield-bearing assets like cryptocurrencies.
The US five-year Treasury yield jumped to 4.22%, meaning traders demanded higher returns to hold government bonds. Even as inflation eventually eases and WTI crude oil prices fell to a 4-month low, investors anticipate monetary expansion.
Regardless of how the Fed manages interest rates and its balance sheet, the US Treasury dictates debt issuance trends.
Bitcoin bounces off 21-month low, but leverage data signals caution: Was $57K the bottom?
Bitcoin (BTC) is trading at around $61,490 at the time of publication after falling to a 21-month low of $57,737 earlier on Wednesday.
Ether (ETH) and Solana (SOL) also gained, up 3% and 4.85%, respectively.
The bounce took place amid deep investor caution, with sentiment trackers gauging the balance of fear and greed in crypto markets currently reading around 11 out of 100, which is in “Extreme Fear” territory. Despite the rebound from the yearly low, Bitcoin remains down roughly a third since the start of the year.
Investors’ cautious stance shows up clearly in the institutional products. US spot Bitcoin exchange-traded funds (ETFs) have hemorrhaged funds in recent weeks, including a reported $4.5 billion total outflow in June, the largest since the ETFs launched.
Related: Bitcoin price taps new July high above $62K on weak US jobs data
Analyst warns BTC could drop further after worst June since 2022
Bitcoin could face further downside pressure after ending June below its 200-week moving average while still trading above its realized price, a combination that crypto analyst PlanB says suggests the market has yet to reach a bear market bottom.
Bitcoin fell 20.5% in June to close the month at $58,526 — its worst monthly performance since June 2022 — below its 200-week moving average of $62,000 but above its realized price of $52,000.
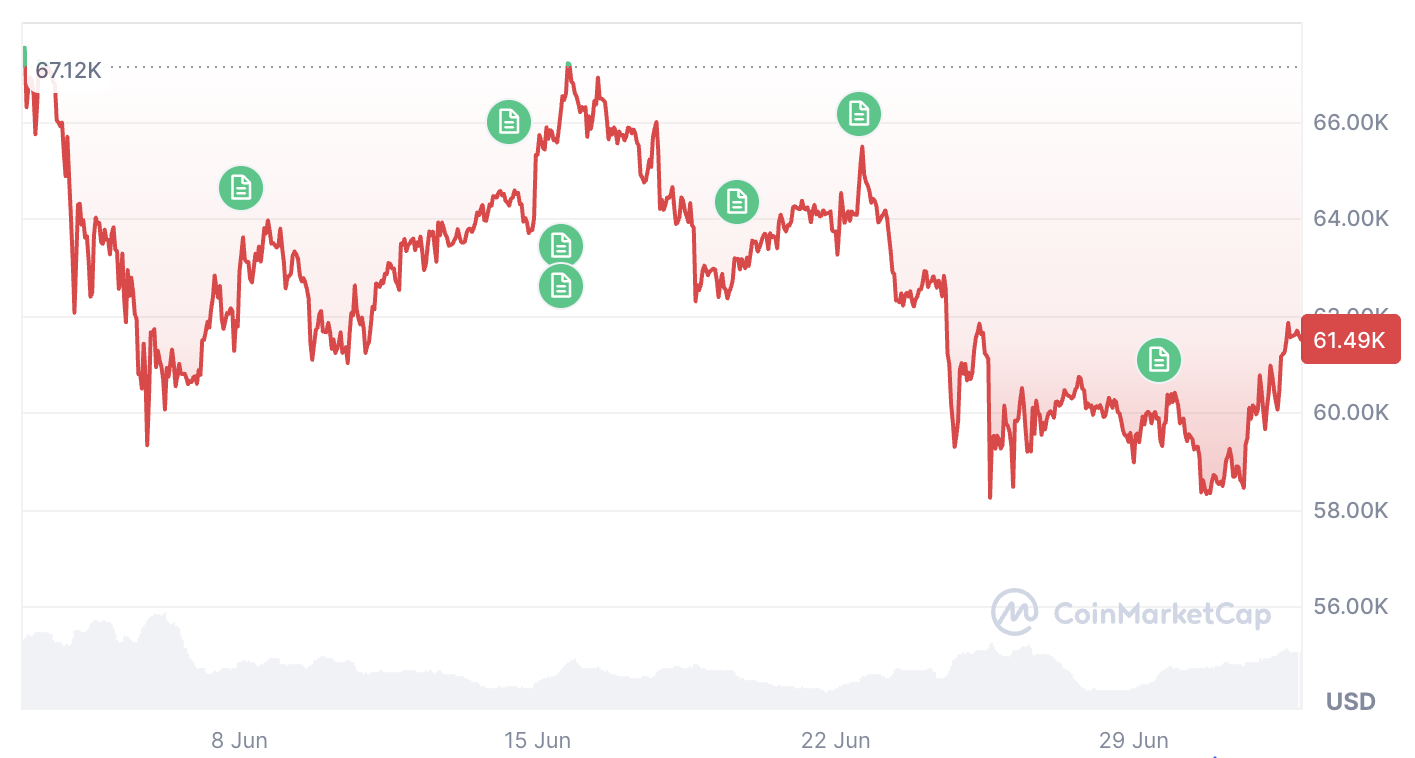
Bitcoin is down 8.80% over the past 30 days. (CoinMarketCap)
“ALL previous bear market bottoms were below realized price,” said PlanB, the creator of the stock-to-flow pricing model. He added in a separate post that Bitcoin could drop to $52,000.
Ether treasury Sharplink bought $16M ETH last week
Crypto treasury company Sharplink, which resumed buying Ether last week after an eight-month pause, has bought a total of $16 million worth of Ether since June 25.
Onchain data from Arkham shows that after Sharplink bought 5,000 ETH on June 25, it bought another 5,000 ETH (worth $8.5 million) on June 26.
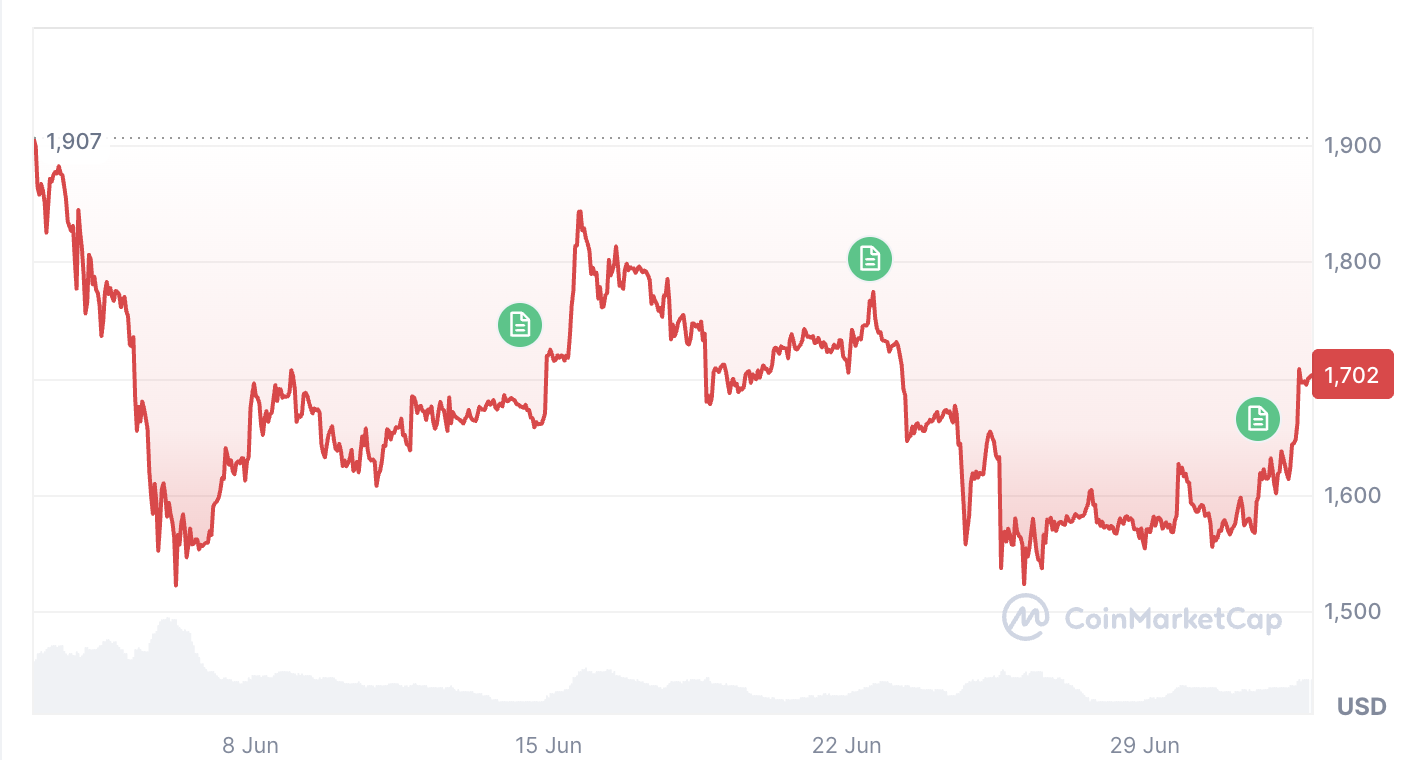
Ether is down 10.73% over the past 30 days. (CoinMarketCap)
The company confirmed the ETH purchases in an announcement, adding it bought it at an average price of $1,611 per ETH.
The two-day buying spree adds to evidence that Sharplink has revived its active Ether accumulation strategy, with its total Ether holdings now at 866,725 ETH. The crypto treasury company was once a close competitor to Bitmine as the world’s largest ETH treasury company, but has fallen far behind.
“The Company’s ETH purchases reflect its continued commitment to growing its ETH treasury as a long-term reserve asset,” it said in a statement on Tuesday.
Crypto enters Q3 with thinner liquidity but less leverage after Q2 reset: Talos
Cryptocurrency markets entered the third quarter of 2026 with less leverage but thinner liquidity after a wave of liquidations cleared speculative positions while major sources of demand weakened during the second quarter.
According to a market update from institutional data provider Talos, Bitcoin (BTC) and Ether (ETH) long liquidations totaled $8.35 billion in Q2. The data provider pointed out that the deleveraging coincided with spot Bitcoin exchange-traded fund (ETF) outflows, reduced Bitcoin buying by Strategy and a contraction in stablecoin supply.
While the reset left the market more stable heading into Q3, Talos said reduced order-book depth weakened its ability to absorb renewed selling pressure. This means the market could be less vulnerable to a chain reaction of forced selling, but prices may still swing sharply because there’s less trading activity to absorb large orders.
Features: Has Strategy’s capital overhaul put an end to ‘death spiral’ fears?
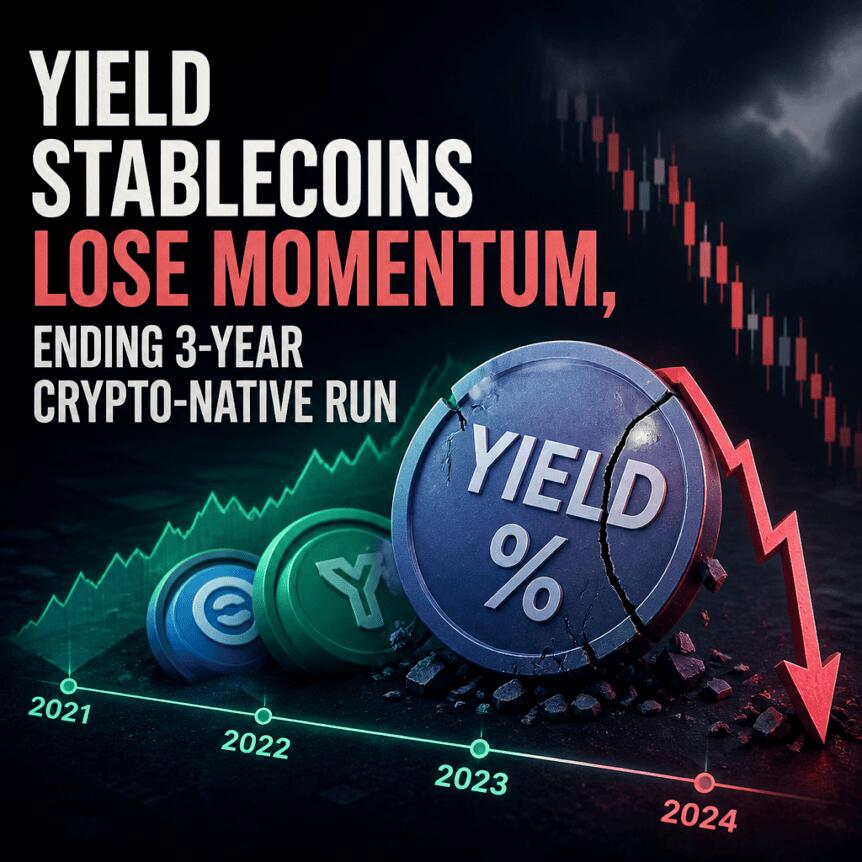
Stablecoin supply contracted in the second quarter of 2026, undoing almost three years of consistent quarterly growth and underscoring a growing split between crypto-native yield products and offerings backed by traditional reserves. According to a Q2 2026 stablecoin report published by crypto exchange CEX.IO, the category fell 15% in Q2—by more than $3.5 billion—marking the first quarterly decline since Q3 2023.
The shift was driven by reductions in yield-bearing, crypto-issued tokens, even as treasury-backed stablecoin yield products gained ground. CEX.IO’s figures point to a total stablecoin supply of $312 billion in Q2 and an adjusted transaction volume decline of 5.5%, alongside meaningful weakness in overall transaction counts.
Key takeaways
- Stablecoin supply fell more than $3.5 billion in Q2 2026, according to CEX.IO’s Q2 report, reversing nearly three years of quarterly growth.
- Crypto-native yield stablecoins shrank sharply: Ethena’s sUSDe supply dropped 52% (nearly $2 billion) and Sky’s sUSDS declined 16%.
- Treasury-backed products expanded while crypto-native contraction accelerated, including BlackRock’s BUIDL (+2%), Circle’s USYC (nearly +16%), and Ondo Finance’s USDY (up over 66%).
- Activity deteriorated at the transaction-count level: CEX.IO reports stablecoin transaction counts fell by 530 million to 4.48 billion, the largest quarterly drop on record.
- Smaller transfers looked relatively more resilient: transfers under $250 rose 5% to $19.39 billion, even as overall usage weakened.
Crypto-native yield tokens lose traction
CEX.IO’s report centers on a clear divergence in the stablecoin yield landscape. During Q2, yield-bearing stablecoin supply declined significantly as crypto-native products contracted. Ethena’s sUSDe stood out as the largest contributor to the downturn, losing 52% of its supply—shedding nearly $2 billion. Sky’s sUSDS also declined, down 16% over the same period.
The implication for users is straightforward: when demand for crypto-native yield strategies weakens, supply can retract quickly because these products are tightly linked to onchain activity and the availability of capital within crypto trading and hedging structures. In practice, that means stablecoin “yield” is not a uniform category—different issuers and reserve models can experience very different supply dynamics in the same quarter.
Treasury-backed products pick up share
While crypto-native yield tokens shrank, treasury-backed offerings moved in the opposite direction. CEX.IO reported that BlackRock’s BUIDL rose 2% in Q2, Circle’s USYC increased by nearly 16%, and Ondo Finance’s USDY climbed by more than 66%. Taken together, the data suggests investors may have shifted toward products perceived as more directly tied to traditional reserve mechanisms rather than crypto activity.
For market participants, this matters because treasury-backed expansion can stabilize parts of the stablecoin ecosystem even when broader crypto-native demand softens. However, the data also highlights an unresolved question: whether treasury-backed growth will fully offset crypto-native contraction, or whether the overall decline in supply signals that stablecoin usage itself is cooling.
First quarterly contraction since late 2023
CEX.IO frames Q2 as a turning point. The category recorded its first quarterly contraction since Q3 2023, with total stablecoin supply reaching $312 billion. The report also notes that adjusted transaction volume declined by 5.5%—a sign that not only did supply shrink, but the underlying flow of stablecoin-related activity also moderated.
Transaction data adds further detail on what changed. CEX.IO said total stablecoin transaction counts fell by 530 million to 4.48 billion, described in the report as the largest quarterly decline on record. At the same time, the report found that smaller transfers—below $250—rose 5% to $19.39 billion. That combination suggests that smaller peer-to-peer or retail-style use may be holding up better than transaction-heavy activity associated with larger automated or trading flows.
It’s an important nuance for traders and builders: the headline supply decline doesn’t necessarily mean everyday transfers disappeared. Rather, the weakness appears concentrated in higher-frequency, larger-dollar, or more automation-dependent segments of stablecoin utilization.
Weaker signals in Q1 preceded the Q2 drop
The slowdown didn’t arrive without warning. In Q1 2026, stablecoin supply still increased by about $8 billion to a record $315 billion, according to reporting referenced by CEX.IO. However, the report also points to earlier signs that organic demand was softening.
During Q1, retail-sized transfers declined by 16%, while automated activity made up roughly 76% of stablecoin transaction volume. By Q2, these patterns were more pronounced: transaction counts fell sharply, yet sub-$250 transfers increased. Together, the data suggests a market where the “type” of stablecoin activity shifted—away from larger, automation-heavy usage and toward smaller transfers, even as overall activity and supply eventually contracted.
Broader crypto demand concerns weigh on stablecoin dynamics
Stablecoin contraction in Q2 also aligns with concerns about weaker momentum across broader crypto markets. Earlier in the week, institutional data provider Talos identified declining stablecoin supply alongside spot Bitcoin ETF outflows and slower Bitcoin purchases by Strategy as three demand channels that weakened in Q2.
In comments relayed to Cointelegraph, Talos’s Tanay Ved argued that a recovery in stablecoin supply would be a useful signal of “fresh capital coming back into the ecosystem more broadly,” potentially supporting onchain liquidity. Ved also emphasized that spot ETF flows remain among the most important channels to watch, since they tend to reflect more durable shifts in institutional appetite.
Crucially, Ved noted that ETF flows, corporate Bitcoin purchases, and stablecoin supply often move together when market momentum changes. That observation frames stablecoins as more than a settlement tool: when capital rotates out of crypto exposure, stablecoin issuance and onchain usage can weaken as well—especially in segments dependent on active trading and capital deployment.
For readers tracking the next phase, the key question is whether Q2’s contraction represents a temporary reset or the start of a longer decline. CEX.IO’s data shows a sharp internal reshuffle—crypto-native yield tokens losing supply while treasury-backed products gain—so investors should watch both overall stablecoin issuance trends and the relative growth of different reserve models as new quarterly figures arrive.

The US Department of the Treasury’s Office of Foreign Assets Control (OFAC) sanctioned 134 cryptocurrency wallet addresses identified as belonging to ISIS-Khorasan (ISIS-K), which has been a Specially Designated Global Terrorist since September 2015.
The wallet addresses were added to the OFAC’s Specially Designated Nationals (SDN) list on Wednesday, which includes individuals, entities and digital asset addresses linked to terrorism, narcotics trafficking and other illicit activity.
Stablecoin issuer Tether has frozen the balances associated with 131 Tron addresses, while the remaining three sanctioned addresses were on the Monero network, blockchain forensics company Chainalysis said in a Wednesday report.
The development comes over a week after the OFAC’s previous round of sanctions against ISIS-supporting financiers using cryptocurrency. On June 22, the OFAC sanctioned three individuals and six entities across Europe, the Middle East and West Africa, including Syria-based MSB Bitcoin Xchange and Turkish MSB Spider.
OFAC said the previous round of sanctions targeted “key facilitators who enable ISIS to move funds among its regional affiliates.”
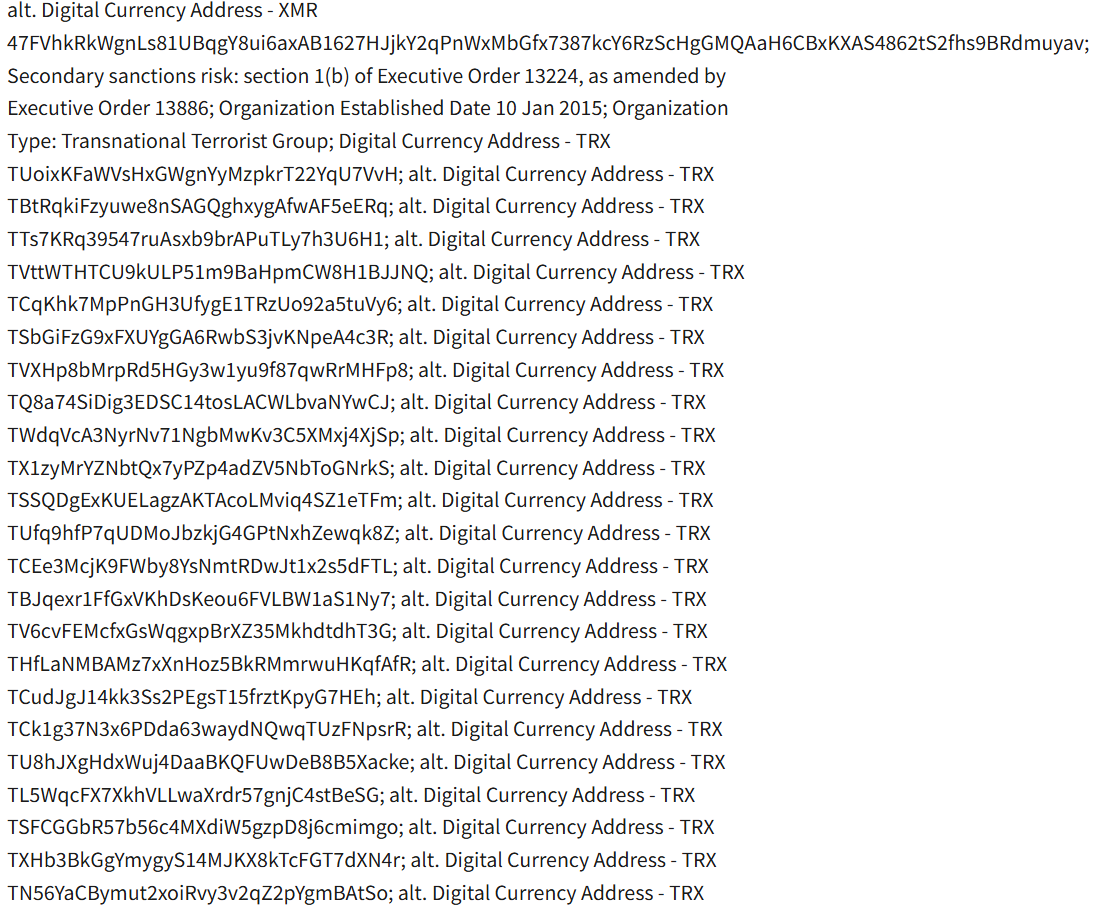
OFAC update to SDN list, new wallets included. Source: OFAC
131 wallets linked to ISIS-K received $1.4 million in donations
ISIS-K has historically solicited crypto through donation campaigns on various websites and messaging platforms, Chainalysis said.
The report said that the 131 Tron addresses in the latest round of sanctions received over $1.4 million in crypto donations since 2023 and sent over $880,000.
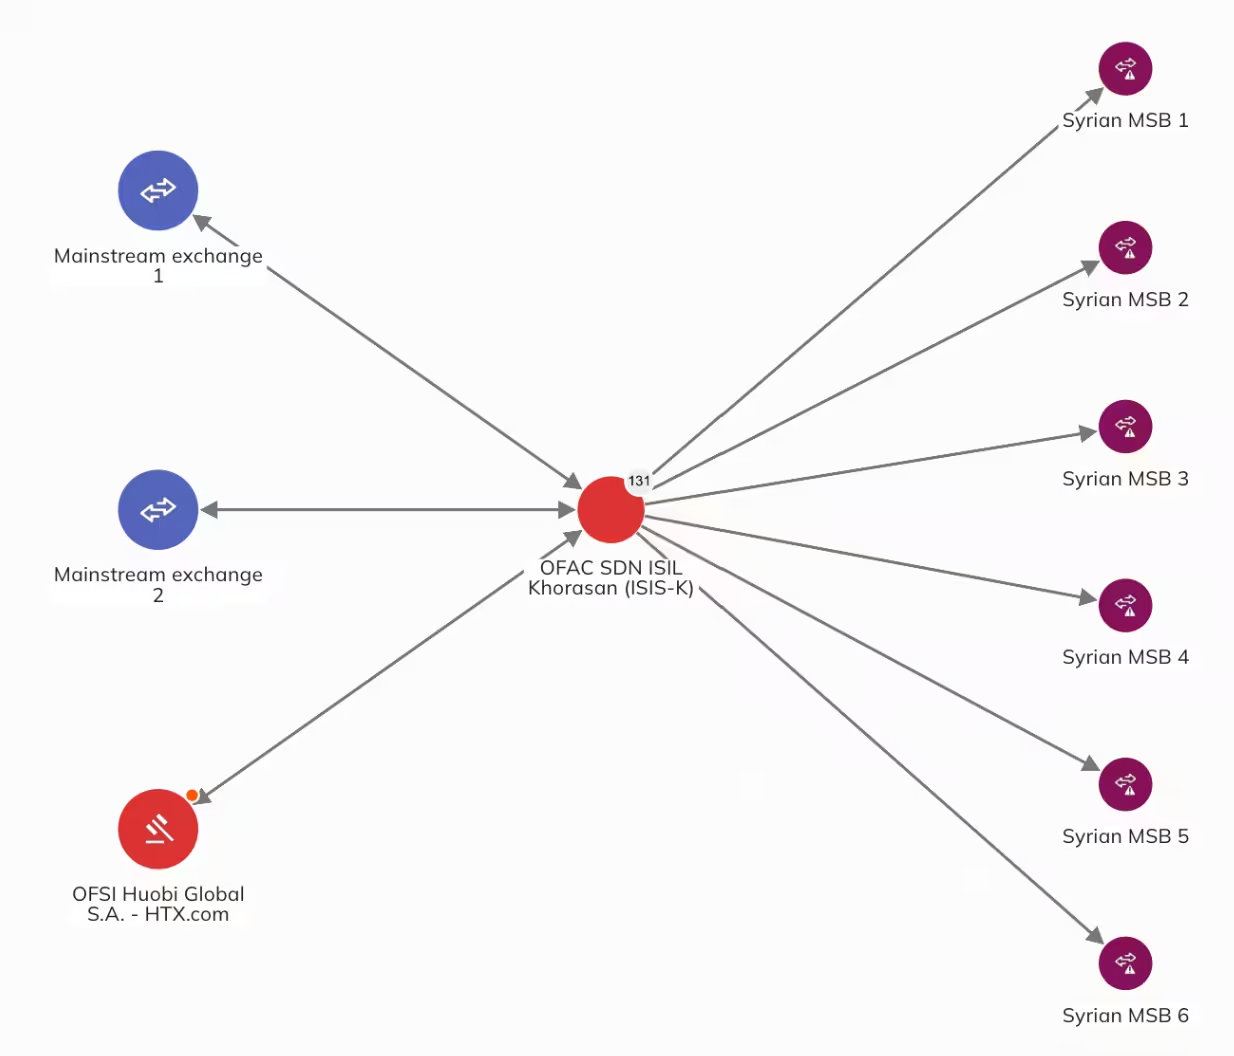
Network of ISIS-K funding entities sanctioned by OFAC. Source: Chainalysis
Chainalysis identified multiple such donation addresses used by the group on Tron, Monero and the Bitcoin network. It found significant exposure to mainstream services, including some wallets that sent funds to Syria-based cryptocurrency exchanges.
Related: US sanctions Sinaloa cartel-linked Ethereum addresses
Blockchain analytics tools are playing an increasingly prominent role in financial sanctions targeting illicit activity.
Earlier in April, blockchain intelligence company TRM Labs said that onchain evidence was key to securing the conviction of three individuals for terrorism financing in Indonesia in 2024 and 2025.
“Indonesian courts have demonstrated that cryptocurrency evidence — wallet addresses, transaction histories, on-chain flows — is not only admissible but can anchor a terrorism financing prosecution,” TRM said in a statement.
Magazine: Are DeFi devs liable for the illegal activity of others on their platforms?


In 2011, $2.7 billion of inflows sent Bitcoin up more than 55,000%. This cycle, $697 billion produced 689%. A leading analyst says the math has changed so much that the next parabolic run needs a trillion dollars. Here is the case, and the case against.
Summary
- CryptoQuant chief executive Ki Young Ju argued on July 1 that Bitcoin’s capital efficiency is collapsing, so each cycle needs far more money to produce far smaller percentage gains.
- His headline figures: in 2011, roughly $2.7 billion of net inflows drove a gain of more than 55,000%, while this cycle, about $697 billion produced a return of around 689%.
- Ju still expects one more parabolic run, but says it likely requires Bitcoin to absorb more than $1 trillion in realized capitalization and to become a core macro asset rather than a retail-driven ETF trade.
- The bull reading is that declining capital efficiency is normal maturation, and that gold’s roughly $27 trillion market value shows enormous headroom for institutional adoption that is still early.
- The bear reading is that a trillion-dollar requirement is an enormous ask in a market bleeding ETF flows to stocks and gold, and that collapsing efficiency signals the era of outsized returns is ending.
Bitcoin just posted the worst month in the history of its exchange-traded funds, bounced modestly into July, and is trading more than 50% below its October 2025 record. Into that gloom, one of the most-watched analysts in crypto dropped a statistic that reframes the entire debate about where Bitcoin goes next.
On July 1, CryptoQuant chief executive Ki Young Ju laid out the numbers behind a claim that is now spreading fast: Bitcoin’s next parabolic bull run may require it to absorb more than $1 trillion of fresh capital. That is not a price target; it is a statement about how much harder it now is to move Bitcoin at all.
This piece breaks down the number behind the claim, what Ju is really arguing, and the serious case on both sides of whether a trillion-dollar bull run is a bullish invitation or a bearish warning.
The number behind the claim
The heart of Ju’s argument is a single, striking comparison of how much money it has taken to move Bitcoin across cycles. In 2011, in Bitcoin’s earliest days, roughly $2.7 billion of net capital inflows drove a price increase of more than 55,000%. In the current cycle, by contrast, about $697 billion of inflows produced a return of only around 689%.
Put those side by side, and the ratio of dollars in to price gain has compressed by something on the order of 80x across the life of the asset. Each successive cycle has demanded far more capital to generate far smaller percentage moves.
The metric underneath this is realized capitalization, which measures the total capital actually invested in Bitcoin by valuing every coin at the price it last moved on-chain, instead of at today’s market price.
Realized cap is the closest thing Bitcoin has to a measure of real money committed to it, and Ju frames the whole question in those terms: the next parabolic run, he argues, likely requires Bitcoin to absorb more than $1 trillion of new realized cap. That is the concrete threshold behind the headline, and it is why the claim is about capital absorbed, not about a price level reached.
This is not a doom call from a permabear. Ju has spent much of the past year as one of the more constructive voices among top analysts, and his July 1 post explicitly says Bitcoin likely has another parabolic cycle ahead of it. The trillion-dollar figure is his estimate of the price of admission for that run, not a declaration that it cannot happen.
Understanding that distinction is essential, because the same numbers can be read as a reason for optimism or a reason for caution, and the rest of the debate flows from which reading you find more convincing.
What Ki Young Ju is actually arguing
Ju’s full thesis is more nuanced than the headline stat suggests, and it rests on a claim about what kind of asset Bitcoin needs to become. In his telling, the shrinking capital efficiency is a symptom of Bitcoin outgrowing its old drivers. The retail-led, exchange-traded-fund-driven demand that has powered recent moves is, he argues, not enough to fuel another parabolic run at Bitcoin’s current size.
For that, Bitcoin needs to graduate into a core macro asset held by institutions and allocators as a serious portfolio holding, not traded as a speculative vehicle by retail investors chasing momentum.
That shift, Ju stresses, is still in its early stages and has not been invalidated by the current downturn. He points to the gap that still exists between Bitcoin and the assets it aspires to sit alongside: gold carries a market value of roughly $27 trillion, dwarfing Bitcoin’s, which leaves enormous room for growth if institutional and macro capital genuinely rotates in.
If Bitcoin can absorb more than $1 trillion in realized cap, he argues, another parabolic bull run remains firmly on the table. The trillion dollars, in this framing, is not an impossible barrier but the scale of adoption required to prove Bitcoin has become what its supporters say it is.
So the argument is really two claims bundled together. The first is descriptive: capital efficiency is declining, and it now takes vastly more money to move Bitcoin than it once did. The second is conditional and hopeful: if the right kind of capital, deep institutional and macro allocation, shows up at sufficient scale, the next parabolic run can still happen. The disagreement in the market is not mostly about the first claim, which the numbers support, but about the second, about whether that $1 trillion is realistically coming, and about what it means for Bitcoin if it does or does not.
Why the math changes as Bitcoin grows
To weigh the claim, it helps to understand why capital efficiency declines in the first place, because the mechanism is not mysterious. It is a straightforward consequence of Bitcoin getting bigger. When Bitcoin was a tiny, obscure asset in 2011, a small amount of new money represented an enormous percentage of its total value, so modest inflows produced explosive percentage gains.
As the asset has grown into the hundreds of billions and, at its peak, past $2 trillion in market value, the same percentage move requires vastly more absolute capital. Moving a large asset by a given percentage simply costs more than moving a small one.
A second force compounds this: the pool of holders willing to sell cheaply keeps shrinking. Over time, a growing share of Bitcoin has moved into the hands of long-term holders and institutions who are not eager to part with their coins at low prices, which Ju and others have described as a structural change in the market. That is usually framed as bullish, because it reduces available supply, but it also changes the market’s rhythm.
With fewer coins available to absorb and fewer sellers to flush out, price action becomes less about violent boom-and-bust cycles and more about how much new capital can be coaxed in against a supply that increasingly sits still.
The result is a maturing asset whose returns compress even as its stability grows. This is the same pattern seen in other assets as they scale: the earliest investors capture the largest percentage gains, and returns moderate as the asset becomes mature and widely held.
For Bitcoin, that means the days when a few billion dollars could produce a 50,000% move are almost certainly gone for good. What replaces them, and whether it is still attractive, is exactly where the bull and bear cases diverge.
The bull case: maturation with huge headroom
The optimistic reading takes the collapsing capital efficiency as a sign of health, not decline. In this view, declining percentage returns are simply what happens when an asset succeeds and grows up, and they say nothing bad about the absolute gains still available. A move that is small in percentage terms for a multi-trillion-dollar asset can still represent enormous absolute wealth creation, and a maturing Bitcoin that trades with less violence is more, not less, attractive to the large, cautious pools of capital that were always going to be needed for the next leg higher.
The headroom argument is the bull’s strongest card. Gold’s market value sits around $27 trillion, and Bitcoin, even near its peak, was a fraction of that. If Bitcoin is genuinely on a path to becoming a macro store of value alongside gold, the total addressable market is measured in tens of trillions, which makes $1 trillion of fresh absorption ambitious but far from absurd.
The infrastructure to deliver it is also further along than ever: spot ETFs, whatever their recent outflows, opened a regulated on-ramp for institutions, corporate treasuries have accumulated well over 1 million coins, and traditional banks have built custody and trading services. The pipes for institutional capital exist in a way they never did in prior cycles.
Ju himself sits largely in this camp, and that matters. His argument is not that the parabolic era is over but that it now depends on a specific, identifiable driver: deeper institutional allocation and macro-asset status, a shift he insists is early instead of dead. Supporters point out that institutional adoption of a new asset class takes years, that sovereign and pension-scale allocation to Bitcoin has barely begun, and that even a small reallocation from the vast pools of global bonds, equities, and gold would supply the $1 trillion in question. In the bull case, the trillion-dollar requirement is not a wall but a roadmap, and the recent weakness is a pause in a still-early adoption story.
The bear case: the outsized-returns era may be ending
The skeptical reading takes the same numbers and draws a colder conclusion. If it now takes $1 trillion to spark a parabolic run, then the era of Bitcoin as a life-changing, asymmetric bet is largely behind us, and what remains is a large, slow, increasingly conventional asset.
Collapsing capital efficiency, in this view, is not just maturation to be celebrated; it is a warning that the returns which drew a generation of investors are compressing toward those of ordinary macro assets, and that buyers expecting another 50-fold move are anchored to a past that will not repeat.
More pressing is the question of where $1 trillion actually comes from, and the short-term evidence is discouraging. Bitcoin ETFs just recorded their worst month on record, shedding around $4.5 billion in June, the opposite of the institutional inflow the thesis requires. Capital has been rotating out of crypto and into artificial-intelligence equities and gold, the “stocks and shiny rocks” Ju himself has described, instead of into Bitcoin.
If the marginal dollar is leaving for other assets precisely when the thesis needs it to arrive at scale, the trillion-dollar bar looks less like a roadmap and more like a distant hope. Demanding record institutional inflows from a market that is currently seeing record outflows is a hard sell.
The bear case also leans on Bitcoin’s present behavior. For the thesis to work, Bitcoin has to become a core macro asset, yet through 2026 it has traded like a high-beta risk asset, falling with technology stocks and failing to act as the hedge the macro-asset story requires. The institutional demand that did show up, much of it channeled through corporate treasuries such as Strategy, now looks strained, with those vehicles under financial pressure and at risk of becoming sellers rather than buyers.
If the treasury model wobbles and ETF flows stay negative, two of the main pipes for the needed capital narrow at once. In the bearish reading, the trillion-dollar requirement is really an admission that Bitcoin can no longer move on its own and now depends on an institutional wave that may not come.
The boredom risk Ju keeps flagging
There is a third scenario that Ju has emphasized repeatedly, and it is neither the bull’s parabolic run nor the bear’s crash. It is stagnation. For much of 2026, he has argued that Bitcoin’s biggest danger is not a violent drawdown but prolonged, boring sideways action that slowly drains attention and conviction.
A sharp crash, in his framing, can be survived because the long-term thesis stays intact and the sell-off flushes out leverage. A market that simply drifts for years is harder to escape, because it offers no catalyst to force capital back in and quietly erodes the belief and the financing structures built on top of the asset.
This connects directly to the capital-efficiency argument. Ju has pointed out that Bitcoin’s realized capitalization, the measure of real money committed, has flatlined after years of growth, and that holders recently entered a net realized loss phase for the first time since 2023. When realized cap stops growing while the market drifts, it means no new buyers are stepping in to absorb sell-side pressure, which is precisely the condition that produces a long, flat grind. The $1 trillion is what would break that stalemate; its absence is what leaves Bitcoin drifting.
The boredom scenario is important because it reframes the stakes. The debate is often posed as bull versus bear, moon versus crash, but Ju’s more subtle point is that the most likely near-term outcome may be neither. It may be a market that neither rewards the bulls with a parabolic run nor vindicates the bears with a collapse, but simply goes quiet, testing the patience of holders and the durability of the institutions built around Bitcoin. In that world, the trillion-dollar question is not answered so much as postponed, and the danger is that the postponement itself does damage.
What would it actually take to get $1 trillion?
If $1 trillion is the price of the next parabolic run, the practical question is where it could plausibly come from, and the honest answer is that it requires sources larger than the ones that have driven Bitcoin so far. Retail speculation and even the current wave of ETF demand are not enough at Bitcoin’s scale, which is Ju’s whole point.
The capital would have to come from the deep pools that have barely allocated to Bitcoin: pension funds, insurers, sovereign wealth funds, corporate treasuries at scale, and potentially nation-states holding Bitcoin as a reserve asset. A modest reallocation from the tens of trillions in global bonds, equities, and gold would clear the bar, but only if Bitcoin earns a place in those mandates.
The conditions for that are identifiable, even if their timing is not. It would likely take continued regulatory clarity that makes Bitcoin allocatable for conservative institutions, a track record of Bitcoin behaving more like a macro store of value than a risk asset, and infrastructure that large allocators trust.
It would also, realistically, require a friendlier macro backdrop than the current one of tight liquidity and a hawkish Federal Reserve, since large institutional rotation into a volatile asset tends to happen when conditions ease instead of tightening. Each of these is plausible over a multi-year horizon and absent in the current one, which is why the thesis is framed as early instead of imminent.
For anyone watching Bitcoin, the signals to track therefore shift away from the daily price and toward the flow of real capital. The single best gauge is realized capitalization itself: if it resumes sustained growth, fresh money is truly entering, and the trillion-dollar path is opening.
Alongside it, the direction of ETF flows, evidence of pension and sovereign allocation, and whether Bitcoin starts trading with more independence from technology stocks would all indicate whether the macro-asset shift is happening. Until those turn, the trillion-dollar requirement remains a thesis about the future instead of a description of the present.
Why this matters even if you disagree
Whatever one makes of the specific trillion-dollar figure, the framing itself is the most valuable takeaway, because it changes how to judge Bitcoin. For most of its history, Bitcoin has been evaluated by its capacity for explosive percentage gains, the asymmetric moonshot that could multiply an investment many times over.
Ju’s argument, accepted even in part, means that lens is increasingly obsolete. A multi-trillion-dollar asset will not deliver another 50,000% move, and holding out for one is a category error. The relevant question becomes whether Bitcoin can keep attracting large absolute inflows as it matures, not whether it can repeat the returns of its infancy.
That reframing cuts across the bull-bear divide. A bull who accepts it stops expecting overnight riches and starts thinking in terms of steady, large-scale adoption compounding over years, judging progress by realized cap and institutional flows instead of by the next candle. A bear who accepts it stops waiting for a total collapse and starts asking whether Bitcoin can justify its size without the returns that once did the persuading. Both are better served by measuring Bitcoin against the trillion-dollar yardstick of real capital than by the percentage fireworks of the past.
The deeper significance is that Bitcoin appears to be at a genuine inflection point in what it is. The collapsing capital efficiency is the numerical fingerprint of an asset transitioning from a speculative frontier bet into something that either becomes a mature macro store of value or stalls short of it.
Ju’s trillion-dollar claim is really a way of stating the price of that transition. Whether Bitcoin pays it, over what timeframe, and whether the market has the patience to wait, are the questions that will define the coming years far more than any single month of inflows or outflows.
Frequently Asked Questions
Who said Bitcoin needs $1 trillion for its next bull run?
The claim comes from Ki Young Ju, chief executive of the on-chain analytics firm CryptoQuant, in a post on July 1, 2026. He argued that Bitcoin’s capital efficiency is declining and that the next parabolic bull run likely requires Bitcoin to absorb more than $1 trillion in realized capitalization, along with deeper institutional adoption. He still expects another parabolic cycle, but sees this as its price of admission.
What does declining capital efficiency mean?
It means it now takes far more money to move Bitcoin’s price by a given percentage than it used to. Ju’s figures show that in 2011, about $2.7 billion of inflows drove a gain of more than 55,000%, while this cycle roughly $697 billion produced around 689%. The ratio of dollars in to price gain has compressed by roughly 80 times, because Bitcoin is now a much larger asset.
Why does it take more money to move Bitcoin now?
Because Bitcoin has grown enormously. When it was tiny, a small inflow was a large share of its value and produced explosive percentage gains. Now that it is worth hundreds of billions to trillions, the same percentage move requires vastly more absolute capital. A shrinking pool of holders willing to sell cheaply, as coins move to long-term holders and institutions, compounds the effect.
Is the $1 trillion claim bullish or bearish?
It can be read either way, which is why it is debated. The bullish reading is that declining percentage returns are normal maturation, and that gold’s roughly $27 trillion market value shows huge headroom for institutional adoption that is still early. The bearish reading is that a trillion-dollar requirement is an enormous ask while ETFs bleed money and capital rotates to stocks and gold, signaling the outsized-returns era is ending.
What is realized capitalization?
Realized capitalization measures the total capital actually invested in Bitcoin by valuing every coin at the price it last moved on-chain, instead of at the current market price. It is the closest measure of real money committed to Bitcoin. Ju frames his argument in these terms: the next parabolic run requires more than $1 trillion of new realized cap to be absorbed, and a flatlining realized cap signals no fresh money is entering.
Where would $1 trillion of new capital come from?
It would have to come from pools far larger than the retail and current ETF demand that has driven Bitcoin so far, such as pension funds, insurers, sovereign wealth funds, large corporate treasuries, and potentially nation-states holding Bitcoin as a reserve. A small reallocation from the tens of trillions in global bonds, equities, and gold would suffice, but only if Bitcoin earns a place in those mandates, which requires clarity, trust, and time.
Does this mean Bitcoin cannot have another bull run?
No. Ju explicitly expects another parabolic run and calls the institutional shift early rather than invalidated. The claim is about what that run requires, not whether it can happen. The debate is over whether the needed $1 trillion will realistically arrive, especially given recent record ETF outflows, and over what it means for returns if future cycles need ever-larger inflows to produce ever-smaller percentage gains.
What should investors watch to judge the thesis?
The single best gauge is realized capitalization: sustained growth means fresh money is truly entering and the trillion-dollar path is opening, while a flatlining figure signals stagnation. Alongside it, watch the direction of ETF flows, evidence of pension and sovereign allocation, and whether Bitcoin begins trading more independently of technology stocks. These signals indicate whether the shift to a core macro asset is actually happening.
Disclaimer: This article is for information and educational purposes only and does not constitute financial, investment, or trading advice. It describes an analyst’s thesis and the debate around it, not a forecast or recommendation, and cryptocurrency prices are highly volatile. Nothing here is a recommendation to buy or sell any asset. Always do your own research and consider consulting a qualified financial professional before making investment decisions. Information is accurate as of July 2, 2026, and may change.

Kooc Media has launched dedicated PR support for AI agents, chatbots, and machine learning platforms. The aim is to help the companies behind these products win press, reach the right people, and earn trust in a market that fills up more every day.
With AI agents, chatbots, and machine learning platforms launching at breakneck speed, getting noticed is tough. Plenty of these products are impressive, yet they fade into the background. Kooc Media’s PR support sets out to change that, offering quick, guaranteed coverage on trusted tech and finance outlets.
PR Made for AI Agents, Chatbots and ML
Most agencies run the same routine for every client, whatever they’re selling. Kooc Media went a different way, shaping its support around what companies building AI agents, chatbots, and machine learning platforms actually need.
That means coverage that gets the technology. Whether a company is rolling out a new AI agent, a customer-facing chatbot, a conversational AI tool, or a machine learning platform for developers, each campaign is written for the right audience and tuned to the brand’s goals.
“AI agents, chatbots, and machine learning platforms move fast, and their PR has to keep up,” said Michelle De Gouveia, spokesperson for Kooc Media. “We built this support so a company can launch a product and see real coverage the same week. No long waits, no guesswork, just placements that help them grow.”
You can find out more on the Kooc Media AI Companies PR page.
Guaranteed Coverage, Not Hope
A major issue with traditional PR is that nothing is promised. Agencies pitch journalists and hope something lands. Companies pay for the attempt, not the outcome.
Kooc Media takes a different path. The agency owns and runs its own network of news sites, including Blockonomi, CoinCentral, MoneyCheck, Parameter, Beanstalk, and Computing. That means companies behind AI agents, chatbots, and machine learning platforms get real, published articles instead of a list of outreach attempts.

Because Kooc Media controls these sites, coverage can go live the same day. That gives AI brands instant exposure when it matters most, such as during a product launch, a funding round, or a big update.
You can browse every in-house site on the Kooc Media brands page.
Wide Distribution Across Major Outlets
Alongside its own network, Kooc Media offers full newswire distribution to hundreds of partner sites and thousands of syndicated outlets.
Depending on the package, releases can also reach major financial and business news networks. That can include coverage on sites such as Business Insider, Bloomberg, Benzinga, MarketWatch, USA Today, and Dow Jones feeds, plus other global platforms.

For companies building AI agents, chatbots, and machine learning platforms, this reach builds real trust. Showing up on names that investors, customers, and partners already know makes a brand far more credible.
Featured Free on AgentLocker.ai
A key part of this support is free access to AgentLocker.ai, Kooc Media’s own AI tools and agents directory.
AgentLocker.ai is a growing directory where people search for the latest AI tools, agents, and software. It’s an ideal home for AI agents and chatbots, helping them get found by users who are actively looking for new AI solutions.

Every client on an AI PR package is listed and featured on AgentLocker.ai at no extra cost. That gives companies behind AI agents, chatbots, and machine learning platforms another channel for visibility on top of their press coverage, and a place where their product stays discoverable well after a campaign ends.
You can explore the directory at AgentLocker.ai.
Pairing media coverage with a dedicated AI directory listing means these companies get more from a single package. Rather than paying separately for a listing and for PR, clients get both in one place.
PR Done For You
Many companies working on AI agents, chatbots, and machine learning platforms run lean, with no marketing department and no dedicated PR person. Kooc Media handles that with managed PR creation from its in-house editorial team.
That means founders don’t need to write their own releases or articles. They hand over the details, and the Kooc Media team creates the content, publishes it, and distributes it.
The services include press release writing, sponsored articles, homepage placements, guaranteed publication across in-house sites, newswire distribution, and full reporting with live links to every placement.
That reporting is an important part of the offer. Clients receive a clear record of where their coverage ran, with direct links to each article. There’s no guessing about whether the work got done.
Ready-Made and Custom Options
Kooc Media offers both ready-made packages and fully custom campaigns. The ready-made options suit companies that want a simple, fast solution. The custom campaigns are for brands that want a more tailored approach across search engines, news platforms, and social media.
That flexibility means the support works for early-stage teams launching a first AI agent or chatbot as well as larger machine learning platforms running ongoing coverage.
Part of a Wider Industry Focus
While this support focuses on AI agents, chatbots, and machine learning platforms, it sits within Kooc Media’s broader focus on fast-moving sectors. The agency has worked in crypto, fintech, technology, and iGaming since it was founded in 2017.
Companies whose AI products cross into these areas can also explore Kooc Media’s crypto PR services and gambling PR services. Many AI tools overlap with these fields, such as trading bots, fintech chatbots, and gaming automation, so the agency’s experience adds real value.
Why This Matters for AI Companies
The market for AI agents, chatbots, and machine learning platforms is growing fast, but attention is hard to win. New tools launch every day, and most never get noticed. Good PR can be the difference between a product that takes off and one that stays hidden.
By combining guaranteed coverage, same-day publishing, major newswire reach, and a free AgentLocker.ai listing, Kooc Media gives these companies a clear path to visibility. The packages are built to be fast, simple, and results-focused, which is exactly what fast-moving AI brands need.
For companies building AI agents, chatbots, and machine learning platforms that want to launch quickly and get noticed, this PR support offers a straightforward way to put their product in front of the right people.
Kooc Media’s AI packages are available now through the company’s website at https://kooc.co.uk.
Disclaimer: This is a Press Release provided by a third party who is responsible for the content. Please conduct your own research before taking any action based on the content.

Ripple executive chair Chris Larsen has been reported as one of the backers of a financial venture launched by Theodore Gillibrand, the son of US Senator Kirsten Gillibrand, according to a Politico report dated Thursday. The development lands in parallel with ongoing Senate negotiations over the Digital Asset Market Clarity (CLARITY) Act—US crypto market-structure legislation that lawmakers say could reshape how digital-asset businesses operate.
Politico reports that American Perpetuals Exchange Corp. (APEC), founded by Theodore Gillibrand, raised $30 million, with most investors contributing between $5,000 and $10,000 apiece. Larsen’s reported involvement was noted by Politico, though the report did not specify Larsen’s exact contribution.
Key takeaways
- Politico reports Chris Larsen was among investors backing APEC, Theodore Gillibrand’s derivatives-focused venture.
- APEC’s funding is described as totaling $30 million, with typical contributions reportedly in the $5,000–$10,000 range.
- The investment is unfolding while Senator Kirsten Gillibrand negotiates ethics provisions in the CLARITY Act.
- Democratic lawmakers are pressing Republicans to include ethics language, with questions framed around conflicts involving lawmakers and government officials.
- The Senate schedule—returning July 13 and then breaking again for an extended state work period—narrows the time left for CLARITY to advance.
APEC funding and the Larsen connection
In its Thursday coverage, Politico said Larsen was one of a small set of investors supporting APEC, the company created by Theodore Gillibrand. The report emphasizes that while APEC attracted a broader group of investors, individual stakes cited in the coverage were relatively modest, with “the majority” contributing between $5,000 and $10,000.
However, Politico did not publish Larsen’s exact amount. For readers tracking the intersection of finance and policy, the more relevant takeaway is not the dollar figure itself, but the timing: the reported investment is occurring while Gillibrand’s office and other lawmakers work to finalize provisions of a bill widely expected to influence the regulatory environment for crypto exchanges, issuers, and derivatives markets.
Ethics provisions in the CLARITY Act are front and center
The reported APEC backers’ list is becoming part of a broader political debate because the CLARITY Act is in active negotiation, and Gillibrand has publicly tied her support to ethics reforms.
As Cointelegraph previously reported, Gillibrand said in May that lawmakers would not be voting for the bill unless ethics concerns were addressed—specifically, the risk that members of Congress or senior administration figures could benefit financially from the crypto industry due to their government roles. In that context, she characterized such outcomes as an unacceptable form of “pay for play.”
“[T]he truth is, is that we cannot allow members of Congress, senior administration officials, presidents or vice presidents, to get rich off of these industries because of their insider status. It is the worst form of pay for play.”
A spokesperson for Gillibrand told Cointelegraph that her son was “a grown adult starting his own independent business” and that the senator had “no involvement in it whatsoever.” Politico’s report does not resolve the underlying political dispute, but it intensifies scrutiny of how lawmakers’ personal or family-adjacent business ties are perceived while ethics language is being negotiated for a major policy package.
Cointelegraph also reported that it reached out to APEC for comment but did not receive an immediate response.
Republicans expect movement—Democrats push harder on ethics
CoinShares data is not referenced in the reporting provided here; instead, the key developments revolve around how Congress plans to handle CLARITY’s legislative path. Democratic lawmakers have been urging Republicans, who hold a majority in Congress, to adopt ethics language in the act. Their calls cite concerns that involve the current administration’s ties to the crypto industry.
On the Republican side, leaders have signaled they expect the bill to move through the Senate in July. Senator Cynthia Lummis, according to Cointelegraph reporting from June, said lawmakers were “working a little bit on ethics,” along with other topics raised in negotiations, including decentralized finance and illicit transactions.
That mix matters because CLARITY is not just a single-issue bill—it is positioned as market-structure legislation. If ethics provisions end up changing the compliance burdens, definitions, or governance expectations for firms operating in the US, those downstream impacts could affect everything from how trading and derivatives products are offered to what internal controls businesses must maintain.
At the procedural level, the Senate’s thin margin means Republicans will need at least some Democratic support to reach the 60-vote threshold for CLARITY to pass.
The legislative timetable is tightening
Even as the debate continues, lawmakers’ calendars are becoming an additional constraint. The Senate is currently in its Independence Day holiday period. Per the schedule described in Cointelegraph’s reporting, the chamber is set to return to session on July 13 and then head into another month-long state work period in August.
That means the practical window for crypto market-structure action is shrinking well before the US election season—an environment that often leads to renewed legislative delay and reprioritization. For crypto firms and investors, the key watch item is whether negotiations on ethics provisions keep the bill on track through July, or whether the calendar effectively pushes momentum into a later legislative session.
While the APEC funding story may appear at first glance to be separate from CLARITY policy talks, it is the simultaneous timing that’s likely to influence political attention. As ethics language becomes part of the bill’s final shape, stakeholders will want to monitor not only the bill’s progress, but also how the Senate frames conflicts-of-interest concerns and whether those discussions drive any substantive changes to the bill text.
What to watch next is the Senate’s ability to reconcile ethics negotiations with broader market-structure provisions before the July vote window narrows—alongside any further disclosure or clarification about the reported involvement of industry figures in private-sector activity during an election-adjacent legislative crunch.
SBI Crypto, a cryptocurrency-focused division of Japanese financial conglomerate SBI, is shutting down its Bitcoin mining pool after a five-year run.
The company announced Wednesday that it will end mining pool operations on July 31 and will stop accepting mining shares at the same time. It did not provide its rationale for closing the pool.
SBI Crypto said miners should keep directing hashrate to the pool until the cutoff so final payouts can be calculated correctly before operations end. “We would sincerely appreciate your continued support by mining with us until the final day of operation,” it said.
The shutdown marks the end of one of Japan’s better-known corporate mining pool operations and is the latest sign of SBI’s intentions to expand its broader cryptocurrency strategy beyond mining.
SBI Crypto’s BTC mining pool ranks No. 12 globally
SBI Crypto launched its Bitcoin mining pool in March 2021, entering a market that at the time was dominated by operators such as Poolin, F2Pool and Binance Pool.
Data from SimpleMining shows SBI Crypto currently ranks as the 12th largest Bitcoin mining pool globally, with about 21.46 exahashes per second (EH/s) of hashrate and roughly 2.24% of total Bitcoin network share.

Source: SimpleMining
That places it far behind leaders like Foundry USA, which controls about 24.49% of the network, and AntPool at around 19.05%. Mid- and lower-tier mining pools such as ViaBTC and MARA Pool account for about 8.55% and 5.15% of the global Bitcoin mining hashrate, respectively.
Miner migration to alternative pools
SBI Crypto directed miners toward several alternative Bitcoin mining pool operators as it prepares to shut down its service, including Braiins, Luxor and NeoPool.
Among them, Braiins and Luxor are established mid-tier mining infrastructure providers, each controlling around 2%-3% of global Bitcoin hashrate, according to SimpleMining data. NeoPool is not included in the top-ranked pools by hashrate.
Source: Braiins
“Some operators may offer special programs or preferential conditions for clients transitioning from SBI Crypto,” the company said, adding that customers are encouraged to contact each operator directly for details.
Related: Bitcoin mining difficulty drops 10% in 11th largest downward adjustment
The shutdown comes as SBI Holdings continues to expand its broader cryptocurrency strategy beyond mining.
The company recently agreed to acquire full control of crypto exchange Bitbank in a 46.7 billion Japanese yen ($289 million) deal, aiming to create Japan’s largest cryptocurrency exchange.
SBI has also been increasing its focus on stablecoins, backing JPYSC, a new trust bank-backed Japanese yen stablecoin, and supporting Ripple’s rollout of the Ripple USD (RLUSD) stablecoin in Japan.
Magazine: Bitcoin miners are pivoting to AI, so why is the hashrate near ATHs?

TradingView unlocks Hyperliquid markets with round-the-clock data

Nationals’ Cade Cavalli, Red Sox’s Willson Contreras suspended after benches-clearing incident

New Alibaba AI framework skips loading every tool, cutting agent token use 99%


-

 Fashion6 days ago
Weekend Open Thread: Staud – Corporette.com
-

 Politics7 days ago
The House | Manchesterism won’t survive the painful trade-offs unless it gets citizens on board
-

 Crypto World3 days ago
Strategy authorizes up to $1.25B in Bitcoin sales under new capital plan
-

 Politics7 days ago
Potential 2028er World Cup attendee leaderboard
-

 Business7 days ago
Asia stock markets slide as tech shares slump
-

 News Videos4 days ago
MAJOR BITCOIN & MARKET UPDATE!!!! (MUST WATCH ASAP!!!)
-

 Crypto World5 days ago
Coinbase, Circle Deepen Crypto Stock Losses Despite Resilient S&P 500
-

 Tech3 days ago
Anonymous researcher drops 0-day ‘exploitarium’ repo
-

 Business3 days ago
Australia treasurer says alleged access of prime minister’s bank data ’incredibly concerning’
-

 Crypto World6 days ago
Kraken's xStocks Opens Bending Spoons IPO Registration to EEA Retail
-
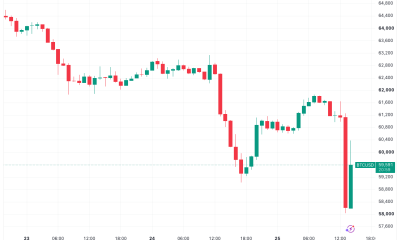
 Crypto World7 days ago
Bitcoin Sparks $600M Hourly Liquidations With $65,000 Set To Become Resistance
-

 Sports6 days ago
FIH Pro League: India defeat Pakistan 7-1, register biggest win of campaign | Other Sports News
-

 Tech5 days ago
Bluekit phishing kit adopts browser-in-the-middle for login theft
-

 Tech5 days ago
Russian hackers now target Signal backup recovery keys
-
 Crypto World6 days ago
Hyperliquid Named on Singapore MAS Investor Alert Register
-

 Crypto World6 days ago
RTX holders must register wallets before token distribution begins
-
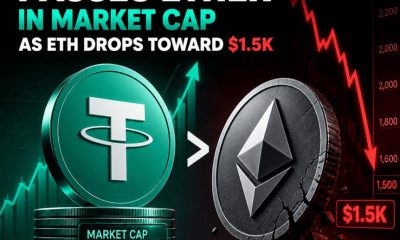
 Crypto World7 days ago
Tether (USDT) Passes Ether in Market Cap as ETH Drops Toward $1.5K
-

 Sports1 day ago
Broncos roster: OL Ben Powers (No. 74) entering final year of contract
-
 Business3 days ago
The AI boom won’t burst all at once. It will pop in ‘rolling bubbles’: Macquarie
-

 Tech5 days ago
Silicon Valley paid to kill AI regulation, now it wants the rules back
You must be logged in to post a comment Login