

Crypto World
TAO Surges by Double Digit, BTC Price Eyes $72K: Weekend Watch
Meanwhile, PI continues to lose value daily, dropping below $0.20 despite the Pi Day celebration.
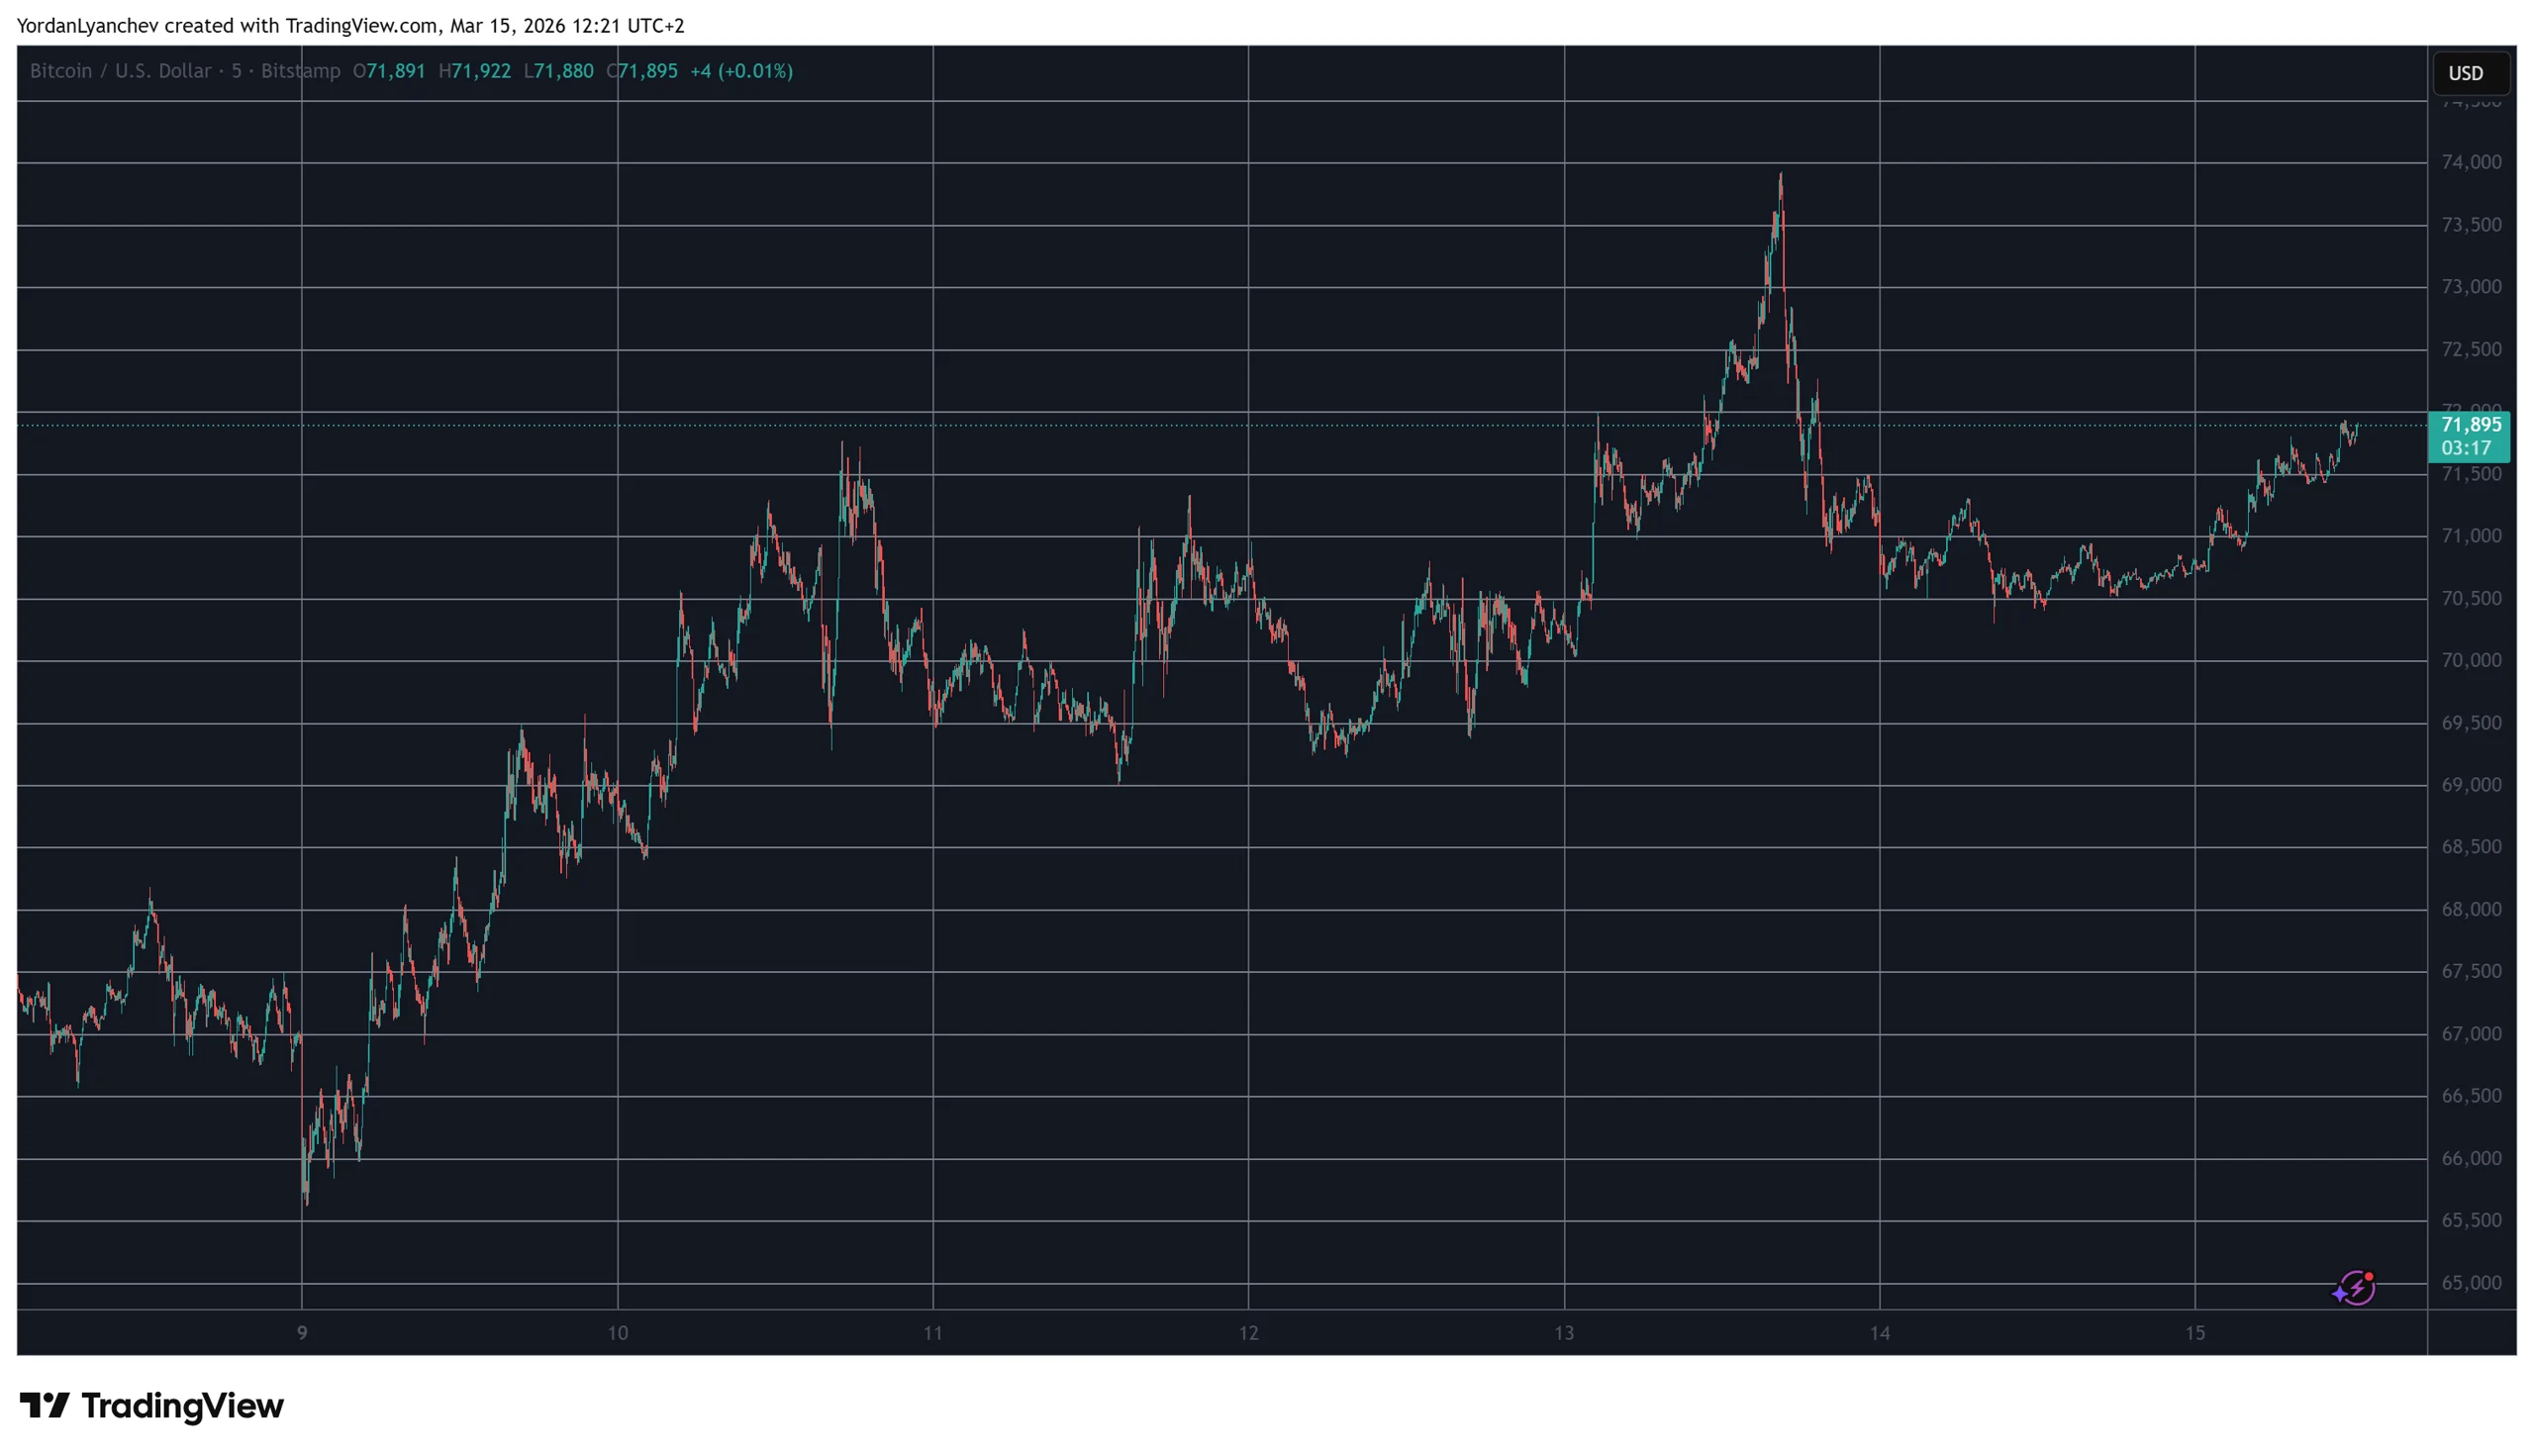
Despite the latest developments in the Middle East war, bitcoin’s price has shown strong resilience and even neared $72,000 earlier today.
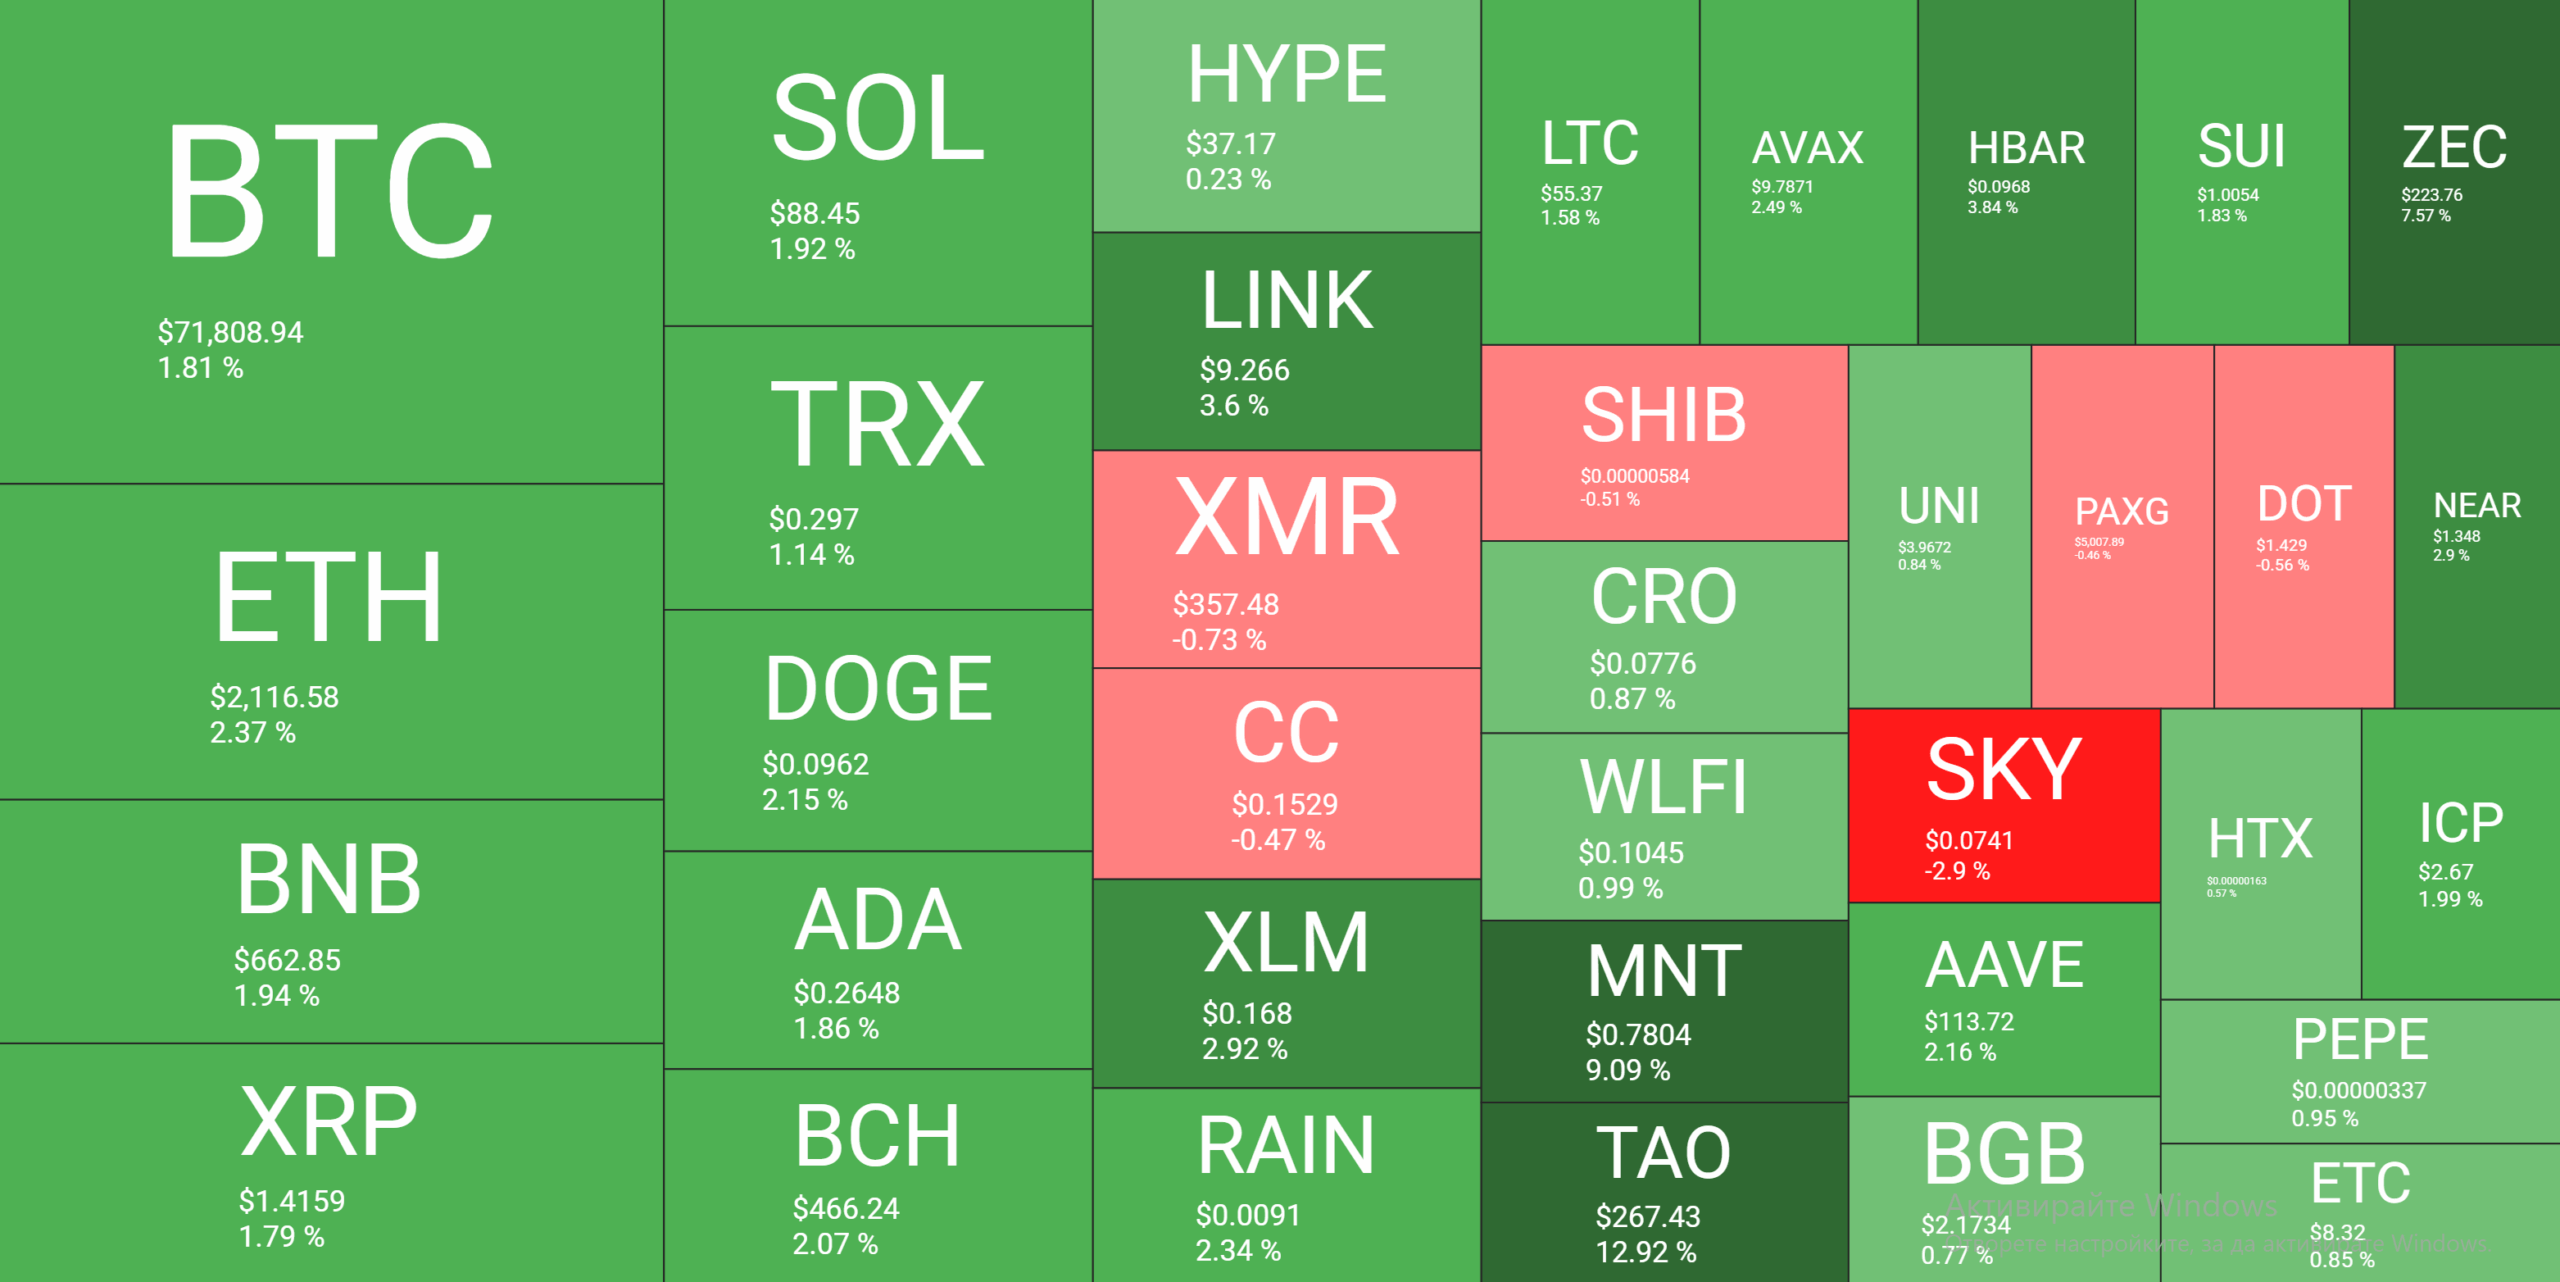
Most larger-cap altcoins are in the green today, with ETH climbing above $2,100. TAO has become the top performer from the larger caps, gaining over 12% daily.
BTC Eyes $72K
The previous business week began with a short-lived correction that drove BTC to $65,600 as the asset reacted to the weekend actions on the US/Israel-Iran war front. However, the cryptocurrency rebounded in the following days and surged past $70,000 on Wednesday after the release of the latest CPI data and Trump’s rather promising words that the war could be coming to a close.
Bitcoin slipped below $70,000 a day later, but the bulls took complete control on Friday, initiating another impressive leg up that pushed it to a 10-day peak of $74,000. However, it was immediately rejected there and dropped toward $70,000 as the US carried out a massive targeted attack against a key Iranian island.
Nevertheless, BTC remained above that level even as Trump urged other countries to send ships to defend the oil export through the Strait of Hormuz, and France responded positively. Moreover, it charted some gains in the past several hours as bitcoin challenged $72,000 but to no avail yet.
Its market cap has climbed to nearly $1.440 trillion, while its dominance over the alts is up to 57%.
TAO Flies
As the graph below will demonstrate, most larger-cap alts are slightly in the green. ETH has climbed above $2,100, BNB is north of $660, while XRP trades at $1.415. Similar gains come from the likes of SOL, TRX, DOGE, ADA, BCH, while LINK is up by over 3.5% to $9.2.
MNT, TAO, and ZEC are the top performers from the larger-cap alts. TAO has even pumped by double digits and now trades close to $270.
The total crypto market cap has added roughly $40 billion since yesterday and sits well above $2.5 trillion on CG.
Binance Free $600 (CryptoPotato Exclusive): Use this link to register a new account and receive $600 exclusive welcome offer on Binance (full details).
LIMITED OFFER for CryptoPotato readers at Bybit: Use this link to register and open a $500 FREE position on any coin!
Disclaimer: Information found on CryptoPotato is those of writers quoted. It does not represent the opinions of CryptoPotato on whether to buy, sell, or hold any investments. You are advised to conduct your own research before making any investment decisions. Use provided information at your own risk. See Disclaimer for more information.

Bitcoin edged toward an important weekly close above $70,000 that would include a reclaim of an important 200-week trend line.
Bitcoin (BTC) inched higher on Sunday as bulls sought to seal a weekly close above $70,000.
Key points:
-
Bitcoin eyes its highest daily close in over a week with a fresh weekend push above $70,000.
-
Price offers a reclaim of a key support trend line on weekly time frames.
-
Sell-side pressure at local highs is “steady profit-taking,” analysis says.
BTC price attempts long-term support rescue
Data from TradingView showed out-of-hours price action topping out just below the $72,000 mark before cooling.

Now in line for its seventh consecutive green daily candle, BTC/USD eyed its highest daily close since March 4.
Along with $70,000, price also stayed above key long-term levels: the 200-week exponential moving average (EMA) and the old 2021 all-time high at $68,300 and $69,400, respectively.

“The recent correction on Friday on Bitcoin was essentially just risk-off appetite to not be having positions going into the weekend. Nothing else,” crypto trader Michaël van de Poppe wrote in his latest X analysis.
“Markets are turning back upwards again, probably we’ll see a slight pullback later today for CME gap closing appetite, but other than that, I would assume we’ll continue to grind upwards to the resistances at $75-80K.”

Van de Poppe correctly forecasted that the price would revisit Friday’s closing price of CME Group’s Bitcoin futures market at $71,325.
At the time of writing, BTC/USD was still up by more than 8% on the week, with March gains at 6.7%.

Macro turmoil spoils Bitcoin “relief rally”
Geopolitical risk, meanwhile, remained at the forefront of trader discussions.
Related: Bitcoin ‘passing geopolitical stress test’ as BTC price spikes above $72K
WTI crude oil ended the week attempting to repass $100 per barrel, with the global oil supply shock still playing out.

“If macro was calm, this sort of structure could easily turn into a relief rally. But with the current backdrop… downside risk still hasn’t really gone away,” crypto analysis host Kyle Doops commented on X last week.
Doops identified a mid-term trading range for Bitcoin that was bordered by two key boundaries: the true market mean at $78,400, and the aggregate realized price of the current supply at $54,400.
“Every time price pokes above $70K, sellers show up. Not panic selling… just steady profit-taking,” he summarized about lower time frames.

This article does not contain investment advice or recommendations. Every investment and trading move involves risk, and readers should conduct their own research when making a decision. While we strive to provide accurate and timely information, Cointelegraph does not guarantee the accuracy, completeness, or reliability of any information in this article. This article may contain forward-looking statements that are subject to risks and uncertainties. Cointelegraph will not be liable for any loss or damage arising from your reliance on this information.

TLDR
- Chief Financial Officer and COO Akash Palkhiwala divested $330,815 in QCOM shares on March 12, 2026, with sale prices spanning $131.03 to $134.70
- Shares have plummeted 23.6% year-to-date, currently sitting at $129.82, dangerously close to the 1-year bottom of $120.80
- Company insiders have collectively offloaded 45,501 shares valued at $7.78 million within the past 90 days
- Capitolis Liquid Global Markets slashed its QCOM stake by 54.4%, dumping 322,000 shares during Q3
- Wall Street consensus points to “Hold” with a $168.00 price objective, while Bank of America maintains “Underperform” at $145
Qualcomm’s Chief Financial Officer and Chief Operating Officer Akash Palkhiwala executed a stock sale totaling $330,815 on March 12, 2026. The divestiture occurred through a predetermined Rule 10b5-1 trading arrangement established on December 8, 2025.
The executive unloaded 2,530 shares with transaction prices between $131.03 and $134.70 per share. After completing these sales, Palkhiwala maintains direct ownership of 33,099 company shares.
With shares currently priced at $129.82, Palkhiwala’s exit came at a premium to today’s valuation. The semiconductor giant has experienced a brutal 23.6% decline year-to-date and trades precariously near its annual nadir of $120.80.
This transaction represents just one piece of a larger insider selling trend. Throughout the previous 90-day period, company insiders have collectively disposed of 45,501 QCOM shares totaling roughly $7.78 million in aggregate value.
Executive Vice President Ann Chaplin liquidated 7,180 shares last December at an average price of $178.03, trimming her holdings by 23%. EVP Heather Ace followed suit in February, selling 3,200 shares at $137.00 apiece, representing a 16% reduction in her ownership stake.
Company insiders collectively control a mere 0.05% of outstanding shares. Institutional investment firms command 74.35% of the equity.
Institutional Activity
Among institutional players, Capitolis Liquid Global Markets LLC dramatically reduced its QCOM exposure by 54.4% during Q3, disposing of 322,000 shares. The firm’s remaining 270,400-share position carried an approximate value of $44.98 million according to regulatory filings.
Several smaller funds made modest upward adjustments. Waypoint Wealth Counsel, Greykasell Wealth Strategies, Baron Wealth Management, Certified Advisory Corp, and Elser Financial Planning each accumulated between 61 and 63 additional shares throughout the identical quarter.
Qualcomm’s 50-day moving average stands at $149.54, while the 200-day moving average registers at $162.36. Current trading prices remain substantially beneath both technical benchmarks.
The chipmaker commands a market capitalization of $138.52 billion, trades at a price-to-earnings multiple of 26.82, and exhibits a beta coefficient of 1.25. The company’s debt-to-equity ratio measures 0.64.
Analyst Ratings
Wall Street sentiment remains divided. Bank of America launched coverage on March 10 with an “Underperform” designation and $145 price objective, pointing to decelerating earnings expansion compared to industry rivals and the expected departure of Apple as a customer.
Royal Bank of Canada reduced its price target from $180 down to $150 while maintaining a “Sector Perform” stance. Evercore lowered its projection from $157 to $134. Piper Sandler retained its “Overweight” recommendation with a $200 target. Wells Fargo elevated QCOM to “Equal Weight” from “Underweight,” simultaneously boosting its target to $150.
The aggregate rating from 24 Wall Street analysts stands at “Hold,” accompanied by a mean price target of $168.00.
Qualcomm unveiled Q1 2026 financial results on February 4, delivering earnings per share of $3.50 against analyst expectations of $3.38. Revenue reached $12.25 billion, surpassing the $12.16 billion consensus estimate and representing a 4.7% year-over-year increase.
Management provided Q2 2026 EPS guidance ranging from $2.45 to $2.65. The analyst community projects full-year EPS of $9.39.
Qualcomm announced a quarterly dividend distribution of $0.89 per share, scheduled for payment on March 26, 2026. The annualized dividend yield currently sits at 2.7%, with a payout ratio of 73.55%.


Key takeaways
-
The 2026 Iran conflict created a major geopolitical shock that triggered volatility across global markets. It pushed investors to reassess traditional safe-haven assets such as gold and emerging alternatives like Bitcoin.
-
Gold initially benefited from safe-haven demand but later declined as the US dollar strengthened and bond yields rose. This showed that macroeconomic forces can override crisis-driven buying.
-
Bitcoin experienced volatility but recovered quickly, reflecting its growing role as an alternative asset. However, its price movements remained closely tied to market sentiment and liquidity conditions.
-
The strength of the US dollar played a key role in shaping both gold and Bitcoin’s performance, as rising demand for dollar liquidity influenced global asset flows.
Throughout history, geopolitical conflicts and periods of political instability have consistently triggered shifts in financial markets. When geopolitical tensions escalate, investors often seek to safeguard their capital by reallocating into perceived safe-haven assets that are expected to hold or increase in value during uncertain periods.
Gold has long been the benchmark safe-haven asset, prized for its scarcity, universal acceptance and track record as a store of value. In recent years, however, the rise of Bitcoin (BTC) has prompted widespread debate. Could this decentralized digital currency eventually assume a comparable role as a modern, borderless alternative?
This article explains how Bitcoin and gold responded differently to the geopolitical shock of the Iran war. It analyzes their price movements, market behavior and safe-haven roles, and examines what this divergence reveals about investor sentiment, liquidity dynamics and the evolving debate between traditional and digital stores of value.
2026 Iran conflict: A major geopolitical shock that rattled global markets
The 2026 Iran conflict offered a high-profile, real-time case study to examine whether Bitcoin behaved like a safe-haven asset. The conflict sent shockwaves through financial markets worldwide. Escalating military actions and threats to close the Strait of Hormuz sparked fears of major disruptions to energy supplies. About 20% of the world’s oil is estimated to pass through this crucial waterway, making it highly important for global energy markets.

As tensions grew, oil prices rose sharply, and financial markets turned highly volatile. Stock indexes around the world declined as investors reevaluated risks related to inflation, supply chains and future economic growth.
In times of such uncertainty, investors typically turn to assets seen as reliable stores of value. On this occasion, however, the response across different asset classes was more complex than usual.
Gold’s mixed performance as a safe-haven asset
At first, gold reacted as expected during a geopolitical crisis. Demand increased as investors sought safety amid the uncertainty.
As the conflict worsened, gold prices climbed higher while traders shifted funds into traditional safe-haven assets.
However, the upward movement in gold did not last long. Gold prices later dropped significantly when the US dollar strengthened and US Treasury yields rose. These factors often make the precious metal less attractive since it pays no interest or dividends.
At one point, gold fell more than 1% even as tensions continued to escalate. This highlighted how broader economic pressures, such as changes in interest rates or currency strength, can sometimes override safe-haven buying in the short term.
Such swings demonstrated that even a long-established crisis hedge like gold can experience temporary ups and downs when investors focus on liquidity needs or react to shifts in macroeconomic conditions.

Why investors sometimes sell gold during crises
One notable aspect of the recent Iran conflict shock was that investors temporarily sold off gold along with other assets. During periods of of extreme market uncertainty and panic, investors tend to prioritize raising cash urgently rather than holding commodities or securities.
During the early phase of the conflict, the surge in demand for US dollars and overall liquidity temporarily surpassed the appeal of gold as a safe haven. Moreover, soaring oil prices fueled inflation concerns, which drove bond yields higher and added further downward pressure on gold prices.
This pattern highlights a key insight. Gold has historically been viewed as a long-term hedge against geopolitical instability and economic turmoil. However, in the initial stages of a crisis, investors frequently favor immediate cash and liquidity to manage risks, margin calls or portfolio adjustments.
Did you know? The US holds the largest gold reserves in the world, about 8,133 metric tons. This accounts for roughly 78% of its official foreign reserves, highlighting how deeply gold remains embedded in the global monetary system.
Bitcoin’s reaction to the crisis: Volatile yet resilient
Bitcoin responded differently from gold during the conflict. In the opening phase of the geopolitical escalation, cryptocurrencies experienced sharp volatility as traders broadly reduced risk exposure and de-risked their portfolios.
That said, Bitcoin recovered after the initial volatility. Feb. 28, 2026, when the war began, Bitcoin reached a low of $63,106. By March 5, 2026, it had rebounded to $73,156 and then followed a steady trajectory to $71,226 by March 10, 2026.
Bitcoin’s price path signals renewed investor interest in alternative hedges against economic and geopolitical instability. Historically, Bitcoin’s price action has remained closely linked to overall market sentiment and prevailing liquidity conditions rather than being driven solely by geopolitical risks.
Did you know? Central banks around the world collectively hold around 36,000 metric tons of gold in their reserves, making it one of the most important reserve assets after the US dollar.
The role of US dollar strength
A key factor affecting both assets was the performance of the US dollar during the conflict. As investors scrambled for liquidity and perceived stability, the dollar strengthened significantly. Since gold is priced in dollars on global markets, a rising dollar generally exerts downward pressure on gold prices by making it more expensive for holders of other currencies.
Bitcoin is also sensitive to dollar dynamics. When capital flows toward traditional safe havens such as cash and reserve currencies during periods of uncertainty, demand for cryptocurrencies can soften temporarily, contributing to price weakness.
These interconnected factors, including dollar strength, liquidity preferences and risk-off sentiment, help explain the performance of gold and Bitcoin in this scenario. They also clarify why neither gold nor Bitcoin delivered a clean, sustained safe-haven rally during the initial phase of the conflict, despite their differing long-term characteristics.
Oil and inflation fears drove much of the market response
Energy markets were a dominant force shaping investor behavior during the conflict. The escalation drove oil prices higher, fueled by concerns over potential disruptions to shipping through the Strait of Hormuz. Any significant interruption in this critical chokepoint can elevate global energy and transportation costs, feeding into broader inflation pressures worldwide.
While inflation expectations tend to support gold over the longer term as a classic inflation hedge, they can produce the opposite effect in the short term. Rising inflation fears often prompt central banks or markets to anticipate tighter monetary policy, pushing interest rates and bond yields higher. Higher yields make interest-bearing assets more competitive relative to non-yielding commodities such as gold, creating downward pressure on gold prices in the near term.
Bitcoin’s link to inflation expectations is far less consistent. Bitcoin is generally viewed as a high-beta asset rather than a mature inflation hedge. As a result, its response to inflation signals tends to be more erratic and influenced by prevailing risk sentiment.
Did you know? Gold’s role as a safe-haven asset became especially visible during financial crises such as the Great Depression, when governments restricted private gold ownership to control capital flows and stabilize monetary systems.
What the divergence reveals about safe-haven status
The Iran conflict highlighted a fundamental difference between established and emerging safe-haven assets.
Gold is deeply embedded in the global financial and monetary architecture. Its centuries-long history, widespread accumulation by central banks and enduring role as a reserve asset provide strong credibility and trust during periods of geopolitical or economic stress.
Bitcoin, on the other hand, exists within a comparatively young and evolving digital financial ecosystem. Its price movements are shaped not only by geopolitical events but also by factors such as network adoption, regulatory developments, technological milestones and overall investor risk appetite across traditional and crypto markets.
This structural difference helps explain why Bitcoin and gold show distinct responses during the early stages of a crisis.
A real-world test of the “digital gold” narrative
For years, Bitcoin advocates have positioned it as “digital gold,” referring to a modern, decentralized alternative to the traditional safe-haven asset. The Iran conflict offered a real-world test of this claim.
While Bitcoin showed resilience during the war, its behavior diverged from that of a classic safe-haven instrument. Gold’s price action, however, remained anchored in familiar macroeconomic drivers such as dollar strength, inflation expectations and bond yield movements. Bitcoin’s volatility and recovery were shaped more by shifting investor sentiment, risk appetite and prevailing liquidity dynamics across broader markets.
This episode indicates that Bitcoin, while demonstrating growing credibility as a store of value under pressure, has not yet fully matured into a consistent safe-haven asset. Instead, it continues to evolve as a hybrid asset within the global financial system.
Cointelegraph maintains full editorial independence. The selection, commissioning and publication of Features and Magazine content are not influenced by advertisers, partners or commercial relationships.
Crypto World
Remittix Has Real Utility As Dogecoin & Pepe Traders Snap Up $RTX Tokens As Presale Set To End

Capital rotation is becoming increasingly visible across the meme coin sector as traders reassess where the next major opportunities may emerge. Dogecoin remains far below its 2021 peak, still trading near the $0.09 level after losing more than 75% of its all-time high value. Pepe is facing similar pressure, with recent market activity highlighting that PEPE continues to trade deep below its previous highs as sentiment across meme tokens cools.
As volatility continues to shake confidence in purely momentum-driven assets, many investors are beginning to look toward projects built around real-world utility. One project drawing increasing attention is Remittix, whose RTX token is currently in the final stage of its presale. With a live PayFi platform targeting the $50 billion global remittance fee market and only $6 million remaining in the current allocation, the shift in investor focus is becoming more noticeable. Here’s how Dogecoin, Pepe, and Remittix currently compare as the market narrative begins to evolve.

Dogecoin: Bearish Structure Despite Whale Accumulation
The Dogecoin price opened 2026 around $0.118 and has since fallen to about $0.095 in an extended downtrend that began after DOGE failed to get back above $0.25 in early 2025. Technical indicators are still bearish. 19 of 28 signals are flashing red and the Fear and Greed Index for Dogecoin price movement is at 18.
There are counterpoints. Whales purchased 1.7 billion DOGE worth $285 million in early March, and analyst Javon Marks has identified a bullish reversal on the monthly chart with targets as high as $1.25. The beta launch of X Money on Elon Musk’s platform also briefly lifted the Dogecoin price. But sustained momentum has not followed.
Dogecoin price predictions range from $0.10 to $0.19 and these are conservative scenarios offering limited upside for traders accustomed to parabolic rallies. That tepid outlook is one reason former DOGE holders now buy RTX tokens instead.
Pepe News: Liquidity Drains as the Meme Fades
The news about Pepe just now proves what many dreaded. PEPE is trading at approximately $0.0000033 which is lower as compared to its highest point of $0.0000280. The market cap has been shrinking to $1.4 billion and 22 out of 30 technical indicators are bearish. Liquidity has been meager with reserved spirit extending to Q4 2025.
Optimistic Pepe news entails long term projections. Changelly is projecting a recovery to $0.0000098 by December 2026 should the conditions improve. CoinPedia expects to get between $0.0000037 and $0.0000073 this year.
But without utility or a revenue model, PEPE remains dependent on social media cycles. That fragility is why Pepe news headlines mention capital rotation into utility tokens and why traders are instead buying RTX tokens as a hedge against meme fatigue.
Remittix: The Utility Play Drawing Meme Coin Profits
While meme-coin speculation continues to dominate social feeds, a growing number of traders are quietly reallocating profits into projects with clearer utility. That shift has become particularly visible among Dogecoin and Pepe holders, many of whom are now accumulating Remittix as the project’s presale moves toward its closing phase.
The interest is not purely speculative. Remittix is positioning itself within the rapidly emerging PayFi sector, focusing on infrastructure that allows cryptocurrencies to interact more seamlessly with traditional financial systems. Instead of relying on hype cycles, the platform is designed to enable direct crypto-to-fiat settlement, a function that addresses one of the most persistent frictions in digital asset adoption.
Five Core Remittix features explain why:
- Crypto-to-Fiat Bridge Across 30+ Currencies. Users send payments in over 100 cryptocurrencies and recipients receive local bank deposits with same-day processing.
- CertiK Grade A Security. Remittix ranks number one among pre-launch tokens on CertiK Skynet with full team verification.
- Zero Foreign-Exchange Fees. A flat-rate model eliminates the hidden charges that traditional remittance providers depend on.
- Staking Yields Up to 18% APY. No buy or sell tax on RTX, zero vesting for presale buyers, and tiered staking from 4% to 18%.
- Confirmed Exchange Listings. BitMart and LBank are locked in, with a third major listing expected at the $30 million milestone.
For traders watching the Dogecoin price stagnate and reading Pepe news about contracting liquidity, the chance to buy RTX tokens represents a fundamentally different proposition.
Remittix Opportunity: Where DOGE and PEPE Stand Today
Analysts have expressed optimism that Dogecoin price may recover if whale accumulation translates into buying pressure, and positive Pepe news could surface if meme sentiment cycles back. But neither asset offers the structural utility that investors increasingly demand.
Investors currently buying RTX tokens are betting on a different thesis: that a working payments platform with audited security and confirmed listings will outperform speculation over the medium term. With the presale in its final stage, a limited-time 15% affiliate bonus paid in USDT and claimable every 24 hours, gives participants an additional reason to act before the window closes.
Discover the future of PayFi with Remittix by checking out their project here:
Website: https://remittix.io/
Socials: https://linktr.ee/remittix
Disclaimer: This is a Press Release provided by a third party who is responsible for the content. Please conduct your own research before taking any action based on the content.

Bitcoin could eventually reach $1 million per coin if it captures a larger share of the global store-of-value market currently dominated by gold and government bonds, according to Bitwise Asset Management CIO Matt Hougan.
In a report earlier this week, Hougan said bitcoin’s long-term upside depends less on short-term market cycles and more on how much of the world’s wealth preservation market the cryptocurrency absorbs over time.
“One million sounds crazy,” said Hougan. “It implies bitcoin will rise 14x from today’s price.”
He pointed to several factors supporting that forecast, among them the rapid growth of the global store-of-value market, including gold, government bonds and other defensive assets, which has expanded from roughly $2.5 trillion in 2004 to nearly $40 trillion today. Bitcoin currently represents only about 4% of that market by value.
If the largest cryptocurrency were to capture roughly half of that market under current conditions, its price could approach that $1 million mark within roughly a decade, Hougan said. If the broader store-of-value market continues expanding, bitcoin would require a smaller share to reach that level.
The $1 million price fixation
The $1 million forecast has become a recurring theme across the crypto industry. President Donald Trump’s son Eric recently doubled down on his $1 million BTC call. In August, Coinbase CEO Brian Armstrong said bitcoin could reach that price by 2030.
Jack Dorsey, who ran X (formerly Twitter) until 2021 and co-founded payments firm Block (formerly Square), said bitcoin could reach $1 million in five years. Arthur Hayes, former BitMEX CEO, believes it could come as soon as 2028. Cathie Wood’s Ark Invest projected that bitcoin could reach $3.8 million by the end of the decade. Bernstein in 2024 forecast $1 million by 2033.
So why has the $1 million target become such a widely cited benchmark for bitcoin? CoinDesk asked several market analysts.
“It’s a clean headline and shorthand for the idea that Bitcoin could rival gold as a store of value. The exact number matters less than the share of global wealth Bitcoin captures,” said Mati Greenspan, market analyst and Quantum Economics founder.
For Jason Fernandes, also a market analyst and an AdLunam co-founder, the milestone is more psychological than a precise valuation target, reflecting the belief that bitcoin could ultimately win the store-of-value debate.
However, he also believes part of the narrative is driven by marketing dynamics. “Some of the narrative is promotional because round numbers travel well and align with holder incentives,” Fernandes said, though he added that the underlying thesis is not purely hype.
“I think many investors make a ‘static denominator’ mistake, valuing bitcoin against today’s store-of-value market instead of a much larger future one,” he said.
For Fernandes, the real question is not whether $1 million bitcoin is theoretically possible, but whether institutional adoption compounds long enough to justify that price.
Analysts agree on direction, but not the timeline
Some of the analysts who shared their comments with CoinDesk said Hougan’s projection is plausible over the long term, though most frame it as a decade-scale adoption story rather than a near-term forecast.
“Geopolitical tension strengthens the Bitcoin thesis,” said Greenspan. “In uncertain times, investors look for neutral stores of value, and Bitcoin increasingly sits in that bucket alongside gold.”
Greenspan said the milestone is possible but would likely take a decade or more, requiring continued institutional adoption and broader regulatory clarity.
Fernandes said Hougan’s argument is essentially a market-share thesis. Bitcoin does not need to replace gold outright, he said; it only needs to capture a portion of a growing global store-of-value market.
“A $1 million bitcoin assumes long-term adoption and market-share gains within the global store-of-value market,” Fernandes said. “It’s a thesis about bitcoin’s end state if it matures into a major global monetary asset.”
Institutional adoption remains the key driver
Hougan has argued that bitcoin’s fixed supply of 21 million coins and its decentralized network give it characteristics similar to those of traditional stores of value, such as gold.
Fernandes said the long-term $1 million thesis depends largely on continued institutional adoption and growth in the global store-of-value market.
“BTC doesn’t need to replace gold or fiat; it only needs to capture about 17% of a projected $121 trillion store-of-value market over the next decade to justify a $1 million price,” Fernandes said.
Greenspan said geopolitical uncertainty could further strengthen bitcoin’s appeal as a neutral asset.
“In uncertain times, investors look for neutral stores of value, and bitcoin increasingly sits in that bucket alongside gold,” he said, though he added that reaching such a valuation would likely take years of sustained adoption.
Nima Beni, founder of Bitlease, said the timeline could accelerate if confidence in traditional financial assets weakens.
“Bitcoin reaches $1 million when confidence in traditional ‘safe’ assets breaks,” he said, pointing to potential sovereign debt crises or disruptions in the gold market as possible catalysts.
Despite the bullish projections, analysts said bitcoin’s path toward such valuations would depend more on long-term adoption and macroeconomic conditions than on short-term market cycles.

New forensic findings from the phone of crypto lobbyist Mauricio Novelli have revealed a draft document suggesting a possible $5 million agreement connected to Argentine President Javier Milei’s promotion of the Libra token, according to local media reports.
The document, recovered from Novelli’s iPhone during a judicial investigation into the Libra crypto scandal, outlines a three-part payment structure totaling $5 million. Screenshots of the note surfaced after expert materials held by prosecutor Eduardo Taiano since November were made public, Argentine outlet El Destape reported.
The draft note was reportedly written in English on Feb. 11, 2025, just three days before Milei posted about the Libra token on X. “Hello friends, this is the final agreement discussed with H,” the text begins, which is believed to refer to crypto entrepreneur Hayden Davis.
The document then details the payment structure. “$1.5M of liquid tokens or cash as an advance. $1.5M in liquid tokens or cash = Milei announces on Twitter that his advisor is Hayden Davis/Kelsier/the Davis family. $2M in tokens or cash = contract signed in person with Milei for blockchain/AI consulting for the Argentine government and/or Javier Milei and review with Javier and Karina,” the text reads.

Notably, the draft note does not specify who would receive the funds.
Related: Argentina turns up the heat in Libra scandal with sweeping asset freeze
Another note outlines crisis message after scandal
Investigators also recovered a separate note drafted on Feb. 16, 2025, two days after the Libra controversy erupted online. The message appears to outline a public statement intended to calm the situation.
“This is what I want for the tweet. This is the only thing that saves him, me, and us,” the note’s translation from Spanish reads. The draft message then states support for the Libra project while denying any financial involvement and attributing accusations of wrongdoing to political opponents.
Authorities believe the message may have been prepared for Milei to post on social media or reference in an interview, according to local media reports.
Novelli was in Dallas during the token’s launch. Call records show he communicated with Milei and his sister Karina shortly before and after the president’s social media post about the token. As the controversy spread online, Novelli also held multiple calls with presidential adviser Santiago Caputo while the government managed the crisis.
Related: Argentine exchange Ripio bets on peso stablecoins amid cautious 2026 outlook
Libra hit $4 billion after Milei post before crashing
In February last year, Milei posted on X about the Libra (LIBRA) memecoin, which briefly reached a $4 billion market capitalization before plunging 94% within hours.
The crash wiped out hundreds of millions in investor funds and prompted opposition lawmakers to call for Milei’s impeachment. Milei later said he had merely “spread the word” about the token rather than promoted it.
Magazine: 2026 is the year of pragmatic privacy in crypto — Canton, Zcash and more
Crypto World
5 Undervalued AI Stocks for 2026: Oracle (ORCL), AMD, Micron (MU), TSMC and Dell Lead the Pack

While the artificial intelligence revolution has minted numerous success stories, many headline-grabbing companies now carry valuations that price in years of perfect execution. The real opportunities may lie with the less glamorous players—those providing the essential building blocks of AI infrastructure, from semiconductors and memory to cloud platforms and enterprise servers. Here are five stocks trading at attractive valuations despite their critical roles in the AI ecosystem.
Oracle’s Transformation Into an AI-Driven Cloud Giant
Once dismissed as a dinosaur in the database industry, Oracle is rewriting its narrative with impressive momentum.
The company’s most recent quarterly results showed total revenue climbing 22%, while cloud revenue surged 44% and Oracle Cloud Infrastructure accelerated an impressive 84% year-over-year. Perhaps most striking was the 325% jump in remaining performance obligations to $553 billion—representing committed future revenue already in the pipeline. Management has confidently raised its fiscal 2027 revenue guidance to $90 billion.
Wall Street may still be valuing Oracle through the lens of its legacy software business, but the reality is dramatically different. As the company’s revenue composition shifts increasingly toward high-margin AI cloud services, the valuation gap becomes more apparent. Should Oracle successfully monetize its massive backlog, significant upside potential remains.
AMD Emerges as a Legitimate Nvidia Competitor
While AMD is not Nvidia, the narrative that it’s perpetually behind is outdated.
Advanced Micro Devices, Inc., AMD
AMD delivered record quarterly revenue of $10.3 billion in Q4 2025, maintaining a healthy 54% gross margin. The data center division generated $5.4 billion in revenue—a 39% increase from the prior year—fueled by robust adoption of both EPYC server processors and Instinct AI accelerators.
The compelling case for AMD lies in its valuation relative to peers and its diversified revenue streams. Unlike pure-play AI chip companies, AMD benefits from multiple growth vectors including AI GPUs, traditional server CPUs, embedded solutions, and general cloud infrastructure expansion. Investors who believe AMD will continue capturing market share in high-performance computing may find today’s valuation attractive.
Micron: The Essential Memory Provider Wall Street Overlooks
Artificial intelligence infrastructure demands massive quantities of high-bandwidth memory, and Micron stands among the select few manufacturers capable of delivering at volume.
First-quarter fiscal 2026 results showcased revenue of $13.6 billion—a 57% year-over-year increase. Micron also achieved record free cash flow and announced increased capital expenditures to expand production capacity for next-generation HBM (high-bandwidth memory).
Memory chip manufacturers historically face cyclical demand patterns, making investors hesitant to assign premium valuations. However, AI workloads may be establishing a structural shift in memory demand that defies traditional cycles. If HBM remains in tight supply as expected, Micron could command a higher valuation multiple than legacy memory producers typically receive.
TSMC: The Indispensable Manufacturer Behind AI’s Biggest Names
TSMC fabricates the cutting-edge processors that enable virtually every significant AI innovation. Companies from Nvidia and AMD to Apple depend entirely on TSMC’s manufacturing capabilities.
Fourth-quarter 2025 results demonstrated revenue growth of 25.5% in U.S. dollar terms, accompanied by a 62.3% gross margin and 54% operating margin. The momentum continued into 2026, with January and February revenue climbing 29.9% compared to the same period in the previous year.
TSMC shares have traditionally traded at a discount to American semiconductor peers due to geopolitical risks associated with Taiwan. Yet from a pure operational and financial perspective, TSMC rivals or exceeds nearly any large-cap chip company. As AI hardware demand keeps advanced node capacity fully utilized, the company’s earnings trajectory appears increasingly robust.
Dell’s Explosive AI Server Growth Flies Under the Radar
Dell has transformed into a critical supplier of AI infrastructure, though many investors haven’t yet recognized this evolution.
Fiscal fourth-quarter 2026 results revealed overall revenue growth of 39%, but the real story was in AI-optimized servers, where revenue exploded 342% to reach $9 billion. Dell entered the current year with an extraordinary $43 billion backlog of AI server orders—providing revenue visibility that few hardware manufacturers can match.
The market continues pricing Dell largely as a personal computer company, creating a disconnect between perception and reality. With AI servers representing an expanding portion of total revenue, the valuation gap between Dell’s legacy image and its actual business composition is becoming harder to ignore. Value-oriented investors seeking AI exposure are increasingly recognizing this opportunity.
Final Thoughts
Oracle, AMD, Micron, TSMC, and Dell may not generate the same headlines as the most prominent AI stocks, but they’re providing the essential infrastructure—processors, memory chips, manufacturing capacity, cloud platforms, and complete systems—that enables the entire AI revolution. For investors concerned that the obvious AI beneficiaries already reflect lofty expectations, these five companies offer an alternative pathway to capitalize on the same secular growth trend.

Bitcoin (CRYPTO: BTC) has hovered near the $71,000 level as large holders ramp up exposure, according to Santiment’s latest weekly assessment. The analysis highlights a renewed shift by wallets that hold 10 to 10,000 BTC, which Santiment described as a bullish signal if it endures. The share of the total supply controlled by this cohort rose to 68.17% from 68.07% a week earlier, signaling a persistent tilt toward big holders even as prices stabilize. Retail demand, meanwhile, remains fragile; the Crypto Fear & Greed Index was in Extreme Fear at 16 on Sunday, underscoring ongoing caution among everyday investors. Bitcoin was around $71,350 at the time of publication, marking a roughly 6% rise over the past week. On the liquidity side, US spot BTC ETFs logged their first five-day inflow streak of 2026, bringing in roughly $767.32 million this week, a reminder that regulated products continue to channel capital into the market.
For context, Santiment’s notes on on-chain behavior were complemented by a broader view of market sentiment. The firm’s observations on wholesale accumulation come as traders weigh the implications of a shift in ownership toward larger addresses. The wholesale activity is particularly relevant when juxtaposed with the persistence of cautious sentiment among retail participants, a dynamic that has characterized much of Bitcoin’s range-bound work over recent months. The interplay between accumulation by whales and the slower pace of retail adoption has created a tug-of-war that market participants are watching closely, especially in areas where technicals align with on-chain signals to form a potential base for price stability.
In a separate frame of reference, the market has been responding to regulatory and product-structure developments that shape how new participants access Bitcoin. ETF inflows, now aided by a broader appetite for regulated exposure, can lend a degree of liquidity that supports price discovery. At the same time, analysts caution that this is not a simple, linear uptrend; episodes of volatility can arise if large holders react to evolving risk cues or if retail conviction fluctuates sharply. The balance between on-chain momentum and macro-driven appetite for regulated products continues to define Bitcoin’s core narrative as the year progresses.
Past on-chain patterns also color expectations. A week earlier, Santiment noted a marked reversal among whales after a sprint of buying earlier in the month. In a Mar. 6 report, the firm highlighted that whales had sold roughly 66% of the Bitcoin they had purchased between Feb. 23 and Mar. 3, just as Bitcoin breached the $70,000 level and briefly touched $74,000. The takeaway is not that whales cannot sustain accumulation, but that their activity can pivot rapidly in response to price moves, implying that a potential bottom may require a clearer alignment of broader market participants around a stable price range. The market’s tendency to reward the consensus with a lag remains a recurring theme that analysts stress when evaluating the durability of any bottom signal. Willy Woo, a prominent on-chain commentator, recently framed Bitcoin’s price action as “solidly in the middle of its bear market through a lens of long-range liquidity,” a reminder that structural factors can influence how the market transitions from caution to confidence over time.
The current environment also reflects a broader appetite for regulated crypto exposure. The five-day inflow streak into US spot Bitcoin ETFs is a notable marker of renewed institutional interest, a trend that has historically added a layer of liquidity and can help moderate sharp downside moves. The inflows come as traders observe how on-chain activity interacts with price levels and how new participants engage with the asset through regulated vehicles. While this liquidity backdrop can support a steadier price path, it does not by itself guarantee a sustained rally, particularly in a market where sentiment remains guarded and retail participation shows mixed signals. In the mix of factors shaping near-term moves, the balance between whales’ accumulation and retail behavior, alongside evolving ETF dynamics, will likely influence Bitcoin’s trajectory over the coming weeks.
Key takeaways
- Whale accumulation around $71k offers a potential floor if the trend persists, signaling renewed on-chain demand from large holders.
- The rising share of supply held by wallets with 10–10,000 BTC suggests ownership concentration is increasing, which could impact price dynamics if these addresses sustain net buying.
- Retail demand remains a wildcard, with Extreme Fear readings implying a cautious market that could slow any rapid upside despite bullish on-chain signals.
- Regulated exposure via US spot BTC ETFs contributed to a five-day inflow streak of roughly $767.32 million, adding liquidity that can influence near-term price action.
- Historical whale behavior—selling into strength—serves as a reminder that large holders can shift momentum quickly, creating risk for a sustained rally without broader participation.
Tickers mentioned: $BTC
Sentiment: Neutral
Price impact: Positive. Bitcoin’s price has moved higher in the week, reflecting on-chain accumulation and improving liquidity conditions from ETF inflows.
Trading idea (Not Financial Advice): Hold. The current mix of whale accumulation and cautious retail sentiment suggests waiting for clearer directional cues before committing to a new position.
Market context: A liquidity backdrop is evolving as US spot BTC ETFs post renewed inflows, complementing on-chain signals and shaping potential price moves as investors reassess risk and regulatory considerations.
Why it matters
On-chain behavior remains a critical lens through which investors assess Bitcoin’s near-term health. The consolidation of ownership among larger addresses can indicate a readiness to anchor prices at higher levels, especially if these participants sustain their accumulation into key support zones. If whales continue to accumulate while smaller holders trim their activity, the market could be positioning for a more durable base rather than a transient spike. This dynamic matters because it can reduce the likelihood of rapid, sharp declines and increase the odds of a steadier ascent should risk sentiment improve modestly.
Retail sentiment, captured by the Fear & Greed Index, matters because it often acts as a contrarian indicator. When everyday investors grow increasingly optimistic, the market may face a pullback if the enthusiasm outpaces underlying fundamentals. Conversely, persistent caution can delay upside while prices remain tethered to macro and on-chain cues. The emergence of ETF inflows adds another layer to the equation: while inflows are not a guarantee of a sustained rally, they can augment liquidity and provide a stepping-stone for broader participation, including institutional players who seek regulated exposure. Together, these factors sketch a market that could wobble near a confluence of on-chain signals, regulatory dynamics, and liquidity shifts rather than follow a simple, predictable trajectory.
In practical terms, traders and investors should watch how whale and retail balances evolve in tandem. A sustained rise in the share of BTC held by the 10–10,000 BTC cohort could reinforce a floor, especially if accompanied by continued ETF inflows. However, a resurgence in retail buying could introduce additional volatility, particularly if it coincides with macro developments or shifting risk appetite. The market’s path forward will likely hinge on the resilience of on-chain signals and the depth of liquidity provided by regulated products as the year progresses.
What to watch next
- Monitor the balance between whale and retail wallet activity; a persistent tilt toward large holders could support a higher floor.
- Track the Crypto Fear & Greed Index for shifts in sentiment that could precede a change in buying patterns.
- Observe ETF inflows beyond this week’s levels to gauge whether regulated exposure remains a tailwind for liquidity and price discovery.
- Watch price action around $71k and nearby psychological levels to assess how momentum players respond to resistance zones.
- Stay alert to macro developments and regulatory signals that could alter risk appetite for the crypto sector.
Sources & verification
- Santiment weekly summary on wallet balances and the share of supply held by 10–10,000 BTC addresses.
- On-chain discussion of whale dynamics and potential bottom formation from Santiment.
- Crypto Fear & Greed Index reading (Extreme Fear) for the period referenced.
- Bitcoin price context around $71,350 with seven-day performance data (CoinMarketCap).
- U.S. spot Bitcoin ETF inflows totaling approximately $767.32 million in the week reviewed.

TLDR
- Federal Reserve convenes Wednesday with expectations of maintaining rates between 3.5%–3.75%, focus shifts to Powell’s commentary
- Crude oil surged past $100 per barrel following Iran conflict that has disrupted Strait of Hormuz shipping routes
- Micron Technology delivers quarterly results Wednesday following remarkable stock surge of over 300% in past year
- Major earnings releases include FedEx, Dollar Tree, Alibaba, and multiple retail companies
- Goldman Sachs forecasts Q4 oil averaging $93/barrel if Strait of Hormuz blockade continues for two months
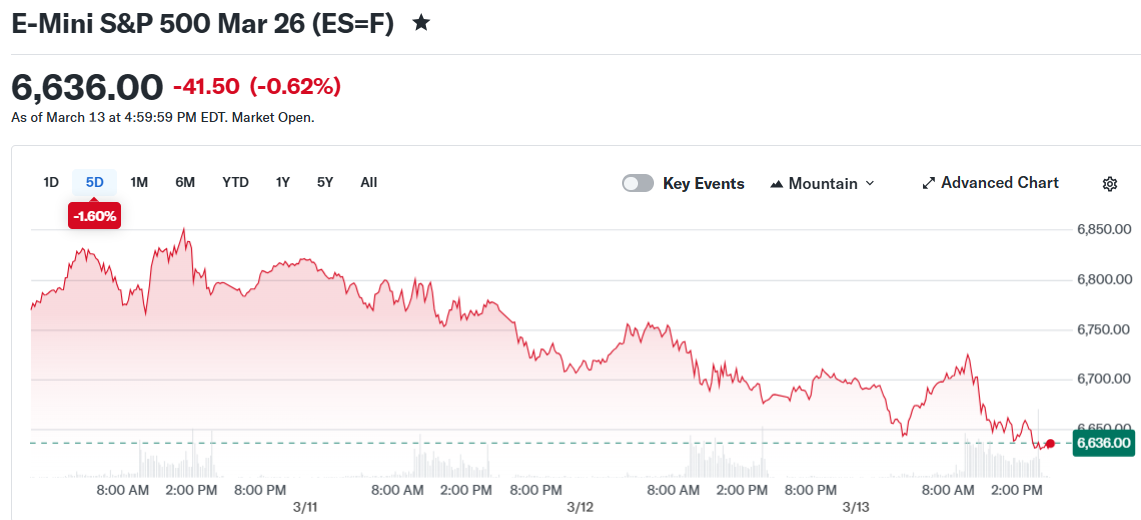
Equity markets extended their losing streak to three consecutive weeks as escalating tensions in Iran drove crude oil to heights last witnessed during the 2022 energy emergency. The S&P 500 declined 1.6% for the week. The Dow Jones Industrial Average shed 2%. The Nasdaq Composite retreated 1.3%.
Investors now face a calendar-packed week featuring a Federal Reserve policy announcement, numerous corporate earnings reports, and Nvidia’s signature developer conference.
The Federal Open Market Committee convenes Wednesday for its latest monetary policy deliberation. The benchmark federal funds rate currently stands at 3.5% to 3.75%. Market participants are nearly unanimous in expecting no change to current policy.
Chairman Jerome Powell will conduct a press briefing following the announcement. Analysts suggest this commentary could prove more significant than the rate decision itself.
Powell faces the task of addressing internal disagreements among Fed officials. One faction advocates for additional rate reductions citing employment market weakness. Another group expresses concern about potential inflation acceleration driven by surging energy costs.
This marks Powell’s penultimate scheduled press conference before his chairmanship concludes in May.
Oil and the Strait of Hormuz
The Iranian conflict has entered its third week with no resolution in sight. The Strait of Hormuz — a narrow 21-mile channel transporting approximately 14 million barrels of crude daily — continues to experience disruptions.
Iran’s Revolutionary Guard Corps has declared it will prevent “a liter of oil” from traversing the waterway.
Crude prices temporarily exceeded $100 per barrel last Sunday, marking the first such occurrence since Russia’s Ukraine invasion in 2022. After retreating to the $80 range, prices rebounded following drone attacks on critical petroleum infrastructure and production reduction announcements from Gulf nations.
Goldman Sachs projects that sustained closure of the Strait for 60 days would result in fourth quarter Brent crude averaging $93 per barrel. US West Texas Intermediate would average $89 under this scenario.
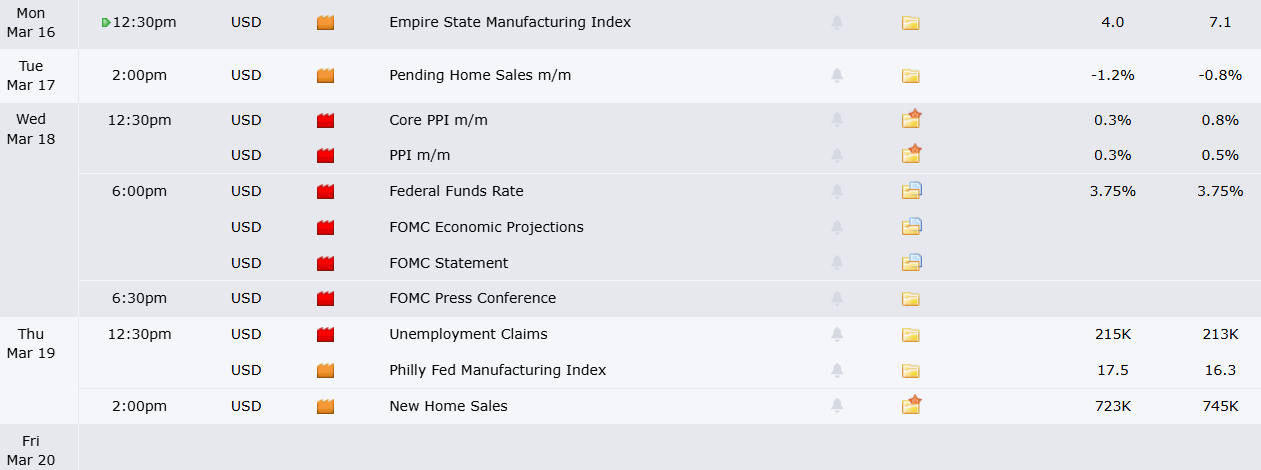
Wednesday additionally brings February’s Producer Price Index release. The January reading revealed wholesale inflation exceeded forecasts.
Micron and the Earnings Lineup
Micron Technology unveils quarterly results Wednesday. The semiconductor memory manufacturer’s shares have surged more than 300% over the previous twelve months, propelled by artificial intelligence hardware demand. Its most recent quarter showed 60% year-over-year revenue growth and exceeded analyst profit projections.
FedEx delivers earnings Thursday. The logistics giant’s stock has climbed nearly 25% year-to-date. Analysts scrutinize FedEx’s shipping metrics for economic health indicators.
Dollar Tree also announces results, offering perspective on American consumer strength. Its previous report characterized shoppers as “stretched.”
Nuclear energy firm Oklo releases earnings Tuesday. The company recently finalized an agreement with Meta to provide electricity for data center operations.
Alibaba reports Thursday alongside plans for expanded AI investment. Chinese electric vehicle manufacturer Xpeng announces Friday.
Nvidia’s GTC 2026 conference launches Monday featuring a presentation from CEO Jensen Huang.


Perhaps due to its popularity, but Ripple’s token is often the subject of some big price predictions, many of which come from its community, known as the XRP Army, and they are hard to believe, at least at first glance.
One of the latest, though, came from Ali Martinez, a renowned crypto analyst who has shown a lack of bias toward XRP in his commentary. Moreover, he posted a massive, quite unrealistic target (at least for the time being) of $48, but he based it on technical analysis, indicating that this is the potential top during the next bull run, according to the multi-year triangle formation.
While this might sound absurd given XRP’s current price tag of $1.43 and that it would require a 3,300% surge to reach those levels, we decided to ask ChatGPT to dissect this prediction to see if there’s any merit after all.
Reality Check
The AI solution first noted that the multi-year symmetrical triangle has started forming since its 2018 peak, and this measured move is calculated by taking the height of the pattern and projecting it upward from the breakout point. In the asset’s case, the range is quite wide, from $0.20 to $3.84. The current peak was obtained in 2025 at $3.60, while the breakout level is at the whopping $10-$13 zone.
It disclaimed that such measured moves from very large patterns “often exaggerate theoretical targets” because they assume a clean breakout with sustained momentum. If XRP is to reach those levels, its market cap would make it roughly the current size of Apple and 2x that of Bitcoin. To do so, these two factors would need to occur:
- The total crypto market cap would need to expand dramatically (possibly $10-$15 trillion).
- XRP would have to capture a very large share of that capital.
ChatGPT went back to the 2016/2017 cycle when XRP posted a mind-blowing surge of 56,000%, it said, jumping from approximately $0.006 to its then-all-time high of $3.40. In 2020-2021, it gained over 1,000%, but those moves came when XRP was a lot smaller altcoin, which is not the case now.
“Compared with those numbers, 3,300% is not unprecedented in crypto, but it usually happens from much lower starting prices. From a $88 billion market cap – such moves become harder.”
Realistic Targets
After it dismissed the $48 level as a “multi-cycle moonshot” option in which too many factors have to be perfectly aligned, ChatGPT outlined more realistic targets for the cross-border token. Its conservative scenario envisions a substantial rally to somewhere between $3 and $5.
The stronger bull case, in which XRP and the company behind it would have to experience major adoption growth, the ETF inflows would need to skyrocket, and the overall market expansion must be a lot stronger, sees the asset jumping to $8-$12. The probability for this scenario was put at “moderate.”
Even the extreme bull case puts XRP at $15-$25, and nowhere near $48. And this one would be possible if the total market cap reaches $10 trillion, and the cross-border token “captures a large narrative-driven capital inflow.” This probability was set at “low but plausible.”
The post We Asked ChatGPT if XRP Can Indeed Hit $48: Here Is the (Un)Surprising Answer appeared first on CryptoPotato.
Why the rise of multi-party politics is good for democracy

Unity Software: The Valuation Reset I’ve Been Waiting For (NYSE:U)

10 Years Later, Netflix Removes the Most Ruthlessly Review-Bombed Movie Ever


-
 Tech4 days ago
A 1,300-Pound NASA Spacecraft To Re-Enter Earth’s Atmosphere
-
 Crypto World1 day ago
HYPE Token Enters Net Deflation as HyperCore Buybacks Outpace Staking Rewards
-

 News Videos6 days ago
10th Algebra | Financial Planning | Question Bank Solution | Board Exam 2026
-

 Business5 days ago
ExxonMobil seeks to move corporate registration from New Jersey to Texas
-

 Crypto World6 days ago
Paradigm, a16z, Winklevoss Capital, Balaji Srinivasan among investors in ZODL
-

 Fashion2 days ago
Weekend Open Thread: Addict Lip Glow
-

 Tech5 days ago
ChatGPT will now generate interactive visuals to help you with math and science concepts
-
Sports1 day ago
Why Duke and Michigan Are Dead Even Entering Selection Sunday
-

 NewsBeat4 days ago
Residents reaction as Shildon murder probe enters second day
-

 Business7 days ago
Search for Nancy Guthrie Enters 37th Day as FBI Probes Wi-Fi Jammer Theory
-

 Business4 days ago
Search Enters Sixth Week With New Leads in Tucson Abduction Case
-
 NewsBeat6 days ago
Pagazzi Lighting enters administration as 70 jobs lost and 11 stores close across Scotland
-

 Tech6 days ago
Despite challenges, Ireland sixth in EU for board gender diversity
-

 Business1 day ago
US Airports Launch Donation Drives for Unpaid TSA Workers as Partial Government Shutdown Enters Fifth Week
-

 NewsBeat4 days ago
I Entered The Manosphere. Nothing Could Prepare Me For What I Found.
-
Crypto World22 hours ago
Coinbase and Bybit in Investment Talks: Could Bybit Finally Enter the US Crypto Market?
-

 Business6 days ago
Search Enters 39th Day with FBI Tip Line Developments and No Major Breakthroughs
-

 Sports6 days ago
Skateboarding World Championships: Britain’s Sky Brown wins park gold
-

 Business1 day ago
Country star Brantley Gilbert enters growing non-alcoholic beer market
-

 Crypto World5 days ago
Will Chainlink price reclaim $10 amid volatility squeeze?

