
Crypto World
Tether Reports $10B Profit and $141B in U.S. Treasury Holdings for 2025

TLDR:
- Tether generated over $10 billion in net profits during 2025 with excess reserves reaching $6.3 billion.
- The company issued nearly $50 billion in new USD₮ tokens, pushing total circulation to $186 billion.
- Direct and indirect U.S. Treasury exposure surpassed $141 billion, making Tether a top global holder.
- Total reserve assets climbed to $193 billion, continuing to exceed liabilities across all quarters.
Tether International posted net profits exceeding $10 billion for 2025, according to its Q4 attestation prepared by BDO.
The stablecoin issuer now holds over $141 billion in U.S. Treasury exposure while maintaining $6.3 billion in excess reserves.
Total USD₮ circulation reached an all-time high of $186 billion, supported by nearly $193 billion in reserve assets.
Record Issuance Drives Balance Sheet Expansion
The company issued nearly $50 billion in new USD₮ during 2025, marking the second-largest annual issuance in its history. About $30 billion of this total came during the second half of the year.
Strong demand from emerging markets and digital asset trading platforms fueled this growth. The rapid expansion positioned USD₮ as one of the fastest-growing dollar-denominated instruments globally.
Total liabilities reached $186.5 billion as of December 31, 2025, while total assets exceeded $192.8 billion. The digital tokens issued accounted for $186.4 billion of the total liabilities. This financial structure maintained Tether’s position as reserves continued to surpass liabilities throughout the year.
The stablecoin ecosystem now serves more than 530 million users worldwide. This user base represents growth in adoption across global markets.
CEO Paolo Ardoino stated that USD₮ has become “the most widely adopted monetary social network in the history of humanity.” The network effect contributed to USD₮’s expanding role in international payments and settlements.
BDO’s attestation confirmed the accuracy of Tether’s Financial Figures and Reserves Report. The independent verification provided transparency into the asset backing structure. Reserve management remained focused on maintaining liquidity and stability across market conditions.
Treasury Holdings Reach Historic Levels
Direct U.S. Treasury holdings surpassed $122 billion by year-end 2025, setting a company record. Combined with overnight reverse repurchase agreements, total Treasury exposure exceeded $141 billion.
These holdings place Tether among the world’s largest holders of U.S. government debt. The allocation reflects a strategic shift toward highly liquid, low-risk assets.
Ardoino explained that growth stemmed from global dollar demand moving outside traditional banking systems. He noted that “global demand for dollars is increasingly moving outside traditional banking rails, particularly in regions where financial systems are slow, fragmented, or inaccessible.”
The CEO added that decisions around asset quality and allocation ensure USD₮ remains reliable during periods of extreme demand.
Tether maintains a separate investment portfolio exceeding $20 billion across various sectors. These holdings include artificial intelligence, energy, fintech, and digital assets.
The investments are funded through excess capital and remain segregated from USD₮ reserves. Portfolio allocations span precious metals, agriculture, media, and peer-to-peer communication platforms.
The company enters 2026 with strengthened financial positioning. Reserve levels, Treasury exposure, and profitability metrics all reached record territory.
Market conditions continue to favor demand for digital dollars and programmable financial instruments across international markets.


TLDR:
- CoinDCX co-founders Sumit Gupta and Neeraj Khandelwal were arrested by Thane Police over an alleged Rs 71.6 lakh fraud.
- The complainant was promised high returns and franchise opportunities linked to CoinDCX between August 2025 and February 2026.
- CoinDCX says fraudsters impersonated its founders and diverted funds to accounts unrelated to the exchange.
- Between April 2024 and January 2026, CoinDCX reported over 1,212 fake websites impersonating its official domain.
CoinDCX co-founders Sumit Gupta and Neeraj Khandelwal were arrested by Thane Police in a financial fraud case. Both were detained in Bengaluru and produced before a court.
The court remanded them to police custody until March 23. The case involves an alleged fraud of Rs 71.6 lakh tied to fake promises of high returns and franchise opportunities related to CoinDCX.
Fraud Allegations and Police Action
An FIR was filed against six individuals, including the two co-founders. The complainant, an insurance advisor, said he was approached between August 2025 and February 2026.
He was promised high returns and franchise opportunities linked to CoinDCX. Neither the promised returns nor the franchise were ever delivered to him.
Police confirmed that the accused collected money through cash and bank transfers. Authorities have invoked provisions of the Bharatiya Nyaya Sanhita in the case.
The investigation is currently active and ongoing. Both co-founders remain in police custody pending further proceedings.
CoinDCX denied any wrongdoing on the part of the company or its leadership. The firm stated the FIR is tied to fraudsters who impersonated its founders.
These impersonators allegedly diverted collected funds to unrelated third-party accounts. The accounts cited in the complaint bear no connection to CoinDCX.
In response, CoinDCX took to its official social media account to address the public directly. The company stated that “the FIR filed against our co-founders is false and appears to be part of a conspiracy involving impersonators posing as CoinDCX founders and cheating the public.”
It added that it had “issued a public notice on our website highlighting that CoinDCX is being targeted by fraudsters.” The firm further confirmed that the accounts mentioned in the complaint are not linked to the company in any way.
CoinDCX Raises Industry-Wide Concerns Over Impersonation
Following its public statement, CoinDCX published a notice on its website alerting users about the ongoing fraud. The firm stressed that individuals posing as its founders had misled members of the public.
These fraudsters reportedly directed collected funds into unrelated third-party accounts. The exchange has been proactively communicating these threats to its community.
Between April 1, 2024 and January 5, 2026, CoinDCX reported over 1,212 fake websites. These sites were impersonating the official CoinDCX domain, coindcx.com.
The volume reflects the scale of brand abuse the exchange has faced over that period. CoinDCX has been actively working to flag and remove such fraudulent platforms.
Brand impersonation and cyber fraud are growing concerns in India’s digital finance space. More people investing online has provided greater opportunity for fraudsters to operate. CoinDCX noted that such cases are rising across the broader industry.
The firm stated that it “strongly condemns such actions” and remains “fully committed to supporting authorities in addressing such misconduct.”
CoinDCX remains focused on user education and community awareness as protective measures. The exchange continues to fully cooperate with relevant law enforcement authorities throughout the investigation.
Users are urged to verify all communications and transactions through the official CoinDCX platform only.

Crypto World
Strategy calls its new bitcoin funding tool an ‘iPhone’ moment but analysts warn of hidden risks
Strategy (MSTR), the leading corporate holder of bitcoin, has described the launch of its Perpetual Stretch Preferred Stock (STRC) as the firm’s “iPhone moment,” and despite its support in BTC accumulation, risks remain.
Before digging into these risks, it’s worth noting that while the focus is on STRC, specifically over its larger liquidity and adoption, they also apply to similar preferred offerings, including another bitcoin treasury company, Strive’s preferred offering, SATA.
These instruments are “not well understood through the lens of traditional credit or equity,” and instead require a different analytical framework, said NYDIG’s Global Head of Research Greg Cipolaro in a note.
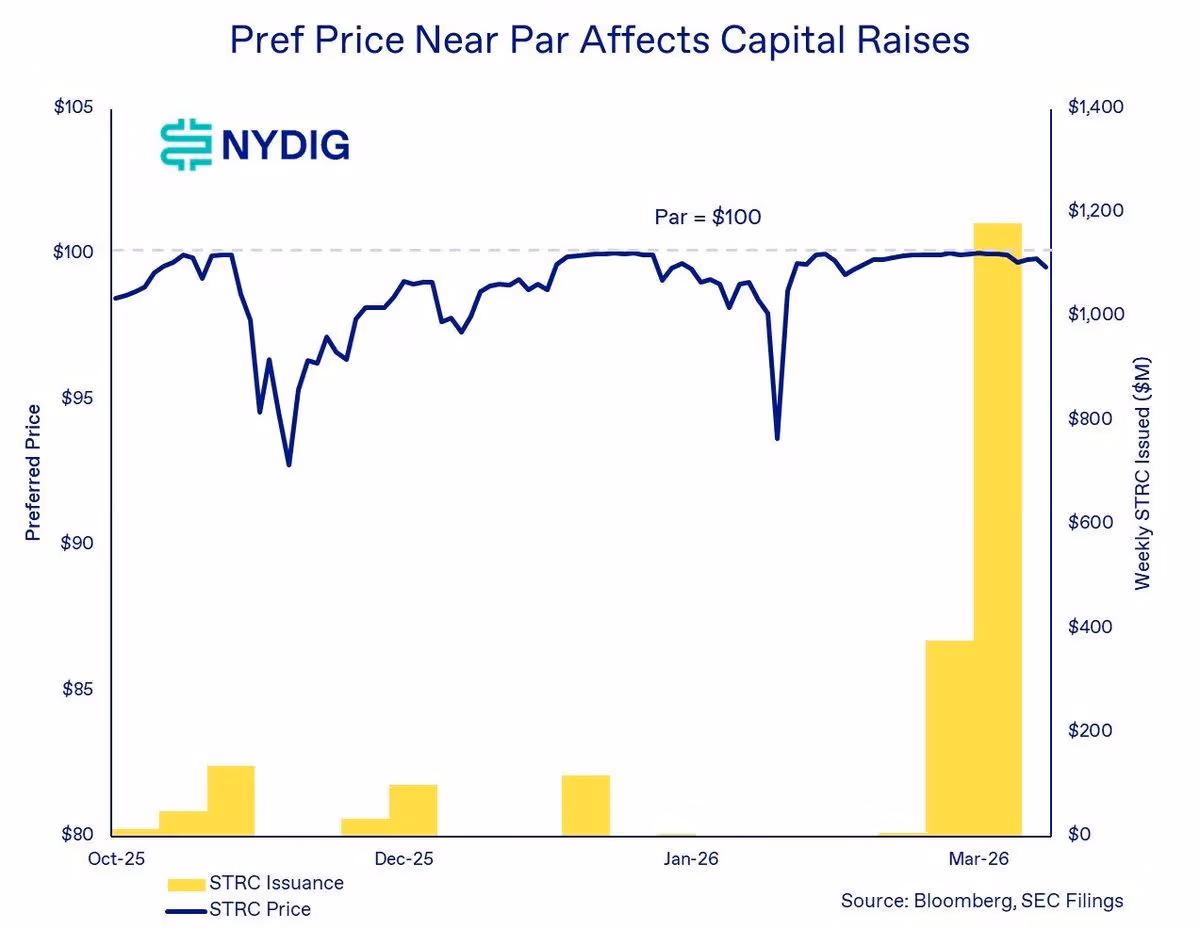
By design, STRC targets a steady $100 share price, using a variable monthly dividend to keep trading near that level. The approach has already supported multi-billion dollar issuance and the acquisition of more than 50,000 bitcoin, according to STRC.live data.
At its core, STRC works by adjusting yield to steer price. If shares trade above $100, the company can trim the dividend to cool demand. If shares fall below that level, it can raise dividends to attract buyers. Keeping the price anchored lets the firm issue new shares near par, bringing in capital that is then deployed to buy bitcoin.
The novel financial instrument has been a success so far. Not only has it allowed Strategy to buy more than $3.5 billion worth of bitcoin, but it has also attracted institutions that have added STRC to their balance sheets.
In practice, the product resembles a money market fund with a floating yield of 11.5%, far above U.S. Treasuries. The appeal hinges on the steady $100 price tag coupled with high yields.
When conditions are favorable, NYDIG’s Cipolaro wrote, the mechanism creates a powerful feedback loop. The loop, in which STRC trades near par, enables the firm to raise capital, deploy proceeds to buy more bitcoin, expand the asset base, and sustain investor confidence. That confidence sustains additional issuance.
“As long as preferreds remain anchored near par, equity trades above the NAV, and capital markets stay open, the flywheel drives ongoing bitcoin demand,” Cipolaro wrote in the note.
Still, not everything’s rosy.
BitMEX Research has written in a note titled “A bit of Stretch” that it sees the risks related to the product as “substantially greater than those related to short duration U.S. treasuries.”
Where the risks actually sit
Bullish investors often point out that STRC is well-capitalized and could easily cover dividend payments, given Strategy’s massive 761,068 BTC war chest and more than $2.2 billion in cash reserves. That’s around 50 years of covered dividend payments, while the company can still lower STRC’s dividend over time to further the coverage. On top of that, there are monetization options for the company’s massive bitcoin stash, which could further dividend payments.
The risks, however, aren’t based on dividend coverage at all, according to NYDIG’s Cipolaro.
“The appropriate way to assess risk in STRC and SATA is through the lens of governance and subordination rather than focusing solely on payment risk,” he wrote.
The mechanism STRC uses also creates a stress path. If bitcoin drops and confidence in Strategy’s balance sheet weakens, STRC could slip below par.
To defend the price, the company would need to raise the dividend. Higher payouts increase cash obligations, which can, in turn, worry investors and push the price lower. That feedback loop is a familiar one in credit markets.
In a standard corporate setting, that cycle can end in forced asset sales. Companies may have to sell core holdings to meet rising obligations, locking in losses at the worst time. For Strategy, that would mean selling BTC into a falling market. However, Strategy’s Michael Saylor has repeatedly said he won’t sell the company’s bitcoin stack.
The STRC terms, however, give the company another option. The target price is not a binding promise. If conditions turn, Strategy can reduce the dividend rather than increase it.
According to BitMEX Research’s reading of the SEC filings related to STRC, Strategy can “at its absolute discretion, lower the dividend rate by up to 25 bps a month, no matter what else is happening.”
Unpaid dividends can, in addition, accrue without triggering default or forcing asset sales. As BitMEX Research put it, instruments like these were “written by the company for the company.”
Read more: Strategy’s latest massive bitcoin purchase offers insight into its evolving funding model
Built to bend, not break
That flexibility shifts what would happen to STRC in cases of a crisis.
Instead of a company caught in a squeeze, the pressure moves to the security holders. If the dividend is reduced, the yield becomes less attractive, and the market price can fall to reflect the new reality.
NYDIG’s Cipolaro made it clear in his note that the structure “can remain solvent while still delivering suboptimal outcomes for preferred holders due to the loss of confidence and funding access.” The risk isn’t a default on its dividend, but rather the loss of its attractiveness.
Strategy’s legacy software business does not cover those payments on its own. The model depends on continued issuance or balance sheet management tied to its bitcoin holdings.
The binding constraint is not income generation, but the combination of continued access to capital markets and sufficient asset coverage,” NYDIG’s Cipolaro wrote. The setup invites comparisons to structures that rely on new inflows to support payouts.
The difference here is that payouts are not fixed. If demand slows, the company can lower the dividend instead of maintaining a rate it cannot sustain. That feature helps protect the issuer but weakens the claim for investors seeking stability and income.
“When the music stops, if things become challenging for MSTR, instead of selling bitcoin, MSTR could just abandon the narrative that STRC is targeting stability,” BitMEX Research wrote. “This feels very favourable for MSTR and the dividend payments are therefore quite sustainable and affordable, in our view.”
Breaking the mechanism
Market impact will depend on how long the $100 anchor holds.
As long as demand for yield products remains strong and bitcoin sentiment is supportive, STRC can keep channeling funds into the company’s treasury strategy.
That, in turn, reinforces Strategy’s position as a major public holder of bitcoin. NYDIG has shown that bitcoin’s price stability is what enables the economic viability of at-the-market issuance of these products.
STRC and Striv’es SATA have seen their prices drop below par during periods of sharp bitcoin price declines, the firm’s research found. When that happens, “issuance becomes uneconomic, limiting the ability to raise capital and slowing the flywheel.”

The risk shows up when conditions change. A prolonged drop in BTC’s price or a shift in rates could test the price mechanism. If the dividend is cut to preserve cash, STRC could trade well below par. Losses would be borne by investors who treated the shares as a near-cash substitute.
“It resembles being short a put on bitcoin asset coverage, earning yield in exchange for bearing downside risk if bitcoin declines and erodes the asset cushion,” NYDIG offered as a frame for institutional investors. “Unlike a standard option, however, there is no fixed strike or maturity, and outcomes are path-dependent and shaped by management discretion.”
The broader significance is the template itself.
STRC blends equity features with bond-like behavior and a built-in adjustment lever. It offers a new path for companies to raise capital tied to volatile assets without locking in fixed obligations.
For now, these instruments have done their job: attract capital and support further bitcoin accumulation. The open question is how it behaves under stress and who absorbs the cost when the trade no longer looks stable.
The interpretation of that scenario isn’t great, but not for MSTR, “it’s the investors who may feel somewhat aggrieved when the music stops,” BitMEX concluded.
Read more: Strategy’s credit risk falls as preferred equity value surpasses convertible debt
TLDR:
- Hackers are using fake Google Play Store pages in Brazil to distribute malware disguised as legitimate apps.
- The malware runs XMRig on infected Android devices, silently mining crypto while avoiding battery detection.
- A banking Trojan targets Binance and Trust Wallet, replacing wallet addresses during live USDT transactions.
- BTMOB RAT, a malware-as-a-service tool, gives attackers camera, GPS, and credential access on infected phones.
Android malware is spreading across Brazil through counterfeit Google Play Store pages, according to a new report by SecureList.
Hackers are using phishing websites to distribute apps that appear legitimate. Once installed, these apps silently convert infected phones into crypto mining devices.
Some variants also deploy a banking Trojan. The campaign currently targets Brazilian users exclusively, with newer versions spreading through WhatsApp and additional phishing channels.
Fake App Turns Phones Into Crypto Mining Machines
The campaign starts with a phishing website that closely mimics the Google Play Store. One of the fake apps is called INSS Reembolso, which claims to be tied to Brazil’s social security service.
The design copies trusted government branding and the Play Store layout, making the download appear safe to unsuspecting users.
After a user installs the fake app, the malware begins unpacking hidden code through multiple stages. It uses encrypted components and loads the main malicious code directly into the phone’s memory.
SecureList noted that “there are no visible files on the device, making it hard for users to detect any suspicious activity.”
The malware also takes steps to evade detection by security researchers. It checks whether the phone is running in an emulated environment and stops all activity if it detects one.
This evasion technique makes it harder to analyze in a lab setting. Android normally kills background apps to save battery, but the malware loops a silent audio file to fake active use.
Once the malware is fully active, it fetches a crypto mining payload from attacker-controlled infrastructure. This payload is a version of XMRig compiled for ARM devices, which are common in Android smartphones.
The infected device connects to mining servers and mines cryptocurrency silently in the background. According to SecureList, “the malware monitors the battery charge percentage, temperature, installation age, and whether the phone is being actively used,” with mining starting or stopping based on that data.
Banking Trojan Targets Binance and Trust Wallet Users
Beyond crypto mining, some versions of the malware install a banking Trojan that targets Binance and Trust Wallet.
During USDT transfers, the Trojan overlays fake screens on top of the real apps. It then quietly replaces the recipient wallet address with one controlled by the attacker.
The banking module also monitors popular browsers, including Chrome and Brave. SecureList confirmed the module “supports a wide range of remote commands,” including screen recording, audio capture, SMS sending, keystroke logging, device locking, and data wiping.
It additionally uses Firebase Cloud Messaging to receive instructions from attackers. All of these actions are carried out remotely without the user’s knowledge.
Other recent samples use the same fake app delivery method but switch the payload to BTMOB RAT. This remote access tool is sold in underground markets as part of a malware-as-a-service ecosystem. It provides deeper access, including camera control, GPS tracking, and credential theft.
SecureList confirmed that “all known victims are in Brazil,” though newer variants are also spreading through WhatsApp and other phishing pages.
BTMOB is actively promoted across online platforms, including YouTube and Telegram. Sales and support are handled through a dedicated Telegram account, which lowers the barrier for less-skilled attackers.
Resolv Labs faced a rapid-and-broad reaction from the crypto community after an exploit disrupted the minting mechanics of its USR stablecoin. The incident briefly knocked USR off its dollar peg, prompting a wave of risk management moves across DeFi protocols with exposure to Resolv’s ecosystem. The peg’s collapse was severe at first, but market data shows a partial recovery as investigations and containment efforts progressed.
Initial reporting indicated that an attacker manipulated the stablecoin’s minting flow, creating tens of millions of unbacked USR and funneling the tokens into various DeFi pools. As the situation unfolded, USR fell to a low around $0.14—roughly an 86% drop from its intended $1 peg—before narrowing the gap to the mid-0.4 range by the time of publication, according to CoinGecko.
In a recent statement on X, Resolv emphasized that the collateral pool remained intact and that the issue appeared isolated to the USR issuance mechanics, with containment and impact assessment ongoing. On-chain researchers have traced the attacker’s activity, with Arkham data corroborated by Cyvers indicating that the bulk of minted USR was converted to Ether, with a portion sold into ETH markets amounting to roughly 11,400 ETH (about $24 million at current prices). Independent observers noted that the remaining 36.74 million USR continued to be dumped in the market, underscoring the ongoing pressure on the token.
The sudden stability concerns surrounding USR sent tremors through the wider DeFi ecosystem, prompting rapid risk-management responses from several protocols. Lido Finance said that funds in Lido Earn were safe, while Morpho cofounder Merlin Egalite stressed that the lending protocol’s own contracts were unaffected and that only certain vaults carried exposure. Aave founder Stani Kulechov also noted that Aave’s direct USR exposure was limited and that Resolv was repaying outstanding debt. Nonetheless, observers highlighted potential knock-on effects for yield and leverage strategies that relied on RLP collateral tied to USR or its wrapped forms.
Markets and risk teams quickly moved to isolate risk. Some protocols paused markets or rotated exposure to prevent spillovers, while others confirmed no exposure at all. Industry voices characterized the risk as concentrated rather than systemic, with the most acute effects appearing in lending, leverage, and yield strategies that integrated USR, wstUSR, or RLP as collateral. The discussion highlighted how even a relatively small, targeted shock in a single stablecoin can ripple through complex DeFi vaults and automated market-making pipelines.
From a broader risk-management perspective, the event has rekindled questions about stability and security in algorithmic and minted stablecoins. Ledger’s chief technical officer Charles Guillemet argued that, given USR’s relatively small size, the incident doesn’t resemble a Terraform-like contagion event. Yet the episode underscores how a single protocol’s issuance architecture can become a focal point for systemic risk when coupled with dynamic liquidity and leveraged strategies.
Key takeaways
- USR’s peg collapse reached as low as $0.14, an 86% deviation from $1, before a partial rebound to around $0.42, underscoring the fragility of minting-based stabilization in stressed conditions.
- On-chain data indicate the attacker converted most minted USR into ETH, with approximately 11,400 ETH (~$24 million) sold, while tens of millions of USR tokens remained in circulation and continued to be dumped.
- DeFi exposure appears concentrated in lending, leverage, and yield protocols that used USR, wstUSR, or RLP as collateral, rather than signaling a broad market contagion.
- Major protocols moved quickly to contain risk—pausing markets or isolating affected vaults—while others reported no exposure, reflecting a mixed but targeted impact across the ecosystem.
- Security audits and monitoring are under renewed scrutiny. While Resolv has undergone multiple audits since 2024, industry experts argue for real-time, AI-powered monitoring to detect anomalies as they emerge and to validate mint-and-burn flows against reserves in real time.
Resolv’s response and the containment picture
Resolv’s public updates emphasized that the issue was rooted in the USR issuance mechanism rather than the underlying collateral pool. By signaling that the collateral pool remained intact, the project aimed to reassure users and counterparties that the core reserves remained adequately backed. The ongoing containment emphasis reflects a market preference for surgical fixes over broader protocol-wide disruptions, even when the systemic risk footprint is still being assessed.
Industry participants highlighted the risk profile as tied more to localized spillovers than to a chain-wide collapse. Lido reported that user funds in Lido Earn remained safe, and Aave’s leadership indicated that there was no direct USR exposure and that Resolv was working to unwind and repay debt in an orderly fashion. Yet the chatter around potential losses in Resolv’s junior RLP tranche drew attention to the fragile layers of DeFi that can amplify stress when stablecoins become volatile, especially in yield-generating constructs that rely on cross-collateralized schemes.
Analysts noted that the most affected areas are likely those that blend USR with leverage or yield protocols, where even a temporary peg dip can trigger deleveraging loops and capital redemptions. Observers also pointed to the possibility that some users could face balance-sheet stress if liquidations occur in tightly coupled vaults. The overall takeaway is that the risk appears concentrated and contained for now, but the exact scope depends on subsequent price action and the velocity of unwind in affected vaults.
Audits, monitoring, and the path forward
Security firms have repeatedly reviewed Resolv’s architecture, with a July 2025 security review by Pashov—the same team that audited the staking module—concluding that the design itself was sound, but that the root cause lay in an operational security vulnerability likely tied to private-key handling. The assessment reinforces a broader industry concern: audits are essential, but they capture a snapshot rather than a live, dynamic threat surface. Resolv’s leadership acknowledged that audits are necessary but static, underscoring the need for ongoing monitoring powered by real-time analytics to detect anomalous mint-burn flows, verify reserves, and validate oracle inputs and liquidity conditions as situations unfold.
As the story continues to develop, investors and users will be watching how quickly USR stabilizes, how robust the on-chain defense mechanisms prove to be, and which protocols adjust risk controls on stablecoins with minting and collateral-driven dynamics. Arkham and Cyvers’ on-chain findings, alongside independent analyses, will likely shape the narrative on whether this episode signals a broader shift toward more stringent real-time surveillance and automated containment mechanisms within DeFi.
For readers tracking the evolving risk landscape, the next set of updates from Resolv and the affected DeFi protocols will be crucial in assessing the durability of mint-based stablecoins and the resilience of yield and lending markets that interact with them.
TLDR:
- Bithumb plans CEO Lee reappointment despite AML fines and partial exchange suspension.
- February bitcoin glitch raised scrutiny over Bithumb’s internal controls and asset verification.
- Shareholders will vote on bond issuance limits and financial governance measures.
- Ongoing regulatory probes may lead to further penalties for the South Korean exchange.
Bithumb CEO reappointment efforts continue despite scrutiny over a bitcoin glitch and regulatory sanctions. The South Korean exchange will seek shareholder approval to extend CEO Lee Jae-won’s term at its annual meeting.
CEO Reappointment Amid Regulatory Challenges
Bithumb is moving forward with plans to reappoint CEO Lee Jae-won during its March 31 shareholders’ meeting. If approved, Lee will begin a new two-year term leading the exchange.
His reappointment comes despite recent sanctions imposed by the Financial Intelligence Unit under the Financial Services Commission. The FIU fined Bithumb 36.8 billion won and issued a six-month partial suspension for breaches of anti-money laundering regulations.
CEO Lee also received a reprimand warning, while the reporting officer faced a six-month suspension.
Crypto exchanges in South Korea are not legally classified as financial institutions. This allows executives to remain in their roles even after disciplinary actions.
Nevertheless, the penalties remain a serious regulatory signal. Industry sources suggest Bithumb’s decision to retain existing leadership is aimed at maintaining operational continuity during ongoing inspections.
The company is still awaiting findings from the Financial Supervisory Service regarding the February bitcoin payout error, as well as results from an investigation into its order book sharing with a foreign exchange.
The company is also preparing for shareholder decisions on internal governance. Maintaining CEO continuity is expected to help Bithumb navigate regulatory and operational challenges without abrupt changes to leadership.
The outcome of these votes will determine the company’s ability to respond to compliance requirements efficiently.
Strategic Measures and Financial Preparations
Bithumb’s annual meeting will also cover strategic proposals to strengthen corporate governance and financial flexibility. One key agenda item proposes increasing the issuance limit for convertible bonds and bonds with warrants to 300 billion won.
This measure is seen as a step to secure funds for restructuring the domestic virtual asset market. The exchange will propose appointing Jeong Yeon-dae, a tax accountant and academic, as the new auditor.
His role aims to improve accounting transparency and internal controls. Another agenda item includes renaming the affiliate Bithumb A to “Bithumb Asset,” which manages investment and holding operations outside of exchange activities.
The February bitcoin overpayment incident exposed weaknesses in Bithumb’s verification systems. Users received payouts exceeding actual holdings, highlighting gaps in asset management controls.
Regulatory authorities are reviewing potential violations under the Virtual Asset User Protection Act and reporting laws. The combination of ongoing probes and financial measures underscores the company’s effort to manage risks while retaining leadership continuity.
Bithumb now faces a critical period as shareholder decisions and regulatory outcomes converge, determining both the company’s operational direction and leadership stability for the coming term.


A tentative agreement on stablecoin rewards has renewed hope for the CLARITY Act, a key piece of cryptocurrency legislation.
Summary
- Galaxy Research warns that the crypto bill still faces critical regulatory hurdles ahead.
- Despite recent stablecoin deal, key issues like DeFi regulation remain unresolved.
- The crypto industry faces uncertainty as the legislative clock runs out on the bill.
The agreement, which resolves a major conflict between traditional banks and the digital asset industry, has provided a boost to the stalled legislation. However, experts are warning that the CLARITY Act still faces significant challenges and must overcome a series of unresolved issues before it can be passed.
In March 2026, key lawmakers, including Senators Thom Tillis (R-N.C.) and Angela Alsobrooks (D-Md.), reached a “tentative deal” with White House officials on the issue of stablecoin rewards. This agreement aims to address the concerns raised by traditional Wall Street institutions about stablecoin rewards offered by exchanges. These rewards, critics argue, could lead to a mass migration of deposits from traditional banks to crypto exchanges.
Senator Tillis and Alsobrooks’ deal was seen as a major step forward in the push to resolve the issue, as it has been one of the key stumbling blocks holding up the passage of the CLARITY Act since January. The White House, through crypto policy adviser Patrick Witt, praised the bipartisan efforts, calling the agreement a “major milestone” toward passing the legislation.
While the agreement on stablecoin rewards is a significant development, the CLARITY Act still faces other hurdles. Alex Thorn, head of research at Galaxy Digital, warned that while the stablecoin dispute is the current focus, it is not the only challenge. Thorn pointed out several other contentious topics that need to be resolved, including decentralized finance (DeFi) regulation, developer protections, and the powers of the Securities and Exchange Commission (SEC).
Thorn emphasized that the window for passing the CLARITY Act this year is closing rapidly. He stated that if the bill does not make it through the Senate Banking Committee by the end of April, the odds of it passing in 2026 would become extremely low. With limited time left for discussion, Thorn and other experts caution that the clock is ticking for the CLARITY Act to move forward.
The road ahead for the CLARITY Act
The CLARITY Act, which aims to establish comprehensive regulatory frameworks for cryptocurrency, is seen as crucial for the industry’s long-term growth. However, with the stablecoin rewards issue now addressed, lawmakers and the White House must turn their attention to the remaining obstacles that could prevent the bill from reaching the Senate floor. The legislation needs to pass the Senate by early May to have a realistic chance of becoming law in 2026.
TLDR:
- Bitcoin’s 30-day correlation with the S&P 500 turned negative following a structural market reset in October 2025.
- A $19B liquidation event wiped 70,000 BTC in open interest, permanently altering crypto’s leverage and liquidity profile.
- Spot Bitcoin ETF outflows converted institutional vehicles into selling pressure, deepening the gap between BTC and equities.
- Geopolitical tensions in Iran triggered equity declines while Bitcoin gained, reflecting partial capital rotation into BTC.
Bitcoin has broken its historically positive correlation with the S&P 500, entering a rare decoupling phase. CryptoQuant analyst Darkfost noted that the 30-day correlation between Bitcoin and equities has turned negative.
This shift follows a major liquidation event in October 2025 that restructured the crypto market. The divergence is driven by differences in liquidity, leverage, and capital flows between both asset classes.
October 2025 Liquidation Reset Bitcoin’s Market Structure
On October 10–11, 2025, the crypto market experienced a severe liquidation event. Roughly $19 billion in leveraged positions were eliminated within just two days.
Open interest dropped by approximately 70,000 BTC, resetting the market’s overall risk capacity. This was not merely a price shock but a structural reset of how the market absorbs leverage.
Following the event, leverage recovery across crypto markets remained slow and unsteady. Liquidity weakened across trading venues, and traders adopted more defensive strategies as a result.
Persistent hedging demand in derivatives markets reflected a broader shift in trader sentiment. In contrast, equities recovered steadily, supported by strong AI-related corporate earnings throughout the period.
This divergence exposed the different forces driving each asset class at the time. Equities moved on corporate fundamentals, while Bitcoin responded primarily to shifting liquidity conditions.
The two markets, once closely correlated, began operating on entirely separate dynamics. Bitcoin’s traditional role as a high-beta equity proxy lost much of its credibility in the process.
With open interest reduced, downside pressure on the asset became more contained over time. New inflows could now move prices more directly than in prior market cycles.
The lower leverage environment gave Bitcoin a distinctly different risk profile than before. This structural shift set the stage for the decoupling that followed in subsequent months.
ETF Outflows and Geopolitical Tensions Deepen the Divide
Spot Bitcoin ETF outflows added further pressure to an already fragile market environment. Institutional redemptions turned ETF vehicles into sources of selling pressure rather than demand.
This reflected weakening institutional appetite at a critical point in the market cycle. However, the reduced leverage environment limited the extent of overall price damage during this period.
Rising geopolitical tensions involving Iran then applied fresh pressure on equity markets. Higher energy prices pushed inflation concerns upward, lifting bond yields in the process.
Elevated yields raised risks to corporate earnings, pulling broader stock valuations lower. Equities declined while BTC moved in the opposite direction during this window.
Bitcoin held its ground and showed relative strength during the equity weakness. Some capital rotated from stocks into Bitcoin as a short-term diversification move.
This reflected a change in how certain investors viewed the asset within a broader portfolio. The rotation was partial but sufficient to support prices during the equity drawdown.
Going forward, ETF flow trends, open interest recovery, and macro conditions remain the key variables. A return of leverage and institutional ETF demand could narrow the gap between both markets.
For now, crypto and equities appear to be in a fragmented, unsynchronized phase rather than a unified one.
There was a time when online gambling moved in one direction and every operator followed the same path. Build a sportsbook, add some casino games, process payments through banks, and compete on odds and marketing spend. Bet365 mastered that formula better than almost anyone. But the path is forking. A new class of platforms is emerging that runs on different infrastructure, targets a different audience, and measures success by different standards. ZunaBet is the clearest example of that new class. Setting it alongside Bet365 does not just compare two gambling platforms. It maps the point where the industry started heading in two directions at once.
Bet365: The Company That Defined the Category
Bet365 started in a portable building in Stoke-on-Trent in 2000. Denise Coates had a hunch that betting was about to move online in a serious way, and she was right in a manner that produced one of the most remarkable business stories in British corporate history. Twenty-five years later, Bet365 is still privately held by the Coates family, still headquartered in Stoke, and still one of the most visited gambling websites on the planet.
Sports betting is the product that made Bet365 what it is. The coverage is extraordinary. Every globally recognized sport and dozens of regional ones are represented with deep markets and consistently sharp odds. The live betting product deserves particular mention — thousands of events run simultaneously with in-play markets that update in real time, paired with a streaming service that gives players direct access to the action. It is the kind of product that took years of investment and iteration to build, and it shows.
The casino has grown into a meaningful part of the business over time. Thousands of titles from established providers cover slots, table games, and live dealer formats. It is a stronger casino offering than most sportsbook-first operators manage, though it has not expanded as aggressively as platforms that treat casino as their primary business.
Financial transactions go through the standard set of traditional channels. Debit cards, bank transfers, PayPal, Skrill, Neteller, and assorted regional options. No cryptocurrency. Withdrawal times depend on the method — e-wallets are typically the quickest while bank transfers can take several days depending on the player’s location and their bank’s processing schedule.
New accounts are greeted with bet credit offers that vary by market. Ongoing loyalty operates without a formal tier structure — Bet365 sends personalized promotions to active players on its own terms. The company has always operated on the principle that the product itself is the best retention tool, and its financial results suggest that principle holds up.
Bet365 perfected online gambling as it existed through the 2000s and 2010s. Every part of the operation reflects that era’s best thinking about how a betting platform should work. The question hanging over it — and every operator of its generation — is whether that thinking still applies to the players who are showing up now.
ZunaBet: Starting Where Others Have Not Reached Yet
ZunaBet launched in 2026 through Strathvale Group Ltd with an Anjouan gaming license and a founding team with more than two decades of combined gambling industry experience. The platform was not built on top of anything that came before it. There was no legacy system, no prior business model, and no inherited assumptions about how things had to work. The team started fresh and built a product that reflects the current state of technology, player expectations, and financial infrastructure rather than the state of things when Bet365 opened its doors.
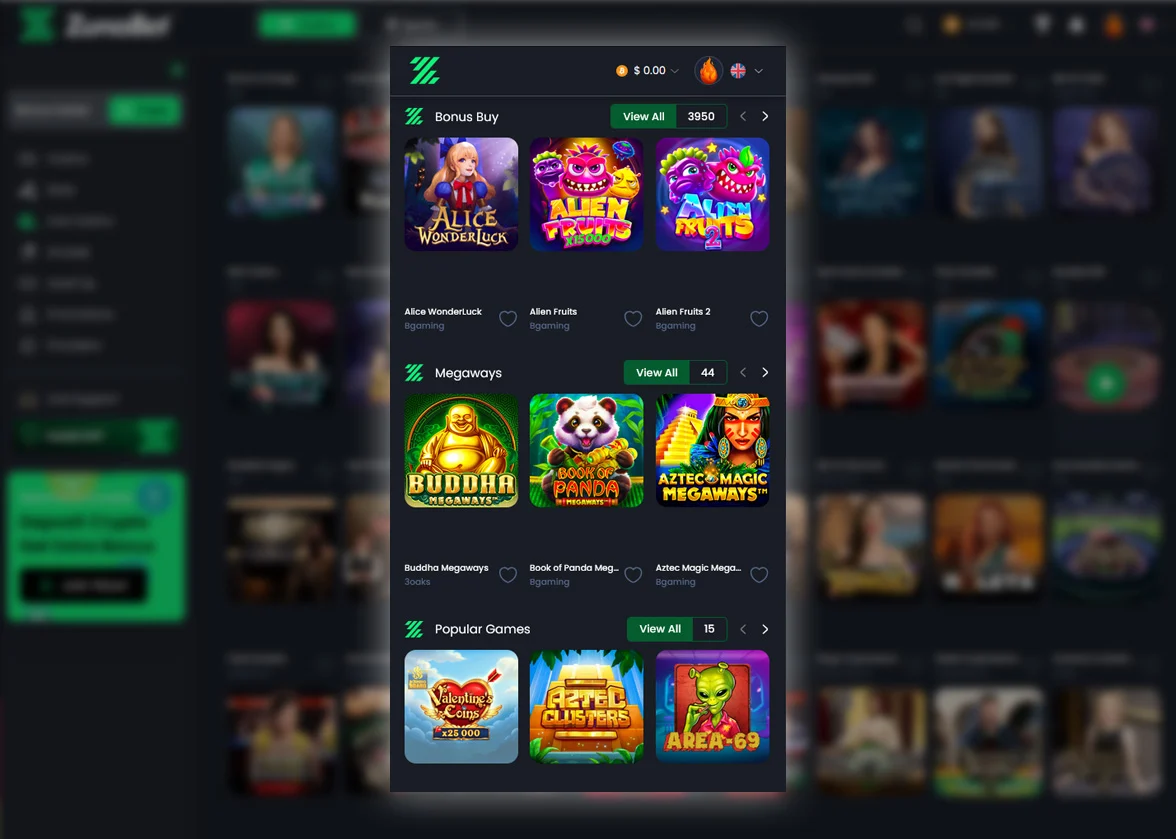
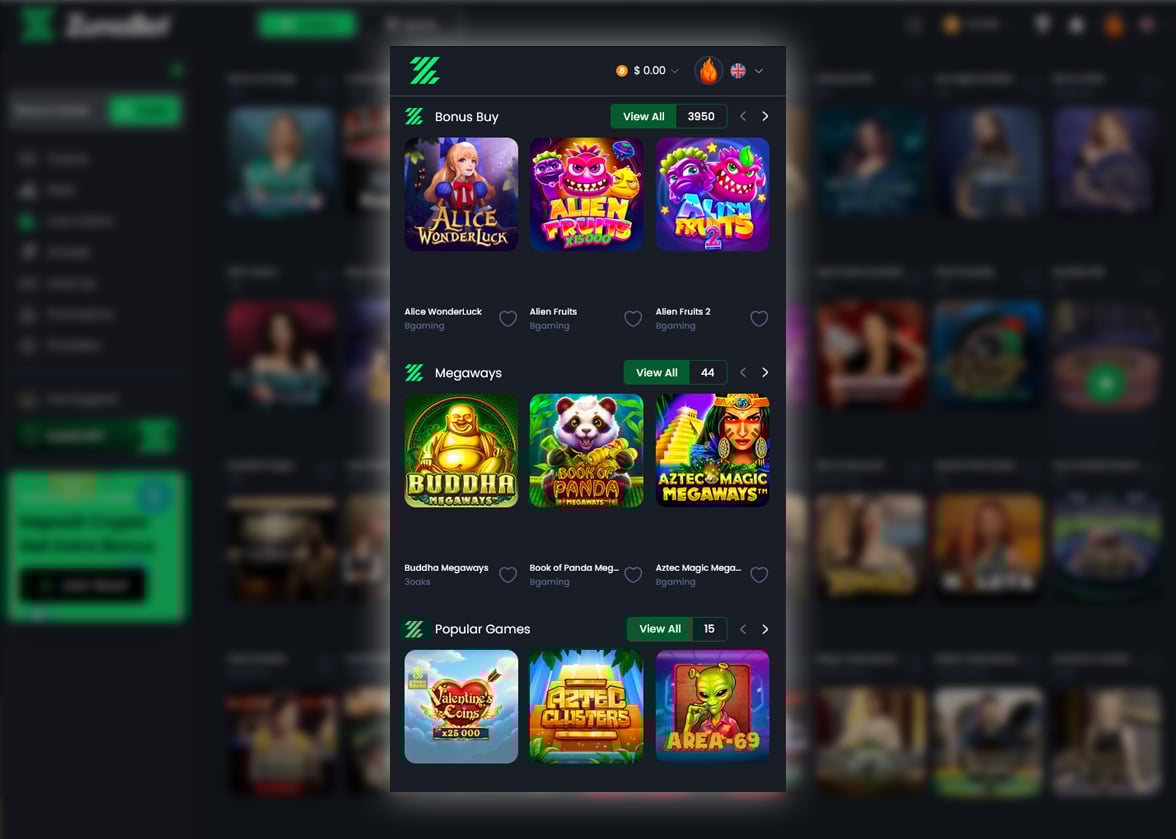
The game catalog is the most striking entry point. ZunaBet lists over 11,000 titles drawn from 63 providers — Pragmatic Play, Evolution, Hacksaw Gaming, Yggdrasil, BGaming, and a long tail of additional studios covering every format in the casino space. Slots dominate the count but RNG table games and live dealer rooms run deep. That library exceeds what Bet365 offers on the casino side, which is an extraordinary position for a platform that has existed for a fraction of the time.
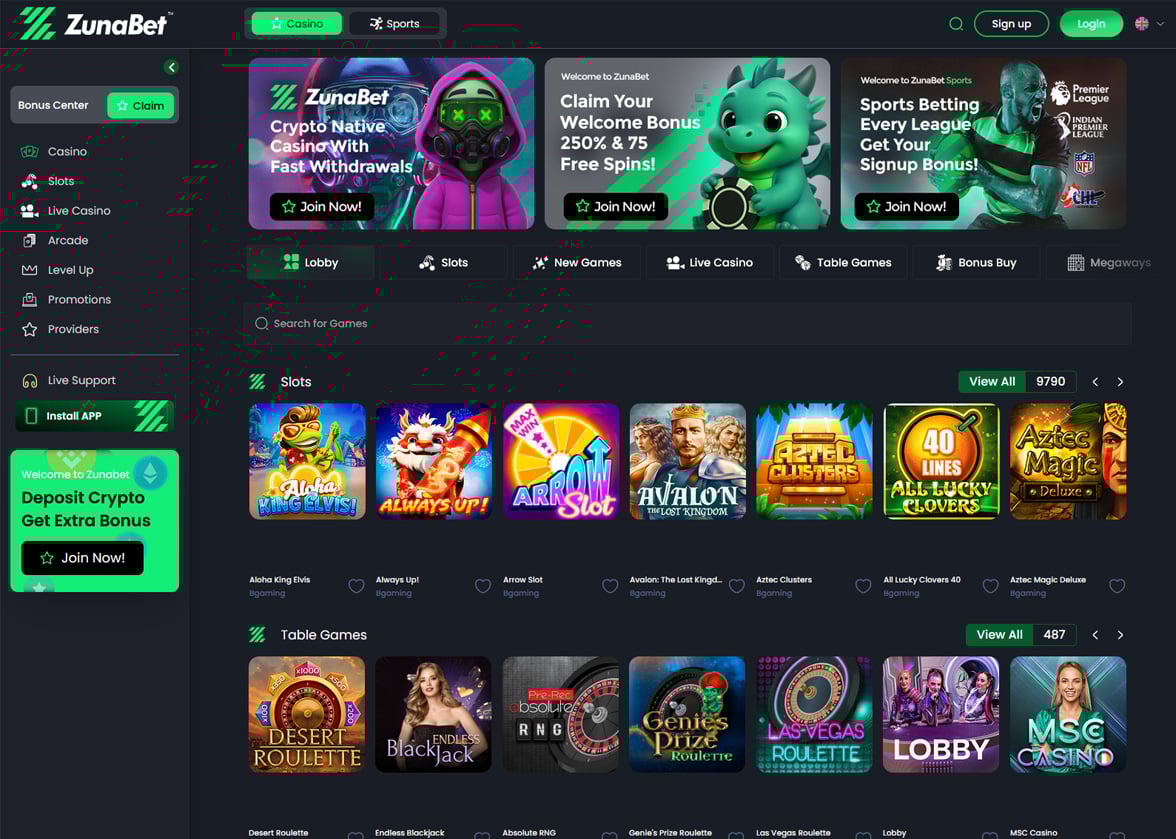
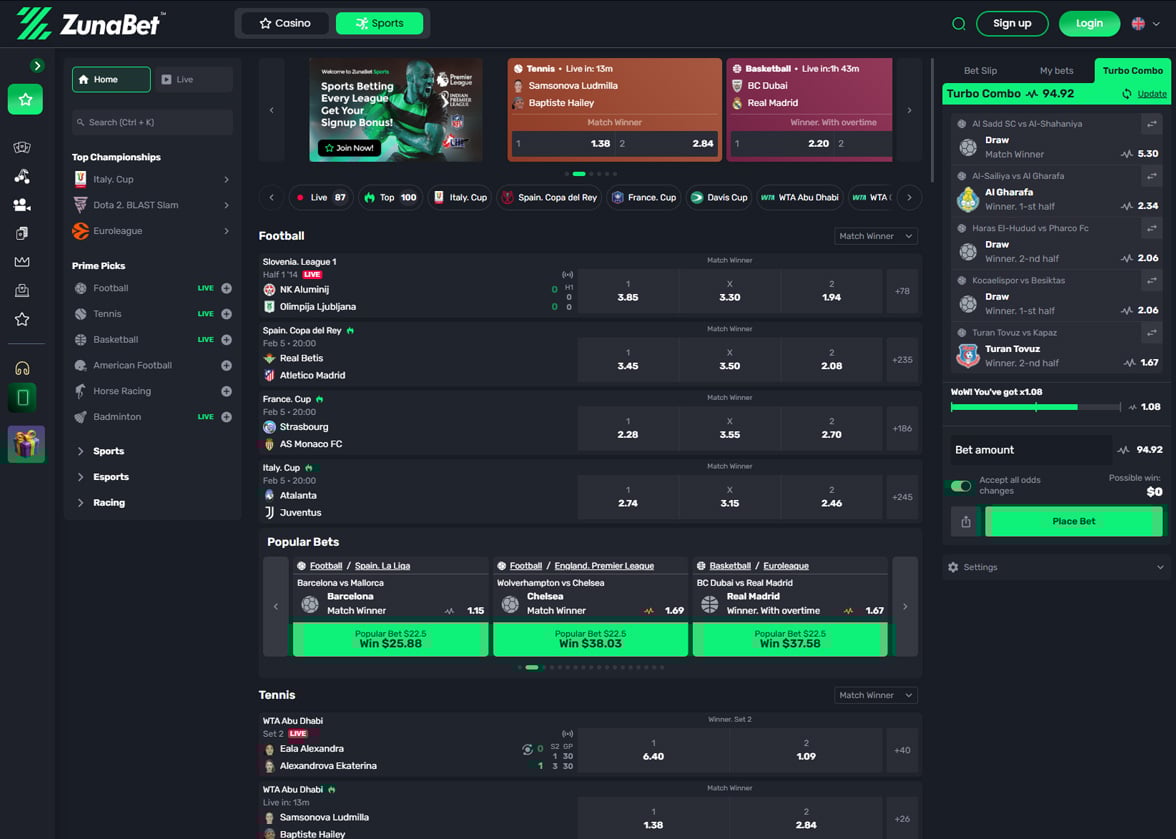
Sports betting runs parallel to the casino as an equal product rather than an add-on. Football, basketball, tennis, NHL, combat sports, and virtual sports are all covered comprehensively. The esports section stands apart from what most traditional operators provide, featuring dedicated markets for CS2, Dota 2, League of Legends, and Valorant with genuine depth rather than surface-level inclusion. Bet365 keeps a clear lead in live betting complexity, event streaming, and the breadth of niche sporting markets available. ZunaBet answers with a globally oriented sportsbook and an esports product built for the audience that is growing fastest.
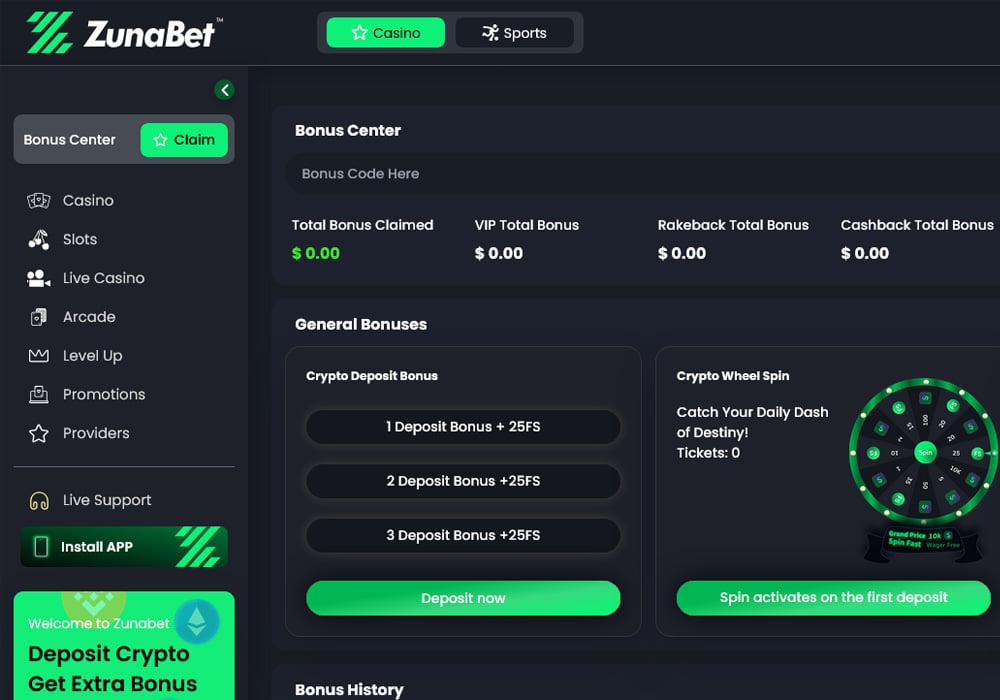
The entire financial layer runs on cryptocurrency. Over 20 coins are accepted — BTC, ETH, USDT on several blockchains, SOL, DOGE, ADA, XRP, and more. No transaction fees from the platform. Withdrawals that clear without banking intermediaries slowing the process. Every movement of money on ZunaBet happens on blockchain rails, which means no third-party timelines, no weekend blackouts, and no fees extracted between the player and their funds.
New players receive up to $5,000 in deposit matches plus 75 free spins across three deposits — 100% up to $2,000 with 25 spins first, 50% up to $1,500 with 25 spins second, and 100% up to $1,500 with 25 spins third. That welcome package carries substantially more value than what Bet365 extends in most markets.
The technical package wraps everything in a dark-themed HTML5 interface with responsive design, fast performance, native apps for iOS, Android, Windows, and MacOS, and round-the-clock live chat support.
The Loyalty Split
Bet365 rewards regular players on its own terms. Personalized bonuses and promotional offers arrive in active accounts based on criteria the platform sets internally. There are no published tiers, no branded progression system, and no public roadmap showing players what continued activity will earn them. The approach is quiet and closed, reflecting a philosophy that strong product quality should be sufficient to keep players engaged without layering a complex rewards structure on top.
ZunaBet built its loyalty program to be the opposite of quiet. The dragon evolution system puts progression front and center through a mascot called Zuno and six defined tiers — Squire, Warden, Champion, Divine, Knight, and Ultimate. Rakeback starts at 1% and increases to 20% at the top tier. Free spins climb to 1,000 at the highest levels. VIP club access and double wheel spins reward players as they advance through the stages.
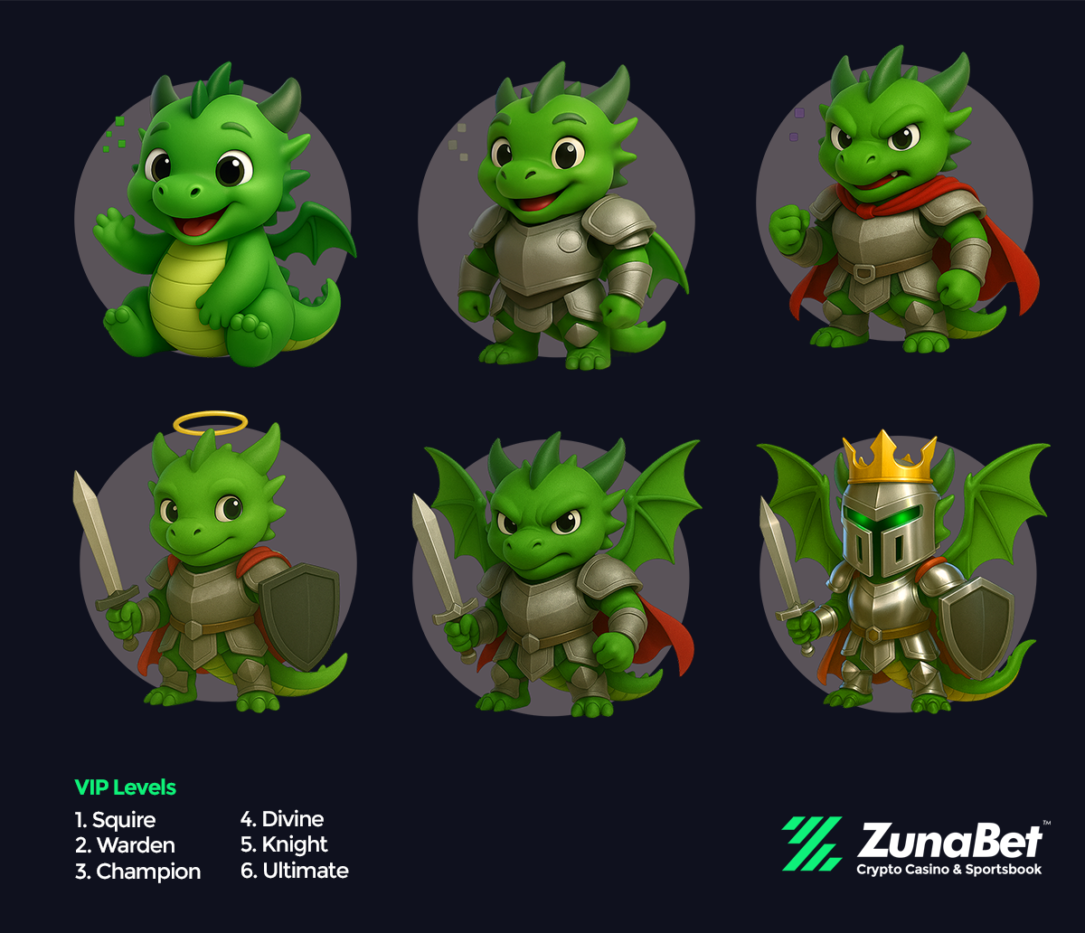
Everything about the system is designed for visibility and engagement. Players know exactly where they stand at all times. The next tier is always visible, its requirements are always clear, and the rewards for reaching it are always published. The gamified design draws from video game progression systems where advancement is part of the core experience rather than something that happens passively in the background. Bet365’s closed-door approach works for players who do not particularly care about loyalty mechanics and just want a good sportsbook. ZunaBet’s open-book approach works for players who want their time on a platform to feel like it is building toward something.
Two Financial Worlds
Bet365 processes payments at a scale that few companies in any industry can match. Its infrastructure connects to banking systems, card networks, and e-wallet providers across dozens of countries, handling millions of daily transactions with the reliability that its size demands. That achievement should not be minimized.
What cannot be engineered away, however, are the limitations that come with that infrastructure. Banks dictate processing windows. Card networks impose their own policies. E-wallets introduce additional intermediary steps. Public holidays and weekends create gaps. Fees attach at various points depending on the method and the jurisdiction. The player enters a system where speed, cost, and timing are controlled by institutions outside the platform.
ZunaBet removed those institutions from the equation. Crypto goes directly between the player’s wallet and the platform without passing through any intermediary. There is no processing window because there is no processor. There is no weekend delay because the blockchain does not observe weekends. There is no fee because no middleman exists to charge one. A player’s withdrawal follows the same path and the same timeline regardless of when it is initiated or how much it involves.
The practical impact of this difference grows every time a player experiences it. Speed becomes the expectation. Fee-free becomes the baseline. Consistency becomes the standard. Going back to a system where a withdrawal might arrive tomorrow or might arrive Thursday starts to feel like a step backward once the alternative is familiar. And the number of players for whom that alternative is familiar expands with every month that cryptocurrency adoption continues to grow.
Where Each Platform Sits in the Bigger Picture
Bet365 represents the summit of what online gambling built on traditional infrastructure can achieve. No operator has done it better, and the company’s position within that framework is as secure as any in the industry. For players who operate in fiat currency and prioritize sportsbook depth and live betting above all else, Bet365 is still the answer.
ZunaBet represents what happens when the framework itself changes. Different financial infrastructure. Different player expectations. Different ideas about what a loyalty program should feel like and how many games a platform should offer and how quickly money should move. It launched with over 11,000 games, 63 providers, more than 20 cryptocurrencies, zero fees, a $5,000 welcome package, dedicated apps everywhere, a complete sportsbook with real esports depth, and a loyalty system designed by people who understand gaming culture as well as they understand gambling operations.
The industry is splitting in two. One side runs on banks and cards and serves an audience that has been gambling online for years. The other runs on crypto and serves an audience that is arriving with new expectations and new habits. Bet365 owns the first side. ZunaBet was built to lead the second. Both platforms are good at what they do. But only one of them is aimed at the part of the market that is growing, and the numbers it launched with suggest it knows exactly how to capture that growth.
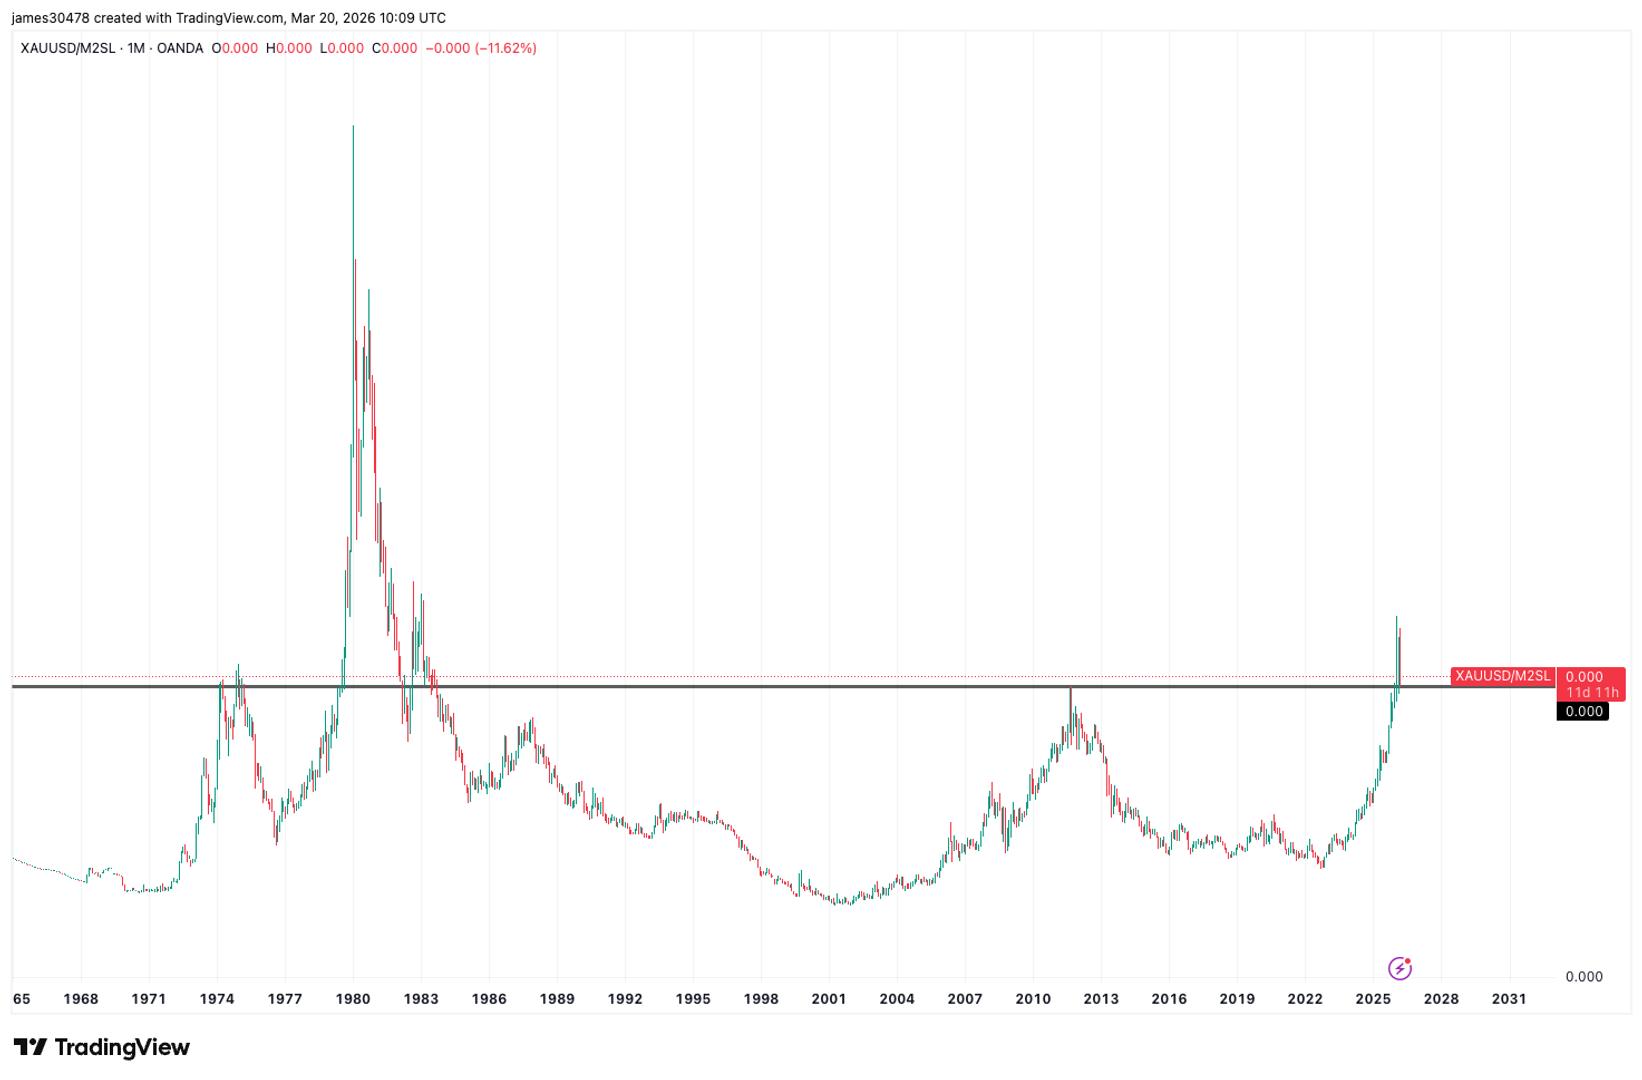

Gold is approaching a technical bear market, down nearly 20% from its January all time high. Traditionally viewed as a store of value and hedge against geopolitical uncertainty, gold’s recent performance challenges that narrative. Despite escalating tensions in the Middle East, prices have fallen around 10%, since the war started at the end of February.
Markets have also repriced the interest rate outlook, with cuts now largely pushed out and policy expected to remain restrictive through December 2026. At the same time, rising oil prices, driven by geopolitical risk, are adding upward pressure on inflation, reinforcing the higher for longer rate environment, a key headwind for gold.
While adjusting for M2 money supply, which includes cash, deposits, and other liquid forms of money, gold is trading near levels seen at major historical peaks in 1974 and 2011, when it was $200 and $1,800 per ounce, respectively. On this basis, gold appears to be consolidating at elevated levels, potentially forming a cyclical floor relative to global liquidity.
In contrast, bitcoin relative to M2 remains in a consolidation phase similar to 2024, while retesting its 2021 highs on a liquidity adjusted basis. Historically, each cycle has seen bitcoin move above prior peaks when adjusted for money supply. With bitcoin still about 40% below its October high, this may represent a typical consolidation range before further upside.
Gold has traded alongside bitcoin tick for tick since it broke down from $5,000 on Wednesday, showing elements of positive correlation after diverging from the crypto markets prior.
Crypto World
Bitcoin Dips Below $70,000 as Extreme Fear Index Hits 10: What Traders Are Watching Next
TLDR:
- Bitcoin fell over 3% in 24 hours, sliding from above $74,000 to around $68,700 on Sunday amid macro fears.
- The Crypto Fear and Greed Index dropped to an extreme fear reading of 10, reflecting sharp decline in market confidence.
- Trader Lennaert Snyder targets a Bitcoin drop to $65,580, planning to add shorts after a confirmed bearish structure break.
- Institutional buyers continue accumulating BTC as exchange supply hits multi-year lows, contrasting with heavy retail panic selling.
Bitcoin fell sharply on Sunday, dropping from above $74,000 to around $68,700 in a matter of hours. The move pushed the Crypto Fear & Greed Index to an extreme fear reading of just 10.
Rising oil prices, a pause in Federal Reserve rate cuts, and ongoing geopolitical tensions drove the sell-off. Bitcoin recorded a 3.11% decline over 24 hours, with trading volume reaching approximately $29.1 billion.
Short Positions Build as Bears Set Their Sights on $65,000
The latest price drop has given bearish traders confidence to hold and grow their short positions. Selling pressure remained active throughout the week, contributing to a total seven-day decline of 4.02%.
This combination of macro pressure and bearish momentum pushed market fear to its most extreme reading in recent weeks.
Crypto trader Lennaert Snyder shared his bearish stance openly on social media during Sunday’s session. “My target is still the ~$65,580 low, and possibly even lower for Bitcoin,” Snyder wrote. He also planned to add margin to his shorts using the upper wick of the next weekly candle.
Snyder noted caution around a key level at $72,700, identifying it as a Fair Value Gap zone. He stated he would only enter a trade after seeing a liquidity push and a bearish market structure break.
His approach pointed to a disciplined strategy, waiting for price confirmation before committing to new short trades.
A notable counterrisk, however, remains for those currently holding short positions. Whale Insider reported that $5 billion in crypto shorts would face forced liquidation if Bitcoin climbs back to $75,000. That level therefore becomes both a target for bulls and a danger zone for active short sellers in the market.
Institutional Buyers Accumulate as Exchange Supply Drops to Multi-Year Lows
Even as retail sentiment fell to extreme fear, institutional buyers continued accumulating Bitcoin through the downturn.
This divergence between retail and large-scale buyers has been a repeated pattern during past crypto market corrections. Institutions appear to view the current dip as an entry point rather than a reason to sell.
Exchange supply has also dropped to multi-year lows, further shaping the current market picture. Lower exchange balances typically point to Bitcoin being moved into cold storage for long-term holding.
This movement often tightens available sell-side supply on exchanges, setting the stage for potential price rebounds.
Market watchers are now turning their attention to Monday’s session, closely eyeing the $72,000 price level. A recovery above that zone could signal a momentum shift and place short positions at increased risk. Bulls will need consistent buying volume to challenge the bearish tone that dominated the weekend.
Bitcoin’s near-term path will largely depend on how macro factors unfold over the coming days. Bears are holding firm to the $65,580 target, while bulls look for a sustained break above $72,000.
The market remains at a crossroads, with either outcome carrying major consequences for active traders on both sides.

Do drivers with high blood pressure have to inform DVLA?

Cuba begins recovery efforts after second grid collapse in a week
CoinDCX Founders Arrested in Fraud Case; Company Blames Impersonators


-

 Tech7 days ago
Your Legally Registered ‘Motorcycle’ Might Not Count Under Proposed US Law
-

 Fashion2 days ago
Weekend Open Thread: Adidas – Corporette.com
-

 Politics2 days ago
Jenni Murray, Long-Serving Woman’s Hour Presenter, Dies Aged 75
-
 Tech5 days ago
Are Split Spacebars the Next Big Gaming Keyboard Trend?
-

 Crypto World17 hours ago
Best Crypto to Buy Now: Strategy Just Spent $1.57 Billion on Bitcoin During Fear While Early Investors Quietly Enter Pepeto for 150x Potential
-

 News Videos4 days ago
RBA board divided on rate cut, unusually buoyant share market | Finance Report | ABC NEWS
-

 Crypto World18 hours ago
Bitcoin Price News: Bhutan Sells $72 Million in BTC Under Fiscal Pressure, but the Smart Money Entering Pepeto Sees What the Market Does Not
-

 Business7 days ago
Search for Savannah Guthrie’s Mother Enters Seventh Week with No Arrests
-
 Crypto World2 days ago
NIO (NIO) Stock Plunges 6.5% as Shelf Registration Sparks Dilution Worries
-

 Business6 days ago
Australian shares drop as Iran war enters third week
-

 Crypto World6 days ago
Crypto Lender BlockFills Enters Chapter 11 with Up to $500M in Liabilities
-

 Politics4 days ago
The House | The new register to protect children from their abusers shows Parliament at its best
-

 Fashion6 days ago
25 Celebrities with Curly Hair That Are Naturally Beautiful
-

 Tech2 days ago
inKONBINI Lets You Spend Summer Days Behind the Register
-

 Crypto World4 days ago
Canada’s FINTRAC revokes registrations of 23 crypto MSBs in AML crackdown
-
 Politics5 days ago
Real-time pollution monitoring calls after boy nearly dies
-
 NewsBeat4 days ago
Residents in North Lanarkshire reminded to register to vote in Scottish Parliament Election
-

 Business6 days ago
Meta planning major layoffs as AI spending and automation reshape workforce
-

 News Videos4 days ago
PARLIAMENT OF MALAWI – PAC MEETING WITH REGISTRAR OF FINANCIAL ON AMARYLLIS HOTEL – INQUIRY LIVE
-
Crypto World7 days ago
U.S. Oil Companies Post Record Profits as Oil Prices Break $100
You must be logged in to post a comment Login