

Crypto World
The AI Chip Sector Is Soaring Without Nvidia, and the Money Flow Explains Why
Nvidia (NVDA) stock is up just 15% in 2026 while the rest of the chip sector races ahead, and one flow signal helps explain why the market’s former leader is being left behind.
The split from the sector is the surface story. Beneath it, options bets, perpetual traders, and institutional flows are pulling in different directions, and only one of them resolves the puzzle.
The Chip Rally Is Leaving Nvidia Stock Behind
Nvidia and the Semiconductor Index have moved in opposite directions on about half of all trading sessions over the past 50 days, near the highest rate since the 2022 bull market began. That frequency has more than quadrupled since the start of April.
Want more insights like this? Sign up for Editor Harsh Notariya’s Daily Newsletter here.
The performance gap is just as wide. The Nvidia stock price is up roughly 15% on the year, while Broadcom (AVGO) has gained about 20% and AMD has climbed far higher.
Through 2024 and 2025, Nvidia drove the sector and outran its peers. The rally has since broadened to include chips other than Nvidia’s, leaving one question open. If the sector is soaring without it, where is the money that used to favor Nvidia going?
Bearish Options Bets on Nvidia Stock Are Building
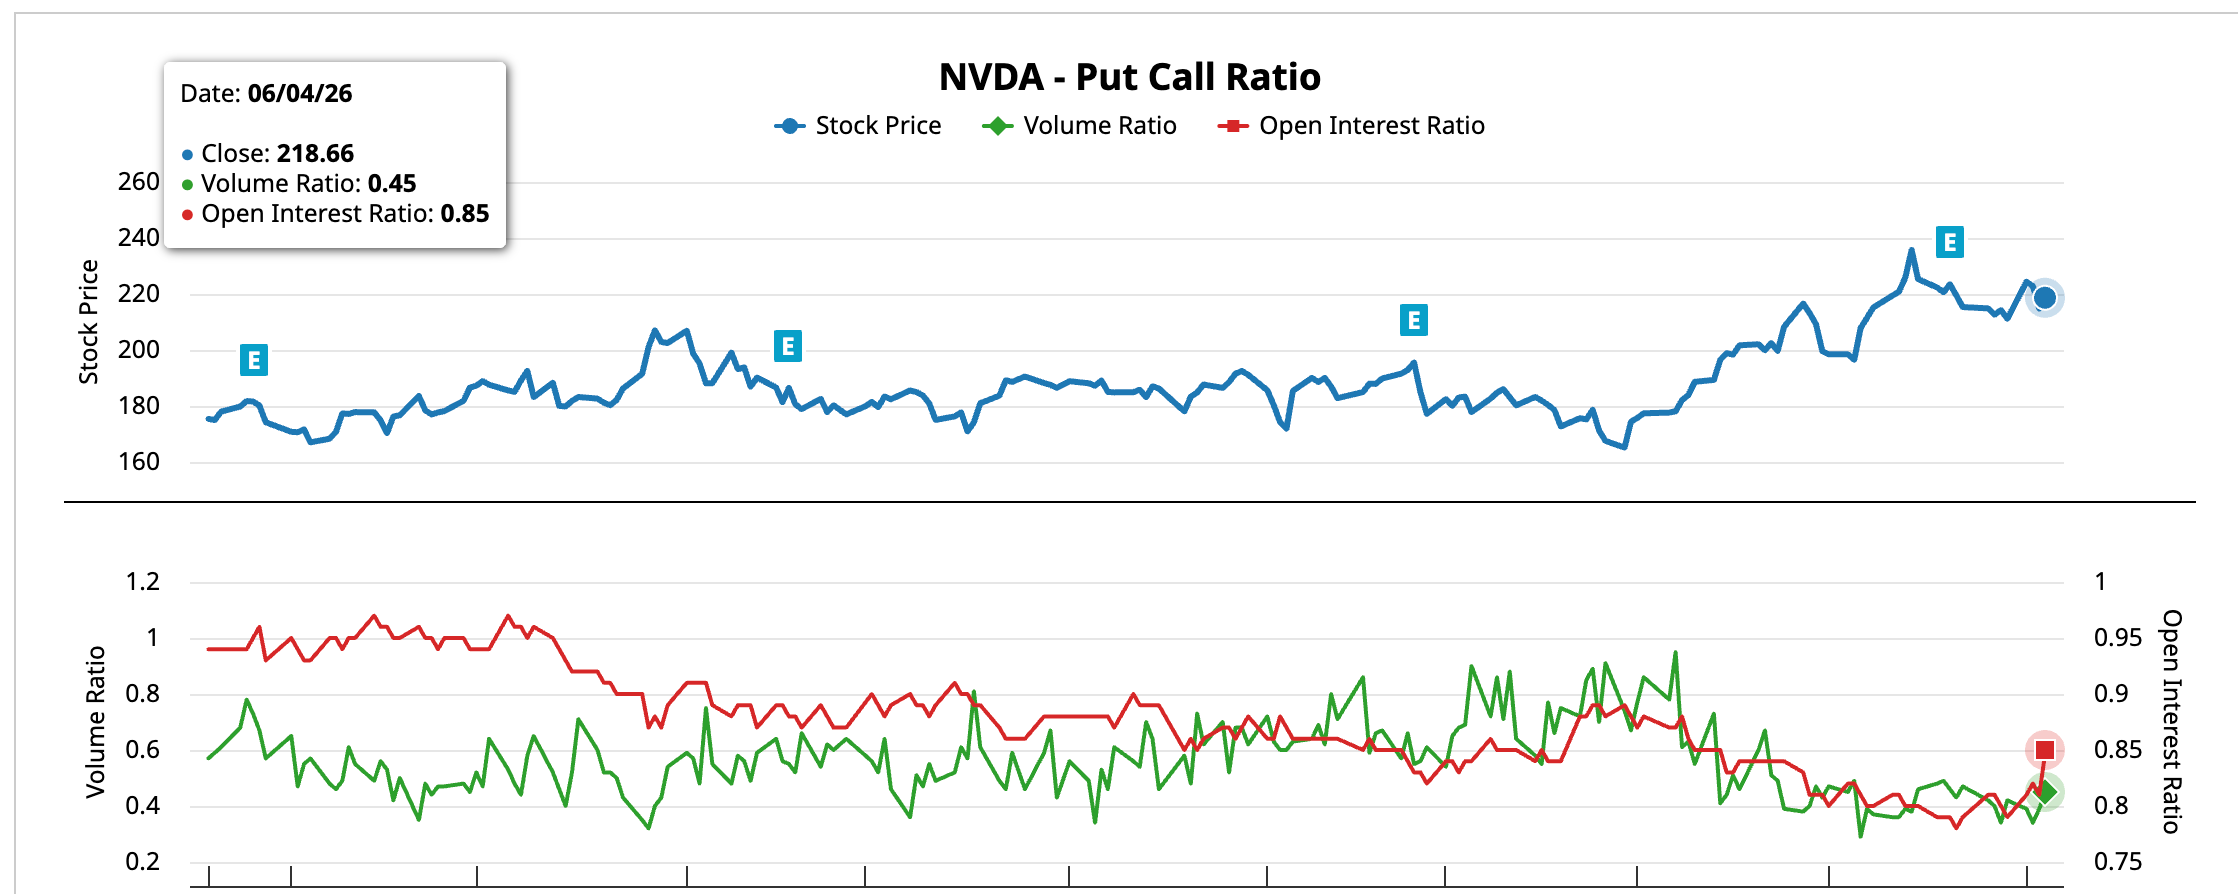
The first place to look is the options market. The put-call ratio for Nvidia, which weights bearish put contracts against bullish call contracts, has tilted toward puts since the company’s last earnings report.
On earnings day, the volume ratio sat near 0.46 and the open interest ratio near 0.79. Those readings have since moved to about 0.45 and 0.85, with the open interest ratio climbing toward puts.

A higher open interest ratio means traders are adding downside bets or protection. The shift is small, yet it matches the performance lag and hints that conviction in Nvidia shares is fading.
Options point one way, but they are a single venue. Another market is betting the opposite, which deepens the puzzle rather than solving it.
On Hyperliquid, Traders Still Favor Nvidia Stock
On the perpetual futures platform Hyperliquid, the tokenized NVDA contract shows traders leaning long. The smart money and public-figure groups both hold net long positions, while the larger whale group sits net short, but only slightly.

That stance stands out against AMD and Broadcom on the same platform, where positioning skews more heavily short, at least across two cohorts, as opposed to NVDA’s whale-only cohort.

Even as it splits from the sector, Nvidia remains a favorite here.

Volatility helps explain the pull. Nvidia carries the highest 30-day annualized volatility among the megacap names at about 33%, second only to Tesla and well above the broad market.
Bigger swings attract traders who want to trade on movement, a common tendency on platforms like Hyperliquid.

Broadcom’s earnings on June 3 also kept the sector’s attention on Nvidia’s rivals. So the venues disagree. Options lean bearish, perpetual traders lean long, and neither settles the question on its own. One last signal breaks the tie.
The One Signal: Institutional Money Is Exiting
That signal is the Chaikin Money Flow (CMF), an indicator that tracks institutional money flow into or out of a stock. Nvidia’s CMF has dropped back below zero.
A reading under zero points to net selling from institutions, the largest and slowest-moving money in the market. This is what the headline numbers hide. Over the past five days, Nvidia’s stock is up about 2%, yet the flow has turned negative beneath that flat price.

AMD’s CMF, on the other hand, is aggressively positive at press time.

The divergence ties the whole picture together. Institutions stepping back explains the lagging year-to-date return and the rising put interest, while the Hyperliquid longs look like shorter-term traders chasing volatility rather than a lasting bid.
The CMF is now testing a rising trendline drawn from early January. A break below it would deepen the outflow and confirm the sector has moved on without its leader.
A recovery back above the line and fresh inflows would show the selling was only a pause. For now, institutional flow is the signal explaining why the chip rally is soaring even as Nvidia stock lags.
The post The AI Chip Sector Is Soaring Without Nvidia, and the Money Flow Explains Why appeared first on BeInCrypto.


TLDR:
- The U.S. added 172,000 jobs in May, nearly doubling forecasts and pushing rate hike odds to 57% in one day.
- Broadcom’s refusal to raise AI targets triggered a 12.6% stock drop, sparking fears of overvalued AI positions.
- SemiAnalysis reported Nvidia’s new chips need half the expected memory, sending SK Hynix and Samsung shares sharply lower.
- SpaceX, Anthropic, and OpenAI listings worth $4–$5 trillion are forcing fund managers to sell holdings to raise cash.
Global financial markets suffered a broad and sharp decline on Friday, erasing approximately $2.5 trillion in a single trading session.
The S&P 500 dropped 1.65%, while the Nasdaq fell 2.60%. Gold, silver, and Bitcoin also recorded steep losses. A combination of stronger-than-expected jobs data, cracks in the artificial intelligence trade, and looming liquidity concerns drove the widespread sell-off across asset classes.
Hot Jobs Report Rattles Rate Cut Expectations
The U.S. economy added 172,000 jobs in May, nearly double Wall Street’s forecast of 88,000. That surprise reading sent shockwaves through markets almost immediately after the open.
With inflation running at 3.8% and oil prices at $90 per barrel, the strong labor data changed the rate outlook sharply.
The probability of a Federal Reserve rate hike this year jumped from 40% to 57% in one session. Higher rates reduce the present value of future earnings, making growth and tech stocks less attractive. Investors responded by rotating out of those positions quickly.
As noted by market analyst account Bull Theory on X, “A labor market this strong tells the Fed it cannot cut interest rates and may actually need to raise them.” That shift in sentiment accelerated selling pressure across equity markets.
Adding to the uncertainty, new Fed Chair Kevin Warsh holds his first policy meeting in 11 days. Appointed under expectations of rate cuts, he now faces hot inflation, elevated oil, and a tight labor market. That uncertainty alone pushed many fund managers toward reducing risk.
AI Trade Cracks Under Pressure From Multiple Fronts
Broadcom reported record quarterly earnings, with revenue up 48% and AI chip sales climbing 143%. Yet the stock fell 12.6% after the company declined to raise its AI revenue targets. That single decision prompted investors to question whether AI valuations had grown too stretched.
Research firm SemiAnalysis then reported that Nvidia’s next-generation AI chips would require roughly half the memory previously priced into analyst models. SK Hynix fell nearly 10% on the news, while Samsung dropped over 6%. South Korea’s broader market declined 5.5% in a single session.
Anthropic also released a report warning that AI systems are approaching the ability to improve themselves without human input. The firm called for a global pause in AI development.
Coming alongside the chip memory news and Broadcom’s miss, it deepened fears about whether business models can sustain the current pace of AI growth.
Meanwhile, a liquidity drain looms over markets. SpaceX is set to go public next week at a $1.75 trillion valuation. Anthropic and OpenAI are also preparing listings.
Together, these three companies represent $4 to $5 trillion in potential capital demand. Fund managers are selling existing holdings to raise cash, adding further pressure to an already stressed market.

Key takeaways:
- Over-leveraged Bitcoin short positions between $63,000 and $66,000 have created a potential $2.6 billion squeeze trap for bears.
- Negative perpetual funding rates indicate that bulls have fully deleveraged, significantly reducing downside risk.
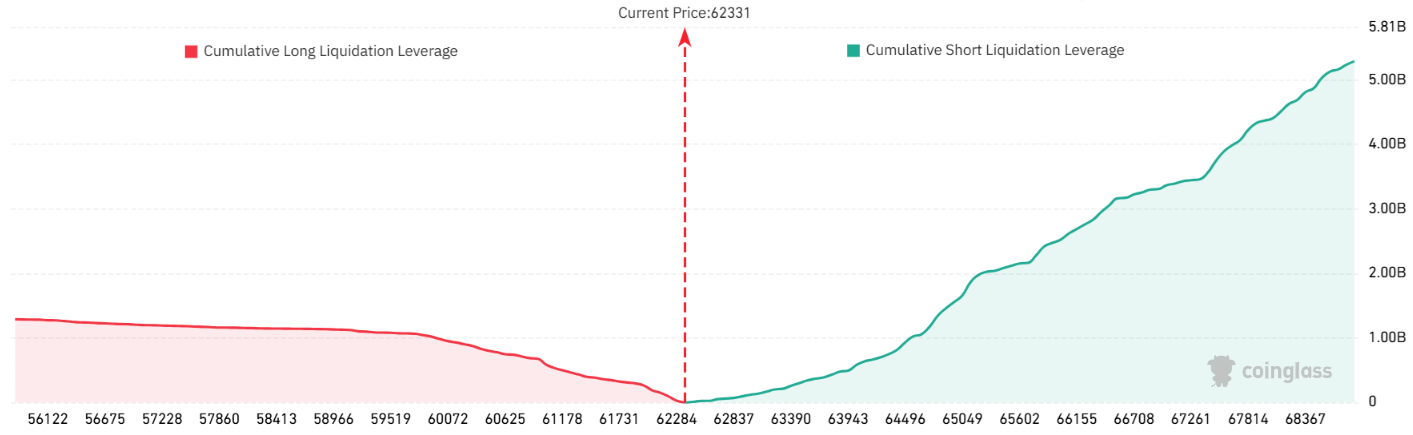
The Bitcoin (BTC) crash to $61,100 on Friday wiped out $335 million in leveraged long positions. However, after a 21% decline in Bitcoin’s price, bulls might have set a perfect trap as negative market sentiment intensified. Bearish positions built up heavily between $63,000 and $66,000, setting the stage for a potential $2.6 billion short squeeze.
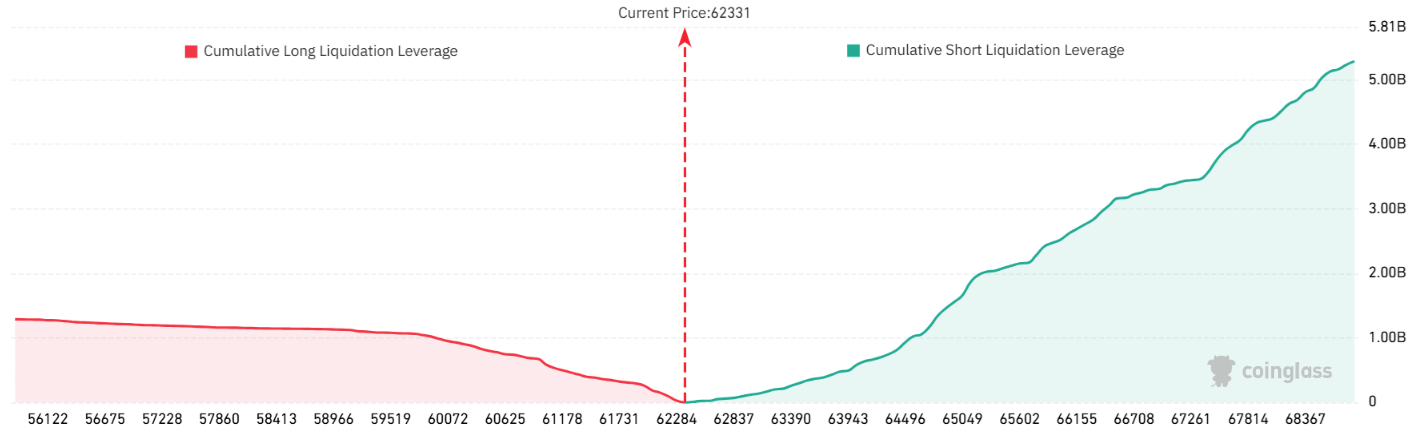
Estimated cumulative Bitcoin liquidation at major exchanges, USD. Source: CoinGlass
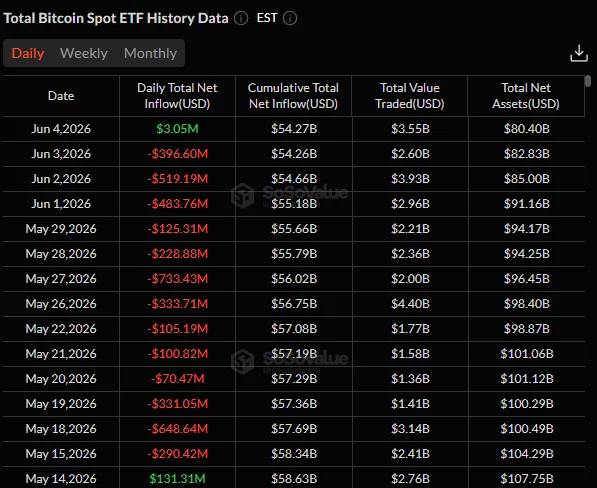
Estimated liquidations for a further 8% drop in Bitcoin to $57,000 from $62,000 stand at $1.2 billion. In contrast, a rally to $66,000 would put $2.6 billion of short positions at risk. This potential squeeze might provide enough fuel to revive buyer confidence following a record-breaking 13-day streak of net outflows from spot Bitcoin exchange-traded funds (ETFs).
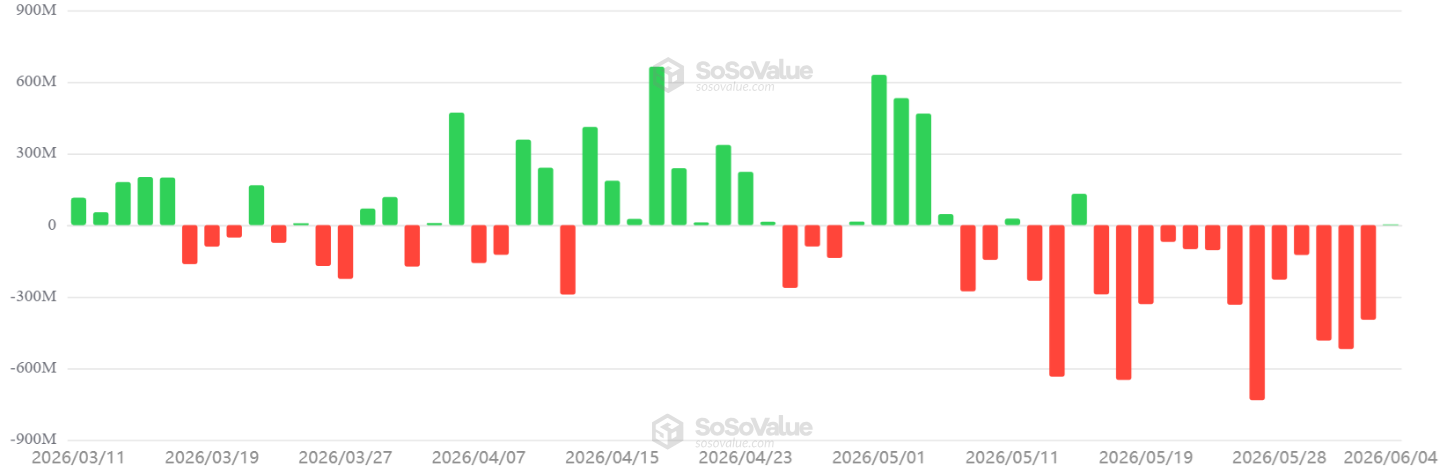
US-listed spot Bitcoin ETFs daily net flows, USD. Source: SoSoValue
The minor $3 million net inflow on Thursday could represent a temporary breathing room after 15 days of selling that drained $5.1 billion. It remains too early to conclude that momentum has officially flipped in favor of the bulls. Ultimately, if bears kept their leverage low and played conservatively, the actual threat of a massive short squeeze might be minimal.
Bitcoin perpetual futures annualized funding rate. Source: Laevitas
A neutral funding rate typically ranges between 6% and 12%, with longs paying to keep their positions open. The current negative 2% Bitcoin perpetual futures funding rate suggests growing confidence among bears. Thus, even if it takes time for Bitcoin to reclaim the $66,000 level, bulls have fully deleveraged, reducing downside risk.
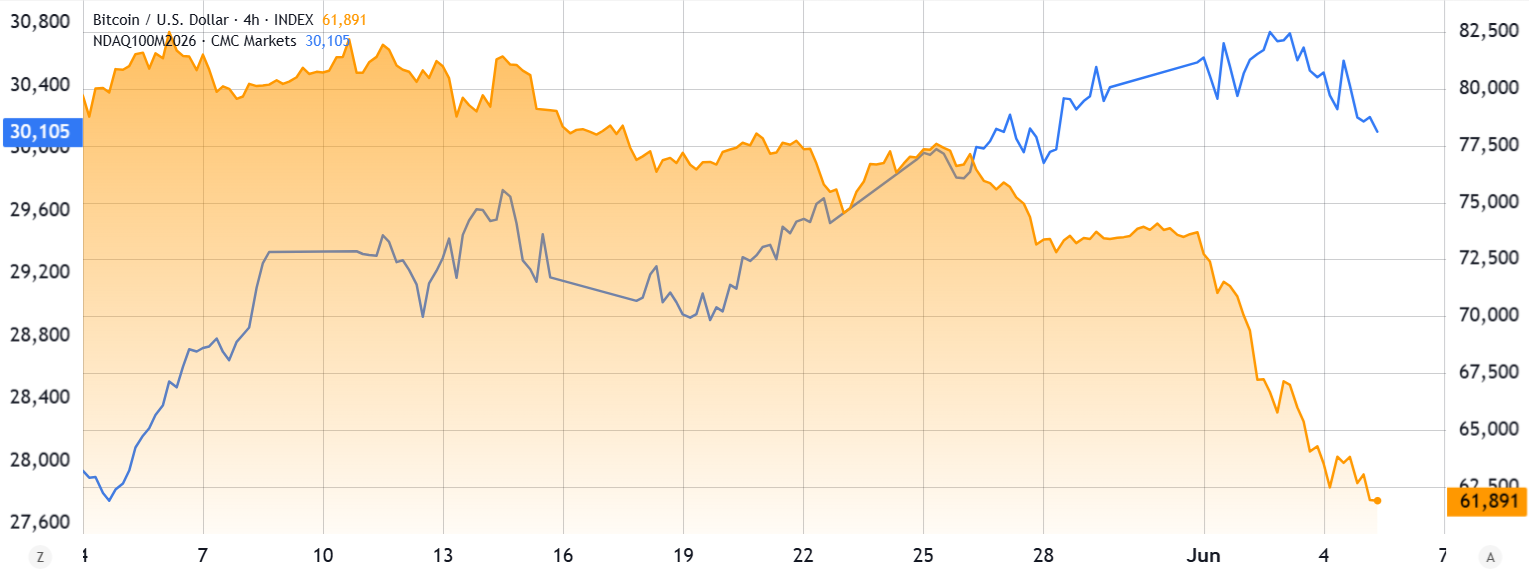
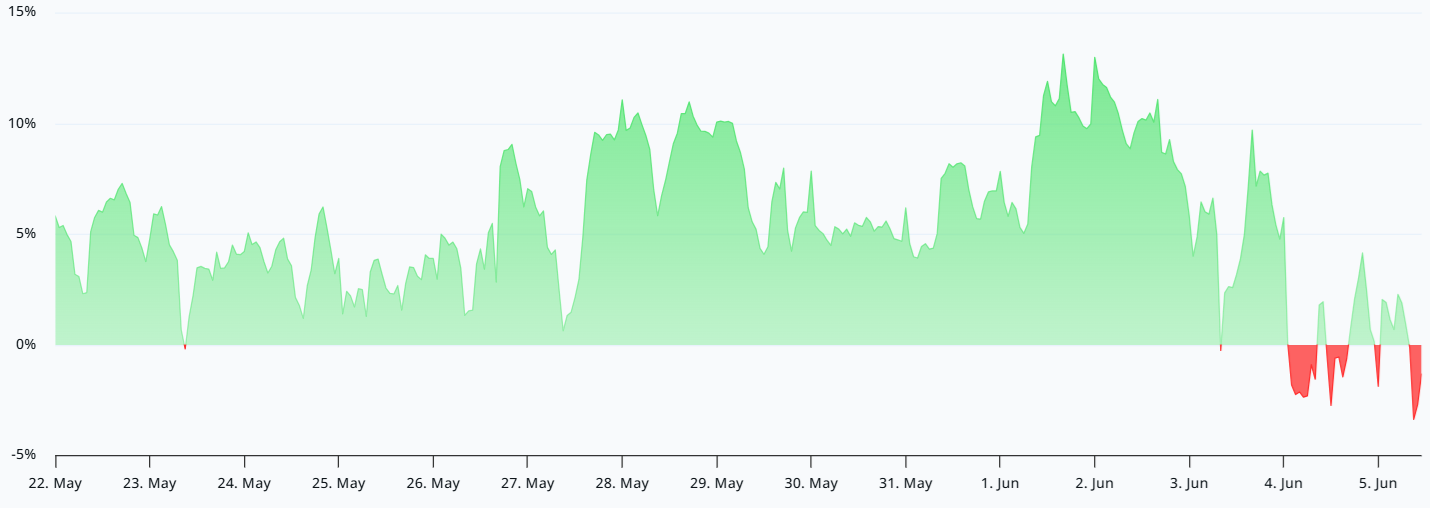
Nasdaq 100 futures (left) vs. Bitcoin/USD (right). Source: TradingView
Bitcoin has severely underperformed the Nasdaq 100 index, but the tech sector is beginning to display weakness after Broadcom (AVGO US) closed down 12.6% Thursday, erasing $280 billion in market value. The company trimmed its AI chip sales forecast for the second half of 2026, putting investors on alert.
Impact of the tech sector IPOs and Strategy’s 32 BTC sale
Other prominent names in the AI sector also felt the impact. Micron (MU US) traded down 7.8% while Arm (ARM US) dropped 4.5%. With highly anticipated IPOs from SpaceX, Anthropic, and OpenAI in sight, investors likely opted to raise cash ahead of those offerings. Analysts claim this liquidity drain also contributed to Bitcoin’s recent weakness.
Related: Strategy’s leveraged Bitcoin model has faced its first stress test–Grayscale
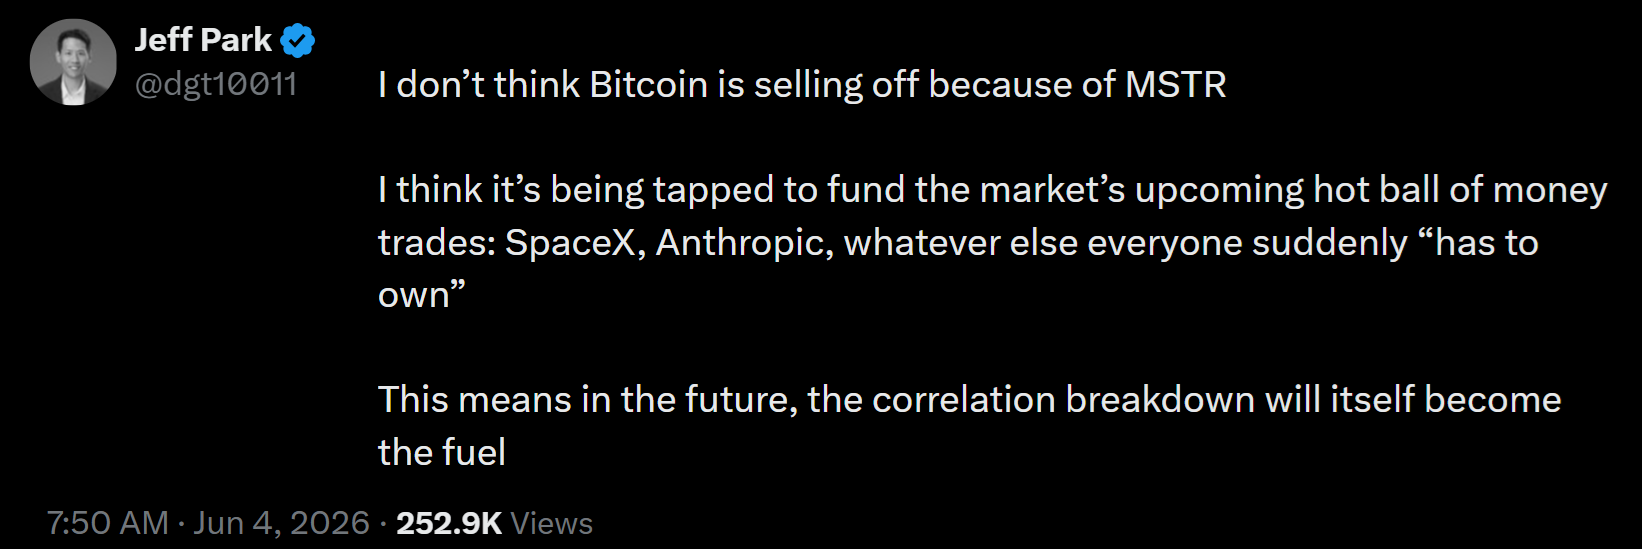
Source: X/dgt10011
Jeff Park, partner at ParaFi Capital and Bitwise advisor, argues that the AI sector is draining money from other investments as the market becomes a “hot ball of money” that everyone suddenly “has to own”. However, Park reminds that once this period of AI mania blows off, capital will eventually rotate back to Bitcoin as its discounted valuation works in its favor.
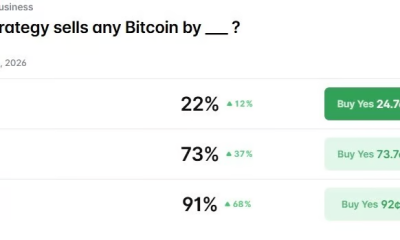
Regardless of whether Bitcoin’s weakness stems from AI sector hype, excessive confidence from bears poses a major risk once spot Bitcoin ETF inflows pick up or the fear surrounding a recent 32 BTC sale from Strategy (MSTR US) dissipates. A rally back to $66,000 might seem unlikely at first glance, but a sudden short squeeze could quickly shift momentum in favor of the bulls.

For 13 uninterrupted trading days, not a single dollar of net new money moved into spot bitcoin (BTC) exchange-traded funds (ETFs).
Indeed, they bled money each and every session from May 15 through June 3, marking the longest uninterrupted run of outflows since their launch in January 2024.
Total cumulative outflows were 59,351 BTC, exceeding $4.3 billion worth of selling.
The streak finally broke yesterday with a meager $3.2 million inflow.
Unfortunately, the damage was already done. BTC crashed to under $60,000 just a day later.
At time of writing, BTC is down 17% over the past week and is trading at its lowest level since October 2024.
A week of unwanted records for BTC ETFs
The multi-billion dollar, nearly three-week outflow streak blew past every prior record in the short history of the ETFs.
Most of the outflows withdrew from BlackRock’s iShares Bitcoin Trust (IBIT), the biggest of the funds. Its worst day brought about $528 million in withdrawals, IBIT’s second-largest single-day outflow ever, just shy of its January 2025 record.
Of course, none of those sell and redemption orders came from BlackRock itself.
ETF outflows originate with customer orders across hundreds of independent brokerages. The sponsors such as Blackrock, Fidelity, Morgan Stanley, or Franklin Templeton merely operate the fund, they don’t manage its assets with any discretion.
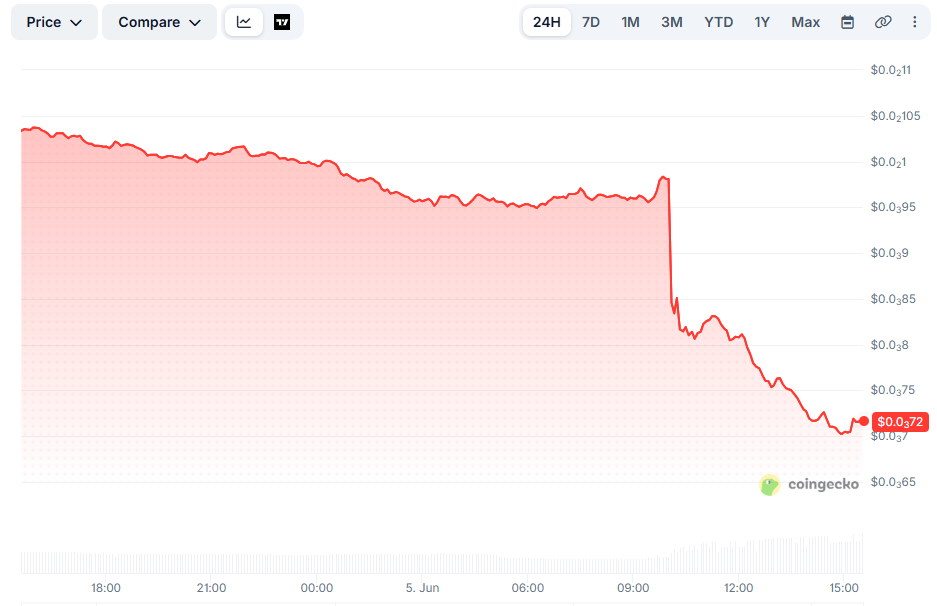
Read more: Bitcoin dropped to $0.019 on Revolut today
The uninterrupted 13 days were the tail end of a decline that had been accumulating for weeks. All of it led up to today’s crash to under $60,000 per BTC.
The month of May closed as spot BTC ETFs’ worst month all year. Net outflows last month hit $2.4 billion, the largest monthly exit since November 2025. Only six of May’s 20 trading days attracted any net inflow.
Bloomberg ETF analyst Eric Balchunas admitted, “this is the bad times.”
Got a tip? Send us an email securely via Protos Leaks. For more informed news and investigations, follow us on X, Bluesky, and Google News, or subscribe to our YouTube channel.
Some digital asset industry advocates are pushing back against a provision in a $56 billion state budget passed by the Illinois General Assembly on Monday, due to its impact on crypto users.
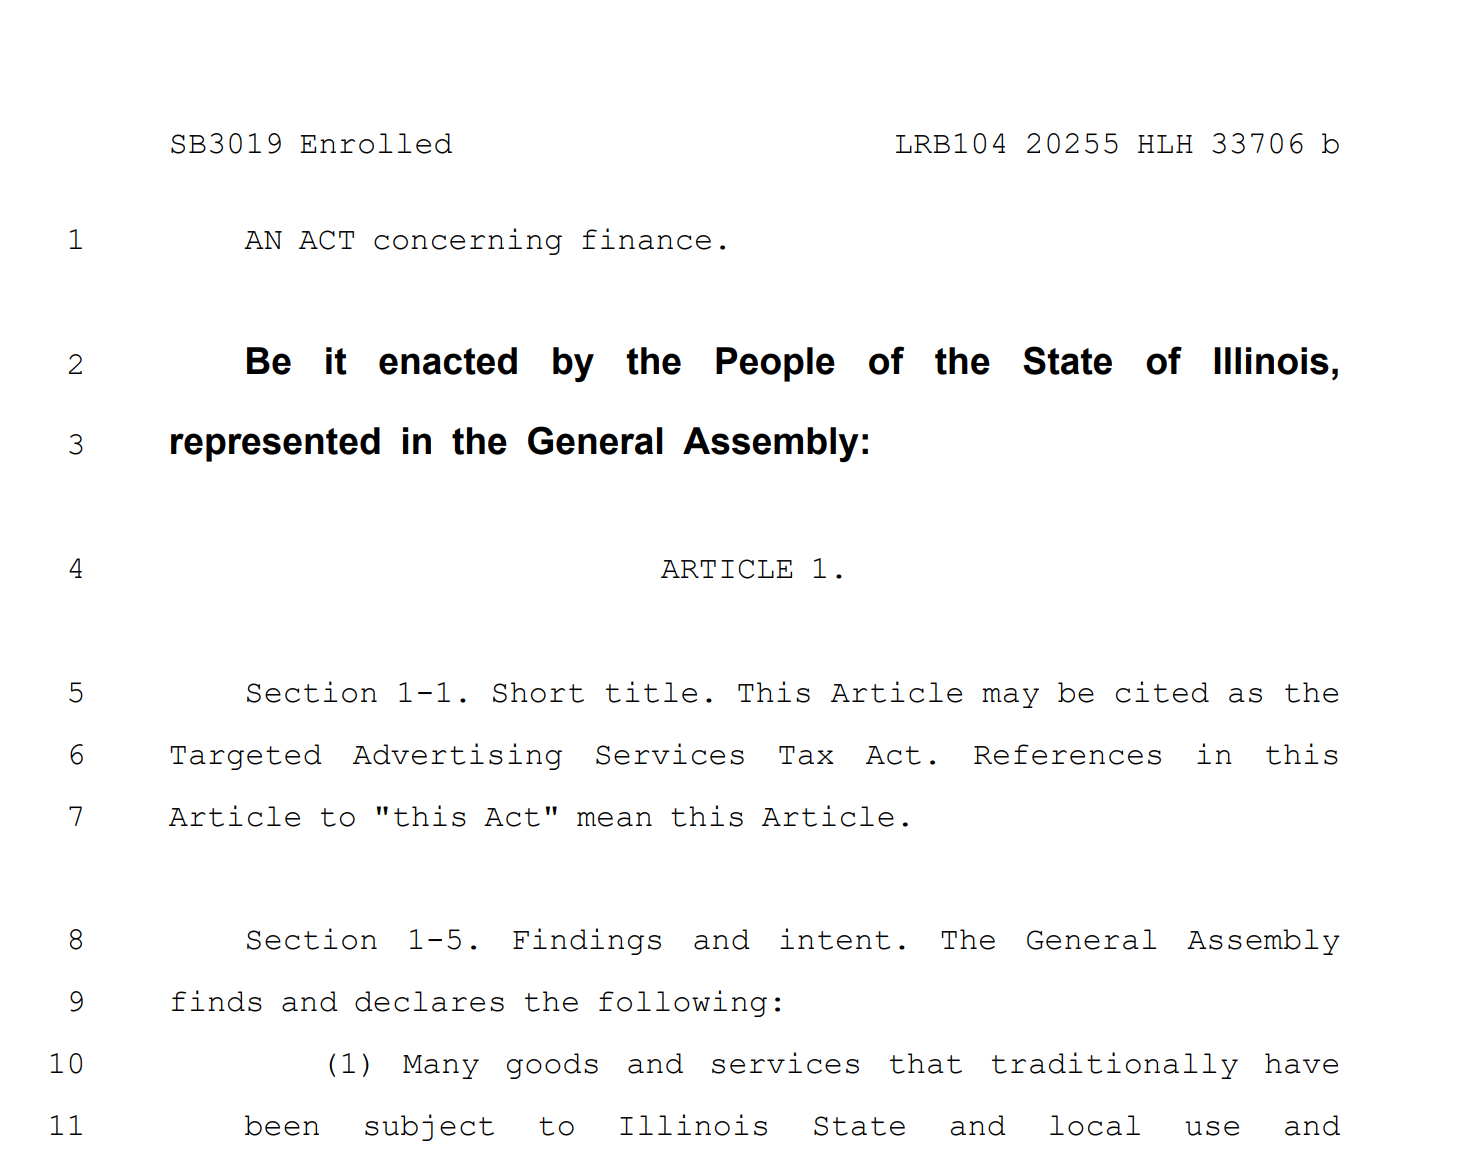
In a Senate bill included as part of the Illinois state budget for the fiscal year 2027, lawmakers proposed a 0.2% tax on crypto transactions, to be imposed by the “digital asset broker making or effectuating the sale of the digital asset business activity.” The 1624-page bill, part of the revenue and tax package to fund the state’s 2027 budget, passed along party lines early on Monday.

Senate Bill 3019. Source: Illinois General Assembly
The measure, described as a “privilege tax” within the Digital Asset Privilege Tax Act amendment to the bill, included registration requirements for any entity operating as a digital asset broker in Illinois. Brokers who failed to follow the guidelines from Jan. 1 could be found guilty of a Class 3 felony in the state and subject to a prison sentence of two to five years and fines up to $25,000.
Passed by the state general assembly on Monday, the budget bill still needs Governor JB Pritzker’s signature before becoming law. Pritzker made several public statements signaling that he plans to sign the bill soon, but had not done so as of Friday morning. Lawmakers expect the crypto tax to generate $60 million for the state.
Related: Crypto industry ties were a liability in Illinois primary
This crypto tax measure has prompted accusations from industry advocates of “burying” the rule within a massive budget proposal. The Digital Chamber and Illinois Blockchain Association penned a letter on Wednesday urging the state to reject the Digital Asset Privilege Tax Act, claiming that it would be “economically destructive” and gave the industry no notice of its intentions.
“No other state has imposed a similar tax, and the lack of stakeholder engagement surrounding this proposal raises significant concerns,” said The Digital Chamber in a Thursday X post.

Source: The Digital Chamber
Illinois governor goes after insider trading on prediction markets
The crypto tax proposal in Illinois’ budget followed Pritzker’s signing of an executive order banning state employees from betting on prediction market event contracts with companies such as Kalshi and Polymarket. The EO, signed on April 21, came in response to concerns elected officials could use the platforms “for personal enrichment and advantage based on access to nonpublic information.”
Magazine: Bitcoin miners are pivoting to AI, so why is the hashrate near ATHs?
Bitcoin price has fallen below $60,000 after a stronger-than-expected U.S. jobs report prompted traders to scale back expectations for Federal Reserve rate cuts and price in a higher probability of policy tightening later this year.
Summary
- Bitcoin fell below $60,000 after a stronger-than-expected U.S. jobs report reduced expectations for Fed rate cuts and increased odds of rate hikes later this year.
- More than $1.7 billion in crypto positions were liquidated as leveraged traders rushed to exit after BTC lost a key support level.
- Despite the selloff, spot Bitcoin ETFs recorded net inflows for the first time in 13 trading days, while on-chain data suggests capitulation among short-term holders may be reaching extremes.
According to data from crypto.news, Bitcoin (BTC) price fell to an intraday low of around $59,100 on June 5 before stabilizing near $59,400 at press time. The move extended a 10-day decline of roughly $19,000 from recent highs and pushed the cryptocurrency below the closely watched $60,000 support area for the first time since 2024.
Fresh labor market data triggered the latest wave of selling. The U.S. economy added 172,000 nonfarm payrolls in May, far above expectations of 85,000, while the unemployment rate held steady at 4.3%. Revised data also added 93,000 jobs to the previous two months, reinforcing the view that labor conditions remain resilient despite slowing growth elsewhere.
BNP Paribas added to the hawkish narrative this week after abandoning its expectation for stable monetary policy and forecasting three Federal Reserve rate hikes beginning in December. The bank cited persistent inflation risks, firm employment conditions, and the potential impact of the ongoing U.S.-Iran conflict on energy prices.
Following the jobs report, Polymarket assigned a 52% probability to a Fed rate increase before year-end, while CME FedWatch showed a 42.7% chance that rates will be higher by December.
Derivatives markets amplified the selloff as leveraged positions unraveled. CoinGlass data showed that more than $155 million in crypto long positions were liquidated within a single hour, while total liquidations topped $1.7 billion over the past 24 hours. Forced selling accelerated after Bitcoin lost the $60,000 level, triggering liquidation engines across major exchanges.
Institutional flows offered one of the few signs of stabilization. U.S. spot Bitcoin ETFs recorded roughly $3 million in net inflows on June 4, ending a 13-day streak of withdrawals that had drained $4.37 billion from the funds, per data from SoSoValue. Although the inflow was modest, it interrupted the longest period of sustained selling pressure from ETF investors this year.

Meanwhile, traditional safe-haven assets failed to attract buyers during the risk-off move. Gold fell roughly 3.5% while silver dropped 7.5%, suggesting investors were reducing exposure across multiple asset classes rather than rotating capital into precious metals.
Strategy also returned to the spotlight as Bitcoin traded below the firm’s average acquisition cost. The company’s unrealized losses have climbed above $12.7 billion, renewing debate around corporate Bitcoin treasury strategies.
CryptoQuant chief executive Ki Young Ju pushed back against concerns surrounding Strategy’s position, arguing that long-term whales have been a much larger source of supply.
“Strategy bought over 700K BTC from OG whales and only sold 32 BTC,” Ju wrote, adding that the firm’s purchases helped absorb coins that might otherwise have entered the market.
Bitcoin derivatives and on-chain data suggest capitulation may be nearing
Options positioning around the $60,000 strike has become a major focus for traders. According to Deribit Chief Commercial Officer Jean-David Péquignot, more than $1.2 billion in notional open interest is tied to put options at that level.
A sustained move below $60,000 could force market makers to hedge short gamma exposure by selling spot Bitcoin or futures contracts. Combined with elevated leverage across perpetual futures markets, that process may increase volatility if sellers remain in control.
On-chain metrics, however, are beginning to show conditions often associated with late-stage capitulation.
According to analyst Seth, the percentage of Bitcoin holders in profit has reached a long-term trendline that has coincided with major cycle lows in previous drawdowns. The analyst noted that the depth of those drawdowns has decreased with each cycle and argued that a bottom could be near if historical behavior repeats.
Additional data shared by market commentator Scott Melker highlighted growing stress among newer Bitcoin investors.
“$BTC short-term holders are now realizing losses at the biggest level in history. The short-term holder realized profit/loss ratio just hit a new all-time low, deeper than any previous drawdown.”
Melker added that long-term holders now control roughly 5.3 million BTC at a loss, a figure that exceeds post-FTX levels and represents the highest amount of underwater long-term supply since the COVID-era market crash.
Technical breakdown puts $55K support zone in focus
The daily chart shows Bitcoin trading well below the Supertrend indicator, which now sits near $69,700 and acts as immediate resistance. A failed recovery attempt beneath that level has left sellers firmly in control of the short-term trend.
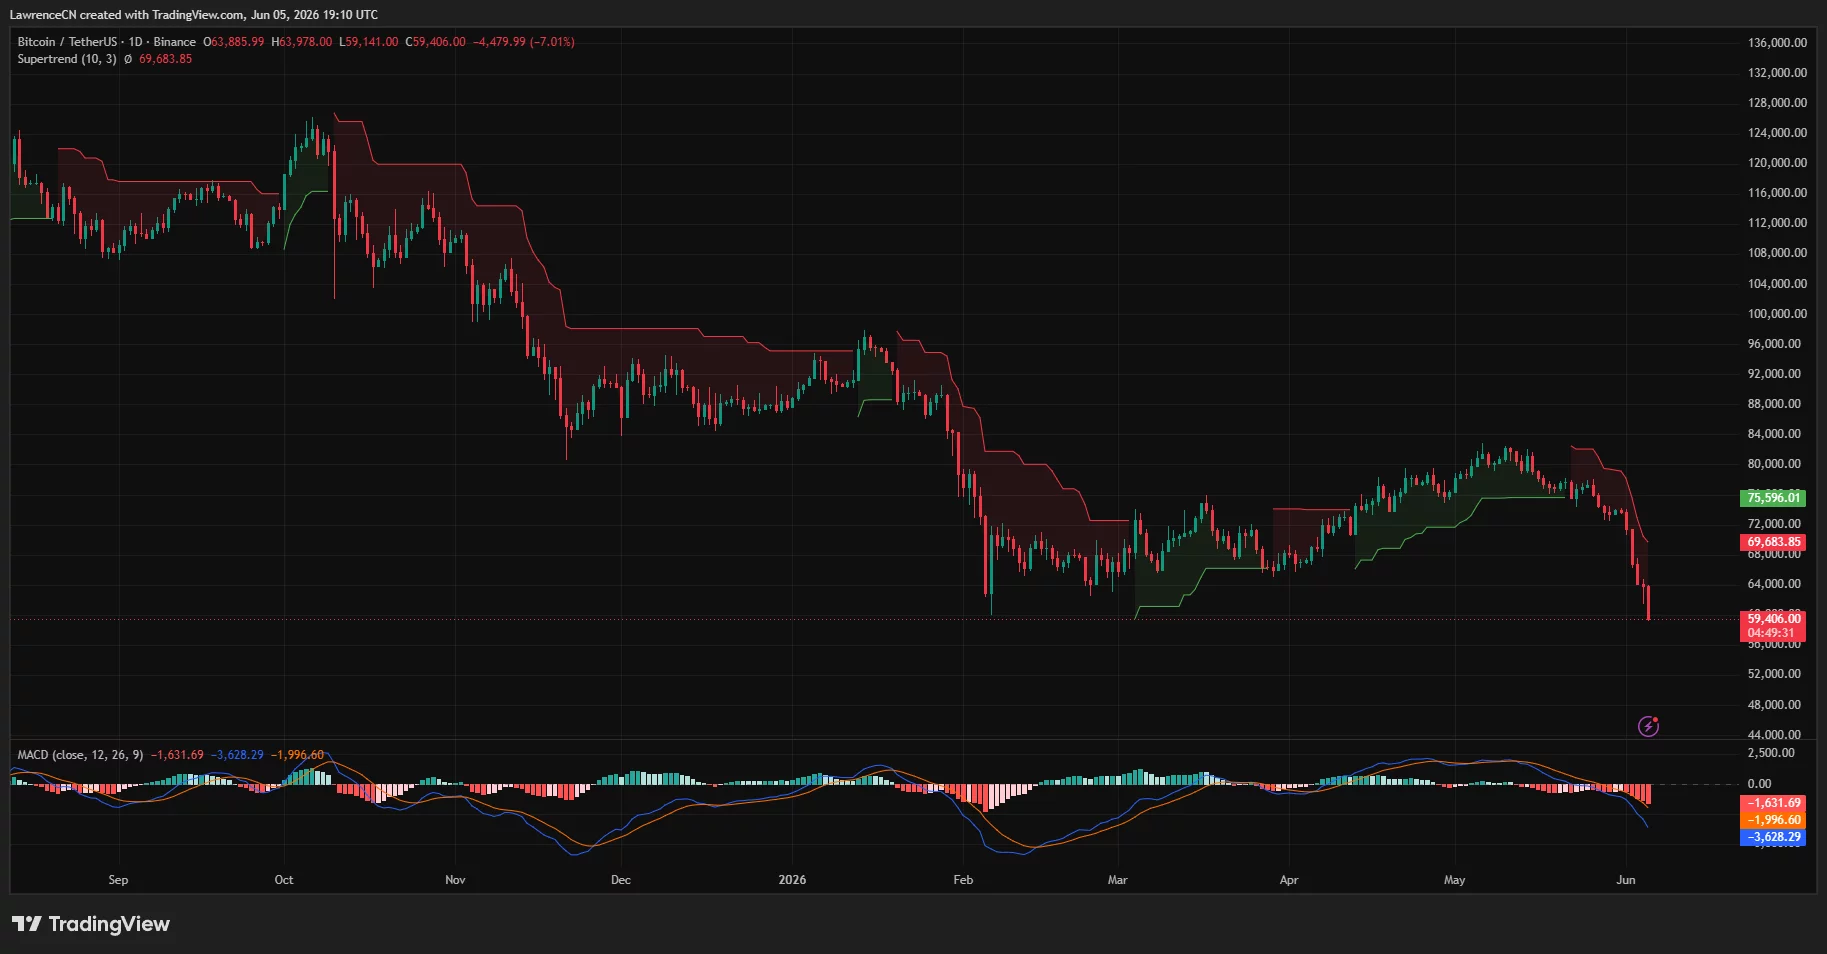
Momentum indicators also remain weak. The MACD line has dropped sharply below the signal line while the histogram continues to expand in negative territory, showing persistent downside momentum after the breakdown from the $72,000-$75,000 range.
The loss of $60,000 leaves the February low near $55,000 as the next major support zone. A decisive break below that area could expose the psychological $50,000 level and trigger another round of liquidation-driven selling.
Bulls would need to reclaim $60,000 quickly to ease immediate pressure. A recovery above the Supertrend resistance near $69,700 would invalidate the current bearish structure and reopen the path toward the $75,000 area. Until then, stronger-than-expected economic data, rising rate-hike expectations, and heavy derivatives positioning remain key risks for Bitcoin.
Disclosure: This article does not represent investment advice. The content and materials featured on this page are for educational purposes only.
Many popular altcoins, including Ethereum (ETH), Ripple (XRP), and Solana (SOL), have declined by 5%-8% over the past day, in line with the broader market’s bearish conditions.
Four lesser-known tokens, however, experienced much more substantial losses, and the main culprit is Binance.
What Happened?
The world’s largest crypto exchange conducted yet another review of the digital assets listed on its platform to assess whether they meet industry requirements, including team commitment, level of development activity, trading volume, adequate liquidity, network stability, and more.
Following the analysis, it decided to terminate all services with Contentos (COS), Dar Open Network (D), Highstreet (HIGH), and MOBOX (MBOX). The delisting effort is scheduled for June 19, but the announcement has already caused a price collapse for the affected coins. All of them have plummeted by more than 25% daily, with COS the biggest loser, down around 31%.
Such dramatic price swings shouldn’t be surprising, as losing support from a heavyweight like Binance typically results in thinner liquidity, reduced availability, and reputational damage.
A few weeks ago, the exchange said goodbye to Automata (ATA), Harvest Finance (FARM), Enzyme (MLN), Phoenix (PHB), and Syscoin (SYS), sparking similar price reactions.
Binance also removed the trading pairs AXL/BTC, CRV/BTC, EGLD/BTC, OPN/BNB, POL/ETH, QTUM/USDC, and SKY/BTC. However, the move didn’t trigger a massive price drop, as the termination of all trading services for those assets might have.
Additional Announcements
The company disclosed that it will support the NEAR Protocol (NEAR) network upgrade and hard fork. The development is scheduled for June 10 and will include a temporary suspension of token deposits and withdrawals on that blockchain.
Binance promised to handle all technical requirements involved for users, assuring that operations will be restored once the upgraded network is “deemed to be stable.” It also said that token trading will not be affected.
This is a standard procedure carried out multiple times in the past, and so far there haven’t been any reports of major complications. Towards the end of May, Binance briefly halted deposits and withdrawals on the Ethereum network to perform wallet maintenance. Prior to that, it implemented such measures to support improvements across other ecosystems, including Cardano and BNB Chain.
The post Binance Sparked a Massive Crash for 4 Altcoins: Check out How appeared first on CryptoPotato.


Gold has lost part of its old safe-haven image as its price action now moves closely with risk assets such as Bitcoin and the S&P 500, according to economist Robin Brooks.
Summary
- Robin Brooks said gold has lost part of its safe-haven role as its equity correlation rises.
- Brooks said gold now trades more like Bitcoin and the S&P 500 during market stress.
- He linked gold’s changed behavior to retail inflows during the late 2025 debasement trade.
- Peter Schiff warned Bitcoin could face panic selling if it breaks its latest low.
According to Brooks, gold no longer behaves like the traditional hedge investors once expected during periods of market stress. He said the metal now trades as a pro-cyclical, high-beta asset, with its correlation to the S&P 500 rising above 0.50 in recent months.
Gold’s safe-haven role comes under pressure
Brooks said gold historically kept a correlation near zero with the S&P 500, while Bitcoin’s long-term correlation with equities usually stayed below 0.15. During the late 2025 and early 2026 “debasement trade,” Brooks said Bitcoin’s equity correlation climbed as high as 0.55.
At the same time, gold’s correlation with U.S. equities also increased. Brooks said gold now matches Bitcoin’s correlation with the S&P 500, a setup he described as unusual for an asset long treated as a shelter during geopolitical or economic stress.
The economist said gold now falls with equities when investors reduce exposure to risk. In Brooks’ view, that behavior works against the basic purpose of a safe-haven asset.
Retail demand changed Gold’s market behavior
Brooks linked the change to the sharp gold rally over the past year and the arrival of new retail buyers. He said the price increase mechanically lifted the value of gold on central bank balance sheets, but he rejected the idea that institutions had suddenly rushed into bullion or abandoned the U.S. dollar.
According to Brooks, heavy promotion of the “debasement trade” in late 2025 brought many retail investors into gold. He said these buyers tend to react more quickly to market stress than older bullion holders.
Brooks said he first expected the high equity correlation to fade after corrections pushed short-term traders out of the market. He now believes gold’s trading structure has changed more deeply.
Schiff warns Bitcoin could face another sell-off
Meanwhile, Bitcoin critic Peter Schiff warned that the latest Bitcoin drop could lead to another round of panic selling. Schiff wrote on June 5 that Bitcoin had broken below $60,000 and touched its lowest level since October 2024.
Schiff said the move erased Bitcoin’s gains after Donald Trump’s November 2024 election win. According to Schiff, the rebound above $61,000 came from opportunistic buying rather than a durable recovery.
“If today’s low is taken out, prepare for a Crypto Black Monday,” Schiff said.
Schiff, chief economist and global strategist at Euro Pacific Asset Management, has long argued that gold is a better store of value than Bitcoin. He also founded SchiffGold and became widely known after predicting the 2008 financial crisis.
Standard Chartered keeps bullish Bitcoin view
Standard Chartered offered a different view in a June 4 client note. Geoffrey Kendrick, the bank’s head of digital assets research, called the latest crypto downturn a “painful week” but kept his long-term bullish outlook.
Kendrick said Strategy could restart heavy Bitcoin purchases, as it has done after past sales. He wrote that investors may later view this period as a buying zone if Bitcoin reaches $100,000 by the end of 2026.
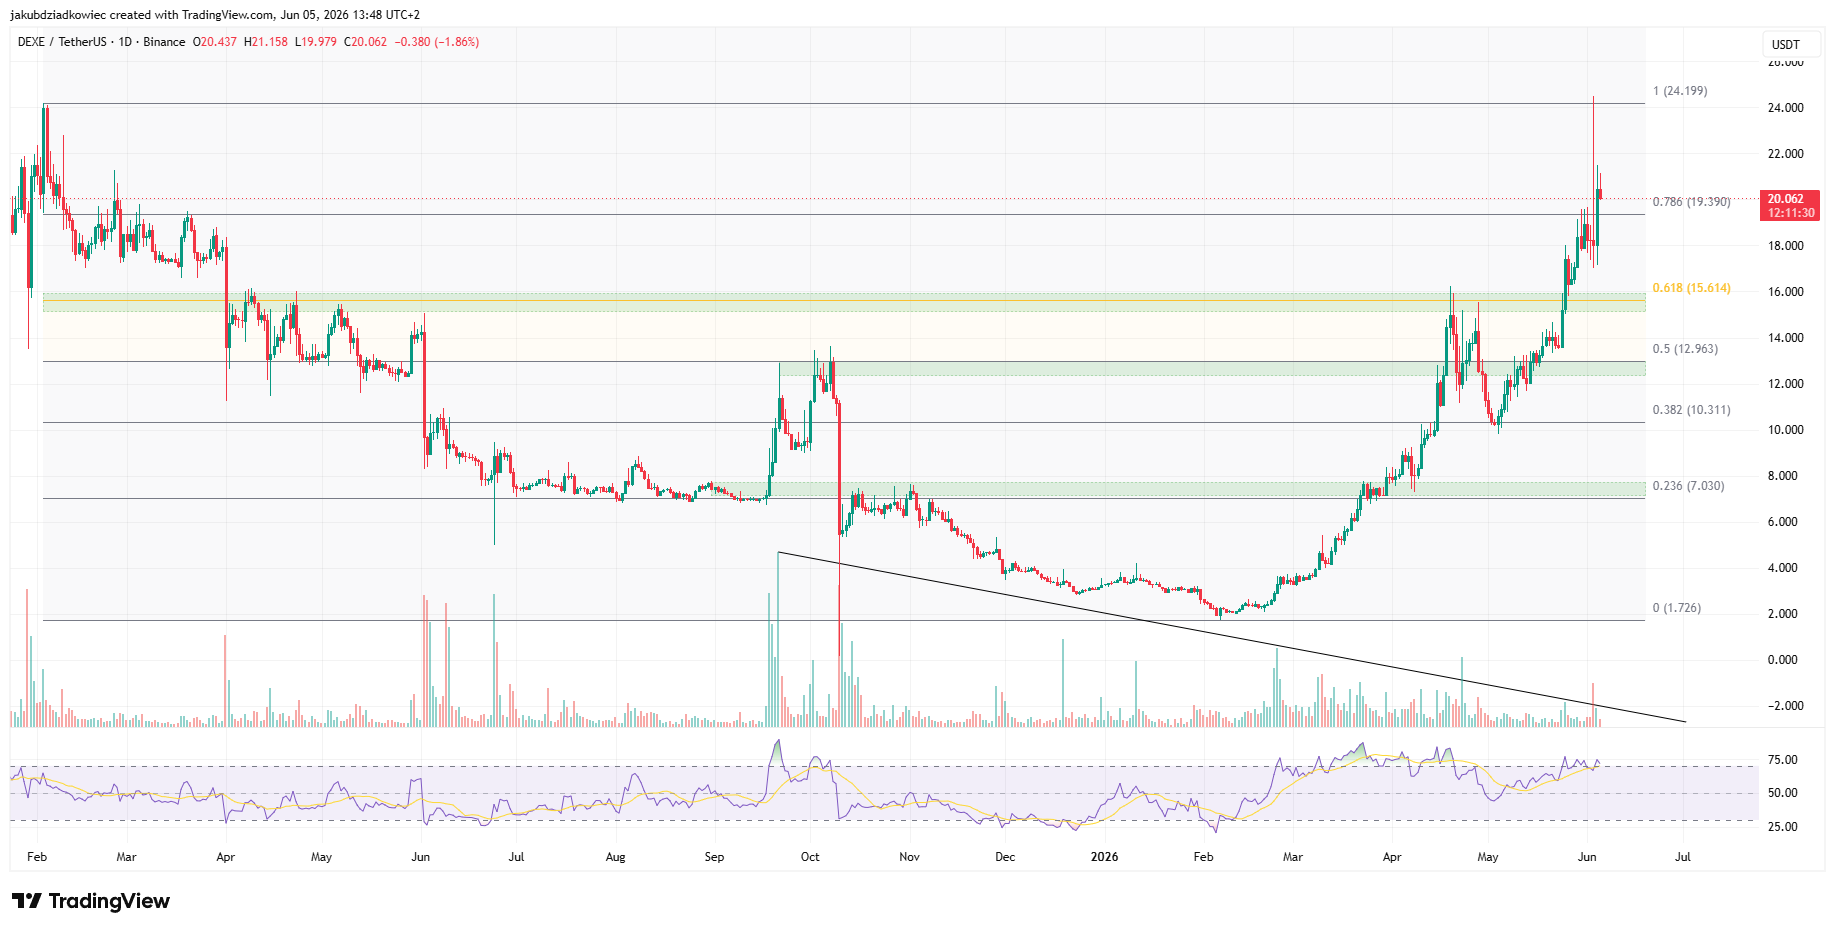
A sharp crypto market sell-off this week dragged most major tokens lower, yet a handful of altcoins pushed against the trend. DeXe, JUST, and Audiera all posted gains while the broader market bled.
Each of the three holds a constructive technical structure heading into the weekend. Their charts show buyers defending key support levels, even as risk appetite across the market stayed weak.
DeXe Leads the Resilient Altcoins
DeXe (DEXE) trades near $20, up roughly 8% over the past 24 hours. The token recently hit a four-year high close to $24, its February 2025 peak.
Price has since cooled to the 0.786 Fibonacci retracement around $19.40. Layered support sits below at $15.60, $13, and $10, with each level tied to a Fibonacci marker.
However, volume has thinned during the latest leg higher. That points to a weaker conviction behind the rally. The RSI also sits above 70 after several touches near the top, so a short pause would not surprise.

JUST Bounces From Trendline Support
JUST (JST) changed hands near $0.080, up about 8% on the day. The token fell roughly 20% on June 3 as the market collapsed.
It then bounced off its ascending trendline and the 0.382 Fibonacci level near $0.075. That zone marks a standard area of support. A deeper drop would likely find a floor at the 0.618 retracement near $0.061.
Upside targets sit at $0.084 and then the $0.10 region, a level also flagged in an earlier forecast. Volume spiked on both the sell-off and the rebound. The RSI dipped toward oversold without reaching it, then recovered to neutral.

Audiera Breaks Out of a Long Base
Audiera (BEAT) trades near $1.60, up about 13% over the past 24 hours, extending a months-long rally. The token spent months building a rounded double-bottom base since early January.
It broke out on May 22 and quickly reached its first target near $1.27. After a brief correction, BEAT is pushing higher again.
The next target sits at the 0.382 Fibonacci level around $2. Beyond that lies the prior swing high at $2.43. The RSI holds in bullish territory, and rising volume supports the move.

Altcoins to Watch: Setup Suggestions
All three altcoins look constructive, yet they sit at different stages. DeXe is cooling off after tagging its long-term target. JUST is defending support after a healthy pullback.
Audiera holds the most room to run inside a fresh breakout. A broader market recovery could accelerate each move, while another leg down would test the support levels named above. The charts, not the headlines, will decide the next move.
The post 3 Altcoins Defying the Market Sell-Off This Weekend appeared first on BeInCrypto.
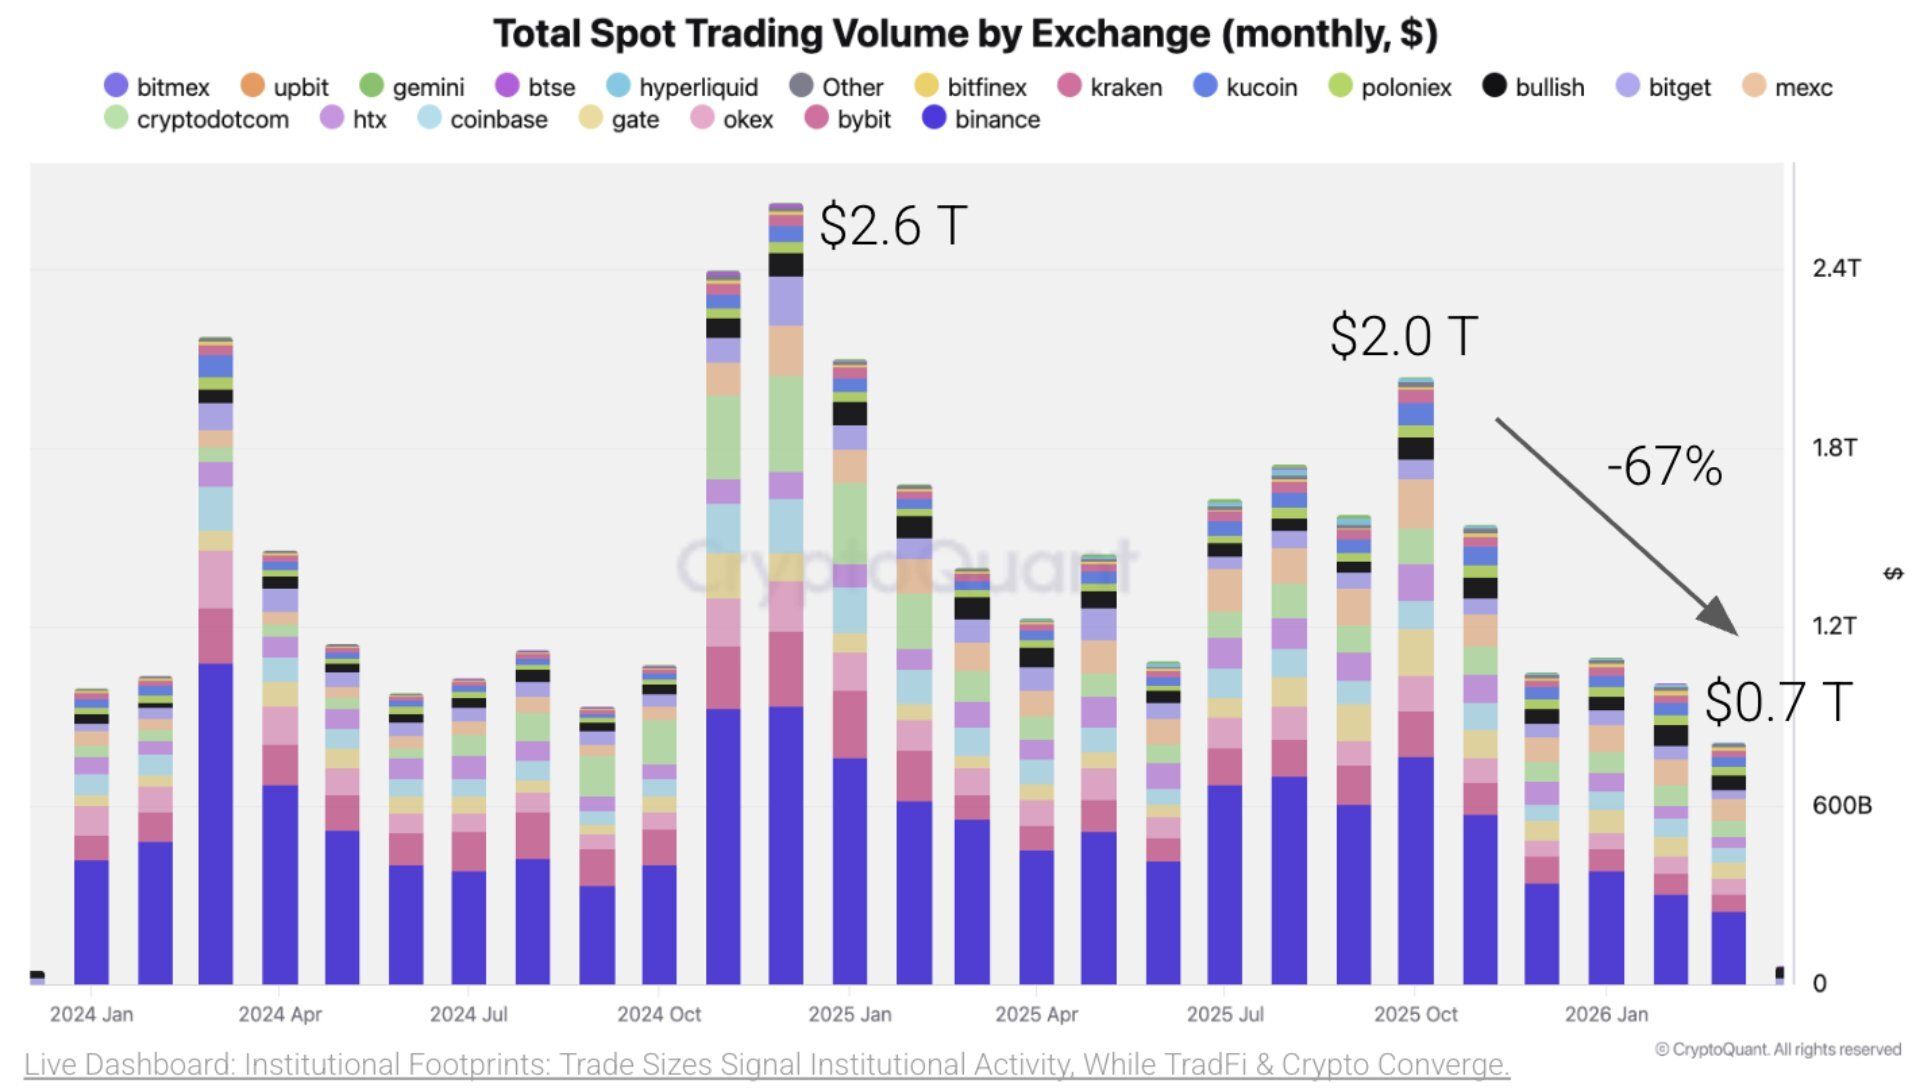
Crypto spot volume on centralized exchanges fell to $679 billion in April 2026, the lowest monthly level since October 2023. The drop reflects a grinding bear market that has drained activity across spot and futures.
Beneath the falling totals, the market is changing shape. Trades are growing larger and more institutional, while traditional assets such as gold and oil now trade actively on crypto venues, according to a new CryptoQuant report.
The Contraction Runs Across Spot and Futures
Total spot volume has fallen sharply from its late-2024 peak near $2.6 trillion. That marks a decline of roughly two-thirds from the high. CryptoQuant ties the slide to an ongoing crypto bear market that has suppressed trading since 2025.

Perpetual futures volumes fell in parallel. Leverage appetite contracted alongside spot price weakness, the report said. The pullback points to traders cutting risk rather than adding it.
Bitcoin (BTC) traded near $62,000 on June 5, well below its October 2025 peak above $122,000, according to CoinGecko. The current downturn has been slower and, unlike the 2022 collapse, has had no cascading failures.
Crypto Spot Volume Pools Into Fewer Exchanges
The volume that remains is concentrating on a small group of deep venues. Binance, Bybit, Gate, and Crypto.com led cumulative spot volume so far this year, CryptoQuant said.
CoinGecko data shows a similar pattern. Binance handled about 23% of spot volume across top-tracked exchanges on June 5, with Bybit and Gate ranking next. The five largest venues together took close to 40% of that volume.

Average Bitcoin trade sizes have risen on spot and futures since 2025. CryptoQuant reads the trend as institutional players making up more of the remaining activity. Larger tickets tend to favor exchanges with the deepest order books.
Gate led those average trade sizes at the margin. Kraken and OKX also ranked high, a sign of larger-scale execution. The shift mirrors the bear market price action that has thinned out smaller traders.
Traditional Assets Move Onto Crypto Rails
Trading of traditional assets on crypto exchanges reached record highs in 2026. Demand centered on gold and silver, while oil gained momentum on the US-Iran conflict.
Gate and Binance accounted for roughly two-thirds of that traditional futures volume. The pattern shows traders using crypto venues for around-the-clock macro exposure. That access matters most when traditional markets are closed on weekends and holidays.
In perpetual futures, liquidity is clustered on Gate, Binance, OKX, and Bitget. Hyperliquid’s trading volume has also emerged as a fast-rising competitor in that market.
The headline numbers point to a market in retreat. The composition of what remains, however, suggests a structural shift toward institutions and traditional assets that could outlast the downturn.
The post Crypto Spot Volume Hits 2.5-Year Low as the Market Quietly Changes Shape appeared first on BeInCrypto.


Decentralized artificial intelligence network DGrid AI generated $20 million in revenue in its first six months, giving the project a paid-user base ahead of its planned DGAI token launch.
Revenue came through the Genesis premium program, which has attracted more than 13,000 paid users with an average revenue per user of $1,580.
DGrid also reports 50,000 daily active users and 500,000 monthly active users across its ecosystem.
DGrid is building a decentralized smart network for AI, connecting users, developers, models, and agents through a marketplace, smart routing system, and Proof of Quality verification for AI services.
Genesis Premium Program Builds Early Revenue
Genesis is currently DGrid’s revenue engine, with members paying for network access and receiving benefits connected to AI usage, hardware, monthly token credits, AI model services, and membership NFTs.
Under DGrid’s economic model, those NFTs are linked to 25% of total DGAI emission rights over ten years.
The model combines usage-led demand with token-linked participation before the token generation event.
Some members use Genesis for AI model access and lower usage costs, while others focus on future DGAI distribution connected to the membership NFT. The program gives DGrid cash flow and committed community activity before launch.
AI Arena Adds BNB Chain Activity
DGrid’s onchain activity has grown through Arena for Agent, launched on BNB Chain. The product has supported more than 10,000 agent deployments through ERC-8004 and attracted over 200,000 participants, while adding more than 5,000 daily onchain active users to BNB Chain.
Arena asks two AI models to answer the same prompt anonymously, after which users choose the stronger response and earn points tied to future DGAI distribution. Their selections help train DGrid’s smart routing system, turning model evaluation into a recurring onchain activity with a low technical barrier for users.
Arena also gives DGrid visible user activity before launch while collecting comparison data for its routing system.
Products Focus on AI Access, Routing, and Agent Deployment
DGrid’s product suite includes AI Gateway, Dori, and DClaw, each aimed at a different part of AI access and deployment. Here’s a detailed breakdown of each:
Product
Main Function
Who is it for?
Key Benefit
AI Gateway
Provides a single access point for multiple AI models.
Developers, businesses, and users who need model access without managing separate integrations.
Simplifies AI model access and supports payments in USDT, USDC, and BNB.
Dori
Helps developers choose the right AI model for specific use cases.
Developers testing or deploying AI tools.
Reduces the time and cost of manually comparing multiple models.
DClaw
Lets users launch personal AI agents across Telegram, Discord, WeChat, and Feishu.
Users and teams that want AI agents inside messaging and community platforms.
Makes AI agents easier to deploy across familiar communication channels.
Model Marketplace
Allows model providers to list AI services and earn revenue through AI Gateway.
AI model providers, developers, and enterprise users.
Creates a marketplace for AI model access, monetization, and service discovery.
Proof of Quality
Verifies model performance, pricing, and delivery standards.
Marketplace users, model providers, and developers.
Adds trust and transparency to model selection.
A Note on Research
DGrid’s academic work adds depth to its product plan. The network cites published research on Proof of Quality, optimistic TEE rollups, and cost-aware proofs, all of which relate to service verification, model performance, and cost control.
The team includes Ph.D.-level members from institutions such as Stony Brook University. Founder and CEO Alex has more than 10 years of experience in blockchain project operations, 5 years in machine learning, and over 3 years in large language model training and fine-tuning.
DGAI Token Launch is One to Watch
DGrid enters its token launch phase with paid membership revenue, BNB Chain activity, AI products, marketplace plans, and research already in place.
After six months, the project has built a user and revenue base around Genesis, expanded Arena participation, and prepared the foundations for a model marketplace powered by DGAI.
The post DGrid AI Reports $20 Million in Revenue Ahead of Token Launch appeared first on BeInCrypto.
Market Sell-Off Wipes $2.5 Trillion as Jobs Data, AI Concerns Shake Investors
From “Sinners ”to “Smile”, every film that's parodied in “Scary Movie”

Postcode Lottery winners in Middlesbrough and Wynyard


-

 Business4 days ago
Jade Biosciences, Inc. (JBIO) Discusses Positive Interim Results From JADE101 Phase I Healthy Volunteer Study and Development Plans Transcript
-
 Tech6 days ago
SpaceX just won a second Golden Dome contract. This one is $4.16 billion.
-

 Sports3 days ago
French Open 2026 results: Alexander Zverev beats Rafael Jodar and will play Jakub Mensik in semi-finals
-
 NewsBeat7 days ago
FIRST NIGHT REVIEW: Take That bring the Circus back to life in spectacular sun-soaked style
-

 Business6 days ago
Is the Spurs Phenom Already Better Than Prime Diesel?
-

 Tech3 days ago
CryZENx Releases Fresh Playable Content Deep Inside Jabu-Jabu for His Ocarina of Time Remake
-

 Politics7 days ago
The House | Inside Andy Burnham’s Makerfield Campaign: “Nobody Thinks This Is In The Bag”
-
Crypto World10 hours ago
LBank Surpasses 25 Million Users Worldwide as AFA Partnership Continues to Drive Global Growth
-

 Business3 days ago
Trump Taps Housing Chief Bill Pulte as Acting Intelligence Director After Gabbard Exit
-
 Entertainment7 days ago
Weak ‘Supergirl’ Box Office Tracking Amid Milly Alcock Backlash
-
 Entertainment7 days ago
Bruce Willis’ Generosity Resurfaces Amid His Dementia
-
 Entertainment6 days ago
One of the Greatest Sitcoms of All Time Shoots Up Apple TV’s Charts 11 Years Later
-

 Business7 days ago
Demand Conditions Improve In Chemicals Sector In April 2026
-
 Crypto World7 days ago
MicroStrategy Moves $30 Million in BTC to Coinbase Prime: Is the Bitcoin Sell-Off Already Here?
-
 Crypto World3 days ago
Seagate (STX) Stock Surges to Record High on AI Boom and Legal Settlement
-
 NewsBeat6 days ago
Everything you need to know as Cambridge’s Strawberry Fair returns after cancelled year
-
 Entertainment7 days ago
Britney Spears Shares Troubling Update After Hard Year
-
Crypto World3 days ago
EU AI Data Center Project Faces Delays as Funding Gaps Grow
-
 Business7 days ago
US-led AI investments risk capital destruction: Chris Wood
-

 Business3 days ago
Aehr Test Systems Stock Soars 17% Amid Surging AI Demand and Conference Spotlight
You must be logged in to post a comment Login