
Crypto World
These Metrics Signal $100 Was the Local Bottom
Solana price action suggests a potential bottom around the $100 area across multiple timeframes, setting the stage for a longer-term rebound that could target the $260 zone if key hurdles are cleared. The decline from a high near $127 shaved about 25% off the price before buyers stepped in at support around $100. In the near term, momentum indicators hint at a gradual re-acceleration: the four-hour RSI has climbed to the mid-30s from oversold territory near 18, while the daily RSI remains deeply oversold around 29, a level that has historically preceded rebounds. With bulls eyeing a V-shaped recovery, traders are watching for convincing breaks through resistance bands that have historically paused pullbacks.
Key takeaways:
SOL must break several resistances before $260
- The four-hour chart is showing a potential bottoming pattern, hinting at a possible acceleration if the price can stay above critical support and push through immediate supply hurdles.
- First resistance sits in the $113–$115 zone, where several trendlines converge and selling pressure could intensify as the price reclaims momentum.
- A second barrier lies in the $125–$130 area, defined by a confluence of the 50-day EMA and the 50-day SMA, which has historically acted as stubborn resistance for SOL.
- Clearance of these zones could open the way to the neckline around the $150 mark, setting up a trajectory toward higher levels and a potential longer-term upside target around $260.
- On the bigger picture, the weekly perspective shows that the 50-week moving average sits roughly in the $140–$160 range, a region that has historically postponed rallies even when shorter-term momentum improves.
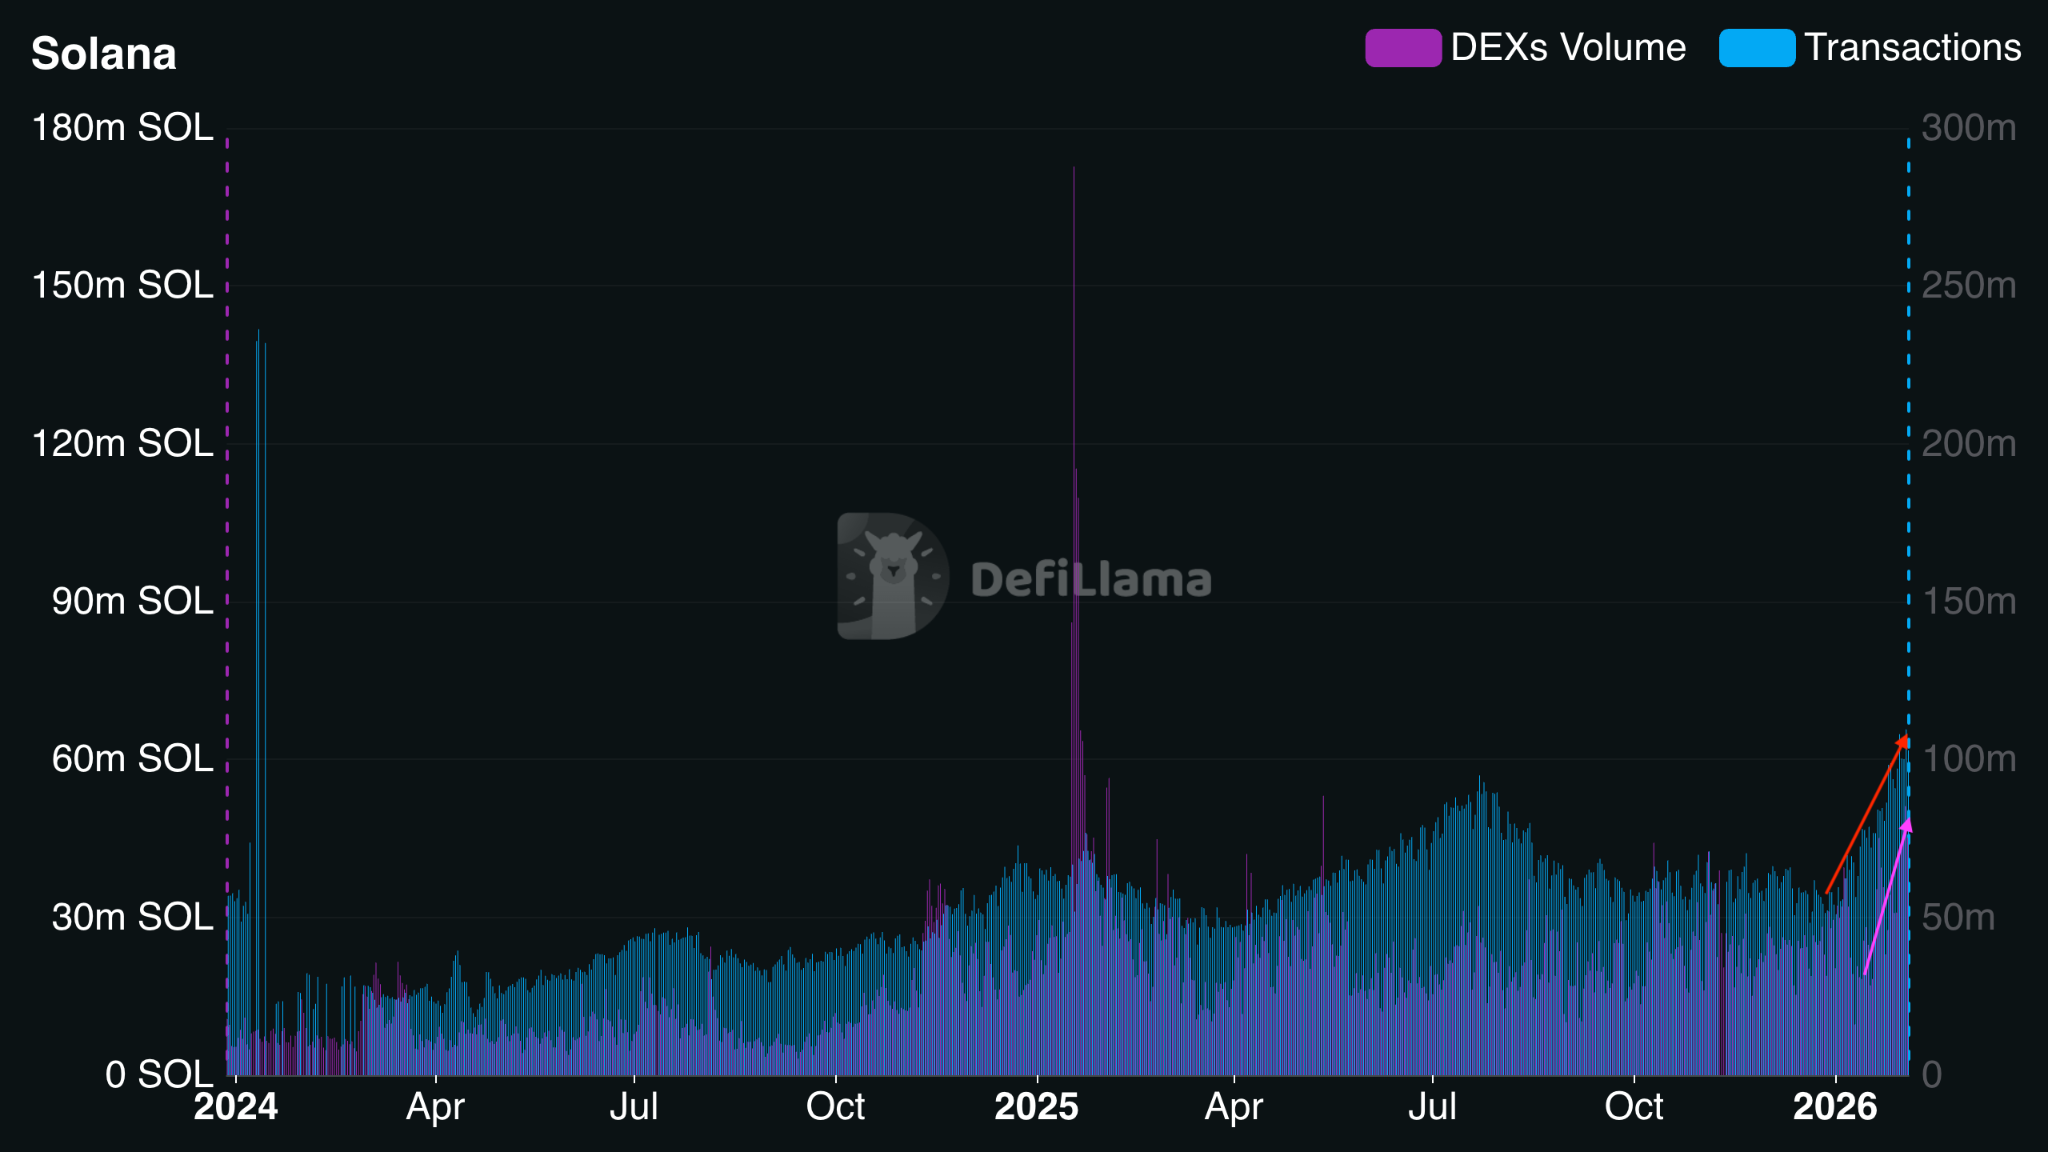
In a broader view, Solana’s on-chain activity has begun to show renewed vigor. The network’s total value locked (TVL) climbed to 73.4 million SOL on Monday, which translates to about $7.5 billion at prevailing rates. This marks an 18% week-over-week rise and echoes a renewed appetite for Solana-based projects and DeFi protocols. The last time TVL reached similar daily high-water marks in SOL terms, activity on the network surged alongside price gains that followed later in the year.
The daily transaction count rose to a two-year high, clocking in at approximately 109.5 million transactions. At the same time, the daily DEX volume reached about $51.3 million SOL, with weekly DEX trading volume climbing to 264.8 million SOL for the week ended Sunday. Daily active addresses surged roughly 115% in late January, a jump that analysts often associate with improving price action in SOL.

The chart narrative remains nuanced. A return toward the $120–$150 band could be feasible if the 20-day EMA at around $106 is reclaimed as support, a scenario highlighted in market commentary that noted the potential for a test of the nearby supply bands before a broader rally unfolds. If traders manage to secure that foothold, the next milestone would be a sustained break above the $150 neckline, which would improve the odds of a move toward the mid-$200s and beyond. This is particularly relevant given that a longer-term upswing would require not only a technical breakout but continued healthy on-chain activity and ecosystem development.
From a macro vantage point, Solana’s progress comes as part of a broader re-prioritization across crypto markets, where liquidity is gradually returning and risk appetite shows tentative signs of revival. While the near-term path remains contingent on whether SOL can convincingly clear its first resistance bands, the confluence of improving on-chain metrics and a constructive price pattern provides a framework for optimism among SOL participants.
Solana’s market dynamics and why it matters
Beyond the price action, the evolving on-chain picture matters because it underpins the sustainability of Solana’s ecosystem. Higher TVL and increased network activity suggest that developers and users continue to deploy and interact with Solana’s DeFi and NFT applications. For investors, this signals that the network is not merely experiencing a recovery in price but also in fundamental engagement, which can help sustain upside in a multi-month horizon.
Investors watching for catalysts should consider both price structure and on-chain momentum. If SOL can reclaim the $106 level and push through the $113–$115 resistance band, the odds of testing the $125–$130 hurdle rise. A decisive break beyond that zone—ideally accompanied by continued growth in TVL and daily active addresses—could set up a longer-term trajectory toward previously observed highs and the target around $260. However, countercurrents such as broad market weakness, regulatory headlines, or shifts in liquidity could compress gains or trigger renewed volatility.
Why it matters for the ecosystem
For developers and users within Solana’s ecosystem, a sustained price and on-chain activity recovery can re-energize funding cycles, NFT markets, and the deployment of new decentralized applications. A rebound that aligns with improving on-chain metrics could attract new liquidity to Solana-based projects, potentially accelerating adoption and network effects. Conversely, a prolonged stall near resistance bands or a regression to the $100 support could delay momentum and slow the pace of development activity.
Ultimately, the health of the Solana network hinges on a combination of technical validation and real-world usage. The interplay between price patterns, moving-average resistances, and on-chain engagement will continue to shape the near-term trajectory and determine whether the bullish thesis gains traction or remains a conditional scenario contingent on broader market strength.
What to watch next
- Hold above $100 support on a closing basis to maintain the potential for a rebound towards higher resistance bands.
- Reclaim of the 20-day EMA around $106 as support would add conviction for a move toward $113–$115.
- Clearance of the $113–$115 zone followed by the $125–$130 area would open a path toward the $150 neckline.
- Monitor the weekly MA zone of $140–$160 as a longer-term resistance barrier that could delay a breakout.
- On-chain metrics to watch: TVL (targeting continued strength in SOL-denominated value), daily transactions, active addresses, and DEX volumes for signs of sustained engagement.
Sources & verification
- SOL price movement and RSI context, including the move off a $100 support and the 4-hour/ daily RSI readings documented in price analysis references.
- DefiLlama data for Solana TVL, daily transactions, and DEX volumes (TVL: 73.4 million SOL ≈ $7.5B; daily transactions: ~109.5 million; daily DEX volume: ~$51.3M; weekly DEX volume: ~264.8M SOL).
- On-chain activity note: daily active addresses rise by approximately 115% in late January.
- Market commentary on the potential impact of reclaiming the 20-day EMA around $106 and the subsequent test of short-term resistance bands.


Aave just watched $6.6 billion walk out the door, and it’s not because anyone hacked Aave.
The protocol’s total value locked dropped from $26.4 billion on April 18 to nearly $20 billion in U.S. morning hours on Sunday, per DefiLlama. The AAVE token fell 16% to $92, and daily fees spiked to $1.99 million as liquidations ripped through the weekend.
Depositors are running because Aave is carrying a hole it did not create. When attackers drained 116,500 rsETH from Kelp’s bridge on Saturday, they dumped the stolen tokens on Aave V3 as collateral and borrowed wrapped ether against them.
On-chain trackers put the Aave-specific borrow at roughly $196 million, with total positions across Aave, Compound and Euler around $236 million.
Aave is the largest lending protocol in DeFi, where users deposit crypto to earn yield and other users borrow against collateral. Kelp is a liquid restaking protocol, which takes ether that has already been staked on Ethereum and routes it through a separate yield-generating system called EigenLayer, issuing a receipt token called rsETH in exchange.
That rsETH is what users trade and, critically, what some users posted on Aave as collateral to borrow against.
On Saturday, attackers tricked Kelp’s cross-chain bridge into releasing 116,500 rsETH, about $292 million worth, to an address they controlled. They then deposited that stolen rsETH onto Aave V3 as collateral and borrowed wrapped ether against it.
A bridge is a blockchain-based took that transfers tokens between different networks, where they may not be originally supported.
Aave first said the Umbrella reserve would cover any deficit. By Saturday afternoon the language had softened to “explore paths to offset the deficit.” That is not how a protocol talks when it knows how much it owes and has the money to pay it.
The concentration explains why the damage lands here. Aave’s loan book spans 22 chains, but Ethereum alone holds $14.24 billion of the $17.82 billion in outstanding borrows. WETH is 39.49% of all loans on the protocol, meaning the attack hit the exact collateral-to-WETH pair that dominates Aave’s book.
Stani Kulechov, Aave’s founder, said the exploit was external and the protocol’s contracts were not compromised. But Aave accepted a liquid restaking token as collateral, and that token’s backing vanished on a bridge Aave does not control. The depositors lose either way.
Liquid restaking tokens were whitelisted across every major lending protocol because they carried yield and represented growing share of Ethereum’s locked value.
The risk models priced them as if they would hold peg under normal conditions. However, none of them priced a scenario where the collateral goes to zero because a bridge on a chain Aave does not touch got exploited on a Saturday.
“AAVE is the backbone of DeFi, has billions in there, and pretty much every single new DeFi infrastructure on new chains is a fork of it,” trader Altcoin Sherpa wrote on X. “When AAVE has contagion risk, it shows the fragility of the entire system.”
What the token price is trying to answer now is whether Umbrella is big enough to cover the hole, and whether stkAAVE holders who back that reserve are about to eat the loss.

Key Takeaways
- AbbVie delivered 2025 revenues of $61.16 billion with 8.6% year-over-year growth and boosted its dividend by 5.5% heading into 2026
- Chevron achieved unprecedented production volumes in 2025 alongside a 158% reserve replacement ratio, maintaining strong analyst support
- Shell’s operations produced $26.1 billion in free cash flow during 2025, leveraging its position as a global LNG leader
- Enterprise Products Partners maintains a robust 1.7x distribution coverage ratio while offering nearly 6% yield
- Realty Income delivered Q4 2025 adjusted funds from operations of $1.08 per share with monthly dividend distributions
Income-focused investors seeking dependable returns through 2028 are examining five dividend-paying equities: AbbVie, Chevron, Shell, Enterprise Products Partners, and Realty Income.
These companies all deliver yields exceeding 3%, supported by fundamentals that extend well beyond their dividend distributions. The strategy centers on identifying enterprises with consistent cash generation, sustainable leverage levels, and distributions supported by actual profitability.
AbbVie
AbbVie stands out as the premier selection among these dividend stocks. Trading with approximately a 3.3% yield, the pharmaceutical giant posted 2025 revenues totaling $61.16 billion, representing an 8.6% increase year-over-year.
The company’s immunology drugs Skyrizi and Rinvoq have successfully offset revenue declines from Humira, which encountered biosimilar competition. This product transition has exceeded expectations across the analyst community.
For 2026, AbbVie announced a 5.5% dividend increase. Wall Street sentiment tracked by MarketBeat reveals 16 buy recommendations, 9 hold ratings, and zero sell calls, establishing a Moderate Buy consensus. The absence of any sell ratings demonstrates notable analyst confidence.
Chevron
Chevron achieved peak production volumes throughout 2025 while posting a 158% reserve replacement ratio, indicating the energy giant added substantially more reserves than it extracted during the period.
The company elevated its quarterly distribution to $1.78 per share. MarketBeat data shows analyst sentiment averaging a Hold, with 14 buy ratings, 6 holds, and 4 sell recommendations.
This tempered Wall Street enthusiasm could present opportunity. When analyst excitement remains moderate, stocks often have greater appreciation potential—particularly if commodity prices stabilize and shareholder returns continue.
Shell
Shell extends beyond traditional petroleum operations. The company ranks among the world’s foremost liquefied natural gas operators, providing diversification versus typical U.S. energy majors.
During 2025, Shell produced $42.9 billion in operating cash flow and $26.1 billion in free cash flow. Management maintains a policy of distributing 40% to 50% of operating cash flow to shareholders.
MarketBeat tracking shows 6 buy ratings, 13 holds, and zero sell recommendations. The company’s LNG operations provide exposure that traditional oil-focused competitors cannot match.
Enterprise Products Partners
Enterprise Products Partners delivers the strongest yield among these five stocks at approximately 6%. The partnership recently reported 1.7x distribution coverage, demonstrating that cash flow substantially exceeds payout obligations.
Coverage ratios carry significant weight in evaluating high-yield investments. While a 6% yield might raise sustainability concerns, robust coverage indicates the distribution faces no immediate risk.
MarketBeat consensus stands at Moderate Buy with 10 buy ratings, 6 holds, and 2 sells. Prospective investors should note that partnership ownership generates K-1 tax documentation, standard for master limited partnerships.
Realty Income
Realty Income markets itself as “The Monthly Dividend Company,” distributing payments to shareholders twelve times annually. The REIT reported fourth-quarter 2025 adjusted funds from operations of $1.08 per share, maintaining a net debt to EBITDAre ratio of 5.4x.
The stock demonstrates sensitivity to interest rate movements, with performance closely tracking monetary policy changes. Should rates decline over the coming years, Realty Income stands to benefit through both its yield appeal and potential multiple expansion.
Analyst perspectives remain measured, with MarketBeat showing 6 buys, 9 holds, and 1 sell rating, while StockAnalysis consensus leans toward Hold.
Bottom Line
Among these five dividend opportunities, AbbVie leads based on its combination of income generation and earnings expansion. Chevron and Shell provide energy sector exposure supported by substantial cash returns. Enterprise Products ranks fourth for investors prioritizing current income, while Realty Income places fifth with its monthly payment structure and potential interest rate tailwinds.


Monero (XMR) has reached its 12-year milestone since its launch in 2014.
Summary
- Monero celebrates 12 years since launch in 2014 as leading privacy-focused cryptocurrency network.
- Network hides sender, receiver, and amount using cryptographic tools like Ring Confidential Transactions.
- Despite over 70 exchange delistings, Monero maintains active users and steady market participation.
The project has positioned itself as a privacy-focused cryptocurrency designed to hide transaction details on a public blockchain.
On April 18he project marked the occasion with a public message shared on X. The team stated “we’re celebrating our 12th birthday today” while thanking users for continued support of privacy-focused transactions.
Monero has maintained its position as one of the leading privacy coins in the digital asset sector over the years, focusing on confidentiality in transfers.
Monero was built to address transparency found in other blockchain networks. Unlike Bitcoin, where transactions are publicly visible, Monero hides sender, receiver, and transaction amounts.
The network uses technologies such as Ring Confidential Transactions and stealth addresses. These tools are designed to prevent linking transactions to specific users or wallet balances.
The system also ensures that coins cannot be traced through transaction history. This design aims to prevent tracking of individual units across the network.
Moreover, Monero has faced ongoing regulatory scrutiny due to its privacy features. Over the years, several exchanges have removed the token from their platforms.
Reports suggest the token has experienced more than 70 delistings across different jurisdictions. Despite this, trading activity and user participation have continued across alternative platforms and peer-to-peer markets.
The project has remained active through a global developer and user community that continues to maintain and update the protocol.
Development Activity and Market Performance
Monero developers are currently working on upgrades, including a planned FCMP++ update aimed at improving network performance and privacy features.
Interest in privacy coins has shown periodic changes in market cycles. Monero experienced renewed attention earlier this year alongside movements in other privacy-focused assets such as Zcash.
At the time of reporting, Monero trades near $351 with a market capitalization of about $6.47 billion (per CoinGecko’s data). The asset has recorded short-term gains over recent trading sessions, with modest increases in both daily and weekly performance.

TLDR:
- A $292M rsETH exploit enabled massive borrowing on Aave, leaving the protocol with unbacked collateral exposure.
- Aave’s ETH pool reached full utilization, restricting withdrawals as panic-driven outflows exceeded $5.4 billion.
- Technical indicators show AAVE weakening after rejection near $120, with momentum still favoring downside pressure.
- Critical support near $90 remains under watch as markets assess stability following one of 2026’s largest DeFi events.
Aave’s lending markets faced acute stress after a large exploit tied to Kelp DAO triggered a liquidity crunch. The incident drained hundreds of millions in assets and pushed Aave’s ETH pool to full utilization, limiting withdrawals across the protocol.
Liquidity Crunch Follows Kelp DAO Exploit
A sudden exploit involving Kelp DAO’s rsETH token triggered widespread concern across decentralized finance markets.
The attacker reportedly drained 116,500 rsETH, valued at about $292 million, from a LayerZero bridge. The stolen assets were then deployed in a strategy that strained Aave’s liquidity.
According to Coin Bureau, the attacker deposited the compromised rsETH as collateral on Aave V3. This move allowed the borrowing of nearly $236 million in wrapped ETH.
However, the rsETH backing those positions is now considered invalid, leaving the loans without proper collateral support.
As a result, Aave is facing an estimated $280 million in unrecoverable debt. The protocol’s ETH pool reached 100% utilization, meaning nearly all available liquidity has been borrowed. Users attempting to withdraw ETH encountered delays or were unable to exit positions.
Market reaction was swift, with large-scale withdrawals reported across the platform. Data suggests over $5.4 billion in ETH outflows occurred خلال the panic phase. High-profile withdrawals added to the pressure, including a reported 65,584 ETH withdrawal by Justin Sun.
This situation marks a major stress event for Aave’s risk management systems. It also serves as a real-time test for its Umbrella safety module, which is designed to handle extreme conditions. The unfolding events continue to draw attention across the crypto sector.
AAVE Price Faces Pressure After Failed Rally
Market data shows that AAVE experienced a sharp rejection after attempting a breakout toward the $115–$120 range. The price has since retreated to around $93.90 on the 4-hour chart. Despite a modest recovery within the session, broader momentum remains weak.
Earlier price action reflected a steady decline from the $120 region toward $90 levels. This phase was followed by a period of sideways consolidation between $92 and $102. The recent rally attempt failed to hold, leading to renewed selling pressure.
Technical indicators show a bearish short-term structure. The Relative Strength Index is currently at 34.55, approaching oversold territory but not fully there. Its position below the moving average suggests continued downward momentum.
At the same time, the MACD indicator remains in negative territory. The widening histogram signals sustained selling activity, with no clear crossover indicating a reversal yet. This aligns with the broader price rejection seen on the chart.
Key support is now concentrated around the $90 level, with $89.50 acting as a critical breakdown point. If this zone fails, the next downside targets could fall between $85 and $80. On the upside, resistance remains firm near $100 and higher around $110.
Traders are closely monitoring whether the price can stabilize above the current support levels. A rebound would require improving momentum signals and renewed buying activity. Until then, the market structure continues to reflect caution following the recent exploit.
TLDR:
- PEPE remains within a strong weekly demand zone, signaling possible accumulation despite an 88% correction from highs.
- A breakout above $0.000006 resistance could confirm trend reversal and open room for major upside targets.
- Historical fractal patterns suggest potential for explosive rallies if the current support structure holds steady.
- Failure to hold above $0.0000017 may invalidate the bullish setup and extend consolidation further.
PEPE traded near a major support zone after a steep correction, with price stabilizing around $0.00000376. The weekly structure showed a potential re-accumulation phase forming, as traders monitored whether the current demand area could sustain a recovery.
Weekly Accumulation Zone Draws Market Attention
The latest chart showed PEPE sitting within a high-confluence support region formed by a fair value gap, order block, and horizontal demand. This area ranged between $0.0000030 and $0.0000018, where price activity remained steady.
A tweet from Crypto Patel described this setup as a rare fractal structure, noting similarities with a previous accumulation phase. The post referenced a past 4,515% move that followed a similar pattern during the earlier cycle.
Price data confirmed that the current level aligned with historical consolidation zones before large upward expansions. The chart also showed price maintaining position above the lower boundary, which remained critical for structural stability.
At the same time, the analysis noted that invalidation would occur below $0.0000017. Holding above this level kept the accumulation structure intact, while a breakdown could shift the market into a deeper consolidation phase.
Resistance Levels and Price Structure Define Next Move
The chart marked a key resistance zone near $0.000006 to $0.000007123, where previous support turned into resistance. Price attempts to reclaim this level, which had failed during earlier retests following the breakdown.
Trendline analysis showed that two ascending supports were broken before the decline accelerated. Each breakdown was followed by rejection, forming a consistent pattern of lower highs across the weekly timeframe.
The chart also presented projected upside targets if the price breaks and holds above resistance. These targets ranged between $0.000028 and $0.0001, based on earlier expansion patterns.
At the same time, historical data showed projected moves of 3,079% and 5,592% during bullish cycles. These projections aligned with prior market behavior observed during strong upward phases.
Current price action remained below resistance, keeping the structure within a defined range. Short-term movement showed minor upward attempts, although no confirmed breakout had formed.
The chart also showed an 88.99% correction into the current zone, reflecting deep pullbacks seen in previous cycles. This retracement brought the price back into a demand area where accumulation had occurred before.
Traders continued to watch whether the price could reclaim the resistance level and confirm a shift in structure. Until then, the market remained within a consolidation phase defined by support holding and resistance capping upward movement.


Three wallets, one denial, and $5.7 billion in market cap gone in 48 hours.
RaveDAO’s RAVE crashed 90% over 24 hours as crypto exchanges Binance and Bitget opened investigations into the trading activity that catapulted the token to a $6 billion market cap last week.
Bitget CEO Gracy Chen confirmed the probe on X, and Binance co-CEO Richard Teng subsequently said the exchange was reviewing the matter and would “always” do its part to examine signs of market misconduct. Gate.io was also named in the original allegations from onchain investigator ZachXBT, who has offered a $25,000 bounty for whistleblowers with evidence of the parties involved.
The collapse accelerated after the project’s Saturday denial rather than stabilizing on it.
RaveDAO posted a six-part X thread stating the team “is not engaged in, nor responsible for, recent price action.”
The thread did not address any of the specific onchain allegations that prompted the scrutiny, including the concentration of roughly 90% of the 1 billion RAVE supply across three Gnosis Safe multi-signature wallets attributed to the team, or the millions of tokens transferred to exchanges shortly before the rally began.
The original rally took RAVE from about $0.25 to $27.33 in nine days, a 10,800% move that triggered $44 million in liquidations on Friday, just behind bitcoin and ether, with the bulk of them from short sellers positioned against the token.
Investigators flagged a “bait and liquidate” pattern in which visible token transfers to exchanges suggested incoming sell pressure, drawing traders into short positions before those tokens were withdrawn and prices ripped higher, forcing shorts to cover at progressively worse levels.
RaveDAO presents itself as a Web3 entertainment platform offering onchain ticketing for electronic music events, tracing its origins to a 2023 Istanbul afterparty. The project reported about $3 million in 2025 revenue and lists partnerships with Binance, OKX, Bitget, and Polygon.
RaveDAO’s thread did confirm the team plans to “liquidate portions of unlocked tokens” when appropriate to fund operations and marketing, and said it was “exploring appropriate models, including price-triggered or performance-triggered locks, that tie team incentives to ecosystem growth.”
It did not commit to any specific lockup mechanism or timeline, however.
Crypto World
Grayscale Files Spot TAO ETF as Bittensor Network Rebounds from Covenant AI Exit and 38% Drawdown
TLDR:
- Grayscale raised TAO weighting to 43.06% in its AI fund, its largest single-asset reallocation ever made.
- Community miners restored SN3, SN39, and SN81 from open-source code with no central operator involvement needed.
- Bitwise and Grayscale both filed TAO ETF applications on April 2, with an SEC decision tracked for August 2026.
- Teutonic targets a 1-trillion-parameter training run in May, timed with the ETF’s peak SEC review window.
Bittensor proved antifragile after a 38% drawdown triggered by Covenant AI’s sudden exit from three major subnets. Community miners restored SN3, SN39, and SN81 entirely from open-source code, with no central operator involved.
Around 70% of supply remained staked throughout the disruption. Spot outflows exceeded $70 million on multiple consecutive days after the crash.
Grayscale’s spot TAO ETF filing and a series of protocol upgrades are now drawing renewed attention to $TAO’s recovery case.
Grayscale’s ETF Filing and Institutional Moves Signal Confidence in Bittensor
Grayscale raised its TAO weighting to 43.06% inside its AI fund on April 7. That move marked the largest single-asset reallocation the fund has ever executed.
It came three days before the Covenant crash became public. The timing led observers to conclude that Grayscale had been running independent structural analysis on the network.
On April 2, Grayscale filed an S-1 Amendment for a spot TAO ETF on NYSE Arca. Bitwise filed a parallel TAO strategy ETF on the same day.
The SEC decision window is currently tracked for August 2026. However, market analysts note the repricing may not wait for formal approval.
Crypto analyst @Karamata2_2 pointed to Bitcoin and Ethereum as precedents for pre-approval price movement. Both assets moved significantly during their respective SEC review windows.
That pattern places the current filing period as a meaningful near-term catalyst. The $218–$240 demand zone remains the key structural level for $TAO to hold.
Supporting the institutional picture, GeneralTensor closed a $5 million funding round in March. The round was anchored by a Goldman-backed fund, with DCG also participating.
The TAO Institute launched on April 15 with a dedicated subnet risk index. Together, these moves reflect sustained institutional engagement despite the recent network turbulence.
Protocol Upgrades and Active Subnets Reinforce Bittensor’s Antifragile Case
BIT-0011, the Conviction Mechanism, is a core protocol upgrade shaping Bittensor’s next phase. Subnet founders and stakers lock alpha tokens to earn conviction scores across 30-day intervals.
The staker holding the highest score gains ownership of the subnet. Tokens locked during the active period cannot exit until the interval concludes.
The community restart of SN3, SN39, and SN81 without founder intervention served as a real stress test. Chain emissions and ownership routing continued without interruption throughout that period.
Karamata2_2 described the outcome as the best live demonstration of antifragility the network could have produced. BIT-0011 formalizes that model at the protocol level going forward.
Teutonic, formerly Templar, is targeting a 1-trillion-parameter decentralized training run for mid-to-late May. Should that milestone land during the ETF application’s most visible SEC review window, attention may return sharply.
The narrative shifts from a network that survived its biggest blowup to one that is still actively scaling. That framing matters most precisely because Covenant’s exit raised doubts about the technology’s depth.
Active subnets continue producing measurable output across the ecosystem. Chutes AI accounts for 14.39% of daily emissions and processes over 50 billion tokens per day, with a revenue-funded buyback already live.
TargonCompute co-authored an Intel TDX whitepaper and projects $10.4 million in ARR. With 128 active subnets expanding toward 256 and a subnet alpha market cap near $1.03 billion, Bittensor’s operational picture remains intact.
Crypto World
President Trump accuses Iran of ceasefire breach as Bitcoin reacts to market uncertainty


U.S. President Donald Trump has accused Iran of breaching a ceasefire agreement.
Summary
- Trump accused Iran of ceasefire violation following reports of activity in Strait of Hormuz.
- Iran denied allegations and claimed United States actions breached agreement under international law frameworks.
- Bitcoin price showed volatility, dropping from recent highs amid rising geopolitical uncertainty and market caution.
The claim follows reports that Iran opened fire in the Strait of Hormuz during the truce period.
Trump described the situation as a “serious violation” and warned that further action could follow if negotiations fail. He stated ”it will happen, one way or another” while referring to ongoing efforts to reach a resolution.
Despite the tension, Trump indicated that discussions are still active. He expressed confidence that a deal could be reached before the ceasefire deadline set for April 22.
Iranian officials responded by rejecting the accusations and placing blame on the United States. A spokesperson from Iran’s Ministry of Foreign Affairs stated that U.S. actions had breached the terms of the ceasefire.
The spokesperson said ”the blockade of ports is unlawful and violates international law” in a statement shared publicly. The response also referenced international legal frameworks, including provisions under the United Nations Charter.
Iran’s statement described the situation as escalating tensions rather than a one-sided breach. Both sides have continued to exchange claims, adding to uncertainty around the ceasefire status.
Bitcoin Price Reacts to Geopolitical Developments
Bitcoin has shown price movement in response to the developments. The asset declined from around $76,300 to near $75,500 as reports of renewed tension emerged.
Market data indicates that Bitcoin had earlier risen above $78,000 after initial reports suggested progress in negotiations. The reversal followed conflicting updates from both sides regarding the ceasefire.
Crypto markets often react to geopolitical events, with price swings linked to investor sentiment and risk perception during uncertain periods.
Moreover, the broader crypto market has also experienced volatility during the same period. Traders have adjusted positions as new information continues to emerge from diplomatic discussions.
Bitcoin remains sensitive to external developments, especially those linked to global stability and economic outlook. Market participants are monitoring updates related to the ceasefire and any potential policy response.
Price fluctuations have remained within a narrow range over the past sessions, reflecting cautious trading behavior. The situation continues to evolve as negotiations between the United States and Iran remain ongoing.
Disclosure: This article does not represent investment advice. The content and materials featured on this page are for educational purposes only.
Crypto World
France faces the brunt of an increasing violent crime wave against the crypto community


France is facing a rise in crypto-related kidnappings as so-called “wrench attacks” become more frequent, brazen and violent.
That shift was visible this week amid the staging of an annual international blockchain and crypto conference. A police motorcade escorted VIP guests to a dinner at the Palace of Versailles. And security was also notably reinforced at the Carrousel du Louver, where the conference was taking place.
Wrench attacks in France have put the country so notably under the international spotlight that government officials took the stage at the conference in Paris to acknowledge their alarm at the scale of the problem. They said that this year alone, the country has suffered at least 41 crypto-related kidnappings and home invasions. That’s one every two to three days.
Jean-Didier Berger, Minister Delegate to the Interior Ministry, said a new set of measures is being prepared with Interior Minister Laurent Nuñez to tackle the growing issue. A prevention platform has already drawn thousands of registrations, but authorities say further steps are needed as incidents continue to rise.
Wrench attack epicenter
The country has become the epicenter of a global rise in wrench attacks. Across multiple jurisdictions, attacks on crypto holders are becoming more frequent and more violent, according to security researchers and law enforcement data.
Globally, the trend is also on the rise. In 2025, there were 72 verified physical coercion incidents globally, a 75% increase from the previous year, according to Certik and crypto researcher Jameson Lopp’s data, which tracks 188 attacks since 2014. Many more go unreported, he said. Cases involving physical assault rose even faster, up 250% year-over-year.
The term “wrench attack” refers to the use of physical force to extract access to digital assets. For some attackers, it is easier to coerce a person than to break encryption.
“Every time a wrench attack is successful, it tells the world that crypto owners are juicy targets,” Lopp told CoinDesk.
Unlike traditional bank transfers, crypto transactions cannot be reversed. Once a victim authorizes a transfer under duress, the funds can be moved quickly across wallets and chains.
Attackers seek points of weakness
Researchers say the way attackers identify victims has also changed.
“We’re seeing a shift from ‘find a wallet’ to ‘hunt a person,’” Phil Ariss of TRM Labs told CoinDesk. Rather than scanning for technical vulnerabilities, attackers build profiles, he added. They look at social media activity, public appearances and leaked datasets. They track routines and identify points of weakness.
“The biggest avoidable mistake is tying real-world identity, location and routine too tightly to visible crypto wealth,” Ariss said.
The problem is exacerbated when attackers get a helping hand from government officials. In one widely known case, in which a French tax official sold wrench attackers sensitive data. The case raised concerns among security experts that insider leaks and compromised state data were feeding directly into wrench attacks.
The pool of potential victims has widened, with mid-level holders increasingly being targeted, sometimes based on limited or indirect signals.
Anybody is a potential victim
Cases now include families, with children targeted alongside crypto-holding parents, making the attacks harder to categorize by severity.
In January 2025, Ledger co-founder David Balland was kidnapped in France along with his partner. During the attack, one of his fingers was severed and sent to associates as part of a ransom demand. He was rescued after a police operation.
Other cases have involved prolonged captivity and torture, such as one in New York, where a crypto investor was held for more than two weeks. In Canada, a home invasion escalated into waterboarding and sexual violence as attackers attempted to force access to funds.
Lopp said both opportunistic and organized groups are involved, but there are signs of increasing coordination. “We do seem to be seeing more organized groups now,” he said.
TRM Labs’s Ariss says his team has observed similar patterns, noting some groups operate with defined roles and pre-planning, including surveillance and follow-home tactics.
“These look less like one-off robberies and more like small kidnap or robbery crews specializing in crypto jobs,” Ariss said.
After funds are obtained, attackers tend to move quickly and frequently the crypto assets they attain are converted into stablecoins and routed across multiple chains, making recovery more difficult.
France’s role in this trend may reflect a mix of factors, Lopp said, including cases involving leaked personal data and cross-border criminal networks.
Rising prices, heftier loot
More broadly, rising asset prices have increased the potential payoff from a single attack, while improvements in digital security have reduced the effectiveness of purely technical exploits.
“It’s far easier than trying to rob a bank,” Lopp said.
Another issue is visibility: wrench attacks might be significantly underreported because many are reported as standard robberies or home invasions, with no mention of crypto.
“A large share of incidents are still recorded as simple robberies,” Ariss said, adding that the crypto element is often left out at the time of reporting, which can make it harder for authorities to connect cases or identify broader patterns.
The increase in attacks has raised questions about the risks of self-custody, a core principle of cryptocurrency.
Some security experts point to measures such as multi-signature setups, withdrawal delays and spending limits as ways to reduce risk by limiting how much can be accessed under duress.
“If coercion cannot produce immediate access to the majority of funds, the risk and return changes,” Ariss said. Such measures do not eliminate the threat but may reduce the incentive for attackers.
As crypto adoption grows, attacks are becoming more frequent and severe, turning what was once a niche concern into a broader security risk.
TLDR:
- Bitcoin trades near $75K as ETF inflows exceed $1B weekly, reversing a four-month outflow trend
- Stable US jobs data and easing geopolitics support risk assets across crypto and equity markets
- Solana and Ethereum upgrades improve efficiency, supporting network growth and user activity
- Institutional moves and rising stablecoin supply strengthen liquidity across crypto markets
Global markets are moving in a steady range as equities reach new highs while Bitcoin trades near $75,000. At the same time, ETF inflows, policy signals, and network upgrades are shaping current crypto market conditions.
Liquidity Conditions and Capital Flows Drive Market Stability
Market activity reflects a shift toward risk assets as liquidity conditions improve across global markets. Stocks are recording fresh highs, while Bitcoin continues consolidating within a narrow price range near $75,000.
A recent post by Nick Research outlined the current drivers influencing both crypto and traditional markets. The tweet noted strong ETF inflows exceeding $1 billion weekly, ending a four-month outflow streak. It also pointed to easing geopolitical tensions and steady earnings supporting a risk-on environment.
These ETF inflows indicate renewed institutional participation in digital assets. Capital movement into Bitcoin products shows improving sentiment among large investors after a prolonged period of reduced exposure.
At the same time, macroeconomic data in the United States remains stable. Job growth has shown recovery, while unemployment levels remain relatively low. This stability continues to support investor confidence across markets.
Geopolitical developments are also playing a role in shaping sentiment. Reports of easing tensions linked to a possible Iran ceasefire are contributing to a more favorable risk environment.
Monetary policy expectations are shifting gradually. The Federal Reserve is expected to ease at a slower pace, with rates projected near 3% by year-end. Quantitative tightening has paused, easing pressure on liquidity conditions.
Bitcoin is also showing increased correlation with traditional markets. The asset is now moving closely with the S&P 500 and gold, reflecting broader macro alignment.
Institutional Activity and Blockchain Upgrades Support Momentum
Beyond macro factors, institutional actions and blockchain upgrades are shaping current market conditions. Regulatory developments remain active, with the CLARITY Act expected to move into Senate markup in the coming weeks.
Institutional involvement continues to expand within the crypto sector. Deutsche Börse has committed $200 million to Kraken, signaling continued engagement from established financial firms.
In addition, Goldman Sachs has filed for a Bitcoin ETF, adding to the list of institutional products targeting digital asset exposure. These filings show continued integration between traditional finance and crypto markets.
Network upgrades are also contributing to improved efficiency across blockchain ecosystems. The Solana SIMD-266 upgrade is expected to reduce data costs by up to 98%, improving network performance.
Ethereum is preparing for upcoming upgrades, including Pectra and Glamsterdam. These updates are designed to enhance scalability and maintain network competitiveness.
Supply conditions remain another factor shaping the market. The post-halving environment continues to limit Bitcoin supply, while stablecoin supply is expanding toward the $1 trillion level.
This growth in stablecoin supply reflects increasing liquidity within the digital asset ecosystem. It also supports trading activity and broader market participation.
Together, macro stability, institutional flows, and network upgrades are shaping current market direction. These elements are driving activity across both crypto and traditional financial markets.

The Exact Date Bitcoin May Bottom in 2026 (Ben Cowen Explains)
Pontyclun seal cup win in dramatic fashion as Wales star does his bit for cause

Aave records $6 billion TVL drop as Kelp hack exposes structural risk at DeFi lender

Why Israel is blocking foreign journalists from entering

Bitcoin: We’re Entering The Most Dangerous Phase

Alan Cumming Brands Baftas Ceremony A ‘Triggering S**tshow’
The Exact Date Bitcoin May Bottom in 2026 (Ben Cowen Explains)

Personal Loan, Home Loan, Business Loan Easily | Indi Sri Financial Associates #shorts #telugu #loan

PROOF CRYPTO PRICES ARE BEING SUPPRESSED! (TRUMP FAMILY DRAMA AND MORE)
-
 NewsBeat7 days ago
Pep Guardiola and Gary Neville agree over Arsenal title problem that benefits Man City
-

 Crypto World6 days ago
The SEC Conditionalises DeFi Platforms to Be Avoided for Broker Registration
-

 Fashion2 days ago
Weekend Open Thread: Theodora Dress
-

 Crypto World6 days ago
SEC Signals Exemption for Crypto Interfaces From Broker Registration
-

 News Videos4 days ago
Secure crypto trading starts with an FIU-registered
-

 Sports2 days ago
NWFL Suspends Two Players Over Post-Match Clash in Ado-Ekiti
-

 Crypto World5 days ago
SEC Proposes Certain Crypto Interfaces Don’t Need to Register as Brokers
-

 NewsBeat5 days ago
Trump and Pope Leo: Behind their disagreement over Iran war
-

 Politics2 days ago
Palestine barred from entering Canada for FIFA Congress
-

 Crypto World2 days ago
Russia Pushes Bill to Criminalize Unregistered Crypto Services
-

 Sports6 days ago
NWFL opens Pathway for new Clubs ahead of 2026 Season
-
 Business3 days ago
Creo Medical agree sale of its manufacturing operation
-

 Crypto World6 days ago
Trump whales load up ahead of Mar-a-Lago luncheon.
-

 Politics5 hours ago
Zack Polanski demands ‘council homes not luxury flats for foreign investors’
-
Business6 days ago
Kering slides after Morgan Stanley downgrade, Gucci woes loom
-

 Tech6 days ago
Google adds E2E encryption to Gmail for iOS and Android enterprise users
-
 Entertainment6 days ago
Brand New Day’ Footage Reveals the Devastating Impact of ‘Now Way Home’
-
Crypto World7 days ago
Sei Network Enters Quiet Reset Phase as On-Chain Metrics Signal a Slowdown in 2026
-

 Tech6 days ago
Apple glasses won’t go brand shopping like Meta did with Ray-Ban and Oakley
-
Entertainment6 days ago
How Euphoria Season 3 Premiere Paid Tribute to Eric Dane After Death
You must be logged in to post a comment Login