
Crypto World
Top Five Crypto Projects to Watch in 2026
The crypto industry is entering a cycle of adjustment that has shifted from speculative behavior to structural fundamentals due, in part, to the passage of major legislation such as the GENIUS Act in the United States and MiCA in the EU. This shift places greater weight on how individual networks generate revenue, manage supply, and attract sustained user activity.
As a result, investors are increasingly examining protocol upgrades, token mechanics, and real usage metrics when assessing long-term price potential rather than relying on short-term narratives. In practical terms, that means looking at projects with real traction – so here are five that could break out in 2026 based on trading ranges, on-chain usage, and adoption trends.
HYPE and the $100 Scenario
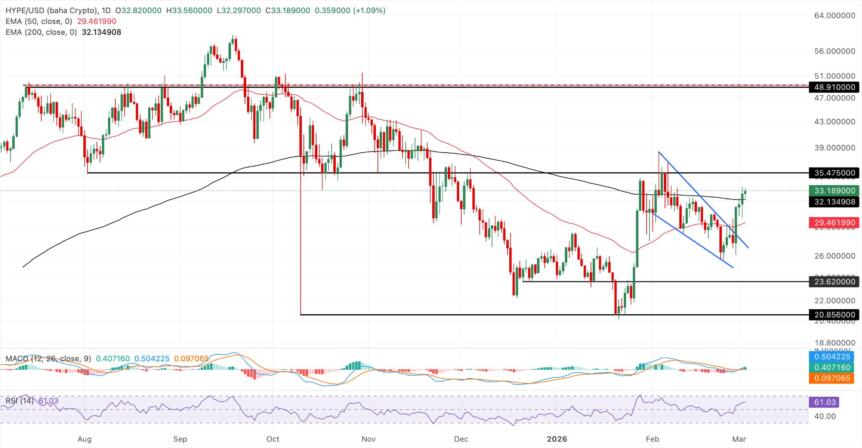
Hyperliquid recently announced the HIP-3 upgrade, which adds gold and silver to the list of assets it covers. These changes helped the price of its native HYPE token rise to about $33. Some market watchers are suggesting it can eventually fly past its current all-time high of just under $60 and hit as much as $100 in 2026.

Looking at HYPE’s technical picture above reinforces this constructive fundamental view. For example, the 50-day exponential moving average is trending higher and could soon cross above the 200-day EMA. That would form a “golden cross,” a pattern many analysts view as a bullish buy signal.
Furthermore, the MACD has extended above its signal line on the daily chart, meaning there is increasing bullish momentum. The RSI is also around 60, which suggests strong buying pressure but still leaves room for more upside before the asset starts to look overbought.
But reaching $100 would require more than just price expansion. It would mean that volume growth, buybacks, and burns would continue, and there would be deeper liquidity across tokenized assets on Hyperliquid.
If the platform maintains its lead in on-chain derivatives and successfully integrates more institutional-grade margin tools, the token could consolidate its value. And based on its current volume profile, facilitating $2.6 trillion worth of trades in 2025, and market penetration, a move toward $100 before year-end is within the boundaries of fundamental growth – assuming the ecosystem continues to attract high-liquidity markets.
BNB’s $2,000 Target
Ranked as the fourth-largest cryptocurrency by market cap, BNB was trading near $640 as of this writing, nearly 54% off its peak. However, from a technical standpoint, the asset is showing early signs of stabilization after a downtrend that began toward the end of January.

The 10- and 20-day exponential moving averages were of special interest, with TradingView data showing them flattening out while the RSI climbed higher for the first time in several weeks. That implies the selling pressure may be reducing, with the reversal leading some supporters to suggest that the next bull run will push BNB to $2,000.
Price forecast estimates indicate that BNB is expected to increase gradually over time, with a near-term price target of $610 and an expected average price of $640–$820 at approximately the mid-point of the forecast horizon.
Analyst Duo Nine supports this scenario and anticipates the first price target for BNB will be just below $700. If that level is reclaimed, the market watchers believe $900 will be the threshold.
However, reaching $2,000 in 2026 would require that the BNB Chain register more activity on-chain, and there would also need to be more clarity about how regulators treat tokens linked to exchanges.
Solana to $300
A strong run at the tail end of last year gave traders hope that 2026 could be the year Solana (SOL) finally hits the $300 milestone.
The coin’s narrative revolves around withstanding change in the market and keeping a loyal developer base focused on high-throughput applications. According to recent data, the network has the second-largest market share in DeFi and has at times had more 24-hour DEX trading volume than Ethereum.
Over the past week, SOL has gained more than 9%, outpacing the broader market. According to chartist Ali Martinez, the coin is currently range-bound, with support at $76 and resistance around the $90 level. A move above $90 would signal a potential shift toward upside continuation, with analyst Crypto Patel suggesting last month that once SOL outgrows its corrective phase, it could go past $300, even hitting $500 or $1000.
But to reach these elevated price points, there needs to be continued development, a stable network with solid performance, and wider Layer 1 infrastructure usage, driven by the clarity of the regulatory environment in key markets.
However, it must also be noted that Ethereum and other fast chains remain highly competitive, and outages, as seen in the past, could also impact SOL’s risk profile, making it more difficult to pass the record-breaking price milestone.
Uniswap’s $20 Projection
The case for Uniswap (UNI) climbing to $20 was strengthened on December 25, 2025, when tokenholders voted to flip the protocol’s fee switch, allowing a portion of its revenue to be used for a buy-and-burn program.
The move means that some of Uniswap’s profits are now being used to raise the value of UNI, and the results have been clear: the token has gone up more than 17% in the last week, bringing it to just under $4.00, according to CoinGecko.
Another indicator to consider is Uniswap’s market cap to TVL ratio. UNI currently holds the 37th spot in terms of market cap, with a value of around $2.5 billion. Meanwhile, DefiLlama puts the platform’s TVL at $3.12 billion, giving a ratio of 0.81 and indicating that UNI is quite undervalued.

With the token’s worth now tied to measurable revenue and supply reduction, and given that fundamentals have not been priced in, there is some upside potential that could push UNI to $20. This is more so, given that Uniswap recently won full dismissal of a scam token class action lawsuit, with the judge ruling the platform cannot be held liable for the misconduct of third-party token issuers.
WFI to Reach $100?
WFI is the native token of the WeFi ecosystem, which is building core infrastructure for a fully on-chain financial system and decentralized on-chain banks (deobanks). Crowned as the digital bank of the year for 2025 by Finance Feeds, WeFi has pushed WFI’s strong performance in the market.
The initiative offers its users the opportunity to manage their own crypto assets and use numerous services related to conventional banking, such as payment processing, fund transfers across borders, and savings account options.
According to data from CoinGecko, WFI has had an eventful 12 months, gaining well over 400% in the timeframe, which pushed it to a new all-time high of $3.00 in January 2026.

That yearly rise stands in sharp contrast to Bitcoin, Ethereum, and Ripple’s XRP, which are all heavily in the red for the same period.
If WeFi keeps growing its user base, and corporate stablecoin settlements expand as management anticipates, WFI’s demand profile could change materially, taking it from $3 to $20, $50, and potentially $100 in 2026.

Crypto World
Taurox (TAUX) Pre-KYA Opening Announcement Secures Renewed Interest From (Ripple) Investors

XRP trades near $1.32. April has recorded the highest average monthly returns for XRP since 2014 at 24.8%. The OCC final rule took effect on April 1, enabling Ripple’s conditionally approved National Trust Bank to move forward with expanded digital asset custody operations, while the Senate Banking Committee markup of the CLARITY Act remains scheduled for the second half of the month.
Taurox, an AI-driven trading protocol, is equipped to respond to these developments through autonomous agents that deliver diversified, risk-managed returns to stakers.
Handling XRP Supply Dynamics and Regulatory Timelines with Taurox’s Methodical Framework
XRP faces ongoing pressure from the April 1 escrow release of 1 billion tokens combined with regulatory milestones, resulting in moderate volatility and repeated 20-30% price movements for holders despite institutional progress. Taurox presents a steadier solution by uniting deposits of USDT, BTC, or XRP inside one central trading pool guided by autonomous agents. These agents are created by an international network of developers, quants, and AI engineers to achieve reliable proportional profits.
Each agent is limited to no more than 2% of total pool assets to reduce concentration risk, with KYA tiers ensuring strategies stay within conservative, moderate, or aggressive categories. Demanding Sharpe ratios of at least 1.5 and drawdown limits below 15%, Taurox generates more consistent outcomes than direct asset ownership or standard hedge funds that charge 2% management fees under any market circumstance.
Early Agent Submission Portal Open: Accelerating Strategy Integration
Taurox recently achieved an important roadmap acceleration by launching the Pre-KYA Registration Table. This gateway enables developers, quants, and AI specialists to submit trading agents early, before the full Know Your Agent framework activates. Early registrants gain front-of-line access to the Proving Ground for quicker testing and faster capital deployment. They also qualify for additional rewards from the Agent Creator Fund, which accounts for 10% of total TAUX supply. Strategists with proven systems now have a prime window to secure early positioning inside the Taurox ecosystem.
Taurox Operational Framework: AI Strategies with Layered Risk Protections
Taurox collects staker contributions into one central trading pool and issues txTokens valued at the current net asset value per share, starting at $1.00. The protocol reserves 15% of assets in stablecoins to support liquidity and allocates the balance through a performance-weighted system. Agents implement strategies such as statistical arbitrage using secure on-chain vaults or limited-access CEX accounts.
Before activation, each agent completes evaluation in the Proving Ground with sponsor capital until it satisfies statistical thresholds, such as a minimum of 500 trades for high-frequency approaches. Protective measures consist of 2% daily loss limits, 5% single-trade exposure caps, and an automatic 5% pool-wide drawdown halt. Gradual reallocation procedures help prevent abrupt liquidations, and KYA classification confirms that agents adhere strictly to their designated risk parameters within a transparent and auditable structure.

TAUX Economic Model: Capped Supply Enhanced by Systematic Burns
TAUX maintains a fixed supply of 2 billion tokens with no possibility of additional minting after launch, removing any dilution risk. In contrast to standard hedge funds, Taurox imposes no base fees and retains only 5% of gross profits, acquired directly on the open market. Thirty percent of this revenue is sent permanently to a dead address for burning, while seventy percent is directed to the DAO treasury.
The remaining profit share follows a tiered model that prioritizes stakers, allocating 80% for returns between 0-20% and reducing progressively to 43% once returns surpass 300%, with all calculations based on high-water mark net gains. Allocations assign 40% to the presale, 15% to ongoing block-by-block staking rewards, 10% to milestone-based agent incentives, and 5% to the team under a six-month cliff vesting schedule.
Taurox Presale Progress: Entry Opportunity with Defined Growth Projections
The Taurox Presale has advanced into Phase 4 and surpassed $950K raised. TAUX is currently available at $0.018. Phase 4 participants can expect nearly 4.5x upside at listing when the token debuts at $0.08. If the protocol reaches a $1 billion pool, early backers could realize up to 103x returns with TAUX at $1.85. A $500 investment today would grow to roughly $2,220 at listing and approach $28,000 at the $1 valuation.
The presale includes a one-month cliff and 20% monthly releases from months two to five, allowing immediate staking while limiting early transfers. Combined with 30% revenue burns, tiered profit sharing, 15% staking rewards, and an 8% security allocation, it presents attractive potential across both near-term and extended horizons.
Final Assessment: Taurox Establishing Reliable Yield Mechanisms in Dynamic Markets
Taurox integrates advanced AI autonomy with rigorous on-chain risk protocols and a built-in deflationary mechanism to establish a new benchmark in decentralized finance. Supported by contributions from developers around the world and sustained by ongoing token burns, the protocol maintains a clear path for measured growth as the need for consistent and transparent yield generation increases across market cycles.
Learn More
Buy TAUX: https://taurox.io
Whitepaper: https://docs.taurox.io/
Official Telegram: https://t.me/tauroxlabs
Official X/Twitter: https://x.com/TauroxProtocol
Disclaimer: This is a Press Release provided by a third party who is responsible for the content. Please conduct your own research before taking any action based on the content.


Kwasi Kwarteng, the UK’s former Chancellor of the Exchequer who served just weeks in September 2022, is re-emerging with a new focus on bitcoin, monetary history, and long-term economic thinking.
Reflecting on the infamous mini-budget in an interview with CoinDesk, he was candid about the missteps. “The mini budget was literally two weeks after we took office, it was just very, very rushed business,” he said, referring to the period immediately after taking office on Sept. 6, followed by the death of Queen Elizabeth II two days later. The compressed timeline left little room for coordination or scrutiny. The fallout was severe, sending gilt yields sharply higher and helping expose the UK’s Liability-Driven Investment pension crisis.
Kwarteng still defends the intent behind the policy, warning the UK is now stuck in a fiscal “doom loop” where “you’re spending more money than you can raise in taxation,” and rising taxes ultimately “kill incentives in the economy.”
He also criticised the short-termism dominating both politics and markets. “Everything’s quarterly driven, people are either euphoric or freaking out. And actually, you’ve got to take a longer view.”
That longer view now shapes his thinking on bitcoin and money more broadly. While in office, he said, “the Treasury, the Bank of England are certainly aware of bitcoin and digital assets, but its still incredibly small,” highlighting what he sees as the UK’s reluctance to embrace innovation.
He also pointed to a cultural gap with Europe, noting Paris is becoming “quite forward leaning on digital assets.”
Kwateng also pushed back on criticism from Boris Johnson, after the former prime minister claimed Bitcoin was a “Ponzi,” arguing instead for a more open-minded view of emerging forms of money.
A new bitcoin treasury venture
Now involved with UK bitcoin treasury firm Stack BTC (STAK) as executive chairman, Kwarteng is putting those ideas into practice, with the company holding 31 BTC on its balance sheet.
The firm has drawn increasing political attention, with Reform UK leader Nigel Farage taking a 6% stake in the company.
For Kwarteng, the shift reflects a move away from reactive policymaking toward what he sees as a more resilient monetary future grounded in long-term thinking.
Crypto World
The Infrastructure Behind the Next Era of Capital Markets Is Being Built on Chainlink and Swift

TLDR:
- Swift completed a tokenized bond interoperability trial with BNP Paribas, Intesa Sanpaolo, and Société Générale using Chainlink.
- Chainlink CCIP enabled cross-chain settlement of tokenized assets across 12+ major financial institutions including Citi and BNY Mellon.
- AI models achieved nearly 100% data consensus on corporate actions records validated through the Chainlink Runtime Environment.
- GLEIF and Chainlink partnered to deliver verifiable, cross-jurisdictional identity and compliance tools for institutional blockchain transactions.
Chainlink is building the infrastructure behind the next era of capital markets through a series of landmark partnerships and technical milestones.
Working alongside Swift, DTCC, Euroclear, and dozens of major financial institutions, the platform is connecting traditional finance with blockchain networks.
From tokenized bond settlements to AI-powered corporate actions processing, the groundwork for a new financial system is taking shape across both legacy and emerging infrastructure.
Connecting Traditional Finance to Blockchain Networks
Swift, the messaging standard connecting over 11,500 financial institutions across 200+ countries, recently completed a major digital asset interoperability trial.
The initiative involved tokenized bond transactions with BNP Paribas Securities Services, Intesa Sanpaolo, and Société Générale (FORGE).
It demonstrated how Swift can orchestrate tokenized asset transactions across blockchains and existing enterprise systems.
This trial marks a turning point in how traditional banking infrastructure interacts with distributed ledger technology.
The foundation for this milestone was laid through earlier collaboration between Swift, Chainlink, and UBS Asset Management. That work demonstrated cross-chain settlement of tokenized assets using existing Swift fiat payment rails.
More than 12 world-leading financial organizations participated, including Citi, BNY Mellon, Euroclear, Clearstream, and Lloyds Banking Group. The results established a replicable framework now being extended across Swift’s global network.
Chainlink’s Cross-Chain Interoperability Protocol (CCIP) serves as the technical backbone enabling settlement across public and private blockchains. Banks can now access on-chain environments while operating within familiar Swift messaging standards.
This removes the need for institutions to rebuild existing infrastructure from the ground up. Instead, blockchain connectivity becomes an extension of systems already trusted by thousands of institutions worldwide.
At Sibos 2024, Chainlink Co-Founder Sergey Nazarov presented these capabilities to capital markets participants. The showcase demonstrated how Swift integration with blockchains works through existing standards and Chainlink infrastructure.
Institutions can streamline interoperability without sacrificing the compliance frameworks they already operate within. This approach directly addresses one of the most persistent barriers to institutional blockchain adoption.
As part of the Monetary Authority of Singapore’s Project Guardian, Swift, UBS Asset Management, and Chainlink went further. They demonstrated the issuance and settlement of tokenized funds using traditional Swift fiat payment rails.
Digital asset transactions settled through infrastructure already used by institutions across more than 200 countries. That proof of concept confirmed that tokenized finance and conventional payment systems can operate as one unified layer.
Building a Shared Data Foundation for Capital Markets
At Sibos 2025, Chainlink and 24 of the world’s largest financial institutions announced Phase 2 of their corporate actions initiative. Partners include Swift, DTCC, Euroclear, UBS, and Wellington Management.
The phase introduces a production-grade system with new data attestor and contributor roles assigned to trusted institutions. These roles allow participating organizations to validate and enrich AI-extracted corporate actions records with verifiable accuracy.
The Chainlink Runtime Environment (CRE) managed the orchestration of multiple AI model outputs throughout the testing period. Confirmed results were converted into ISO 20022-compliant messages and delivered through the Swift Network.
At the same time, Chainlink CCIP distributed identical records across DTCC’s blockchain ecosystem and additional chain environments. Post-trade systems, smart contracts, and custodians could all access the same data simultaneously.
During testing, AI models reached nearly 100% data consensus across all evaluated corporate actions records. The system processed multilingual disclosures written in Spanish and Chinese, broadening its global coverage across jurisdictions.
Cryptographic attestation by designated institutions created a verifiable chain of custody for each corporate action. Data accuracy for confirmed records reached 100%, establishing a new reliability standard for the industry.
This infrastructure produces what the initiative calls an on-chain golden record. It functions as a real-time, attested source of truth accessible by both blockchain platforms and traditional financial systems.
Tokenized equities can now reference the same confirmed data across public and private chains. That synchronization creates the conditions for greater automation across on-chain markets going forward.
The Global Legal Entity Identifier Foundation (GLEIF) extended this infrastructure further through a strategic partnership with Chainlink. Their combined solution integrates GLEIF’s verifiable Legal Identity Identifier with Chainlink’s Cross-Chain Identity and Automated Compliance Engine.
Institutions can now verify asset provenance, enforce compliance policies programmatically, and meet regulatory requirements across multiple jurisdictions. Taken together, these layers of infrastructure form the backbone of a capital markets system built for the era ahead.
The era of buying bitcoin and calling it a treasury strategy is over.
By early 2026, more than 200 publicly listed companies hold digital assets on their balance sheets, collectively managing over $115 billion (DLA Piper, October 2025). The total market capitalization of these companies reached approximately $150 billion by September 2025 – a nearly fourfold increase from the year before. Yet several of these companies now trade at discounts to the value of the assets they hold. The market is sending a clear signal: accumulation alone is no longer enough.
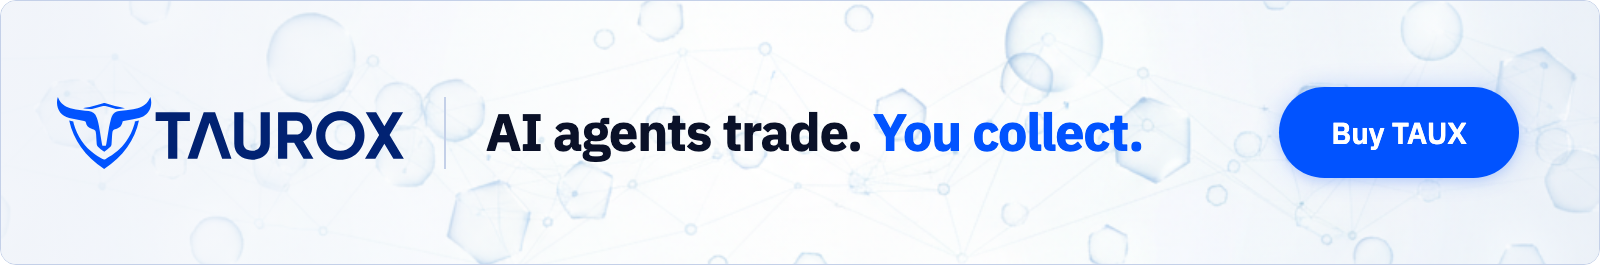
Investors want to see capital discipline and economic return. Management teams have responded with share repurchase programs and transparency metrics such as “BTC per share,” designed to show the value a treasury adds beyond the token price (AMINA Bank Research, 2026). The shift from passive accumulation to active yield generation – from “DAT 1.0” to “DAT 2.0”—is now the defining theme of the sector.
Three broad models are emerging. Each carries a different risk – return profile and places distinct demands on governance, technical capability and infrastructure.

Infrastructure participation and staking
The most protocol-native approach involves staking tokens to support network consensus and earning rewards in return. For bitcoin-focused treasuries, this increasingly extends to the Lightning Network and other native infrastructure that generates routing and liquidity-based fees. Staking requires careful analysis of the technical security and smart contract risks.
The numbers have grown quickly. Bitmine Immersion Technologies reported over 3 million staked ETH by early 2026, with total holdings of $9.9 billion and annualized staking revenue of approximately $172 million (SEC Filing, March 2026). Its proprietary validator network marginally outperformed the Composite Ethereum Staking Rate, demonstrating the edge that institutional-grade infrastructure can deliver even in a protocol-level yield environment.
SharpLink Gaming deployed $200 million in ETH into restaking infrastructure via EigenCloud, targeting higher yields by securing applications ranging from AI workloads to identity verification (SEC Filing, 2025). Restaking – where already-staked ETH is used to secure additional services, with careful governance.

Active trading and market-driven income
A second set of strategies leverages market structure – funding-rate arbitrage, basis trading and options premiums. These can be effective and often market-neutral, but they demand trading expertise, robust risk controls and round-the-clock monitoring. The governance implications are significant: this approach effectively converts a treasury function into a trading operation. Like any trading function, it can be difficult to find skilled staff required to monitor complex positions and correlation risks.
One prominent Japanese listed company illustrates both the potential and the complexity. Holding over 35,000 BTC by the end of 2025, it generated the equivalent of approximately $55 million in bitcoin income revenue through option-based strategies, with operating profit growth exceeding 1,600% year-on-year. Yet the same company recorded a substantial net loss due to non-cash mark-to-market revaluations under local accounting standards (TradingView; Kavout, 2026). For investors, this disconnect between operational cash flow and reported earnings makes evaluation materially harder – and underscores why governance and transparency matter as much as headline returns.
Galaxy Digital offers a contrasting hybrid model, combining its own digital asset treasury with institutional services including collateralized lending, strategic advisory, and infrastructure. In Q3 2025, Galaxy posted a record adjusted gross profit of over $730 million (Mint Ventures Research, 2025). Notably, the firm has diversified its yield sources beyond pure crypto by repurposing its Helios mining facility as an AI compute campus secured by long-term contracts – a signal that the most resilient treasuries may be those that derive income from multiple, uncorrelated sources.

Credit deployment and net interest margin
A third route treats digital assets as productive balance-sheet capital. The model involves borrowing against crypto holdings on a non-recourse basis, receiving stablecoin liquidity, and deploying it into higher-yielding private credit. It preserves long-term exposure to the underlying asset while generating recurring interest income from short-duration, real-economy lending. In particular, this strategy demands expertise in yield, credit risk and fixed income.
The mechanics draw directly from traditional banking: liquidity management, underwriting, governance and controlled leverage. Under this type of model, a company acquires bitcoin, borrows against those holdings on a non-recourse basis—meaning the downside is limited to the collateral—and deploys the proceeds into diversified private credit portfolios supporting real-economy lending. If bitcoin appreciates, the company retains the upside after repaying the loan, combining potential capital gains with recurring interest income.

For credit deployment models to work credibly, they need to be grounded in operational financial infrastructure rather than built from scratch. The approach is most effective when it extends from an existing platform with real lending relationships and established client accounts. In our view at Greenage, this is also an area where governance and due diligence frameworks are particularly important, given that capital is being deployed into third-party credit opportunities that must be assessed on a counterparty-by-counterparty basis.
The success of this model is also tied to the maturation of stablecoins as institutional infrastructure. By 2026, stablecoins underpin cross-border payments, real-time settlement and T+0 clearing (same-day settlement) for enterprises (Foley & Lardner, January 2026). Coinbase Institutional projects total stablecoin market capitalization could reach $1.2 trillion by 2028 (Coinbase Institutional, August 2025). For credit deployment strategies, stablecoins provide a sound medium for capital deployment in lending markets.

The new measure of maturity
Recent market conditions have reinforced a simple truth: price appreciation alone is not a treasury strategy. The growing range of yield solutions reflects a sector learning from its own history—sustainable income generation makes digital assets more productive components of a corporate balance sheet.
No single model is definitive. The most effective treasuries will blend approaches depending on risk appetite, operational capability and governance structure. But the direction of travel is clear. Passive holding is no longer sufficient to justify digital assets’ place on the balance sheet. Yield is becoming the central measure of treasury maturity –and the core factor in how the market values companies with digital asset exposure.
The winners in this next phase will not be the largest holders. They will be the most disciplined operators.

Important Notice:
This article has been prepared by Greengage & Co. Limited for informational and thought leadership purposes only. It is intended solely for use by businesses, professional counterparties and institutional market participants and is not directed at retail consumers. It does not constitute financial advice, investment advice, a financial promotion, or a recommendation or inducement to buy, sell, or hold any asset, security, or financial instrument.
Digital assets are subject to significant price volatility and regulatory change. Past performance is not indicative of future results. All investments carry risk, including the potential loss of capital. Forward-looking statements and market projections referenced herein are sourced from third-party research and do not represent the views or predictions of Greengage & Co. Limited.
Greengage & Co. Limited is not authorized or regulated by the Financial Conduct Authority for investment business. Greengage acts solely as an introducer to independent third-party service providers and does not arrange investments, provide lending, custody, or investment management services.
Readers should seek independent professional advice before making any investment decision.

Prediction markets are pushing into Asia’s largest economies even as local gambling laws impose strict limits on traditional betting activities. The region’s combination of scale, active retail participation, and limited local alternatives creates a compelling case for prediction markets to grow, though regulatory risk remains a defining factor.
That dynamic mirrors a broader pattern in crypto where technology often outpaces licensing and oversight. Polymarket, one of the fastest-growing platforms, is already recording weekly volumes above $1 billion and has added Chinese-language support. New entrants like PredicXion are betting that region-focused events will help unlock adoption in markets where localization matters just as much as the product itself.
Yet Asia’s landscape is fragmented and legally intricate, with access, language, and regulation not always aligning with the sector’s global ambitions. As platforms push forward, the legal framework—rather than technology—could ultimately shape how quickly prediction markets scale in the region.
Key takeaways
- Asia’s largest economies show robust demand for prediction markets, but India’s heavy taxation on undisclosed gains and China’s outright ban on crypto activities create a complex regulatory backdrop.
- Japan and South Korea—two leading crypto markets in Asia—maintain strict gambling rules, which narrows access yet leaves room for localized efforts and experimentation.
- Polymarket remains a reference point for the model, with weekly volume surpassing $1 billion and expansion into Chinese-language support, while regional players like PredicXion emphasize Asia-centric events.
- Regulatory classification—whether these platforms are treated as gambling, information markets, or financial instruments—will largely determine their future in Asia and beyond.
Asia’s market pull and regulatory headwinds
GDP scale matters in the appeal of prediction markets. In 2024, major Asian economies such as China, India, Japan, and South Korea ranked among the world’s top five by gross domestic product, underscoring why the region is a focal point for growth in data-driven prediction tools. While India and China do not have explicit frameworks addressing blockchain-based prediction markets, both maintain restrictive environments for crypto. India imposes heavy taxation on gains, while China enforces an outright ban on several crypto activities, including trading and mining.
South Korea’s example is particularly instructive: it is one of the world’s largest economies by GDP, and its won (KRW) consistently features among the most active fiat currencies in crypto markets. Kaiko’s data highlight the KRW’s prominence in on-chain trading activity, a reminder that local currency liquidity can play a pivotal role in any regional expansion of prediction markets.
From a market perspective, Korea is often cited as a fertile ground for retail crypto adoption. Yet the local market’s gambling laws create a nuanced environment for prediction-market operators. Heechang Kang, co-founder of research firm Four Pillars, told Cointelegraph that while the Korean market could offer significant opportunities, platforms must address audiences beyond Western-focused themes to achieve broader traction.
The regulatory lens: gambling vs information markets
The regulatory question is at the heart of Asia’s prediction-market push. In several markets, authorities classify activities tied to wagering on uncertain outcomes as gambling, a category that is tightly controlled or prohibited outside state-run frameworks. Andy Cheung, founder and CEO of PredicXion, stresses that this creates a “significant concern” for operators operating in jurisdictions where gambling rules are opaque or stringent.
Despite these realities, some analysts argue that prediction markets are not simply gambling. Jaewon Kim, a researcher at Four Pillars, has framed the distinction around output: gambling is a closed loop of bets against a house, while prediction markets aggregate collective expectations about real-world events. Kim noted that during the 2024 U.S. presidential election, prediction markets gained traction and, in some cases, proved more accurate than polls or expert forecasts, underscoring the informational value they can offer beyond pure wagering.
China’s strict online policy complicates access, with many users turning to VPNs to reach platforms like Polymarket. However, this circumvents controls rather than resolves the legal risk, and authorities’ stance on whether prediction-market-like activity falls under gambling or a distinct information-market category remains unsettled. In Korea and Japan, regulators have yet to issue clear guidance specific to blockchain-based prediction markets, but both countries maintain rigorous gambling restrictions that can constrain user participation and operator growth.
Localized platforms, regional focus, and the path forward
Against this backdrop, Asian-anchored platforms are emphasizing localization as a core strategy. PredicXion is attempting to tailor markets toward events familiar to Asian retail audiences, seeking to avoid directly traversing heavily restricted markets where possible. Cheung notes that in several jurisdictions, operators must navigate a maze where wagering on uncertain outcomes is often treated as gambling, potentially limiting the range of acceptable products and geographies.
Polymarket’s approach illustrates the regional tension between global platforms and local realities. The platform has returned to activity levels comparable to those seen during the U.S. presidential election, a signal of resilience in a market where regulatory clarity remains uneven. Its expansion into Chinese-language support aims to widen accessibility, while its presence in Asia continues to test how far a global model can travel when local rules push back.
At the same time, the industry’s argument that prediction markets offer value beyond wagering hinges on their ability to aggregate real-world expectations. Jaewon Kim’s assessment points to an informational utility that could align with regulated financial-like instruments if policymakers converge on a workable classification. The question for investors and builders is whether regulators will carve out a distinct lane for prediction markets as information markets or keep them tethered to gambling frameworks with narrow licensing pathways.
In practice, the next steps will be defined by regulatory decisions across Asia’s largest economies. Platforms that can demonstrate responsible governance, transparent operation, and robust consumer protections may find a path forward even as others retreat to clearer, more tightly controlled markets.
As Asia weighs these choices, observers should watch regulatory statements and licensing developments in India, China, Korea, and Japan—along with evolving cross-border approaches to information markets. The outcome will shape not just where prediction markets can operate, but how they are structured, marketed, and perceived by everyday users seeking to gauge the pulse of real-world events.
Crypto World
Ripple Joins SWIFT’s Certified Partner Program, Gaining Access to a $150 Trillion Network
TLDR:
- Ripple Treasury is officially listed in SWIFT’s Certified Partner Program and confirmed on both directories.
- Banks using Ripple Treasury can now access SWIFT’s Alliance Lite2 messaging network directly.
- Ripple’s platform supports SWIFT, EBICS, SFTP, APIs, combining legacy and blockchain rails in one.
- Rather than replacing SWIFT, Ripple positions itself as the bridge between old and new finance.
Ripple has officially joined SWIFT’s Certified Partner Program, marking a notable shift in how the blockchain payments company positions itself within the global financial system.
Rather than replacing SWIFT, Ripple Treasury now operates as a certified partner inside the network. This move gives banks access to both legacy and blockchain payment rails through a single platform.
The development has drawn renewed attention to Ripple’s long-term strategy in the institutional payments space.
Ripple Treasury Gains Direct Access to SWIFT’s Messaging Network
Banks using Ripple Treasury can now connect to SWIFT’s Alliance Lite2 messaging network directly. They no longer need separate SWIFT infrastructure to access the network. This is confirmed on both Ripple’s partner page and SWIFT’s official partner directory.
Through this integration, users also get access to SWIFTRef data inside the platform. This covers IBAN lookups and ABA routing lookups built into payment workflows. These tools are standard requirements for institutions processing cross-border transactions daily.
Ripple Treasury supports multiple connectivity options alongside SWIFT. These include EBICS, SFTP, APIs, and alternative networks. Together, they give financial institutions a flexible, consolidated payments infrastructure under one platform.
One Platform Now Bridges Legacy Banking and Blockchain Rails
The integration positions Ripple as a bridge between traditional finance and blockchain-based payments. Banks no longer face a binary choice between old and new systems. Both options are now available through a single interface.
SWIFT processes approximately $150 trillion in transactions annually. Ripple now sits within that network while also developing its own blockchain payment alternative. This dual positioning is a calculated move in a competitive institutional market.
For banks, the practical outcome is reduced operational complexity. Connecting to two separate systems traditionally required significant infrastructure investment. With Ripple Treasury’s SWIFT certification, that barrier is considerably lower.
The development represents a maturation in how blockchain companies approach institutional adoption. Instead of positioning purely as a disruptor, Ripple has taken a complementary route.
That strategy may prove more effective in driving real-world adoption among regulated financial institutions.
Chainlink has released 17.875 million LINK tokens valued at approximately $165 million in its scheduled quarterly unlock, according to on-chain data.
Of the newly unlocked supply, 14.875 million LINK, worth about $125 million, was transferred directly to the Binance cryptocurrency exchange. Market analysts note that such heavy inflows into exchanges typically signal anticipated sell-side activity.
Whale Interest in LINK Rises Despite Bearish Price
Blockchain analyst EmberCN explained that Chainlink moved the remaining 4.125 million tokens, valued at roughly $40.1 million, to a multi-signature wallet that distributes staking rewards.
While this incentivizes network participants, it creates a circular economic challenge. Chainlink inflates its supply to pay stakers, diluting the underlying value those same stakers are attempting to capture.
This structural inflation is taking a toll on the token’s market performance. Data from BeInCrypto shows a nominal 0.83% gain to $8.67 over the past 24 hours.
However, LINK has declined 7% over the past month and plunged 60% over the previous six months.
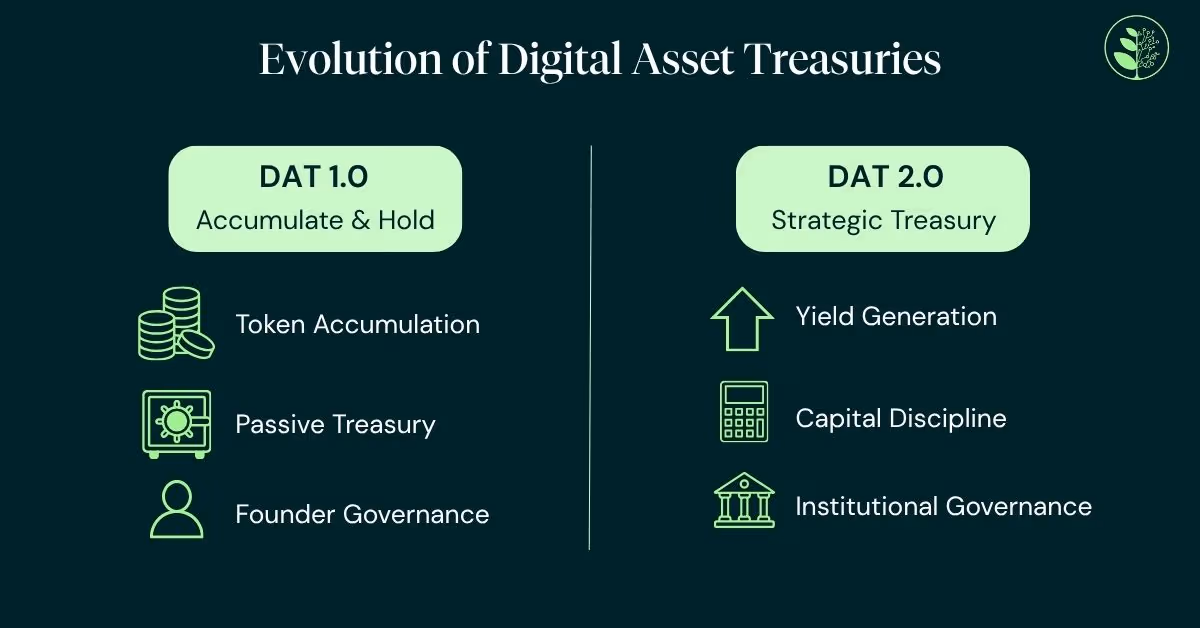
Despite the bearish price action, blockchain analytics firm Santiment reports a 25% increase in the number of whale wallets holding 1 million or more LINK over the past year. The total number of these large-tier addresses has grown from 100 to 125.
Santiment interpreted this accumulation as smart money quietly positioning for a market reversal, saying:
“This may not seem like it has much correlation with price while Bitcoin and all of crypto has remained in a bear cycle… But when markets flip positive once again, look for assets that whales have quietly been flocking to.”
This is unsurprising, considering Chainlink is widely considered an essential infrastructure for the crypto industry.
Over the past year, it has established pilots with global entities like Swift, Mastercard, and J.P. Morgan for tokenized assets and cross-chain functionality.
Ultimately, Chainlink appears to be winning the race to build enterprise blockchain infrastructure, but its retail and institutional investors are losing the battle against structural dilution.
Until the broader market sees a material reduction in quarterly exchange distributions or a direct mechanism linking institutional utilization to public token demand, the asset’s valuation faces a difficult recovery.
The post Massive Chainlink Token Unlock Sparks Sell-Off Fears appeared first on BeInCrypto.
A Nevada judge has extended a court-ordered halt on Kalshi’s ability to offer event-based contracts to residents in the state, ruling that the products fall under unlicensed gambling as defined by Nevada law. In a Friday hearing in Carson City, Judge Jason Woodbury granted a preliminary injunction sought by the Nevada Gaming Control Board, barring Kalshi from letting Nevadans place bets on outcomes ranging from sports to elections and entertainment without a gaming license, according to Reuters.
The injunction builds on a temporary restraining order issued on March 20, which will stay in place through April 17 while the court considers longer-term restrictions. Kalshi, which operates from New York, contends that its contracts are financial derivatives—specifically swaps—that should be overseen exclusively by the Commodity Futures Trading Commission (CFTC).
Key takeaways
- Nevada extends a ban on Kalshi’s event-based contracts, blocking trading in the state without a gaming license.
- The judge frames Kalshi’s contracts as functionally indistinguishable from traditional sports betting, effectively classifying them as gambling under state law.
- Kalshi argues the products are CFTC-regulated swaps, setting up a clash between state gaming authorities and federal market regulators.
- The CFTC has signaled it will defend its regulatory remit over prediction markets in court against state challenges.
- Regulatory pressure is broadening, with Utah moving to block Kalshi and similar platforms, underscoring a shifting legal landscape for prediction markets in the U.S.
Nevada’s ruling and Kalshi’s legal position
During the hearing, Judge Woodbury described Kalshi’s contracts as essentially mirroring the mechanics of licensed sports betting. He stated that, no matter how one frames the product, placing a wager on a game outcome via Kalshi is “indistinguishable” from traditional gaming activity and thus requires a Nevada gaming license. Reuters characterized the judge’s comments as a strong alignment with the board’s position that Kalshi’s offerings violate state gaming statutes.
The court’s decision reinforces a broader pattern of state regulators scrutinizing prediction markets, with Nevada’s action marking the first time a state has obtained a court-enforceable ban on Kalshi. Kalshi has argued that its contracts are swaps—financial instruments that should fall under federal oversight by the CFTC rather than state gaming commissions. The dispute illustrates a central tension in U.S. financial-regulatory policy: whether prediction markets should be treated as gambling, derivative trading, or something in between subject to multiple layers of regulation.
Regulatory backdrop: CFTC’s stance and the broader market implications
At the federal level, the CFTC has maintained that it has jurisdiction over prediction markets and has signaled it is prepared to defend that authority in court against state challenges. In a recent industry appearance, CFTC Chair Rostin Behn emphasized the potential value of prediction markets as “truth machines”—markets where financial incentives are aligned to reveal more reliable signals about future events than traditional polling. The department’s posture suggests a willingness to push back against state-level attempts to curb or reinterpret the scope of what constitutes a regulated market in this space.
The Nevada decision comes against a backdrop of growing state action targeting prediction-market-style bets. In nearby Utah, lawmakers advanced legislation aimed at classifying proposition-style bets on in-game events as gambling, effectively blocking Kalshi and similar platforms in the state. While Utah’s move is separate from Nevada’s court action, it signals a broader regulatory trend that could constrain operators seeking to offer event-based contracts across multiple jurisdictions.
What this means for traders, investors, and builders
For participants who once considered Kalshi’s offerings as a way to hedge uncertainty around events, the Nevada ruling highlights the volatility of a regulatory landscape that remains unsettled at the state level. The outcome could influence where Kalshi and other prediction-market platforms search for licenses, or whether they pivot to offer alternative products that fit within existing regulatory frameworks. Investors and developers alike should monitor both state actions and federal court challenges, as a ripple effect could shape pathway approvals, compliance costs, and the speed at which new markets might emerge in regulated environments.
From a market-structure perspective, the clash underscores a growing complexity for platforms that rely on real-money participation tied to outcome-based events. If regulators ultimately converge on a uniform approach—whether to treat such markets as gambling, as regulated derivatives, or under a hybrid framework—the regulatory timeline and required safeguards will determine how quickly participants can access these products in major markets.
What to watch next
The Nevada case remains open as the court continues to consider longer-term restrictions beyond the current injunction. Key questions include whether Kalshi can secure the necessary gaming licenses in Nevada, how the company will position its product as it navigates state-by-state licensing regimes, and how federal authorities will respond to continued state-level challenges. In parallel, lawmakers in other states may push forward with legislation that redefines the legal boundaries of prediction markets, potentially accelerating a more unified approach—or further fragmenting access across the United States.
Readers should stay tuned for court updates, as well as any statements from the CFTC or Kalshi on the evolving regulatory posture. The next phase will likely clarify whether prediction markets survive within a patchwork of state licenses and whether federal guidance or court rulings will ultimately steer the sector’s regulatory trajectory.


A Nevada court has moved to keep Kalshi out of the state’s event-contract market while the legal fight continues.
Summary
- Nevada judge backed regulators and said Kalshi’s event contracts are no different from sports betting.
- The ruling extends Kalshi’s Nevada ban while the court reviews longer-term restrictions through April 17.
- The case deepens the clash between state gambling laws and federal oversight claims over prediction markets.
The ruling came after the Nevada Gaming Control Board asked the court to block the company from offering contracts tied to sports, elections, and entertainment outcomes.
The case adds to a wider debate over whether prediction market contracts fall under federal derivatives law or state gambling rules. Kalshi has said its products are financial contracts, while Nevada regulators have argued that the offerings match gambling activity under state law.
Judge Jason Woodbury said he would grant a preliminary injunction against Kalshi at a hearing in Carson City. According to Reuters, the order prevents the company from allowing Nevada residents to trade event contracts without a gaming license.
The move extends a temporary restraining order issued on March 20. That order will stay in effect through April 17 while the court completes the next steps in the case.
Kalshi had argued that its contracts are “swaps” and fall under the oversight of the Commodity Futures Trading Commission. The company has maintained that federal law gives the CFTC authority over these products.
The judge did not accept that position. Reuters reported that Woodbury said buying a contract tied to a game result is the same as placing a wager through a sportsbook. He said, “No matter how you slice it, that conduct is indistinguishable.”
State regulators score early court win
The ruling marks the first time a state has secured a court-enforced ban that is currently active against Kalshi. That gives Nevada an early legal win as more states question prediction markets tied to sports and similar events.
Utah has also moved against the sector. Lawmakers there passed a bill last month that classifies proposition-style bets on in-game events as gambling and seeks to block such products from platforms including Kalshi and Polymarket.
The dispute also comes as the CFTC continues to defend its role in prediction markets. CFTC Chairman Michael Selig said last month that the agency is ready to fight in court to protect its jurisdiction from states and other regulators.
Selig also described prediction markets as “truth machines” during an industry conference. He said markets where users risk money on outcomes can offer a clearer signal about future events than opinion polls, setting up a sharper clash between federal oversight claims and state gaming laws.

Anthropic confirmed it will block Claude subscription access for third-party AI agent tools, including OpenClaw, effective April 5 at 12 pm PT.
The policy shift forces thousands of developers who built autonomous workflows on flat-rate Claude plans to either pay API token rates or migrate to competing models.
Why Anthropic Cut OpenClaw From Claude Subscriptions
Boris Cherny, Anthropic’s Head of Claude Code, announced the restriction, indicating that subscriptions were never designed for the heavy usage patterns generated by third-party agentic tools.
“Capacity is a resource we manage thoughtfully, and we are prioritizing our customers using our products and API,” he said.
The economic mismatch had been growing for months. Agentic loops in OpenClaw can consume millions of tokens in a single session.
A single afternoon of automated debugging could burn through enough tokens to cost upwards of $1,000 at standard API rates, Skypage making $200 flat-rate subscriptions deeply unprofitable for Anthropic.
Anthropic offered subscribers a one-time credit equal to their monthly plan cost, discounted usage bundles, and full refunds for those who cancel.
Developer Backlash and Migration Signals
The response has been quick, with some users already canceling their subscriptions. The general sentiment is that the decision is an admission that Anthropic cannot compete with open-source agents.
“No thanks. Subscription canceled. New models have already been configured,” wrote one user.
Developer Alex Finn called it a “massive mistake” and predicted local models would match Opus 4.6 performance within six months.
He outlined a hybrid setup using Claude Opus as orchestrator with Gemma 4 and Qwen 3.5 for execution, costing roughly $200 monthly.
Others criticize Anthropic for gaslighting users, arguing that the company initially blamed usage patterns before admitting it was prioritizing its own products.
Users want published token budgets for each subscription tier and advance notice of future policy changes.
A Dual Strategy Takes Shape
The timing reveals a broader Anthropic play as the company expands its Microsoft 365 connector to all Claude plans, including Free.
The integration connects Claude with Outlook, SharePoint, OneDrive, and Teams, Microsoft positioning it directly against Microsoft Copilot’s $30-per-user monthly pricing.
OpenClaw creator Peter Steinberger recently joined OpenAI, VentureBeat, adding competitive tension to the decision.
Anthropic has been building Claude Cowork as an alternative to third-party agent tools, and this restriction steers users toward that product.
Whether the cost of lost developer trust outweighs the infrastructure savings remains the open question heading into Q2 2026.
The post AI Fallout Begins as Claude Creators Cut Off Their Most Powerful Users appeared first on BeInCrypto.

US envoys Witkoff and Kushner could visit Ukraine, Kyiv says

Taurox (TAUX) Pre-KYA Opening Announcement Secures Renewed Interest From (Ripple) Investors

Trump just said Iran has 48hrs until he ‘reigns hell’ on them

Smart energy pays enters the US market, targeting scalable financial infrastructure

Why Israel is blocking foreign journalists from entering

Bitcoin: We’re Entering The Most Dangerous Phase

These tips changed my life #PersonalFinance #financialliteracy #EduTok #finance
![BITCOIN IS ABOUT TO DROP !!! [Bear Flag Confirmed]](https://wordupnews.com/wp-content/uploads/2026/04/1775318607_maxresdefault-80x80.jpg)
BITCOIN IS ABOUT TO DROP !!! [Bear Flag Confirmed]

Say This Prayer When You Need Financial Breakthrough #jesus #prayer #christianyoutube #holyspirit
-

 NewsBeat2 days ago
Steven Gerrard disagrees with Gary Neville over ‘shock’ Chelsea and Arsenal claim | Football
-

 Business2 days ago
No Jackpot Winner and $194 Million Prize Rolls Over
-

 Fashion22 hours ago
Weekend Open Thread: Spanx – Corporette.com
-
Entertainment5 days ago
Fans slam 'heartbreaking' Barbie Dream Fest convention debacle with 'cardboard cutout' experience
-

 Crypto World3 days ago
Gold Price Prediction: Worst Month in 17 Years fo Save Haven Rock
-

 Tech6 days ago
The Pixel 10a doesn’t have a camera bump, and it’s great
-
Crypto World4 days ago
Dems press CFTC, ethics board on prediction-market insider trades
-
 Entertainment7 days ago
Lana Del Rey Celebrates Her Husband’s 51st Birthday In New Post
-

 Tech6 days ago
Avatar Legends: The Fighting Game comes out in July and it looks pretty slick
-

 Sports4 days ago
Tallest college basketball player ever, standing at 7-foot-9, entering transfer portal
-

 Tech4 days ago
EE TV is using AI to help you find something to watch
-

 Business3 days ago
Login and Checkout Issues Spark Merchant Frustration
-

 Fashion7 days ago
Amazon Sundays: Soft Spring Layers
-

 Tech6 days ago
Elon Musk’s last co-founder reportedly leaves xAI
-

 Fashion5 days ago
The Best Spring Trends of 2026
-

 Tech4 days ago
How to back up your iPhone & iPad to your Mac before something goes wrong
-

 Tech5 days ago
Apple will hide your email address from apps and websites, but not cops
-

 Politics5 days ago
Should Trump Be Scared Strait?
-

 Crypto World5 days ago
U.S. rule change may open trillions in 401(k) funds to crypto
-

 Tech5 days ago
Flipsnack and the shift toward motion-first business content with living visuals
You must be logged in to post a comment Login