


Connect with us

Crypto World

Tornado Cash developer Roman Storm’s retrial delayed to April 2027

Published

on

Tornado Cash developer Roman Storm’s retrial delayed to April 2027

Tornado Cash developer Roman Storm’s retrial delayed to April 2027

Judge Katherine Polk Failla adjourned the retrial in light of Storm’s pending motion for acquittal and related request for a continuance.

Source link

Continue Reading
Click to comment

You must be logged in to post a comment Login

Leave a Reply

Crypto World

Why I Stopped Fighting AI in My Classroom and Started Teaching With It

Published

on

Why I Stopped Fighting AI in My Classroom and Started Teaching With It

At a recent academic retreat I attended, the air was thick with what I can only call educational gaslighting. A panel of graduate and undergraduate students looked a room full of professors in the eye and claimed they only used AI to verify their work because they valued learning too much to take shortcuts. Minutes later, when the answers were blind, those same students estimated that over 80% of their peers were using the technology for nearly everything.

As an engineering professor at the University of Michigan, I believe we need to move past the fear and hype. The future job market will not be dominated by autonomous AI, but by experts who have mastered their field so thoroughly that they can use it to multiply their output exponentially. 

But how do we help students become experts if they don’t show up? 

This question precedes the LLM onslaught. Since the pandemic, traditional lecture attendance has cratered, but active learning has been shown to significantly improve both turnout and long-term retention

Advertisement

By evolving my courses to embrace this data, I’ve seen attendance surge, even in the freeze of a Michigan winter. 

Flipping the lecture cycle

Classically, engineering courses default to hours of lectures where students are expected to take notes, with problem sets and exams bolted on. Many students treat a lecture as passive entertainment. And, often, the material is so technical that it is disconnected from real-world use, leading to even less engagement and retention. 

To break this cycle, I’ve flipped my classroom. Each week, I assign a 2-hour recorded video lecture, along with a related article. The assignments are made in Perusall, an AI-enabled tool that treats the video and article a bit like a social network. Students are graded based on their active engagement with the material, such as how much of the lecture they view, what questions and comments they leave in the system, and so on. I can monitor which students leave comments, answer peer questions, and engage with the material before they ever set foot in my classroom. And if they try to cut and paste comments in multiple locations, the system flags them. It does not yet flag comments that seem AI-generated, but I expect that will be coming soon.

Advertisement

With everyone primed to dig in, only one-third of my students’ time with me is devoted to classic lecturing. I offer a one-hour live lecture and invite industry guests to share stories of computer vision in the wild. Then my students spend the rest of our in-person time participating in small breakout sessions, a large group discussion, and an in-person quiz. Not only do they grade their own quizzes, but they only get credit for an answer if one of them argues the logic behind it.

The result? My students show up to class because the value is no longer in the information I provide—it’s in the friction and growth of live exchange.

This fall, I’m taking this a step further. We won’t just read technical papers; we will debate them. Anyone can be called to the front of the room to spontaneously argue one side of a research argument, which means every student must come prepared.

By moving the passive learning to the home and continuously pushing students to test their knowledge, I’ve reclaimed the classroom to create what AI cannot replicate: spontaneous, high-stakes human interaction.

Advertisement

Using AI as a supercharged tutor

As we try to understand how AI can help and hinder learning, the most dangerous misconception is that it is a labor-saving device for the mind. In reality, AI is an expertise-amplifier that can turn weeks of manual programming into a few hours of focused work. But for a novice, relying on AI before mastering the fundamentals creates a technical debt that leads to a lack of depth.

As someone at the forefront of AI research and creation, I don’t coach my students to avoid it, but rather I use it as a sophisticated, one-on-one tutor that facilitates active learning and helps them grow their expertise. This means moving beyond passive consumption and toward a rigorous, iterative process of trial, error, and refinement.

Some best practices I share with my students include:

Advertisement

Mastery-First Workflow: Solve problems manually first. Then use AI to check your work and identify where your logic diverges from the model.

AI as a Problem-Generator: One of the most effective ways to learn is through constant testing. Use AI to generate new practice problems and engage in active learning.

Brain Dump Standard: Never ask AI to write from scratch. Instead, provide a brain dump of ideas and structure. After the AI helps organize your expertise, personally refine it through meticulous review or even rewrite, if necessary.

Redefining the honor code in the age of AI

Advertisement

I am not an AI police officer. I cannot—and should not—spend my academic career hunting for digital shortcuts in my students’ work. I can only set the boundaries and allow them to choose how they show up. 

Amid the promise of AI to supercharge the work of experts, we must treat this technology with the same proactive mastery we apply to any other essential tool of modern life. 

By shifting the focus to high-stakes, spontaneous human interaction and leveraging AI for active learning rather than trusting it to do the work, educators can ensure that the knowledge lives within the student, not just the model.
Source link

Advertisement
Continue Reading

Crypto World

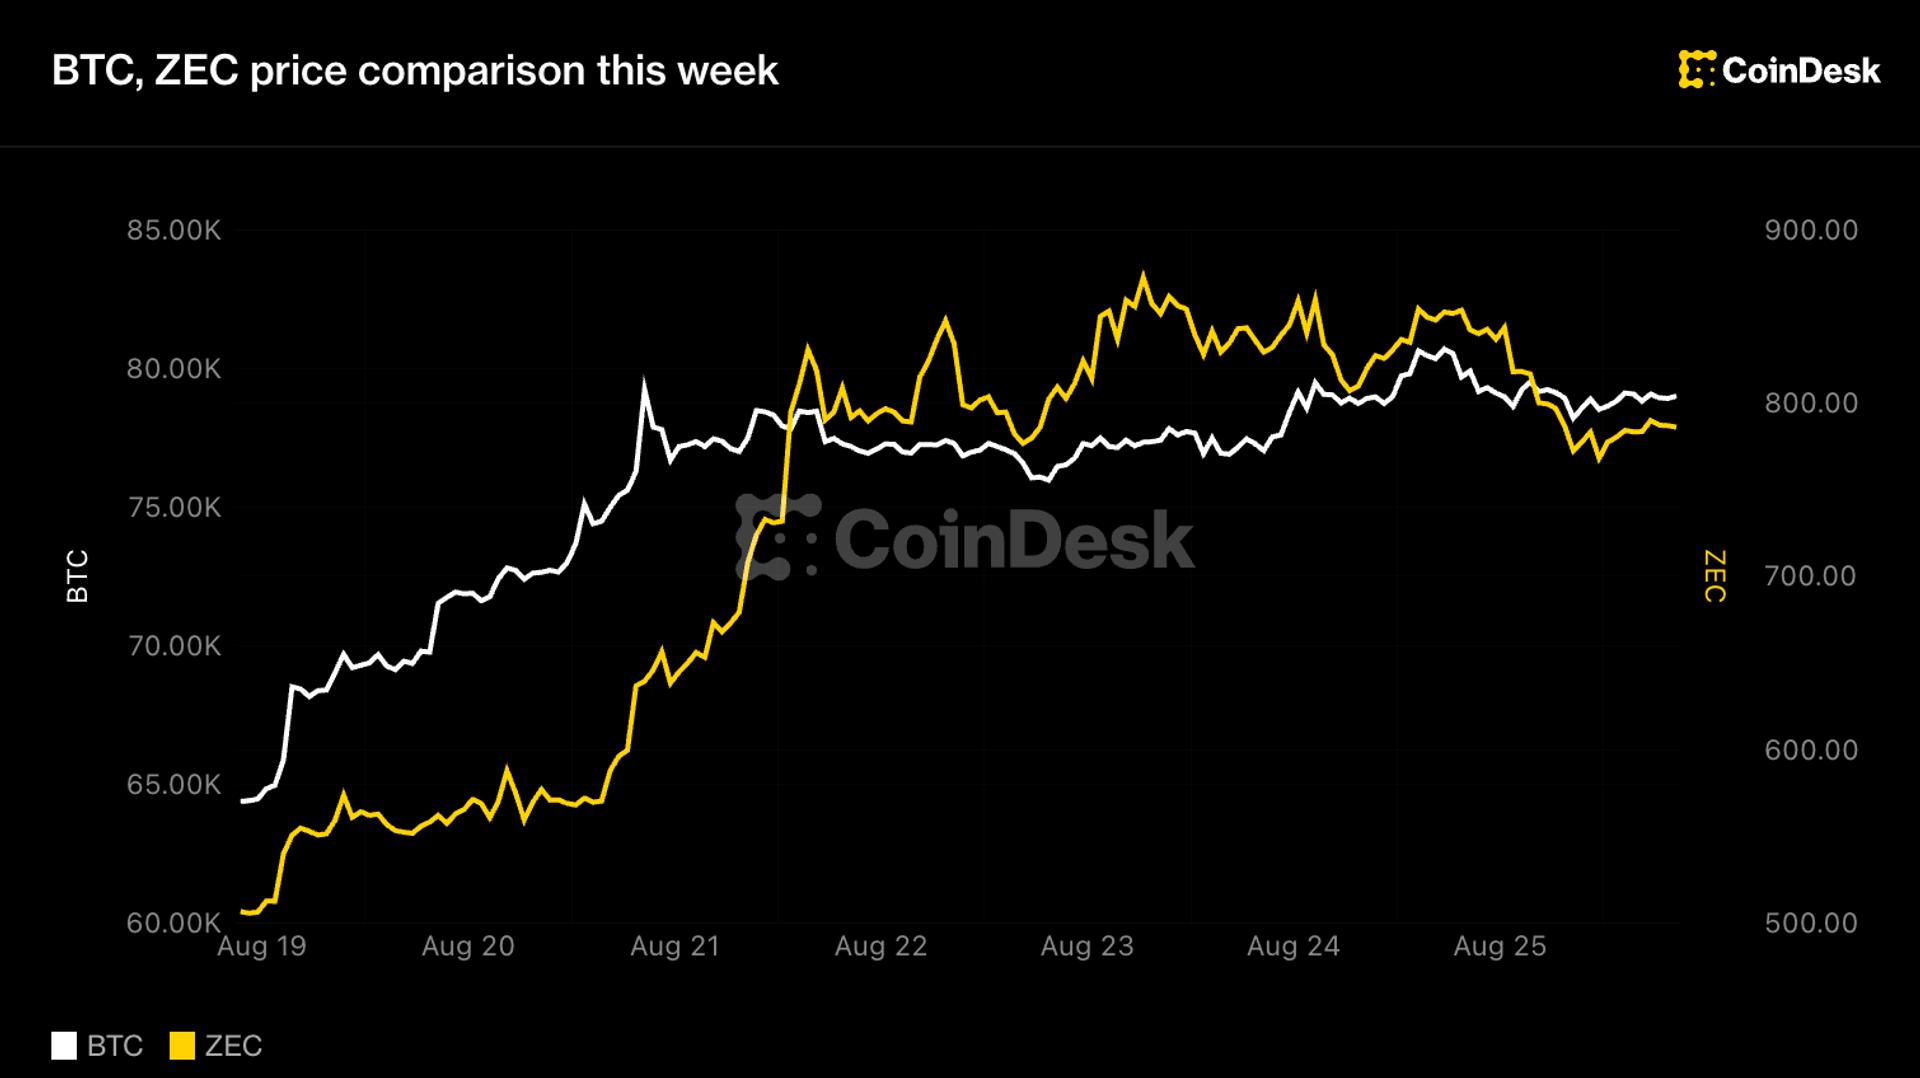
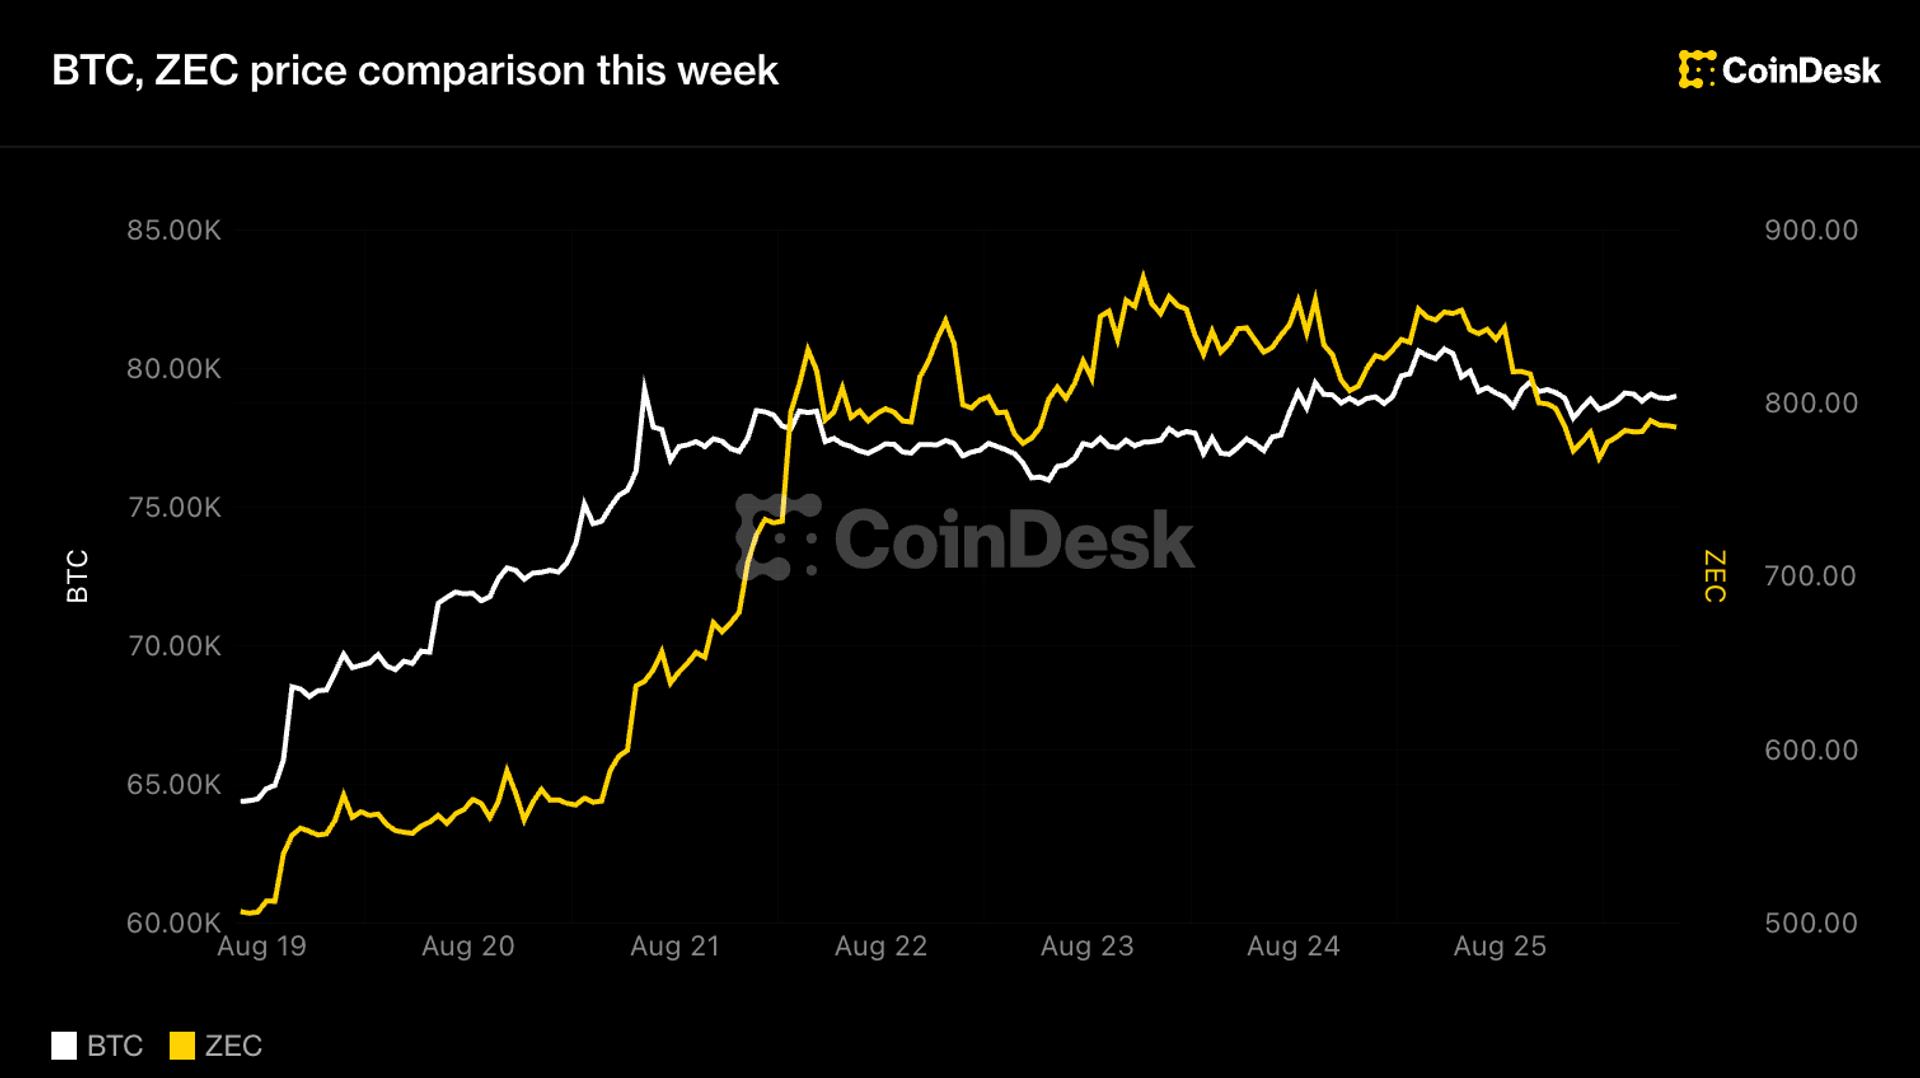
Live updates: Zcash pulls back 8% as its Grayscale ETF goes live, capping a 60% rally

Published

on

Live updates: Zcash pulls back 8% as its Grayscale ETF goes live, capping a 60% rally


The privacy coin’s spot ETF began NYSE trading Tuesday, which was one of the catalysts behind its surge to an eight-year high. Now traders are selling the news, with leverage stacked into the move.

Source link

Continue Reading

Crypto World

Bitcoin Breakout Could Hit $83,000 After 22% Rally, But 3 Risks Remain

Published

on

Bitcoin Divergence And Fading Volume

Bitcoin (BTC) price is up 22% in a week and nearing another breakout, and this one looks more dangerous than the last.

That last breakout came on August 19 and ran on trapped bears. The setup now is the reverse, with crowded longs and supply stacked overhead.

Momentum Runs Ahead of Price as Bitcoin Stays Down in 2026

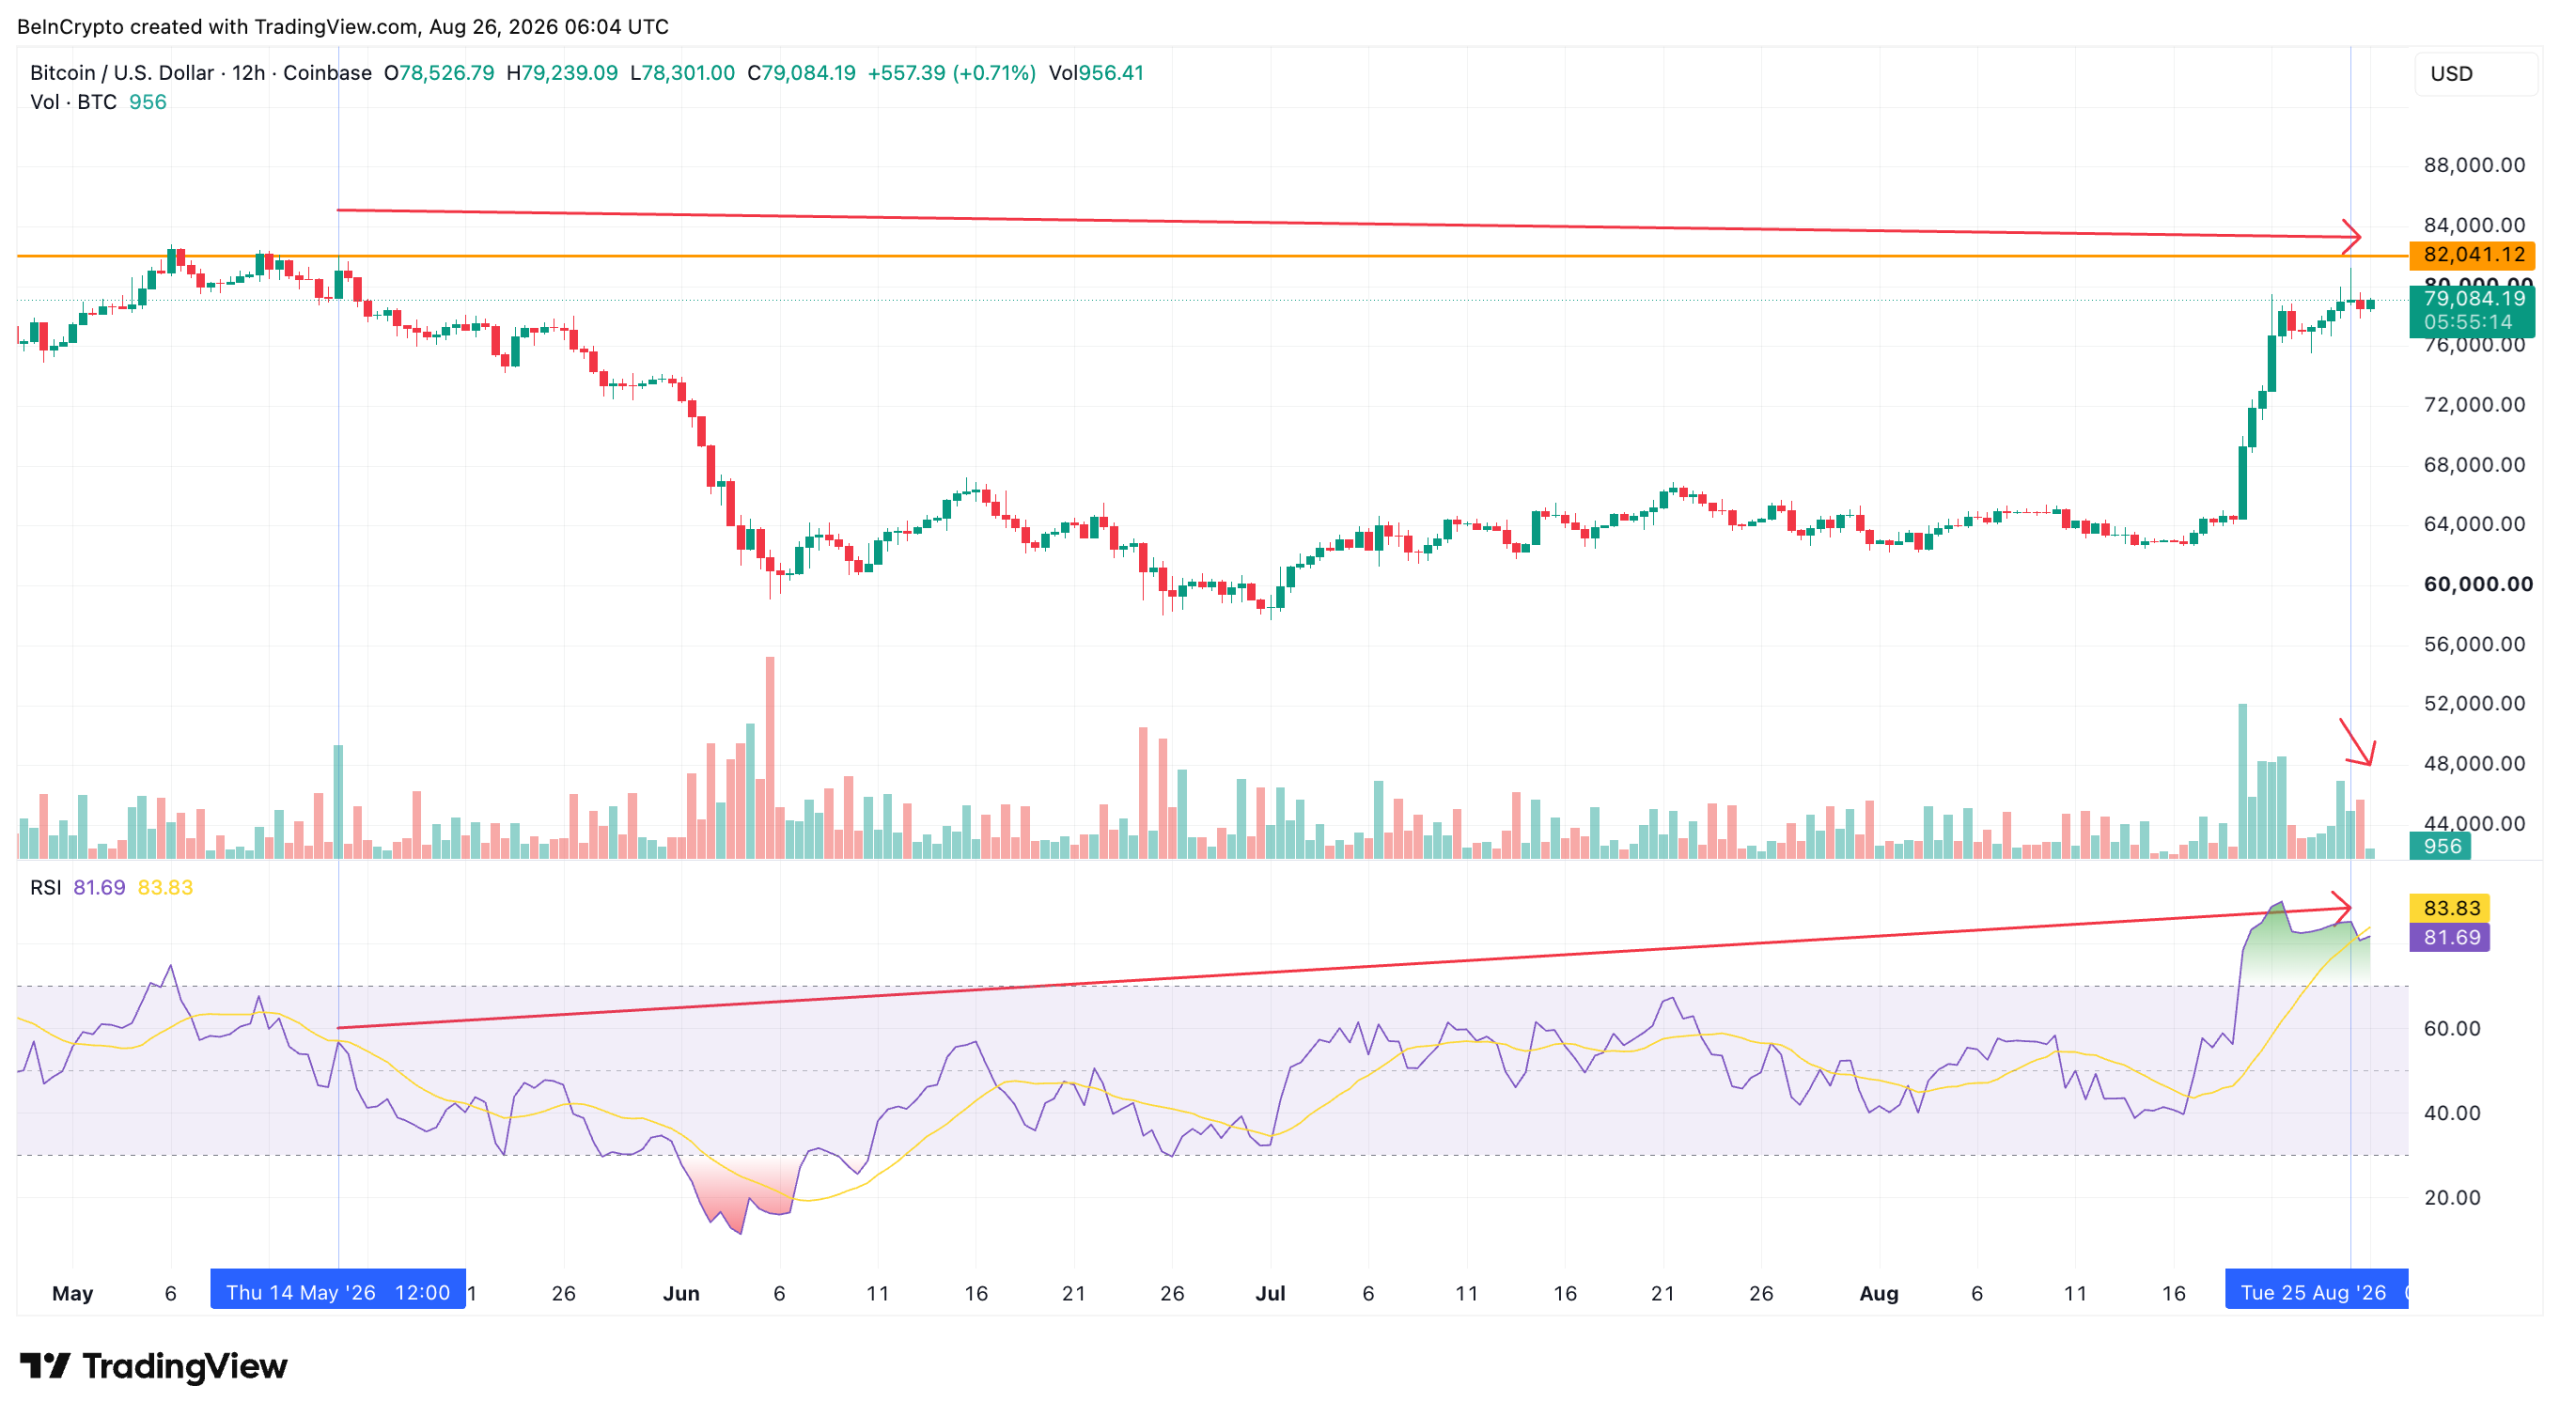
Between May 14 and August 25, Bitcoin price carved a lower high on the 12-hour chart. The Relative Strength Index (RSI), a momentum gauge that tracks how fast price rises or falls, made a higher high.

That mismatch is a hidden bearish divergence. It does not call a top. It warns the older downtrend may resume.

Advertisement
Bitcoin Divergence And Fading Volume
Bitcoin Divergence And Fading Volume: TradingView

Volume backs it. Buying has thinned since Bitcoin cleared $70,000 on August 19, and RSI at 81.70 has slipped below its signal line at 83.83, while being in the overbought zone. All these signs point to a possible pullback and the resumption of the downtrend.

The downtrend in question is this year. Bitcoin opened 2026 near $87,650 and trades 9.8% lower today.

Bitcoin Is Still Down In 2026
Bitcoin Is Still Down In 2026: BeInCrypto

Momentum shows the crowd’s energy, not who is paying for it.

The Money Behind the Last Breakout Has Switched Sides

The August 19 breakout ran on bears getting squeezed. Shorts lost $2.74 billion in a day against $256.66 million in longs.

That fuel is spent. Over 24 hours Bitcoin liquidations flipped, longs losing $310.03 million against $60.77 million in shorts. BTC alone lost $133.73 million, over a third of the market total.

Crypto Liquidation Heatmap
Crypto Liquidation Heatmap: Coinglass

The crowd has not stepped back despite this flush. Bitcoin open interest, the total value of active futures bets, sits near $25.35 billion against the month’s $25.7 billion high.

The BTC funding rate, a fee paid between traders in perpetual futures, reads 0.000091%. Positive readings mean bulls are still paying to hold.

Advertisement
Bitcoin Funding Rate And Open Interest
Bitcoin Funding Rate And Open Interest: Santiment

A rally with no shorts to squeeze needs real buyers, and the coins held above decide if it finds them.

A Supply Wall Sits Where the Rally Would Stall

Glassnode’s UTXO Realized Price Distribution (URPD), a metric mapping the price at which each circulating coin last moved, shows where those owners bought.

The way up is clear at first. The $82,045 bucket holds 83,800 BTC, or 0.42% of supply, so few sellers wait there.

Thin Supply
Bitcoin URPD Thin Supply: Glassnode

Then the wall arrives. The $84,569 bucket holds roughly 549,200 BTC with the $83,300 band standing first. Both these buckets cover nearly 5% of supply.

URPD Supply Wall: Glassnode
Bitcoin URPD Supply Wall: Glassnode

Those owners sit near break even, so many may sell into strength. However, seven days of Bitcoin ETF inflows would have to absorb them. Regardless of the buying and selling, the BTC chart marks where that trap would spring.

How High Can Bitcoin Price Go?

Bitcoin price trades near $79,054 after peaking at $81,343 on August 25. The run and tight pause form a bullish pole and flag, a pattern where a rally rests before another push.

A 12 hour close above the 0.382 Fibonacci level at $80,070 breaks the flag. Clearing $81,343 and the 0.618 level at $81,449 confirms a fresh high.

Advertisement
Bitcoin Price Analysis
Bitcoin Price Analysis: TradingView

Above that, $82,430 opens the way to $83,681 (the $83,000 zone), the extension landing inside the 5% supply wall highlighted earlier. Buyers chasing that far meet sellers with no shorts left beneath them.

Underneath, the 100 period Exponential Moving Average (EMA), a trend line weighted to recent prices, at $67,367 is closing on the 200 period EMA at $67,666. That crossover favors buyers.

The flag has not broken yet, so BTC support levels matter while it holds. A drop under $77,837 weakens the structure, and $75,545 damages it badly. A 12 hour close above $80,070 separates a run at $83,681 from a slide back toward $75,545.

Analyst’s View: The bearish case has an expiry date. Push above May’s high near $82,041 and the lower high disappears, and the divergence goes with it. That leaves a narrow band where the bears are already wrong and the buyers have not yet met the sellers above, the most awkward place this Bitcoin price rally could end.

The post Bitcoin Breakout Could Hit $83,000 After 22% Rally, But 3 Risks Remain appeared first on BeInCrypto.

Advertisement

Source link

Continue Reading

Crypto World

Revolut Launches EURR Euro Stablecoin in Europe

Published

on

Revolut Launches EURR Euro Stablecoin in Europe

[Update Aug. 26, 2026, 8:57 UTC: Added comments from a Revolut spokesperson.]
Revolut has begun rolling out its first stablecoin, a euro-pegged token called EURR, to selected customers in Denmark, Poland and Portugal. 

In an announcement shared with Cointelegraph on Wednesday, the company said that the phased rollout will expand to other European Economic Area (EEA) markets later this year, subject to product, operational and regulatory readiness. 

EURR is issued by Bridge Building S.A., the Luxembourg-based entity of Stripe-owned stablecoin infrastructure company Bridge. Revolut said EURR will be integrated into its retail app, with plans to support multiple blockchain networks and transfers to external wallets. 

The launch adds a Markets in Crypto-Assets (MiCA)-compliant stablecoin to Revolut as it withdraws Tether’s USDt from the EEA and Switzerland. Revolut previously said remaining USDT balances would be converted into customers’ base currencies after Aug. 31.

Advertisement

“Denmark, Poland, and Portugal were selected for their market size, where approximately 2 million customers will be involved in the initial rollout,” a Revolut spokesperson told Cointelegraph.

EURR will initially launch on Ethereum as part of the phased rollout. “External wallet transfers will be available immediately for select customers and more broadly as liquidity builds,” the spokesperson said. Revolut’s standard crypto trading and remittance limits will apply, while fiat transactions will carry no fees or spreads.

EURR is designed to maintain a value of one euro and is backed by reserves held and managed by Bridge in accordance with the European Union’s MiCA rules. Revolut Digital Assets Europe is offering the token. 

Revolut said EURR is the first step in a broader stablecoin strategy and that it is developing tokens denominated in other currencies through separate regulatory pathways. The company did not identify which currencies it is pursuing. 

Advertisement

Related: Revolut receives in-principle approval from UAE authorities for crypto services

Cointelegraph is committed to independent, transparent journalism. This news article is produced in accordance with Cointelegraph’s Editorial Policy and aims to provide accurate and timely information. Readers are encouraged to verify information independently.

Source link

Continue Reading

Crypto World

Japan targets early 2030s launch for blockchain-based stock and bond settlement system

Published

on

Japan targets early 2030s launch for blockchain-based stock and bond settlement system


Japan’s regulators are racing to modernize national settlement systems to prevent institutional investors and foreign capital from fleeing to overseas markets.

Source link

Continue Reading

Crypto World

Bitcoin (BTC) Rejected at $80K, Ripple’s XRP Plunges Hard as Rally Cools: Market Watch

Published

on

Bitcoin’s rally that began a week ago culminated yesterday with a surge to over $81,000 for the first time since May, when the asset was halted and driven south by a few grand.

Most larger-cap alts followed a similar trajectory, with XRP slumping by over 4%, while ZEC dumped by more than 7% after the debut of Grayscale’s ETF.

BTC Stopped at $81K

The primary cryptocurrency exploded out of the gate last Wednesday. It stood below $65,000 for weeks before the bulls took over. At first, they pushed it to $70,000 within hours. After a brief retracement, BTC skyrocketed again and surged to almost $80,000 on Friday to mark a three-month peak.

This meant that it had gained over $15,000 in less than 48 hours. As such, it was almost inevitable to correct before the bulls could step on the gas pedal once again. This took place during the weekend when BTC slipped to $75,000. The next leg up started on Monday and culminated on Tuesday.

Advertisement

As reported yesterday, bitcoin surged past $81,000 for the first time in 15 weeks amid these macro factors. However, it couldn’t keep climbing and has dropped by roughly $3,000 since that local peak.

Nevertheless, it remains up by more than 22% on a weekly scale, while its market dominance sits inches below 58% and its market cap is at $1.575 trillion on CG.

BTCUSD August 26. Source: TradingView

XRP, SOL, DOGE Rejected

Ethereum failed at $2,500 once again and is now down to $2,450 after a 1.3% daily decline. BNB is below $700 once again, while Ripple’s XRP was rejected at $1.50 and now trades at $1.42 after a major 4.5% daily decline. SOL touched $100 yesterday, but it’s well below that level now.

Even more painful declines come from DOGE (-5%), ADA (-5%), XLM (-5%), and CC (-6%). ZEC has dropped the most from the larger-cap alts despite Grayscale’s ETF launch, and is under $790 now.

In contrast, RAIN has skyrocketed by more than 20% and now trades above $0.0175.

Advertisement

The total crypto market cap has declined by around $60 billion in a day and is down to $2.740 trillion on CG.

Cryptocurrency Market Overview August 26. Source: QuantifyCrypto

The post Bitcoin (BTC) Rejected at $80K, Ripple’s XRP Plunges Hard as Rally Cools: Market Watch appeared first on CryptoPotato.

Source link

Continue Reading

Crypto World

Wall Street Raised Coinbase and Strategy (MSTR) Targets. Only One Leaves Real Upside

Published

on

COIN and MSTR Stock Performance.

Two Wall Street banks lifted their crypto stock targets on Tuesday. Goldman Sachs raised its figure on Coinbase (COIN) stock, while Canaccord Genuity did the same for Strategy (MSTR). Both kept Buy ratings.

The calls followed a run of steep gains across crypto-linked equities. Both stocks pushed higher as a broader market rally picked up speed last week.

Goldman Points to Derivatives and Prediction Markets

The bank lifted the COIN price target to $196 from $173. This works out to a roughly 13% increase. Goldman framed the case around two separate drivers rather than one.

“Buy-rated COIN offers upside optionality from any persistent improvement in the crypto backdrop, and continues to see strong idiosyncratic growth in newer businesses (including derivatives and prediction markets),” the bank said.

The stock closed at $187.16 on Tuesday, up 4.28%. This leaves the new target only about 5% above COIN’s current trading price. Goldman had carried a $235 target on COIN back in March before trimming it.

Advertisement

Follow us on X to get the latest news as it happens

MicroStrategy Stock Target Jumps 35%

Canaccord Genuity made a similar move on Strategy (MSTR) the same day, raising its target to $175 from $130. The $175 target sits roughly 38% above Tuesday’s close of $126.83.

“Like a breath of fresh air, the setup for MSTR has materially brightened over the last couple of weeks, in our view,” the bank noted.

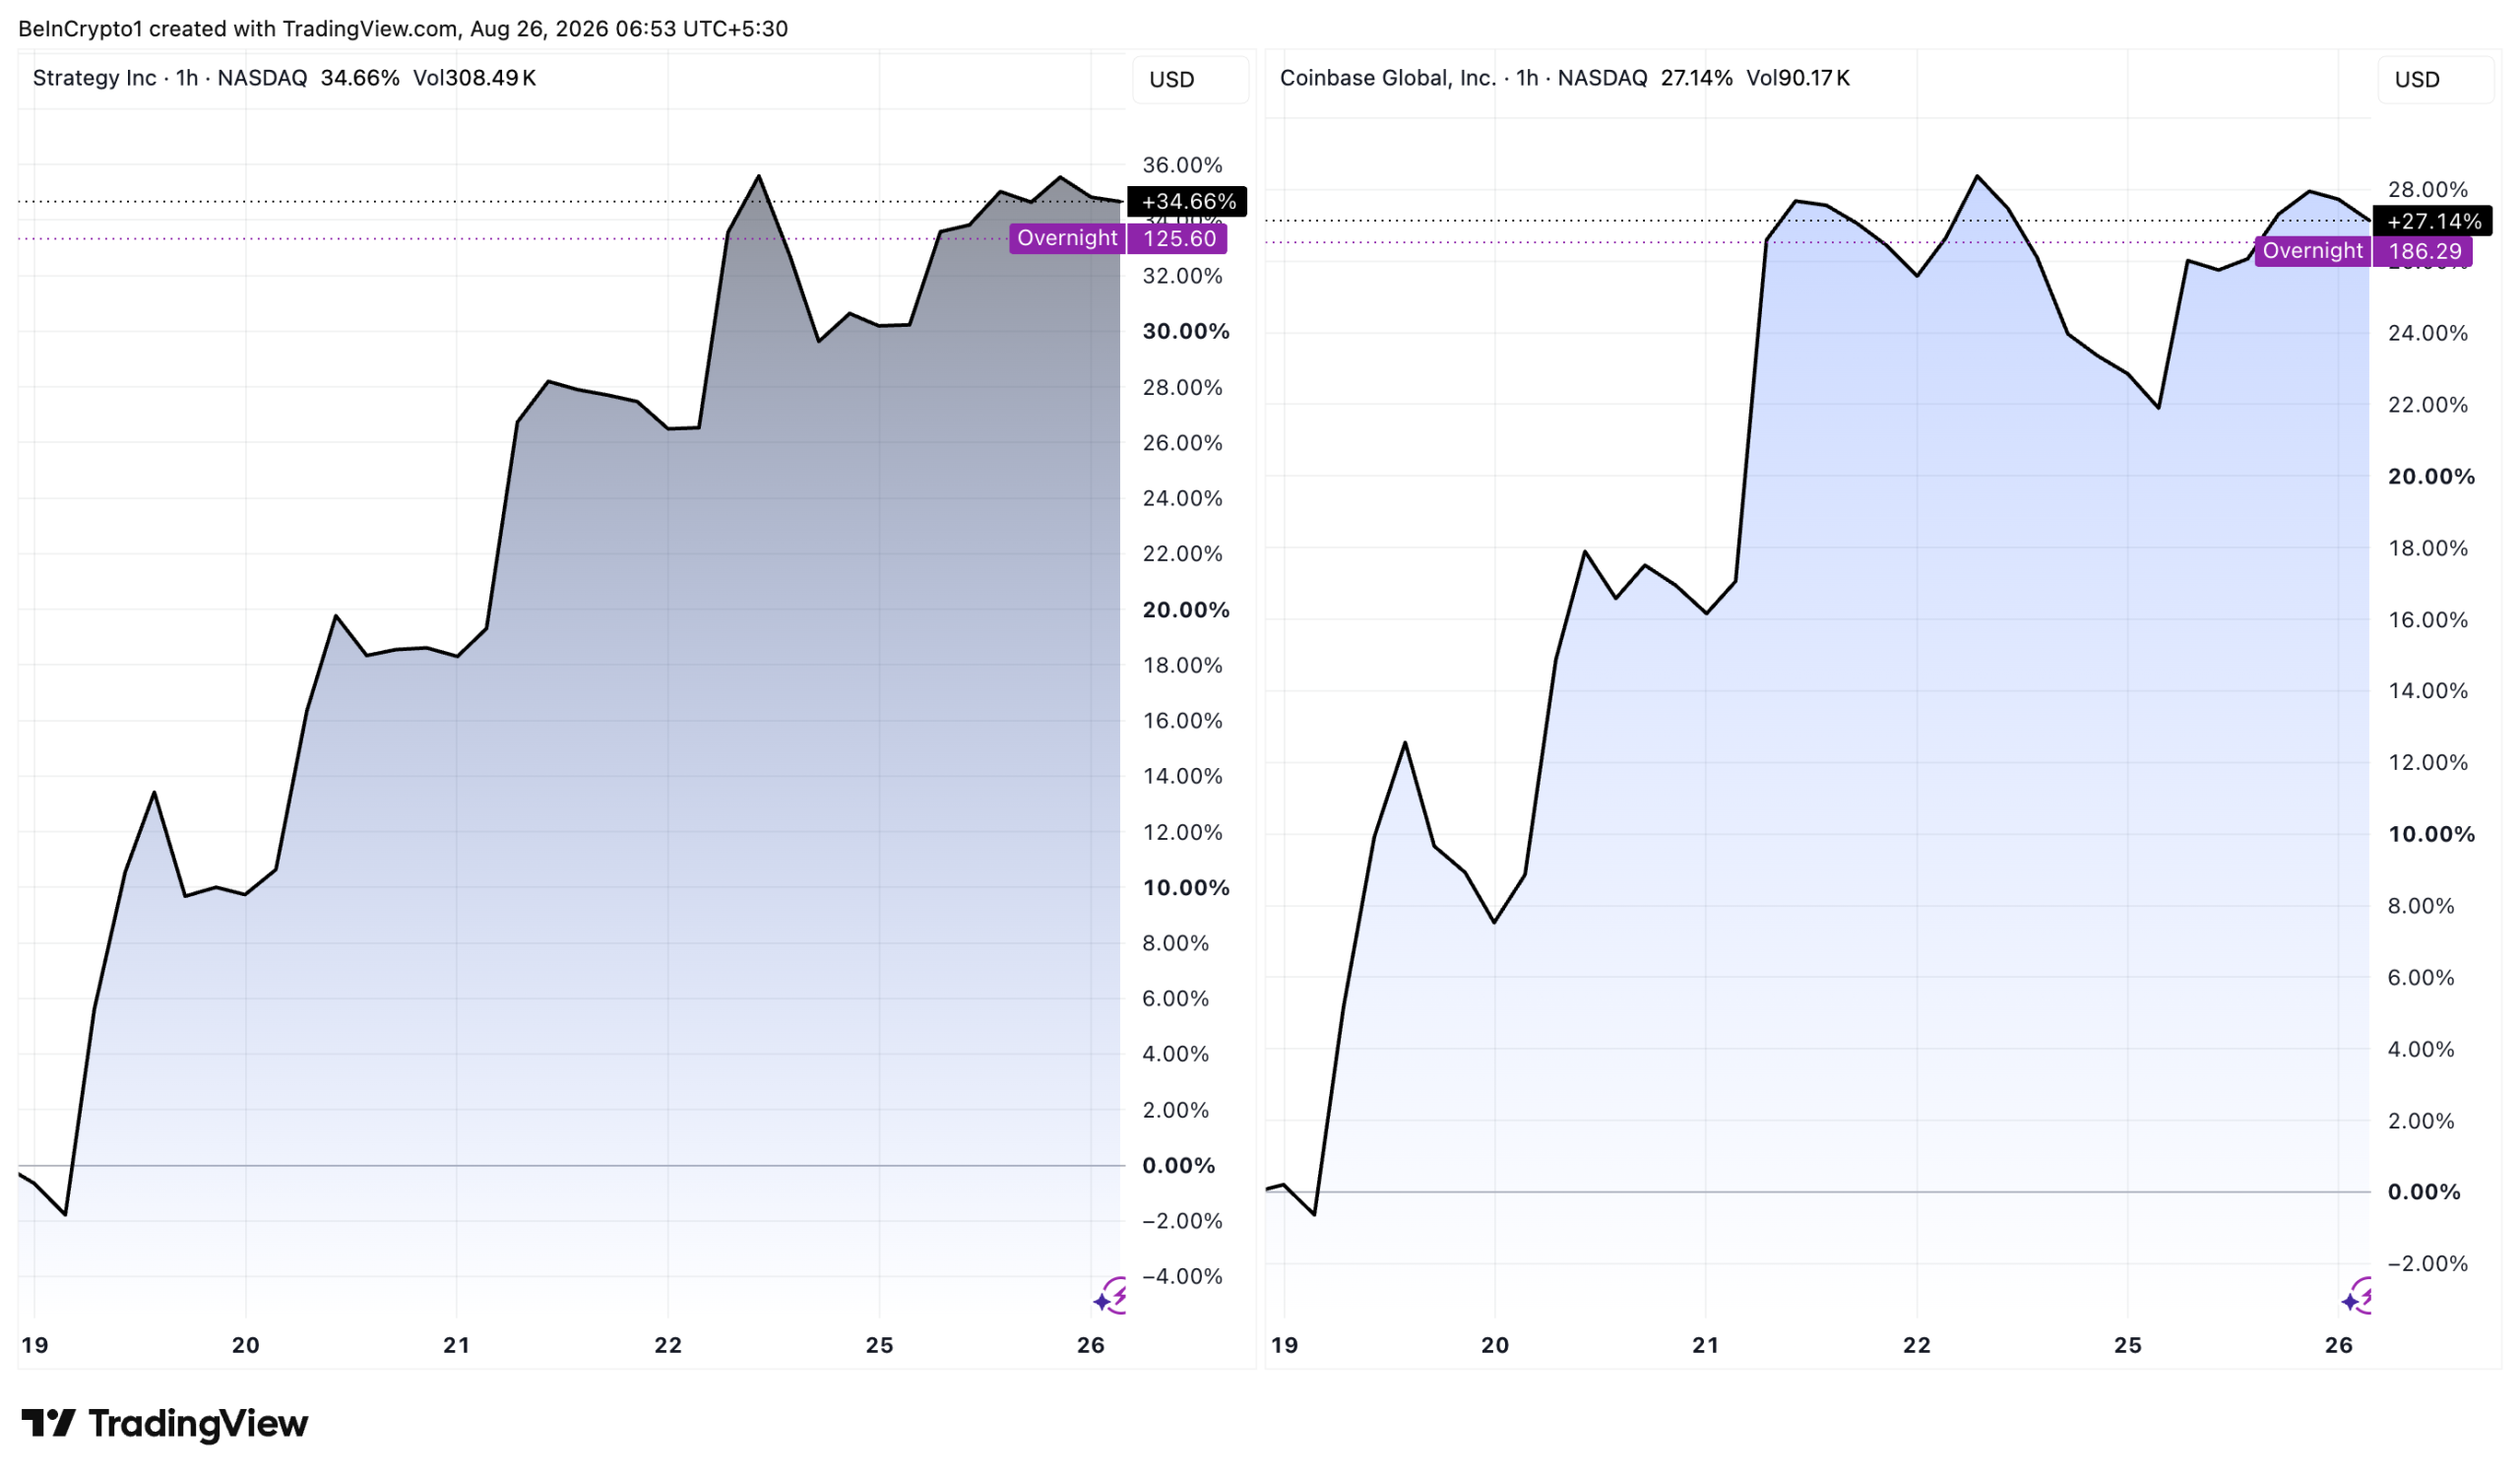
Price action supports the shift in tone. MSTR has gained 34.66% since August 19, while COIN has added 27.14% over the same stretch, according to TradingView data.

COIN and MSTR Stock Performance.
COIN and MSTR Stock Performance. Source: TradingView

The target revision marks a turn in direction, though not a full recovery. Sentiment soured through the summer. Analysts across Wall Street cut their COIN targets on July 31 after a third straight earnings miss.

Both targets now imply further upside from Tuesday’s closes. Whether analysts keep raising them may depend on whether last week’s move extends into September.

Advertisement

Subscribe to our YouTube channel to watch leaders and journalists provide expert insights

The post Wall Street Raised Coinbase and Strategy (MSTR) Targets. Only One Leaves Real Upside appeared first on BeInCrypto.

Source link

Advertisement
Continue Reading

Crypto World

Why the Trump Administration Is Purging ‘Woke’ Art From U.S. Embassies

Published

on

Why the Trump Administration Is Purging ‘Woke’ Art From U.S. Embassies

For “Young Artists After Siamesas 1960,” Wiley collaborated with students from the Facultad de Artes and the Altos de Chavon School of Design, both prominent art schools in the Dominican Republic. The subjects in the painting were modeled by four local art students. The work drew inspiration from two Dominican art works, Celeste Woss y Gil’s 1940 painting “Desnudo Feminine” and Gilberto Hernández Ortega’s 1960 work “Siamesas.”

The painting was part of the embassy’s permanent exhibition, assembled through the State Department’s Art in Embassies program. Established in 1963, the program is aimed at fostering cross-cultural dialogue and diplomacy through art. In 2015, the State Department awarded Wiley its Medal of Arts in recognition of his contributions to the program.

But in recent years, Wiley faced criticism from conservative commentators over his 2012 painting “Judith and Holofernes.” The painting portrays a Black woman holding the severed head of a white woman, which Wiley later described as a play on the “kill whitey thing.” The work, currently on view at the North Carolina Museum of Art in Raleigh, reimagines a 17th century painting by Giovanni Baglione that depicts the biblical story of Judith beheading an invading general to save her town.

Source link

Advertisement
Continue Reading

Crypto World

Summer Is Ending With a ‘Blood Moon’ Lunar Eclipse. Here’s What To Know.

Published

on

Summer Is Ending With a 'Blood Moon' Lunar Eclipse. Here's What To Know.

It’s not often that 3.6 billion people—or 44.4% of the world’s population—look at the same thing at the same time. And it’s not often that something comes along that’s worth the attention of all those billions. But that will happen on the evening of Aug. 27 when much of the world will be able to witness a blood moon lunar eclipse, during which 96% of the face of the full moon will fall into Earth’s shadow, glowing a deep orange-red in the process.

Lunar eclipses occur during a full moon, when the Earth is positioned between the sun and the moon, blocking all or most of the solar light that otherwise bathes the lunar surface. On average, lunar eclipses occur two to three times per year, though total lunar eclipses, when the moon is entirely shadowed, make up only 29% of those events. The autumnal color the moon takes on is due to a trick of the Earth’s atmosphere. Not all of the sunlight that would otherwise be striking the moon during an eclipse is blocked by the Earth; some of it leaks around the periphery of the planet and manages to reach the moon. That light streams through the Earth’s atmosphere during its passage to the moon, and some of the wavelengths of visible light—particularly the blue—are absorbed and scattered. What’s left is principally the red spectrum which partially lights the moon. All total lunar eclipses result in blood moons. 

In theory, a lunar eclipse ought to occur once a month. On every orbit around the Earth on its 27.3-day journey, after all, the moon will always pass through a point at which the planet sits between it and the sun. But the plane of the moon’s orbit around the Earth is tilted about five degrees compared to the Earth’s orbit around the sun. That means that on some passages behind the Earth the moon avoids the shadow, soaring above or ducking below the planet. 

How long will the lunar eclipse last?

Advertisement

An eclipse of the moon plays out slowly. The one that will begin on the evening of Aug. 27 and continue into the early hours of Aug. 28 will last a total of five hours and 38 minutes. Even the most dedicated eclipse chaser, however, may not be able to take it all in. Depending on where in the world an observer is—and this eclipse will be visible in Europe, Africa, North and South America, and western Asia—the moon may set before the eclipse is done or rise after it’s already begun. That will be the case in the Americas, where observers will see an eclipsed moon come up in the skies. Finding a flat area with few buildings and a clean sight line may be necessary to witness the eclipse, since in many places the moon will be low in the sky, close to the horizon. In the U.S., the eclipse will begin at 9:23 p.m. ET on Aug. 27, and end at 3:01 ET the next day.

There are three phases of any lunar eclipse—the penumbral, partial, and total or maximum. The penumbral phase occurs first, when the moon moves into the faint, outer reaches of the Earth’s umbra, or shadow. The partial phase comes next, when the true, darker shadow of the Earth begins to cover the lunar disk. The total or maximum phase is when only a small portion—or none at all—of the moon remains unshadowed. For the upcoming eclipse, the penumbral phase will take one hour and ten minutes, the partial phase one hour and 39 minutes, and the maximum phase, when the moon will be 96% obscured, will also take one hour and 39 minutes. That maximum shadow will occur at 12:12 a.m. ET. The eclipse will then return to the partial and penumbral phases before the moon soars on and leaves the Earth’s shadow behind.

What is an ‘eclipse season’?

This eclipse occurs in a busy time for the skies. On Aug. 12, just over two weeks before the lunar eclipse is set to occur, there was a total eclipse of the sun, visible in Spain, Portugal, Iceland, Greenland, and Siberia. There is actually such a thing as an eclipse season, a month-long stretch occurring twice a year—in the summer and winter—when the moon passes the point in its five-degree orbit that the Earth, moon, and sun align in a way to make both types of eclipses possible.

If you fancy eclipses, you’re well advised to take this one in while you can. The next total lunar eclipse will not be until Dec. 31, 2027 to Jan. 1, 2028. New Years Eve fireworks will be going off that night, but they will be nothing compared to the sky show the Earth, the sun, and the moon will serve up.

Advertisement

Source link

Continue Reading

Crypto World

Pi holds above $0.085 support as crypto market recovery loses momentum

Published

on

Pi holds above $0.085 support as crypto market recovery loses momentum

Key takeaways

  • Pi Network trades around $0.0900 on Wednesday, maintaining mild upside momentum above the critical $0.0853 support.
  • The broader cryptocurrency market is retreating as investors take profits following last week’s double-digit gains.
  • A break above $0.1022 could open the path toward $0.1204.

Pi Network is showing modest upside movement on Wednesday, with PI trading around $0.0900 and remaining above an important technical support level.

However, the broader cryptocurrency market’s recovery is losing momentum as investors lock in profits following last week’s sharp gains. PI’s technical indicators also remain mixed, reflecting a lack of decisive buying pressure.

Profit-taking slows the crypto market rally

The broader cryptocurrency market is edging lower this week after several major assets recorded double-digit gains during the previous week.

CoinGlass data shows that approximately $373 million in leveraged positions was liquidated over the past 24 hours. Long positions accounted for $310 million of that total, indicating that the latest pullback caught bullish traders off guard.

Advertisement

The elevated long liquidations suggest renewed selling pressure as investors reduce risk and take profits from the recent rally.

Despite the pullback, overall market sentiment remains strongly positive. CoinMarketCap’s Crypto Fear and Greed Index stood at 80 on Wednesday, placing the market firmly within the “extreme greed” zone.

The reading indicates that bullish sentiment persists even as traders assess whether the current decline is a temporary correction or the beginning of a broader reversal.

Pi Network holds above the $0.0853 support

Pi Network trades near $0.0900 at the time of writing, maintaining a neutral short-term outlook.

Advertisement

The token remains above the 23.6% Fibonacci retracement level at $0.0853. This level is calculated from PI’s decline between the $0.1341 high and the $0.0703 swing low.

As long as PI holds above $0.0853, buyers may retain an opportunity to extend the recovery. However, the token needs stronger momentum to overcome the resistance levels above its current price.

The 50% Fibonacci retracement level at $0.1022 represents the next major barrier for Pi Network.

This level rejected PI’s recovery attempt in mid-July, reinforcing its importance as a potential supply zone. A decisive daily close above $0.1022 could strengthen the bullish outlook and extend the advance toward the 78.6% Fibonacci retracement at $0.1204.

Advertisement

Such a breakout would also move PI above the psychologically important $0.1000 threshold, potentially attracting additional buying interest.

Pi Network’s momentum indicators show signs of stabilization but do not yet confirm a strong bullish trend.

The Moving Average Convergence Divergence indicator remains marginally above its signal line on the daily chart. This position points to a slight bullish bias, although the narrow separation between the lines reflects weak momentum.

Meanwhile, the Relative Strength Index stands near 51. The neutral reading suggests that buyers and sellers remain relatively balanced, leaving PI vulnerable to broader market movements.

Advertisement

PI/USD 4H Chart

The $0.0853 Fibonacci level remains the immediate support to monitor. A confirmed daily close below this level could invalidate PI’s near-term recovery outlook and increase selling pressure. In that scenario, the token could revisit the $0.0703 swing low.

Conversely, continued consolidation above $0.0853 would preserve the possibility of another attempt to break the $0.1022 resistance.

Advertisement

Source link

Continue Reading

Trending

Copyright © 2025